Encantada Ranchito El Calaboz, TX Map & Demographics
Encantada Ranchito El Calaboz Map
Encantada Ranchito El Calaboz Overview
$17,997
PER CAPITA INCOME
$44,039
AVG FAMILY INCOME
$43,177
AVG HOUSEHOLD INCOME
14.4%
WAGE / INCOME GAP [ % ]
85.6¢/ $1
WAGE / INCOME GAP [ $ ]
0.30
INEQUALITY / GINI INDEX
2,063
TOTAL POPULATION
886
MALE POPULATION
1,177
FEMALE POPULATION
75.28
MALES / 100 FEMALES
132.84
FEMALES / 100 MALES
45.6
MEDIAN AGE
3.2
AVG FAMILY SIZE
2.6
AVG HOUSEHOLD SIZE
872
LABOR FORCE [ PEOPLE ]
54.2%
PERCENT IN LABOR FORCE
Income in Encantada Ranchito El Calaboz
Income Overview in Encantada Ranchito El Calaboz
Per Capita Income in Encantada Ranchito El Calaboz is $17,997, while median incomes of families and households are $44,039 and $43,177 respectively.
| Characteristic | Number | Measure |
| Per Capita Income | 2,063 | $17,997 |
| Median Family Income | 572 | $44,039 |
| Mean Family Income | 572 | $51,607 |
| Median Household Income | 806 | $43,177 |
| Mean Household Income | 806 | $45,792 |
| Income Deficit | 572 | $0 |
| Wage / Income Gap (%) | 2,063 | 14.41% |
| Wage / Income Gap ($) | 2,063 | 85.59¢ per $1 |
| Gini / Inequality Index | 2,063 | 0.30 |
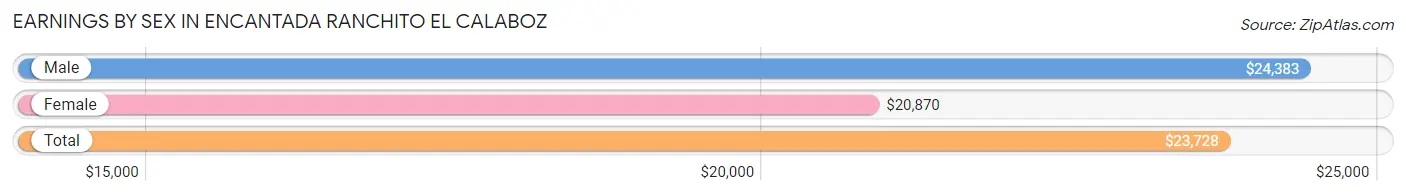
Earnings by Sex in Encantada Ranchito El Calaboz
Average Earnings in Encantada Ranchito El Calaboz are $23,728, $24,383 for men and $20,870 for women, a difference of 14.4%.
| Sex | Number | Average Earnings |
| Male | 487 (52.0%) | $24,383 |
| Female | 450 (48.0%) | $20,870 |
| Total | 937 (100.0%) | $23,728 |
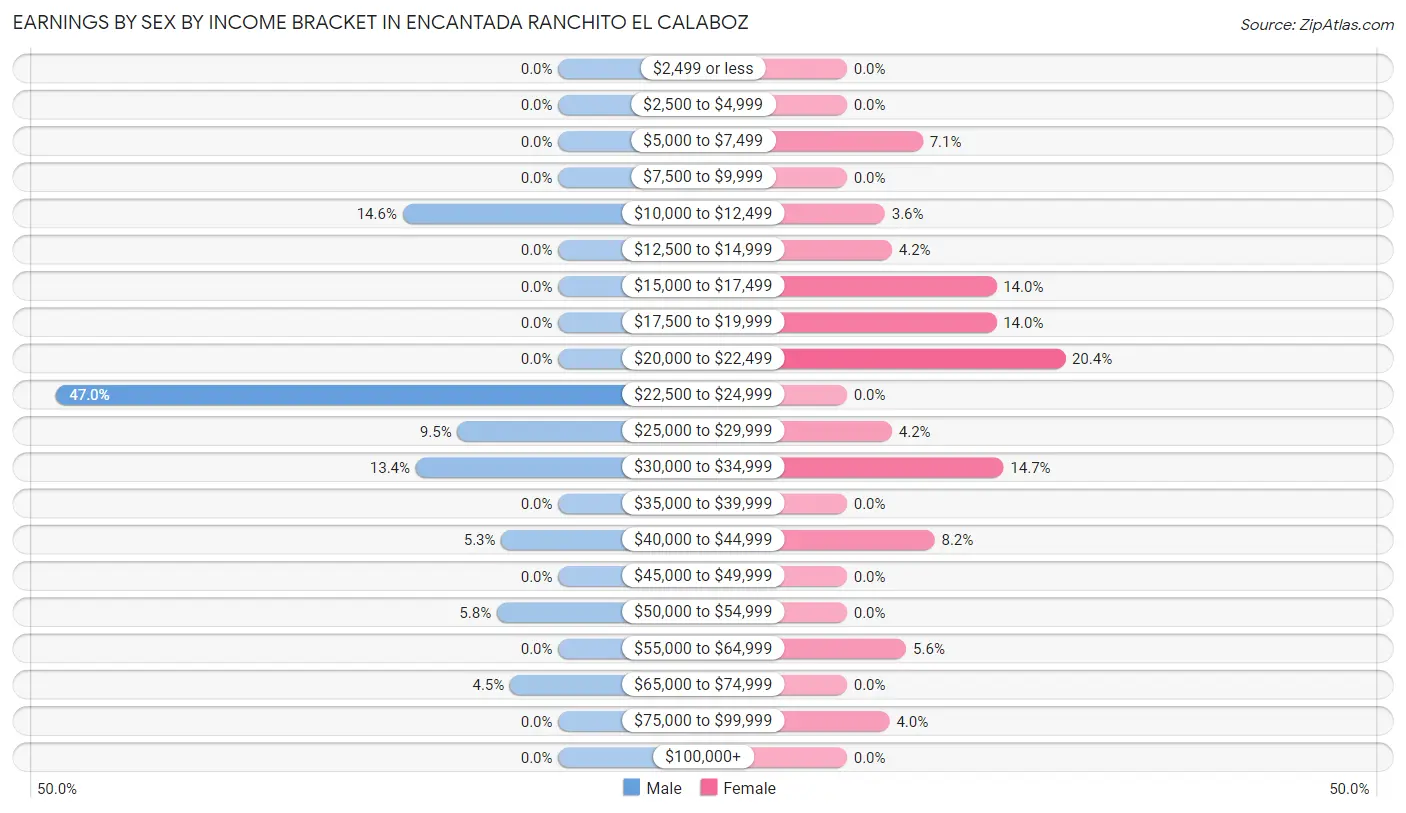
Earnings by Sex by Income Bracket in Encantada Ranchito El Calaboz
The most common earnings brackets in Encantada Ranchito El Calaboz are $22,500 to $24,999 for men (229 | 47.0%) and $20,000 to $22,499 for women (92 | 20.4%).
| Income | Male | Female |
| $2,499 or less | 0 (0.0%) | 0 (0.0%) |
| $2,500 to $4,999 | 0 (0.0%) | 0 (0.0%) |
| $5,000 to $7,499 | 0 (0.0%) | 32 (7.1%) |
| $7,500 to $9,999 | 0 (0.0%) | 0 (0.0%) |
| $10,000 to $12,499 | 71 (14.6%) | 16 (3.6%) |
| $12,500 to $14,999 | 0 (0.0%) | 19 (4.2%) |
| $15,000 to $17,499 | 0 (0.0%) | 63 (14.0%) |
| $17,500 to $19,999 | 0 (0.0%) | 63 (14.0%) |
| $20,000 to $22,499 | 0 (0.0%) | 92 (20.4%) |
| $22,500 to $24,999 | 229 (47.0%) | 0 (0.0%) |
| $25,000 to $29,999 | 46 (9.5%) | 19 (4.2%) |
| $30,000 to $34,999 | 65 (13.4%) | 66 (14.7%) |
| $35,000 to $39,999 | 0 (0.0%) | 0 (0.0%) |
| $40,000 to $44,999 | 26 (5.3%) | 37 (8.2%) |
| $45,000 to $49,999 | 0 (0.0%) | 0 (0.0%) |
| $50,000 to $54,999 | 28 (5.8%) | 0 (0.0%) |
| $55,000 to $64,999 | 0 (0.0%) | 25 (5.6%) |
| $65,000 to $74,999 | 22 (4.5%) | 0 (0.0%) |
| $75,000 to $99,999 | 0 (0.0%) | 18 (4.0%) |
| $100,000+ | 0 (0.0%) | 0 (0.0%) |
| Total | 487 (100.0%) | 450 (100.0%) |
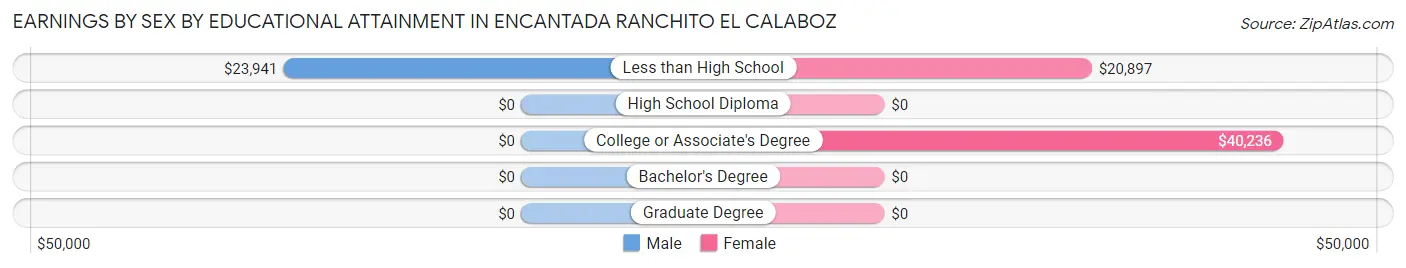
Earnings by Sex by Educational Attainment in Encantada Ranchito El Calaboz
Average earnings in Encantada Ranchito El Calaboz are $24,383 for men and $21,168 for women, a difference of 13.2%. Men with an educational attainment of less than high school enjoy the highest average annual earnings of $23,941, while those with less than high school education earn the least with $23,941. Women with an educational attainment of college or associate's degree earn the most with the average annual earnings of $40,236, while those with less than high school education have the smallest earnings of $20,897.
| Educational Attainment | Male Income | Female Income |
| Less than High School | $23,941 | $20,897 |
| High School Diploma | - | - |
| College or Associate's Degree | - | - |
| Bachelor's Degree | - | - |
| Graduate Degree | - | - |
| Total | $24,383 | $21,168 |
Family Income in Encantada Ranchito El Calaboz
Family Income Brackets in Encantada Ranchito El Calaboz
According to the Encantada Ranchito El Calaboz family income data, there are 277 families falling into the $35,000 to $49,999 income range, which is the most common income bracket and makes up 48.4% of all families.
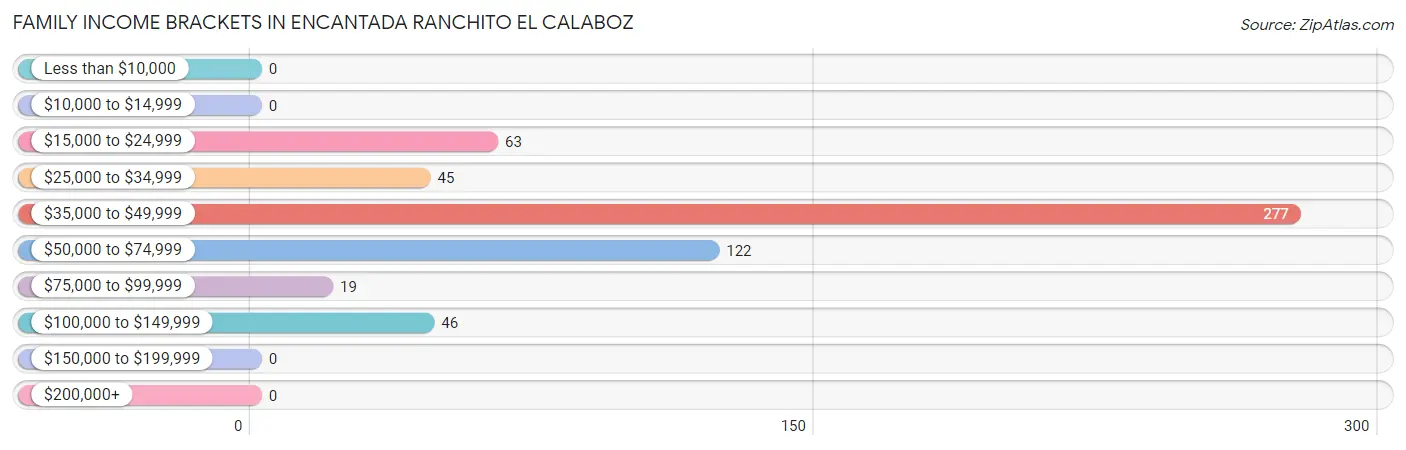
| Income Bracket | # Families | % Families |
| Less than $10,000 | 0 | 0.0% |
| $10,000 to $14,999 | 0 | 0.0% |
| $15,000 to $24,999 | 63 | 11.0% |
| $25,000 to $34,999 | 45 | 7.9% |
| $35,000 to $49,999 | 277 | 48.4% |
| $50,000 to $74,999 | 122 | 21.3% |
| $75,000 to $99,999 | 19 | 3.3% |
| $100,000 to $149,999 | 46 | 8.0% |
| $150,000 to $199,999 | 0 | 0.0% |
| $200,000+ | 0 | 0.0% |
Family Income by Famaliy Size in Encantada Ranchito El Calaboz
3-person families (94 | 16.4%) account for the highest median family income in Encantada Ranchito El Calaboz with $61,957 per family, while 2-person families (294 | 51.4%) have the highest median income of $22,008 per family member.
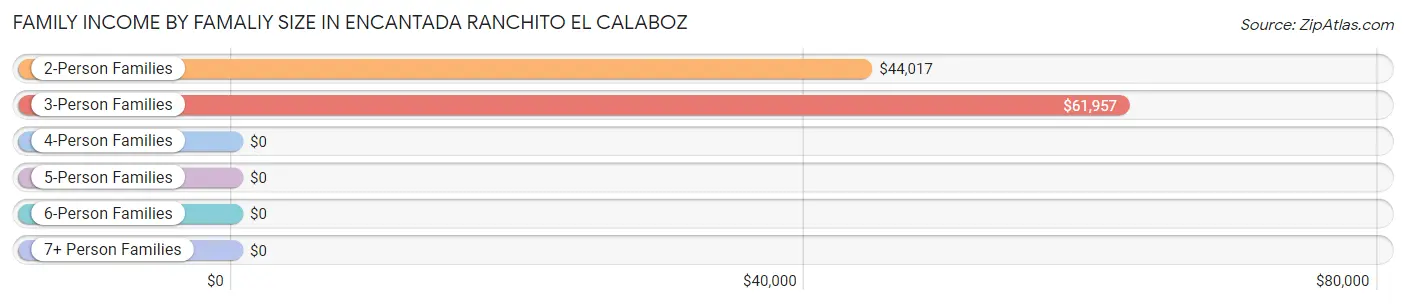
| Income Bracket | # Families | Median Income |
| 2-Person Families | 294 (51.4%) | $44,017 |
| 3-Person Families | 94 (16.4%) | $61,957 |
| 4-Person Families | 82 (14.3%) | $0 |
| 5-Person Families | 65 (11.4%) | $0 |
| 6-Person Families | 37 (6.5%) | $0 |
| 7+ Person Families | 0 (0.0%) | $0 |
| Total | 572 (100.0%) | $44,039 |
Family Income by Number of Earners in Encantada Ranchito El Calaboz
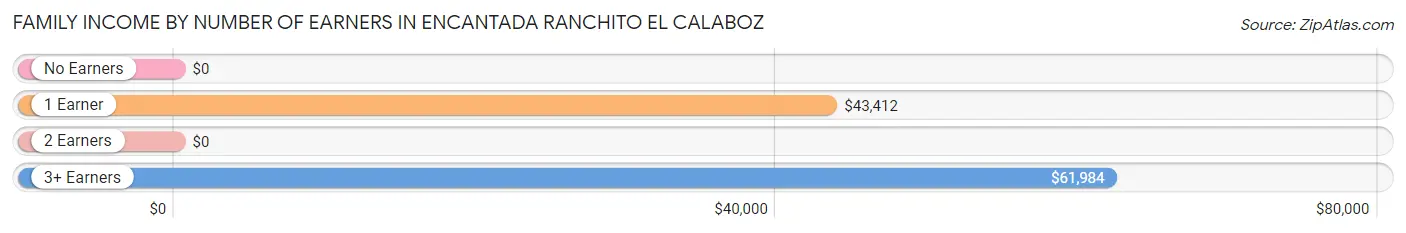
| Number of Earners | # Families | Median Income |
| No Earners | 8 (1.4%) | $0 |
| 1 Earner | 441 (77.1%) | $43,412 |
| 2 Earners | 28 (4.9%) | $0 |
| 3+ Earners | 95 (16.6%) | $61,984 |
| Total | 572 (100.0%) | $44,039 |
Household Income in Encantada Ranchito El Calaboz
Household Income Brackets in Encantada Ranchito El Calaboz
With 277 households falling in the category, the $35,000 to $49,999 income range is the most frequent in Encantada Ranchito El Calaboz, accounting for 34.4% of all households.
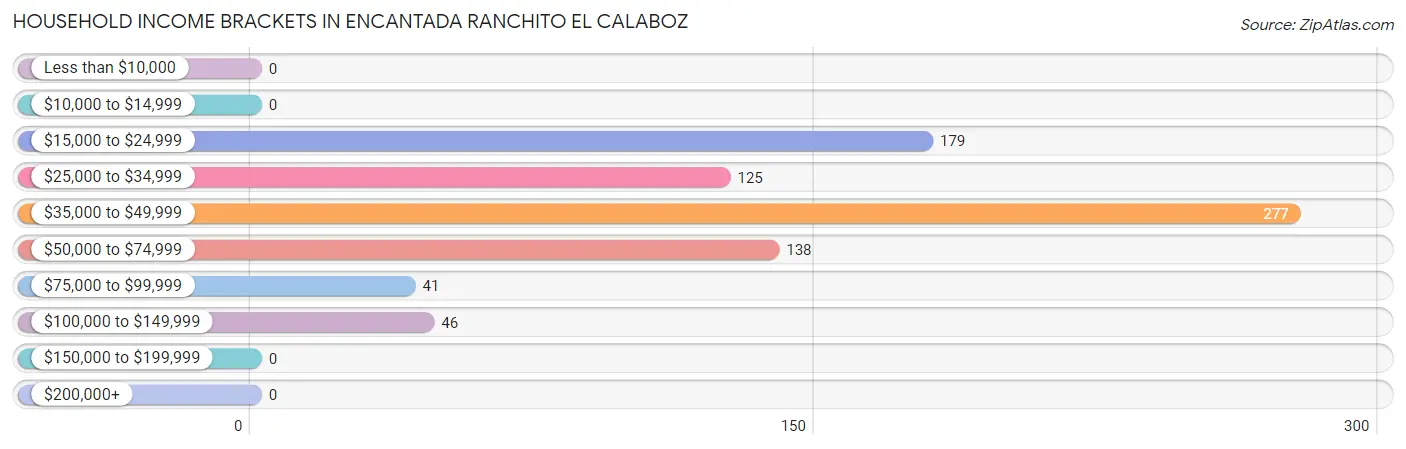
| Income Bracket | # Households | % Households |
| Less than $10,000 | 0 | 0.0% |
| $10,000 to $14,999 | 0 | 0.0% |
| $15,000 to $24,999 | 179 | 22.2% |
| $25,000 to $34,999 | 125 | 15.5% |
| $35,000 to $49,999 | 277 | 34.4% |
| $50,000 to $74,999 | 138 | 17.1% |
| $75,000 to $99,999 | 41 | 5.1% |
| $100,000 to $149,999 | 46 | 5.7% |
| $150,000 to $199,999 | 0 | 0.0% |
| $200,000+ | 0 | 0.0% |
Household Income by Householder Age in Encantada Ranchito El Calaboz
The median household income in Encantada Ranchito El Calaboz is $43,177, with the highest median household income of $43,204 found in the 65+ years age bracket for the primary householder. A total of 387 households (48.0%) fall into this category.
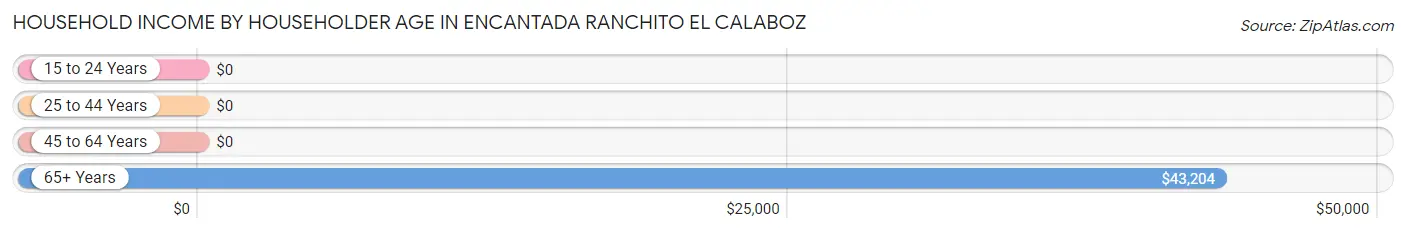
| Income Bracket | # Households | Median Income |
| 15 to 24 Years | 0 (0.0%) | $0 |
| 25 to 44 Years | 87 (10.8%) | $0 |
| 45 to 64 Years | 332 (41.2%) | $0 |
| 65+ Years | 387 (48.0%) | $43,204 |
| Total | 806 (100.0%) | $43,177 |
Poverty in Encantada Ranchito El Calaboz
Income Below Poverty by Sex and Age in Encantada Ranchito El Calaboz
With 16.5% poverty level for males and 34.7% for females among the residents of Encantada Ranchito El Calaboz, 16 and 17 year old males and 5 year old females are the most vulnerable to poverty, with 59 males (100.0%) and 46 females (100.0%) in their respective age groups living below the poverty level.
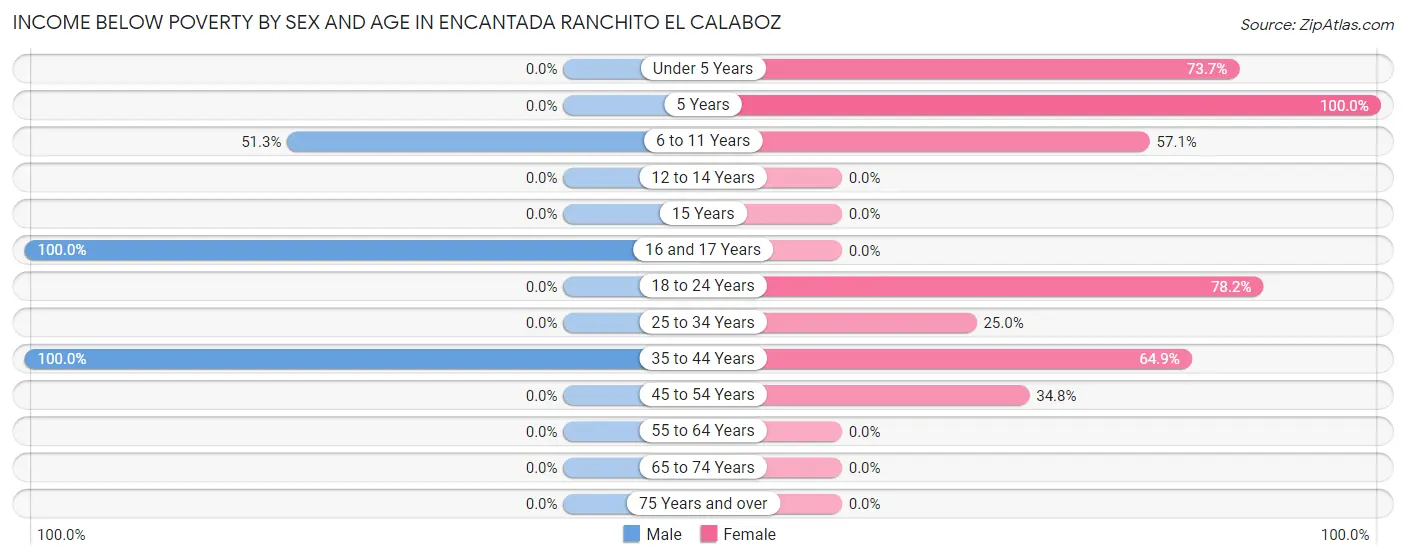
| Age Bracket | Male | Female |
| Under 5 Years | 0 (0.0%) | 73 (73.7%) |
| 5 Years | 0 (0.0%) | 46 (100.0%) |
| 6 to 11 Years | 41 (51.2%) | 92 (57.1%) |
| 12 to 14 Years | 0 (0.0%) | 0 (0.0%) |
| 15 Years | 0 (0.0%) | 0 (0.0%) |
| 16 and 17 Years | 59 (100.0%) | 0 (0.0%) |
| 18 to 24 Years | 0 (0.0%) | 79 (78.2%) |
| 25 to 34 Years | 0 (0.0%) | 19 (25.0%) |
| 35 to 44 Years | 46 (100.0%) | 37 (64.9%) |
| 45 to 54 Years | 0 (0.0%) | 63 (34.8%) |
| 55 to 64 Years | 0 (0.0%) | 0 (0.0%) |
| 65 to 74 Years | 0 (0.0%) | 0 (0.0%) |
| 75 Years and over | 0 (0.0%) | 0 (0.0%) |
| Total | 146 (16.5%) | 409 (34.7%) |
Income Above Poverty by Sex and Age in Encantada Ranchito El Calaboz
According to the poverty statistics in Encantada Ranchito El Calaboz, males aged under 5 years and females aged 15 years are the age groups that are most secure financially, with 100.0% of males and 100.0% of females in these age groups living above the poverty line.
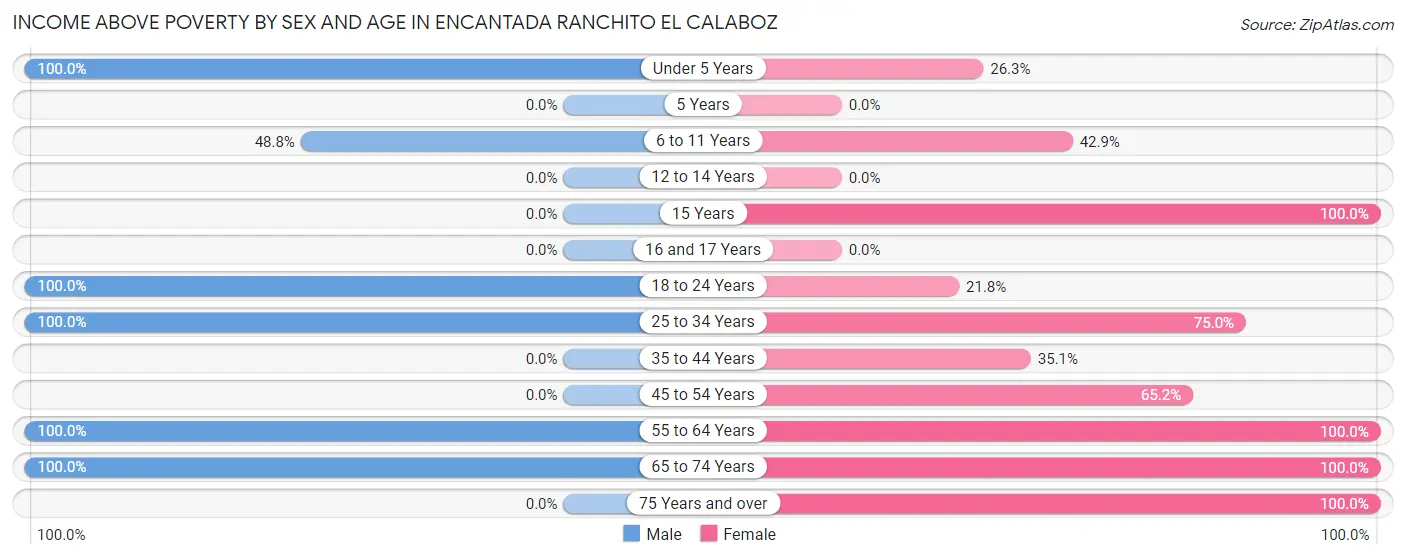
| Age Bracket | Male | Female |
| Under 5 Years | 29 (100.0%) | 26 (26.3%) |
| 5 Years | 0 (0.0%) | 0 (0.0%) |
| 6 to 11 Years | 39 (48.7%) | 69 (42.9%) |
| 12 to 14 Years | 0 (0.0%) | 0 (0.0%) |
| 15 Years | 0 (0.0%) | 39 (100.0%) |
| 16 and 17 Years | 0 (0.0%) | 0 (0.0%) |
| 18 to 24 Years | 41 (100.0%) | 22 (21.8%) |
| 25 to 34 Years | 136 (100.0%) | 57 (75.0%) |
| 35 to 44 Years | 0 (0.0%) | 20 (35.1%) |
| 45 to 54 Years | 0 (0.0%) | 118 (65.2%) |
| 55 to 64 Years | 137 (100.0%) | 164 (100.0%) |
| 65 to 74 Years | 358 (100.0%) | 205 (100.0%) |
| 75 Years and over | 0 (0.0%) | 48 (100.0%) |
| Total | 740 (83.5%) | 768 (65.2%) |
Income Below Poverty Among Married-Couple Families in Encantada Ranchito El Calaboz
The poverty statistics for married-couple families in Encantada Ranchito El Calaboz show that 8.5% or 37 of the total 435 families live below the poverty line. Families with 3 or 4 children have the highest poverty rate of 56.9%, comprising of 37 families. On the other hand, families with no children have the lowest poverty rate of 0.0%, which includes 0 families.
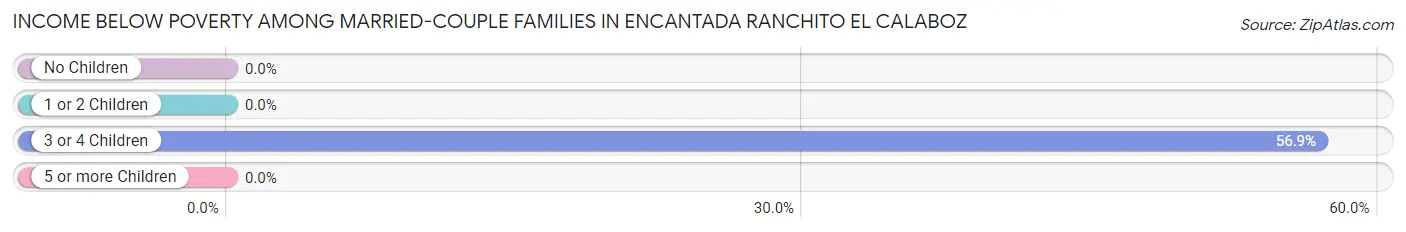
| Children | Above Poverty | Below Poverty |
| No Children | 370 (100.0%) | 0 (0.0%) |
| 1 or 2 Children | 0 (0.0%) | 0 (0.0%) |
| 3 or 4 Children | 28 (43.1%) | 37 (56.9%) |
| 5 or more Children | 0 (0.0%) | 0 (0.0%) |
| Total | 398 (91.5%) | 37 (8.5%) |
Income Below Poverty Among Single-Parent Households in Encantada Ranchito El Calaboz
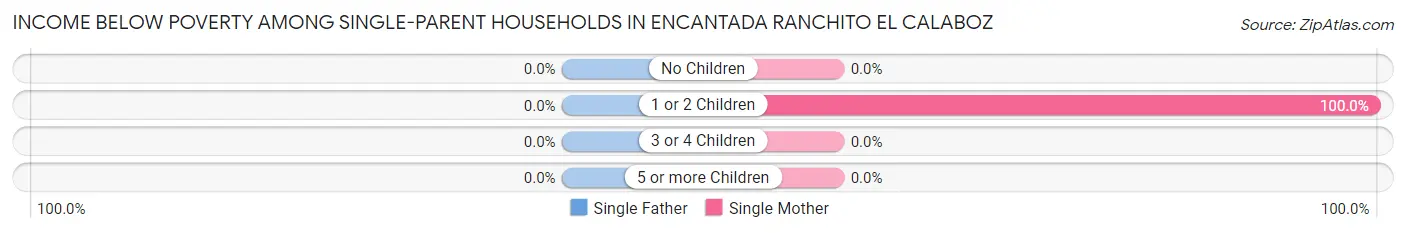
| Children | Single Father | Single Mother |
| No Children | 0 (0.0%) | 0 (0.0%) |
| 1 or 2 Children | 0 (0.0%) | 63 (100.0%) |
| 3 or 4 Children | 0 (0.0%) | 0 (0.0%) |
| 5 or more Children | 0 (0.0%) | 0 (0.0%) |
| Total | 0 (0.0%) | 63 (46.0%) |
Income Below Poverty Among Married-Couple vs Single-Parent Households in Encantada Ranchito El Calaboz
The poverty data for Encantada Ranchito El Calaboz shows that 37 of the married-couple family households (8.5%) and 63 of the single-parent households (46.0%) are living below the poverty level. Within the married-couple family households, those with 3 or 4 children have the highest poverty rate, with 37 households (56.9%) falling below the poverty line. Among the single-parent households, those with 1 or 2 children have the highest poverty rate, with 63 household (100.0%) living below poverty.
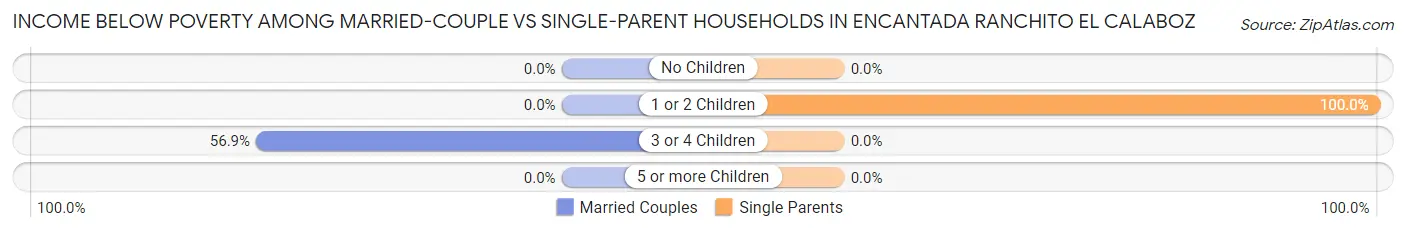
| Children | Married-Couple Families | Single-Parent Households |
| No Children | 0 (0.0%) | 0 (0.0%) |
| 1 or 2 Children | 0 (0.0%) | 63 (100.0%) |
| 3 or 4 Children | 37 (56.9%) | 0 (0.0%) |
| 5 or more Children | 0 (0.0%) | 0 (0.0%) |
| Total | 37 (8.5%) | 63 (46.0%) |
Race in Encantada Ranchito El Calaboz
The most populous races in Encantada Ranchito El Calaboz are Hispanic or Latino (1,984 | 96.2%), Two or more Races (1,303 | 63.2%), and White / Caucasian (676 | 32.8%).
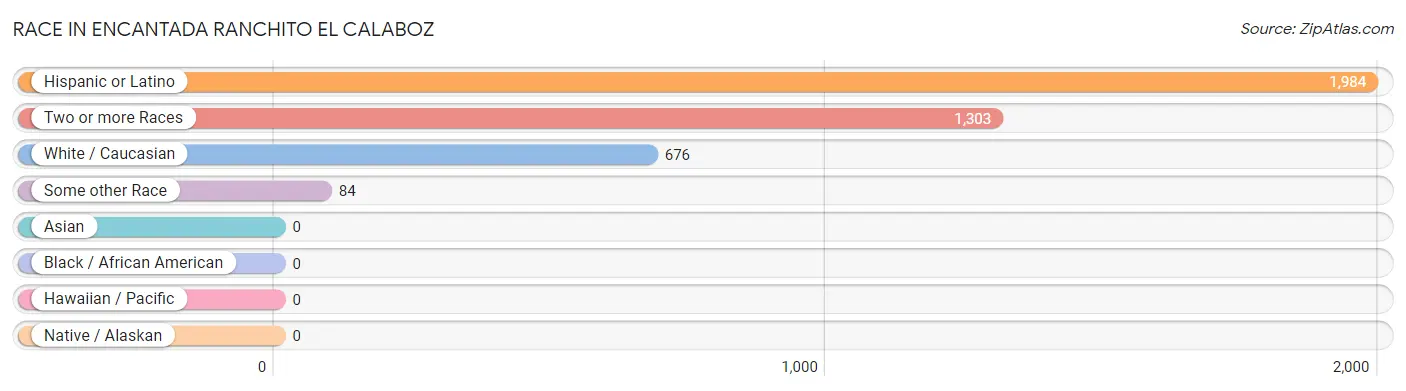
| Race | # Population | % Population |
| Asian | 0 | 0.0% |
| Black / African American | 0 | 0.0% |
| Hawaiian / Pacific | 0 | 0.0% |
| Hispanic or Latino | 1,984 | 96.2% |
| Native / Alaskan | 0 | 0.0% |
| White / Caucasian | 676 | 32.8% |
| Two or more Races | 1,303 | 63.2% |
| Some other Race | 84 | 4.1% |
| Total | 2,063 | 100.0% |
Ancestry in Encantada Ranchito El Calaboz
The most populous ancestries reported in Encantada Ranchito El Calaboz are Mexican (1,984 | 96.2%), English (107 | 5.2%), and Irish (16 | 0.8%), together accounting for 102.1% of all Encantada Ranchito El Calaboz residents.
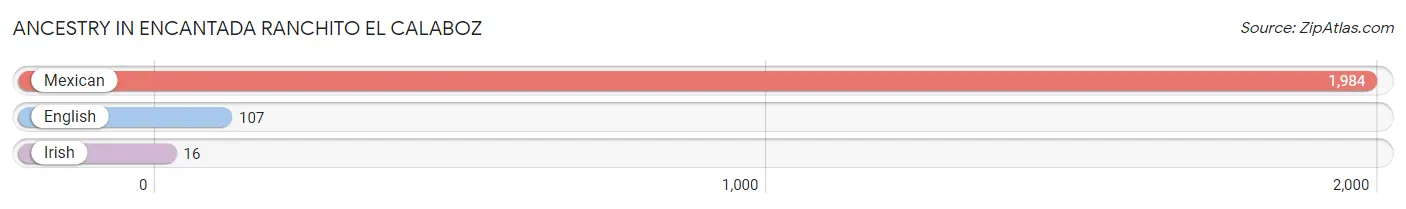
| Ancestry | # Population | % Population |
| English | 107 | 5.2% |
| Irish | 16 | 0.8% |
| Mexican | 1,984 | 96.2% | View All 3 Rows |
Immigrants in Encantada Ranchito El Calaboz
The most numerous immigrant groups reported in Encantada Ranchito El Calaboz came from Central America (1,022 | 49.5%), Latin America (1,022 | 49.5%), and Mexico (1,022 | 49.5%), together accounting for 148.6% of all Encantada Ranchito El Calaboz residents.
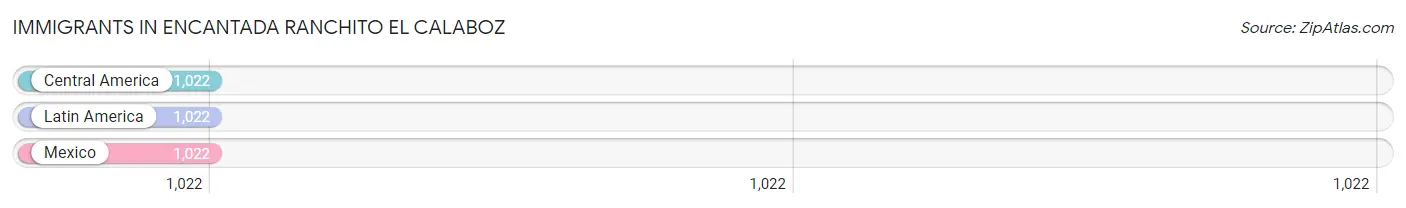
| Immigration Origin | # Population | % Population |
| Central America | 1,022 | 49.5% |
| Latin America | 1,022 | 49.5% |
| Mexico | 1,022 | 49.5% | View All 3 Rows |
Sex and Age in Encantada Ranchito El Calaboz
Sex and Age in Encantada Ranchito El Calaboz
The most populous age groups in Encantada Ranchito El Calaboz are 70 to 74 Years (229 | 25.9%) for men and 70 to 74 Years (205 | 17.4%) for women.
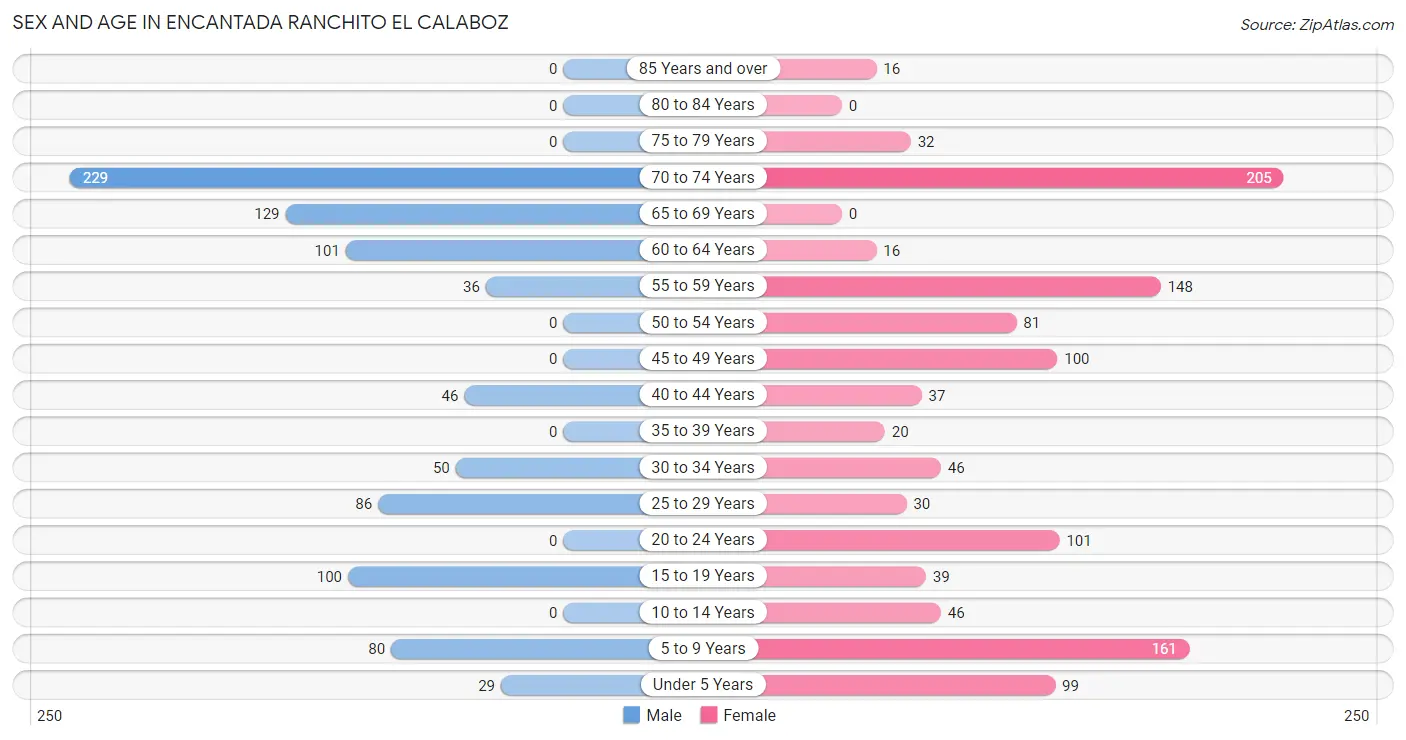
| Age Bracket | Male | Female |
| Under 5 Years | 29 (3.3%) | 99 (8.4%) |
| 5 to 9 Years | 80 (9.0%) | 161 (13.7%) |
| 10 to 14 Years | 0 (0.0%) | 46 (3.9%) |
| 15 to 19 Years | 100 (11.3%) | 39 (3.3%) |
| 20 to 24 Years | 0 (0.0%) | 101 (8.6%) |
| 25 to 29 Years | 86 (9.7%) | 30 (2.5%) |
| 30 to 34 Years | 50 (5.6%) | 46 (3.9%) |
| 35 to 39 Years | 0 (0.0%) | 20 (1.7%) |
| 40 to 44 Years | 46 (5.2%) | 37 (3.1%) |
| 45 to 49 Years | 0 (0.0%) | 100 (8.5%) |
| 50 to 54 Years | 0 (0.0%) | 81 (6.9%) |
| 55 to 59 Years | 36 (4.1%) | 148 (12.6%) |
| 60 to 64 Years | 101 (11.4%) | 16 (1.4%) |
| 65 to 69 Years | 129 (14.6%) | 0 (0.0%) |
| 70 to 74 Years | 229 (25.9%) | 205 (17.4%) |
| 75 to 79 Years | 0 (0.0%) | 32 (2.7%) |
| 80 to 84 Years | 0 (0.0%) | 0 (0.0%) |
| 85 Years and over | 0 (0.0%) | 16 (1.4%) |
| Total | 886 (100.0%) | 1,177 (100.0%) |
Families and Households in Encantada Ranchito El Calaboz
Median Family Size in Encantada Ranchito El Calaboz
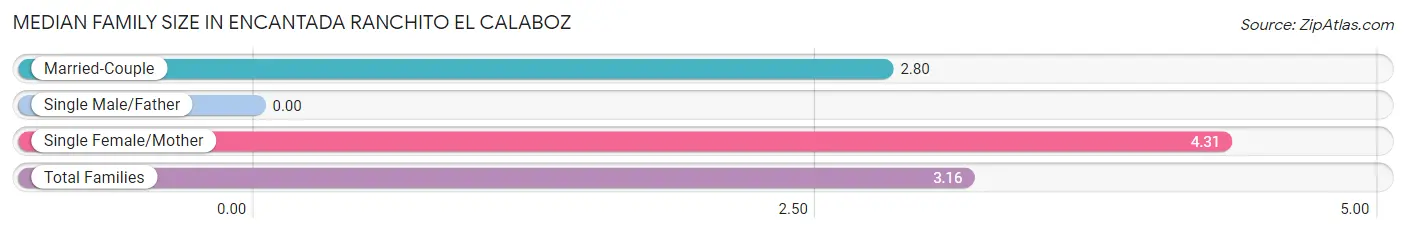
| Family Type | # Families | Family Size |
| Married-Couple | 435 (76.0%) | 2.80 |
| Single Male/Father | 0 (0.0%) | - |
| Single Female/Mother | 137 (23.9%) | 4.31 |
| Total Families | 572 (100.0%) | 3.16 |
Median Household Size in Encantada Ranchito El Calaboz
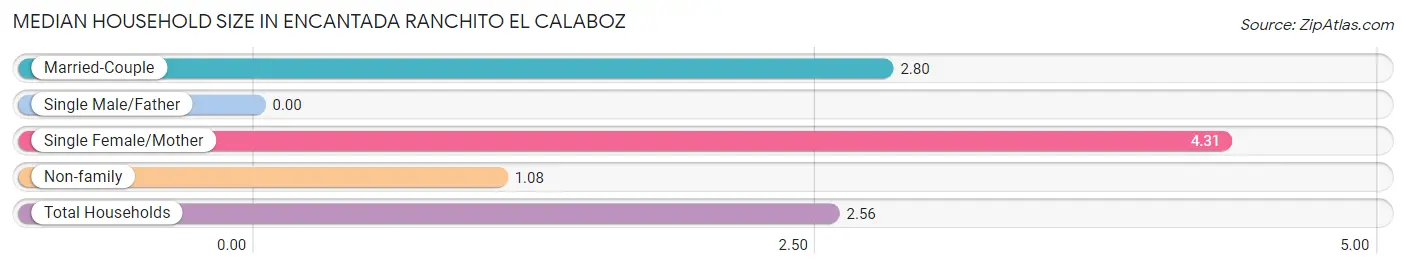
| Household Type | # Households | Household Size |
| Married-Couple | 435 (54.0%) | 2.80 |
| Single Male/Father | 0 (0.0%) | - |
| Single Female/Mother | 137 (17.0%) | 4.31 |
| Non-family | 234 (29.0%) | 1.08 |
| Total Households | 806 (100.0%) | 2.56 |
Household Size by Marriage Status in Encantada Ranchito El Calaboz
Out of a total of 806 households in Encantada Ranchito El Calaboz, 572 (71.0%) are family households, while 234 (29.0%) are nonfamily households. The most numerous type of family households are 2-person households, comprising 294, and the most common type of nonfamily households are 1-person households, comprising 212.
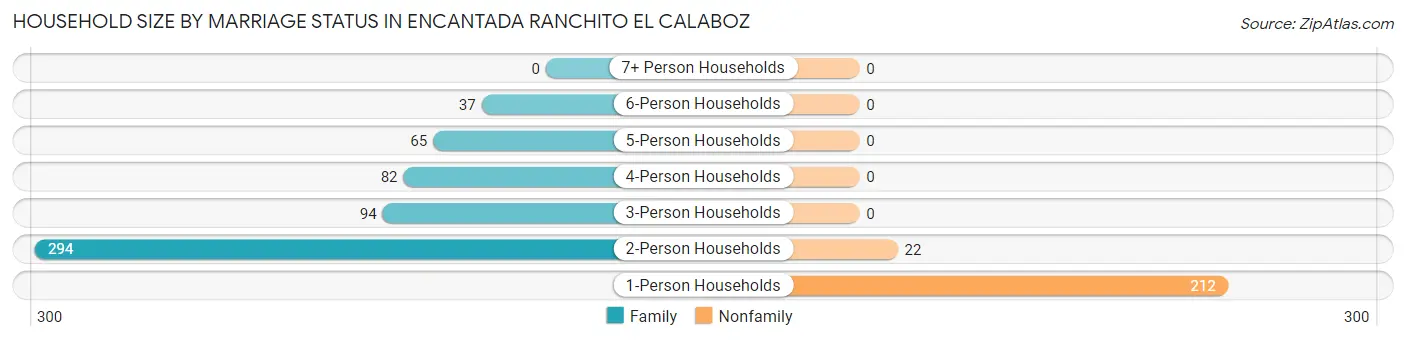
| Household Size | Family Households | Nonfamily Households |
| 1-Person Households | - | 212 (26.3%) |
| 2-Person Households | 294 (36.5%) | 22 (2.7%) |
| 3-Person Households | 94 (11.7%) | 0 (0.0%) |
| 4-Person Households | 82 (10.2%) | 0 (0.0%) |
| 5-Person Households | 65 (8.1%) | 0 (0.0%) |
| 6-Person Households | 37 (4.6%) | 0 (0.0%) |
| 7+ Person Households | 0 (0.0%) | 0 (0.0%) |
| Total | 572 (71.0%) | 234 (29.0%) |
Female Fertility in Encantada Ranchito El Calaboz
Fertility by Age in Encantada Ranchito El Calaboz
Average fertility rate in Encantada Ranchito El Calaboz is 330.0 births per 1,000 women. Women in the age bracket of 20 to 34 years have the highest fertility rate with 695.0 births per 1,000 women. Women in the age bracket of 20 to 34 years acount for 100.0% of all women with births.
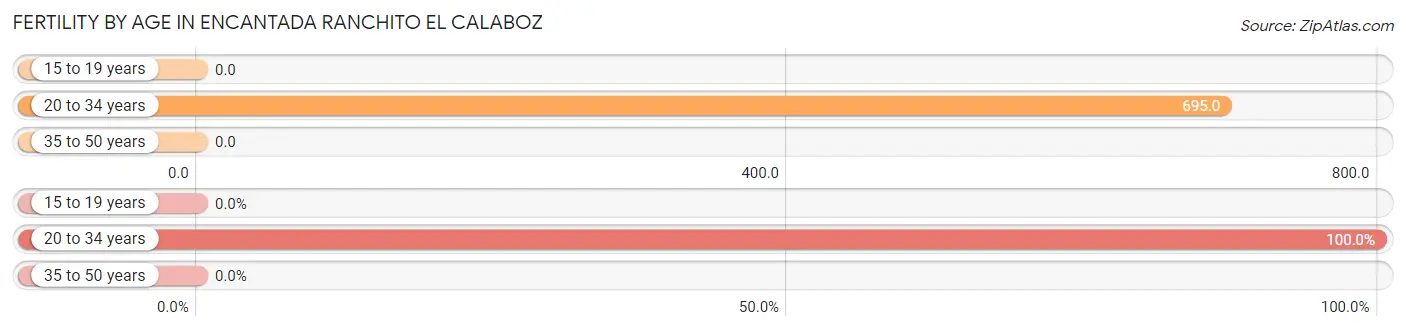
| Age Bracket | Women with Births | Births / 1,000 Women |
| 15 to 19 years | 0 (0.0%) | 0.0 |
| 20 to 34 years | 123 (100.0%) | 695.0 |
| 35 to 50 years | 0 (0.0%) | 0.0 |
| Total | 123 (100.0%) | 330.0 |
Fertility by Age by Marriage Status in Encantada Ranchito El Calaboz
20.3% of women with births (123) in Encantada Ranchito El Calaboz are married. The highest percentage of unmarried women with births falls into 20 to 34 years age bracket with 79.7% of them unmarried at the time of birth, while the lowest percentage of unmarried women with births belong to 20 to 34 years age bracket with 79.7% of them unmarried.
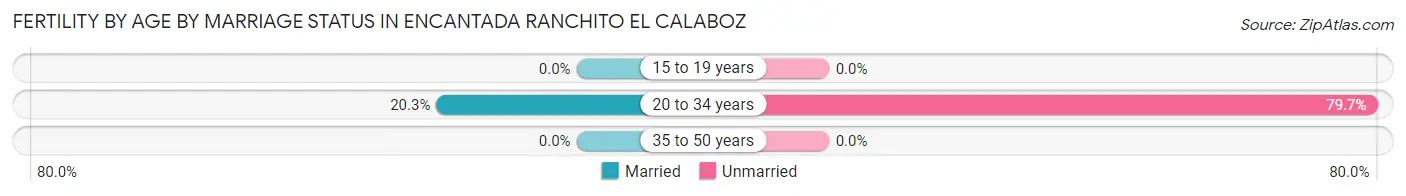
| Age Bracket | Married | Unmarried |
| 15 to 19 years | 0 (0.0%) | 0 (0.0%) |
| 20 to 34 years | 25 (20.3%) | 98 (79.7%) |
| 35 to 50 years | 0 (0.0%) | 0 (0.0%) |
| Total | 25 (20.3%) | 98 (79.7%) |
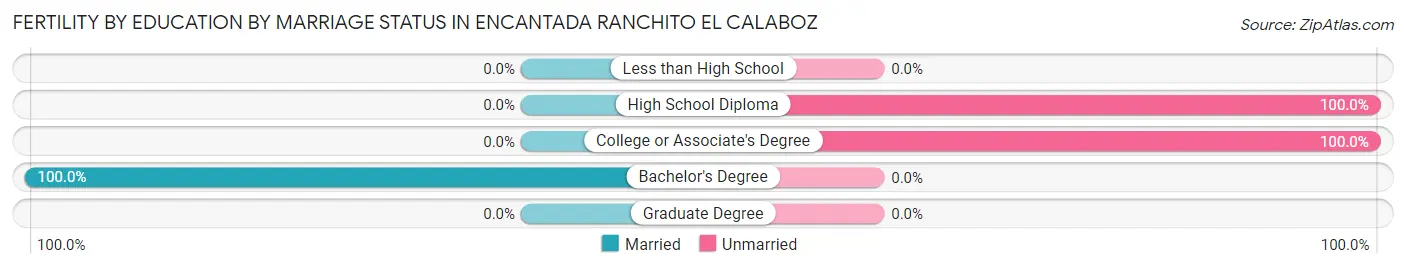
Fertility by Education in Encantada Ranchito El Calaboz
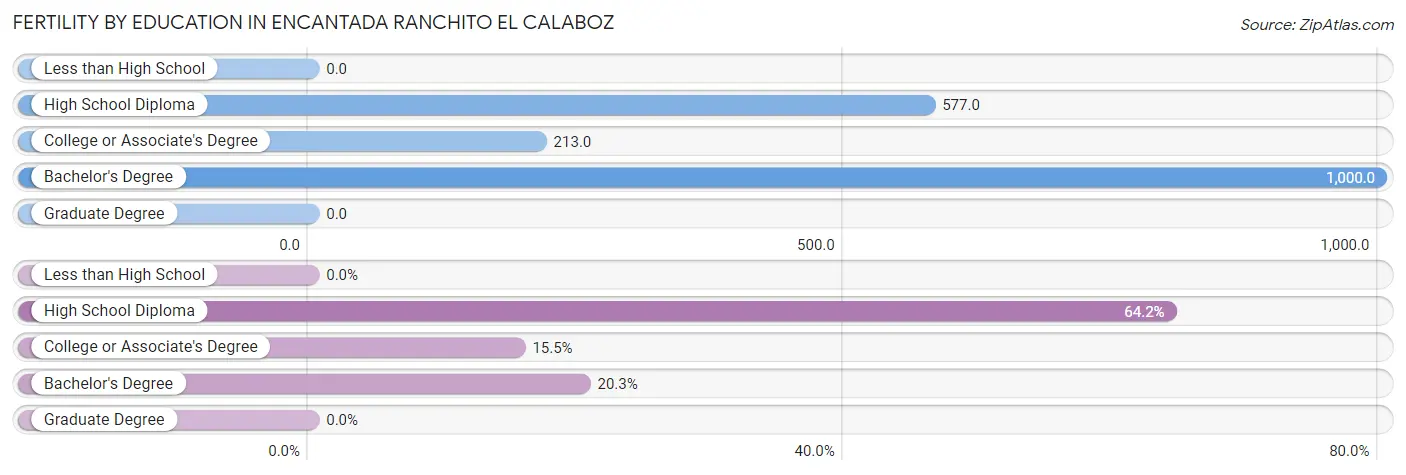
| Educational Attainment | Women with Births | Births / 1,000 Women |
| Less than High School | 0 (0.0%) | 0.0 |
| High School Diploma | 79 (64.2%) | 577.0 |
| College or Associate's Degree | 19 (15.4%) | 213.0 |
| Bachelor's Degree | 25 (20.3%) | 1,000.0 |
| Graduate Degree | 0 (0.0%) | 0.0 |
| Total | 123 (100.0%) | 330.0 |
Fertility by Education by Marriage Status in Encantada Ranchito El Calaboz
79.7% of women with births in Encantada Ranchito El Calaboz are unmarried. Women with the educational attainment of bachelor's degree are most likely to be married with 100.0% of them married at childbirth, while women with the educational attainment of high school diploma are least likely to be married with 100.0% of them unmarried at childbirth.
| Educational Attainment | Married | Unmarried |
| Less than High School | 0 (0.0%) | 0 (0.0%) |
| High School Diploma | 0 (0.0%) | 79 (100.0%) |
| College or Associate's Degree | 0 (0.0%) | 19 (100.0%) |
| Bachelor's Degree | 25 (100.0%) | 0 (0.0%) |
| Graduate Degree | 0 (0.0%) | 0 (0.0%) |
| Total | 25 (20.3%) | 98 (79.7%) |
Employment Characteristics in Encantada Ranchito El Calaboz
Employment by Class of Employer in Encantada Ranchito El Calaboz
Among the 872 employed individuals in Encantada Ranchito El Calaboz, private company employees (762 | 87.4%), self-employed (not incorporated) (81 | 9.3%), and local government employees (18 | 2.1%) make up the most common classes of employment.
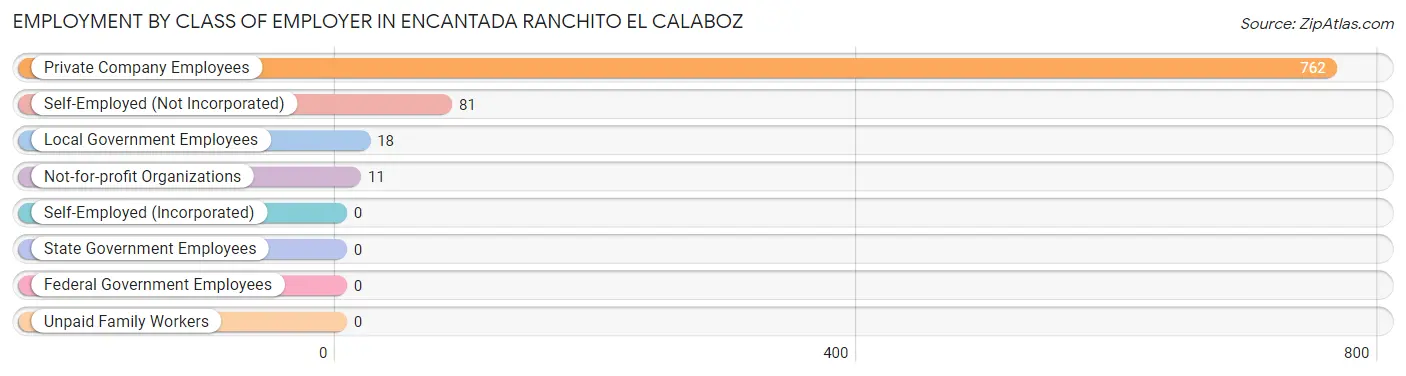
| Employer Class | # Employees | % Employees |
| Private Company Employees | 762 | 87.4% |
| Self-Employed (Incorporated) | 0 | 0.0% |
| Self-Employed (Not Incorporated) | 81 | 9.3% |
| Not-for-profit Organizations | 11 | 1.3% |
| Local Government Employees | 18 | 2.1% |
| State Government Employees | 0 | 0.0% |
| Federal Government Employees | 0 | 0.0% |
| Unpaid Family Workers | 0 | 0.0% |
| Total | 872 | 100.0% |
Employment Status by Age in Encantada Ranchito El Calaboz
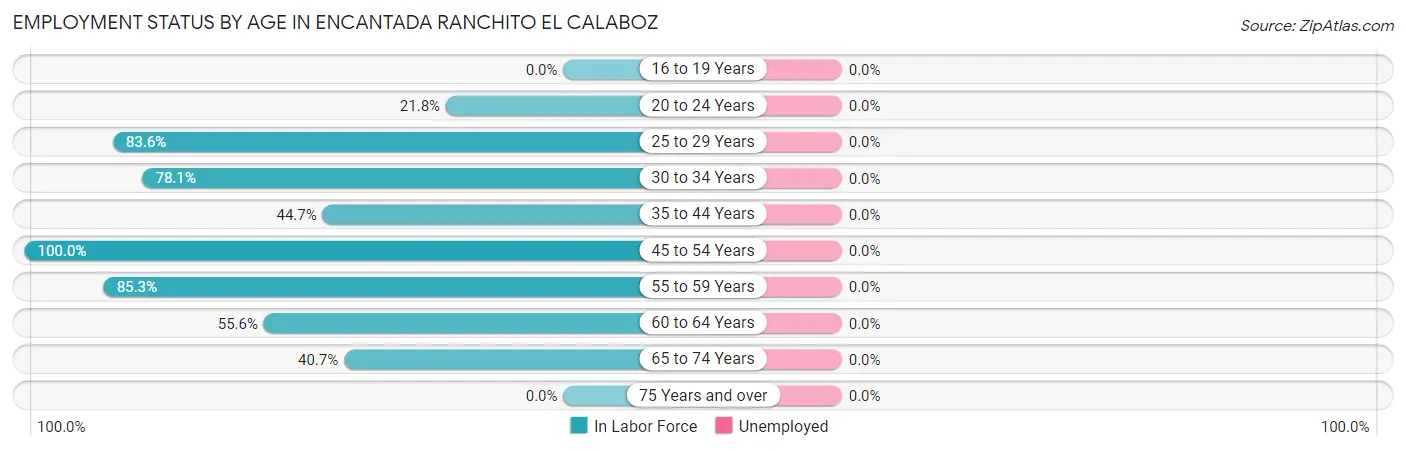
| Age Bracket | In Labor Force | Unemployed |
| 16 to 19 Years | 0 (0.0%) | 0 (0.0%) |
| 20 to 24 Years | 22 (21.8%) | 0 (0.0%) |
| 25 to 29 Years | 97 (83.6%) | 0 (0.0%) |
| 30 to 34 Years | 75 (78.1%) | 0 (0.0%) |
| 35 to 44 Years | 46 (44.7%) | 0 (0.0%) |
| 45 to 54 Years | 181 (100.0%) | 0 (0.0%) |
| 55 to 59 Years | 157 (85.3%) | 0 (0.0%) |
| 60 to 64 Years | 65 (55.6%) | 0 (0.0%) |
| 65 to 74 Years | 229 (40.7%) | 0 (0.0%) |
| 75 Years and over | 0 (0.0%) | 0 (0.0%) |
| Total | 872 (54.2%) | 0 (0.0%) |
Employment Status by Educational Attainment in Encantada Ranchito El Calaboz
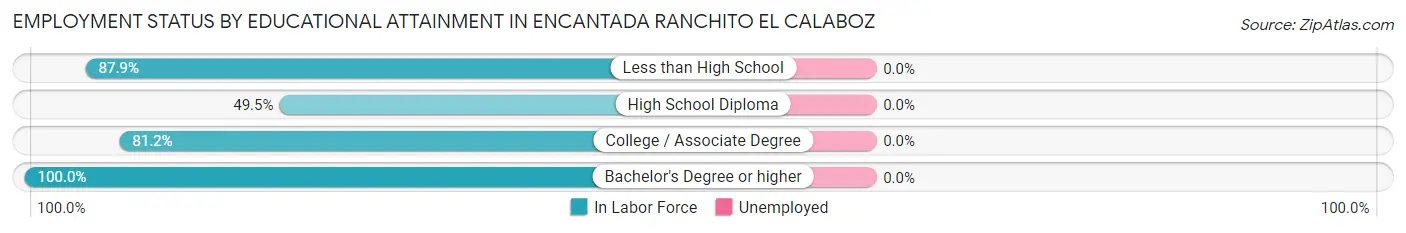
| Educational Attainment | In Labor Force | Unemployed |
| Less than High School | 277 (87.9%) | 0 (0.0%) |
| High School Diploma | 100 (49.5%) | 0 (0.0%) |
| College / Associate Degree | 155 (81.2%) | 0 (0.0%) |
| Bachelor's Degree or higher | 89 (100.0%) | 0 (0.0%) |
| Total | 621 (77.9%) | 0 (0.0%) |
Employment Occupations by Sex in Encantada Ranchito El Calaboz
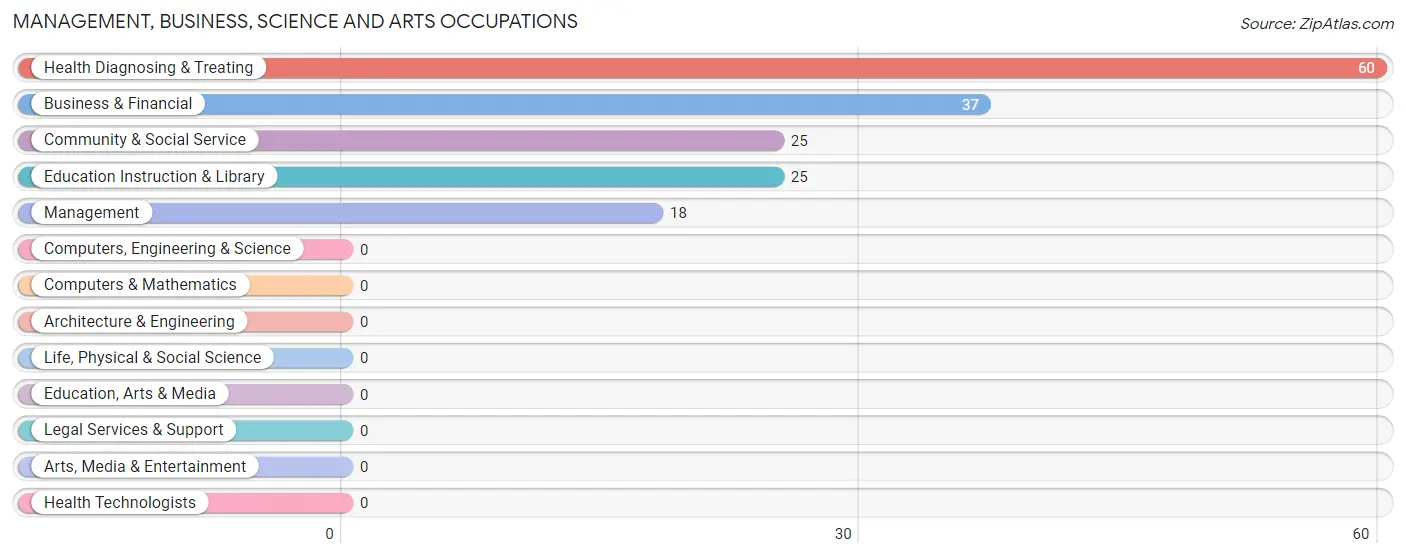
Management, Business, Science and Arts Occupations
The most common Management, Business, Science and Arts occupations in Encantada Ranchito El Calaboz are Health Diagnosing & Treating (60 | 6.9%), Business & Financial (37 | 4.2%), Community & Social Service (25 | 2.9%), Education Instruction & Library (25 | 2.9%), and Management (18 | 2.1%).
Management, Business, Science and Arts Occupations by Sex
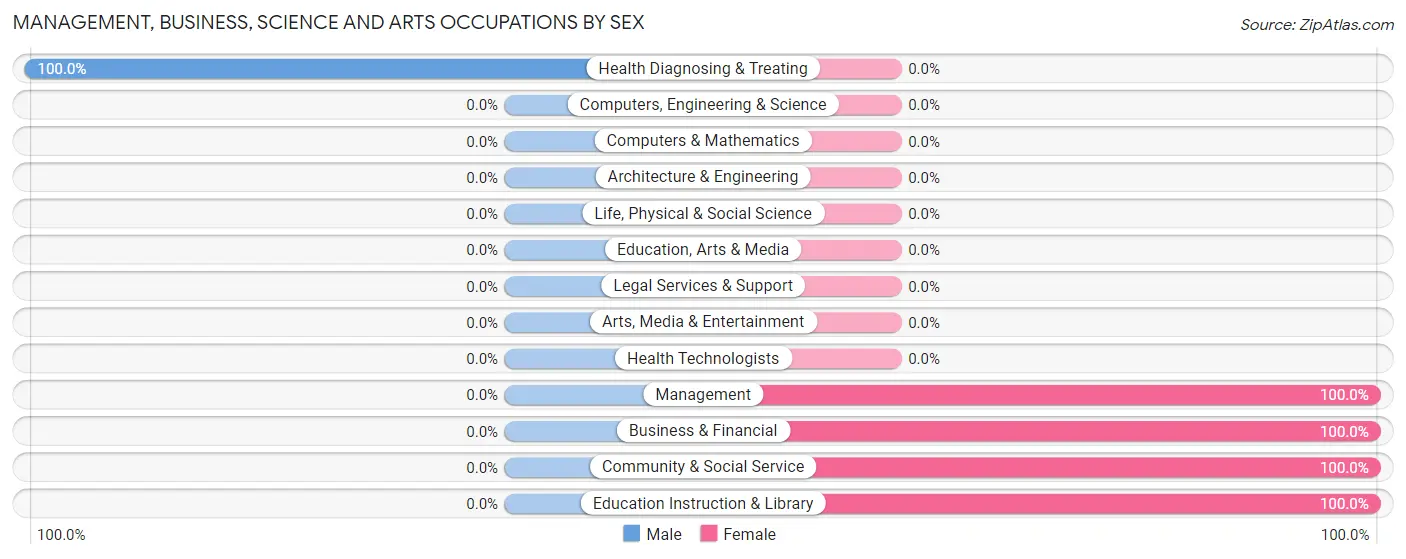
| Occupation | Male | Female |
| Management | 0 (0.0%) | 18 (100.0%) |
| Business & Financial | 0 (0.0%) | 37 (100.0%) |
| Computers, Engineering & Science | 0 (0.0%) | 0 (0.0%) |
| Computers & Mathematics | 0 (0.0%) | 0 (0.0%) |
| Architecture & Engineering | 0 (0.0%) | 0 (0.0%) |
| Life, Physical & Social Science | 0 (0.0%) | 0 (0.0%) |
| Community & Social Service | 0 (0.0%) | 25 (100.0%) |
| Education, Arts & Media | 0 (0.0%) | 0 (0.0%) |
| Legal Services & Support | 0 (0.0%) | 0 (0.0%) |
| Education Instruction & Library | 0 (0.0%) | 25 (100.0%) |
| Arts, Media & Entertainment | 0 (0.0%) | 0 (0.0%) |
| Health Diagnosing & Treating | 60 (100.0%) | 0 (0.0%) |
| Health Technologists | 0 (0.0%) | 0 (0.0%) |
| Total (Category) | 60 (42.9%) | 80 (57.1%) |
| Total (Overall) | 487 (55.8%) | 385 (44.2%) |
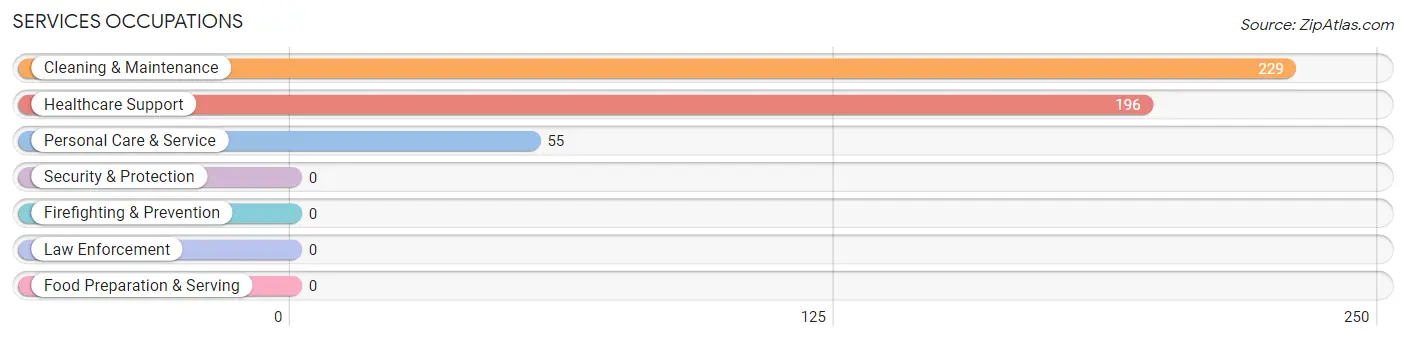
Services Occupations
The most common Services occupations in Encantada Ranchito El Calaboz are Cleaning & Maintenance (229 | 26.3%), Healthcare Support (196 | 22.5%), and Personal Care & Service (55 | 6.3%).
Services Occupations by Sex
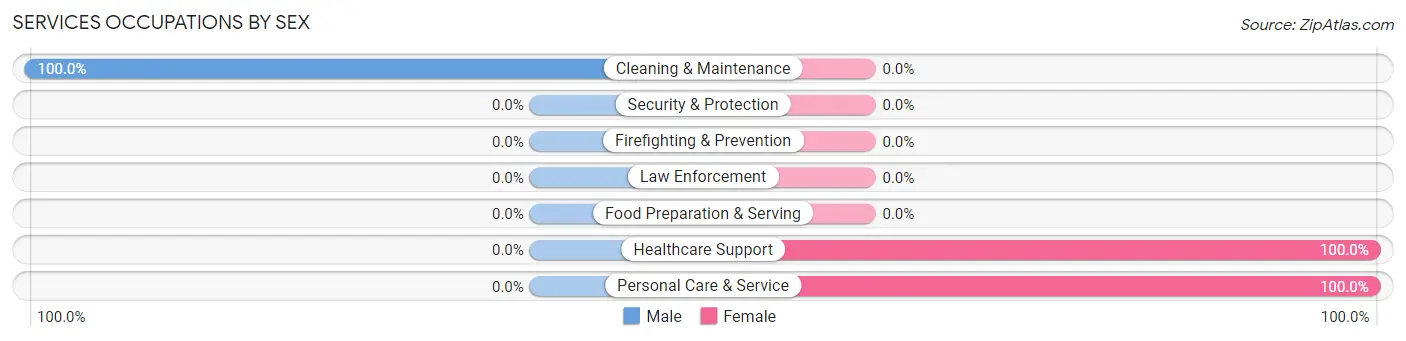
| Occupation | Male | Female |
| Healthcare Support | 0 (0.0%) | 196 (100.0%) |
| Security & Protection | 0 (0.0%) | 0 (0.0%) |
| Firefighting & Prevention | 0 (0.0%) | 0 (0.0%) |
| Law Enforcement | 0 (0.0%) | 0 (0.0%) |
| Food Preparation & Serving | 0 (0.0%) | 0 (0.0%) |
| Cleaning & Maintenance | 229 (100.0%) | 0 (0.0%) |
| Personal Care & Service | 0 (0.0%) | 55 (100.0%) |
| Total (Category) | 229 (47.7%) | 251 (52.3%) |
| Total (Overall) | 487 (55.8%) | 385 (44.2%) |
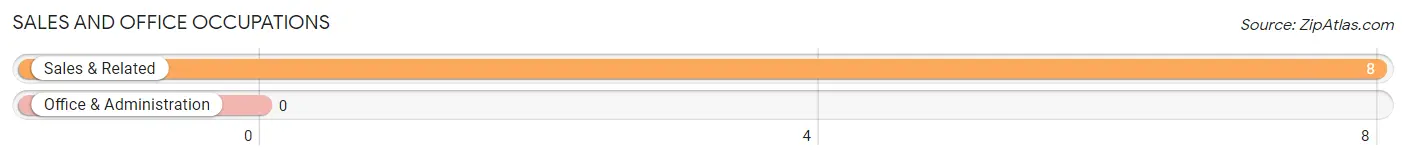
Sales and Office Occupations
The most common Sales and Office occupations in Encantada Ranchito El Calaboz are , and Sales & Related (8 | 0.9%).
Sales and Office Occupations by Sex
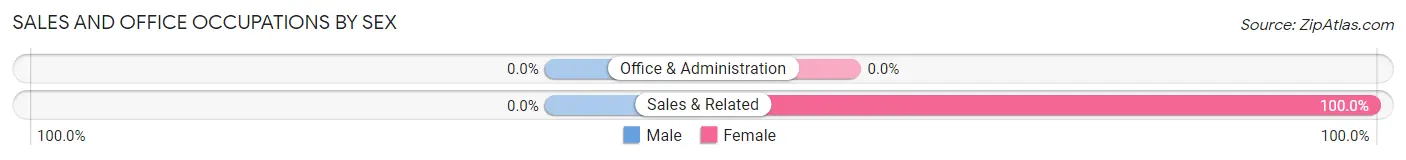
| Occupation | Male | Female |
| Sales & Related | 0 (0.0%) | 8 (100.0%) |
| Office & Administration | 0 (0.0%) | 0 (0.0%) |
| Total (Category) | 0 (0.0%) | 8 (100.0%) |
| Total (Overall) | 487 (55.8%) | 385 (44.2%) |
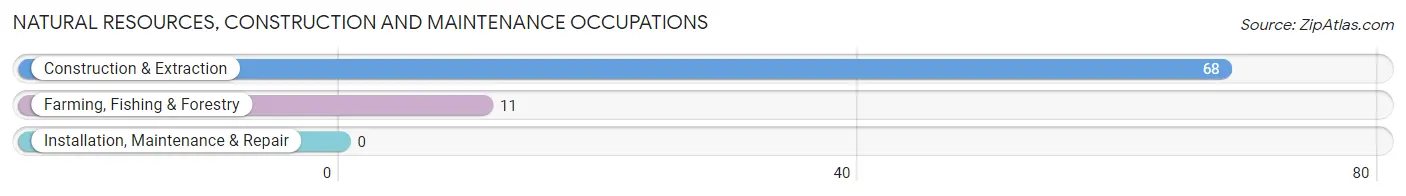
Natural Resources, Construction and Maintenance Occupations
The most common Natural Resources, Construction and Maintenance occupations in Encantada Ranchito El Calaboz are Construction & Extraction (68 | 7.8%), and Farming, Fishing & Forestry (11 | 1.3%).
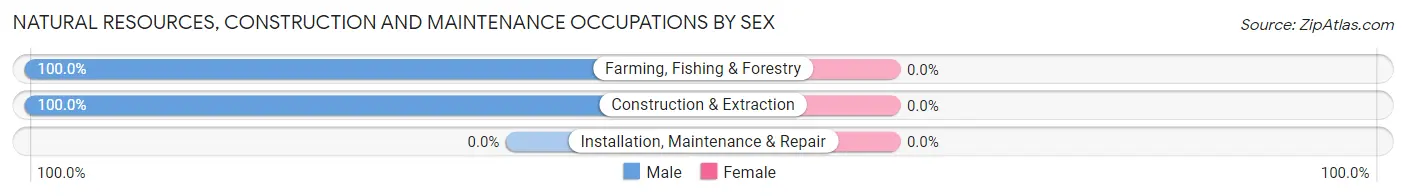
Natural Resources, Construction and Maintenance Occupations by Sex
| Occupation | Male | Female |
| Farming, Fishing & Forestry | 11 (100.0%) | 0 (0.0%) |
| Construction & Extraction | 68 (100.0%) | 0 (0.0%) |
| Installation, Maintenance & Repair | 0 (0.0%) | 0 (0.0%) |
| Total (Category) | 79 (100.0%) | 0 (0.0%) |
| Total (Overall) | 487 (55.8%) | 385 (44.2%) |
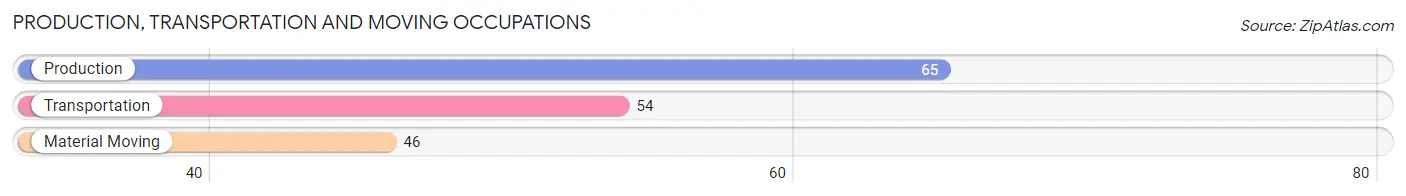
Production, Transportation and Moving Occupations
The most common Production, Transportation and Moving occupations in Encantada Ranchito El Calaboz are Production (65 | 7.4%), Transportation (54 | 6.2%), and Material Moving (46 | 5.3%).
Production, Transportation and Moving Occupations by Sex
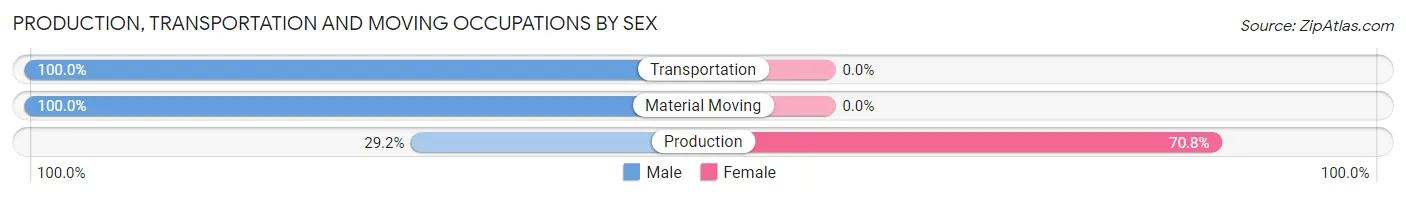
| Occupation | Male | Female |
| Production | 19 (29.2%) | 46 (70.8%) |
| Transportation | 54 (100.0%) | 0 (0.0%) |
| Material Moving | 46 (100.0%) | 0 (0.0%) |
| Total (Category) | 119 (72.1%) | 46 (27.9%) |
| Total (Overall) | 487 (55.8%) | 385 (44.2%) |
Employment Industries by Sex in Encantada Ranchito El Calaboz
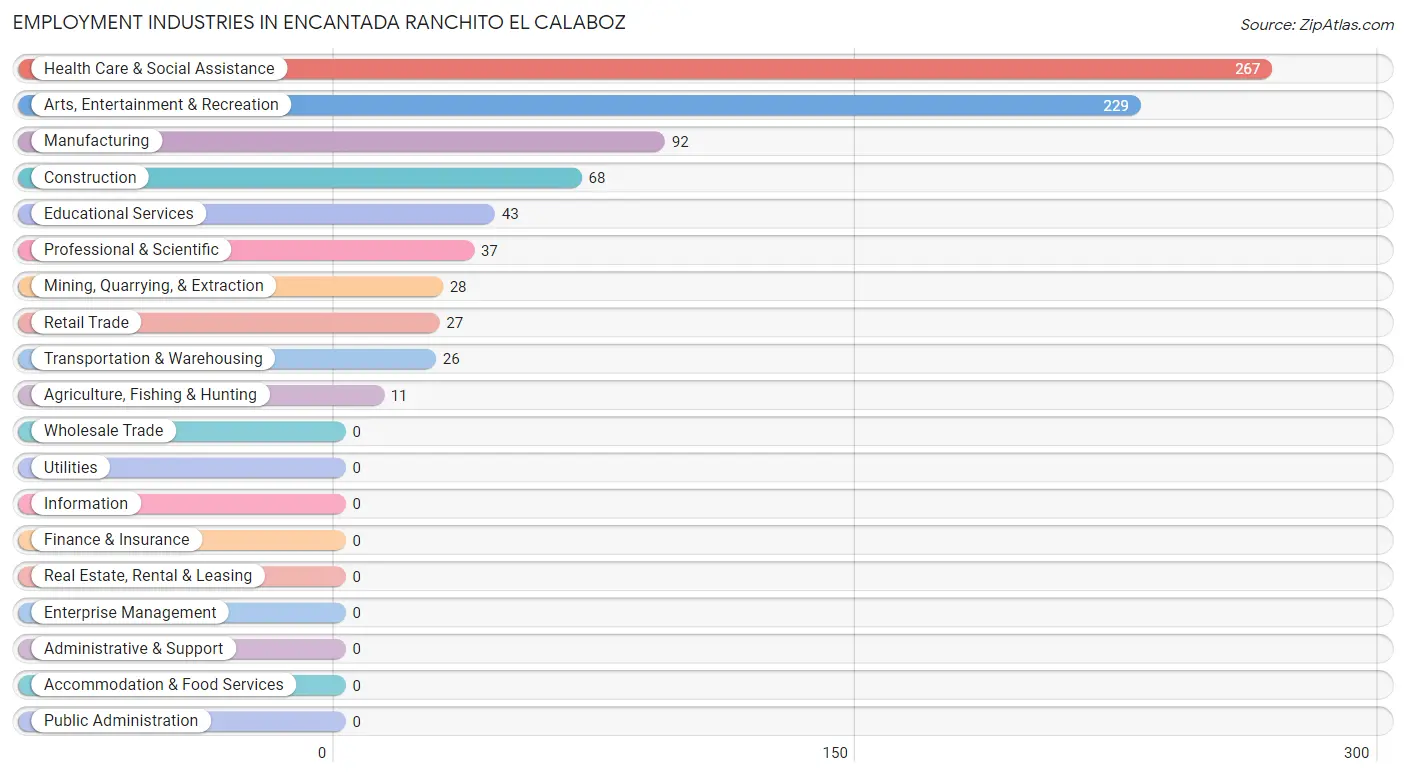
Employment Industries in Encantada Ranchito El Calaboz
The major employment industries in Encantada Ranchito El Calaboz include Health Care & Social Assistance (267 | 30.6%), Arts, Entertainment & Recreation (229 | 26.3%), Manufacturing (92 | 10.5%), Construction (68 | 7.8%), and Educational Services (43 | 4.9%).
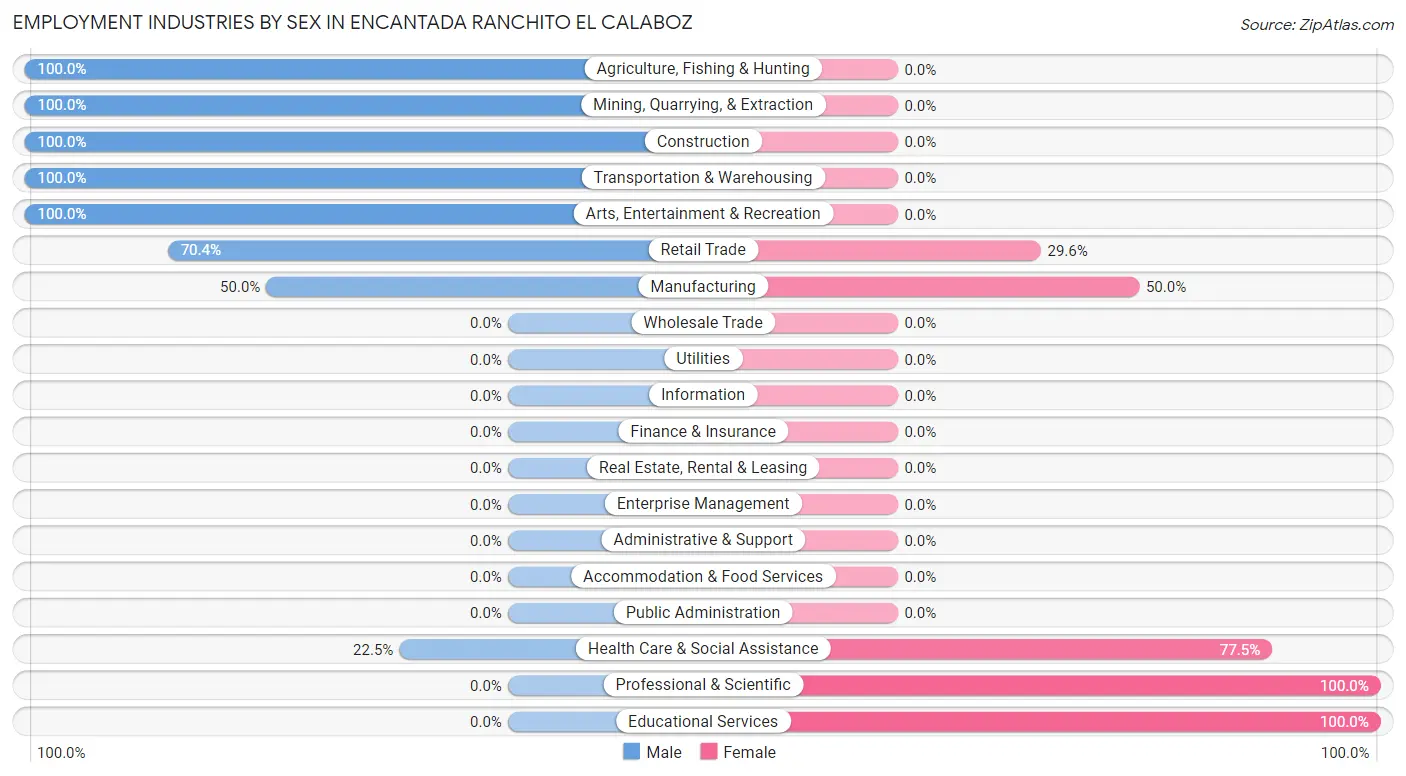
Employment Industries by Sex in Encantada Ranchito El Calaboz
The Encantada Ranchito El Calaboz industries that see more men than women are Agriculture, Fishing & Hunting (100.0%), Mining, Quarrying, & Extraction (100.0%), and Construction (100.0%), whereas the industries that tend to have a higher number of women are Professional & Scientific (100.0%), Educational Services (100.0%), and Health Care & Social Assistance (77.5%).
| Industry | Male | Female |
| Agriculture, Fishing & Hunting | 11 (100.0%) | 0 (0.0%) |
| Mining, Quarrying, & Extraction | 28 (100.0%) | 0 (0.0%) |
| Construction | 68 (100.0%) | 0 (0.0%) |
| Manufacturing | 46 (50.0%) | 46 (50.0%) |
| Wholesale Trade | 0 (0.0%) | 0 (0.0%) |
| Retail Trade | 19 (70.4%) | 8 (29.6%) |
| Transportation & Warehousing | 26 (100.0%) | 0 (0.0%) |
| Utilities | 0 (0.0%) | 0 (0.0%) |
| Information | 0 (0.0%) | 0 (0.0%) |
| Finance & Insurance | 0 (0.0%) | 0 (0.0%) |
| Real Estate, Rental & Leasing | 0 (0.0%) | 0 (0.0%) |
| Professional & Scientific | 0 (0.0%) | 37 (100.0%) |
| Enterprise Management | 0 (0.0%) | 0 (0.0%) |
| Administrative & Support | 0 (0.0%) | 0 (0.0%) |
| Educational Services | 0 (0.0%) | 43 (100.0%) |
| Health Care & Social Assistance | 60 (22.5%) | 207 (77.5%) |
| Arts, Entertainment & Recreation | 229 (100.0%) | 0 (0.0%) |
| Accommodation & Food Services | 0 (0.0%) | 0 (0.0%) |
| Public Administration | 0 (0.0%) | 0 (0.0%) |
| Total | 487 (55.8%) | 385 (44.2%) |
Education in Encantada Ranchito El Calaboz
School Enrollment in Encantada Ranchito El Calaboz
The most common levels of schooling among the 448 students in Encantada Ranchito El Calaboz are elementary school (241 | 53.8%), high school (98 | 21.9%), and college / undergraduate (63 | 14.1%).
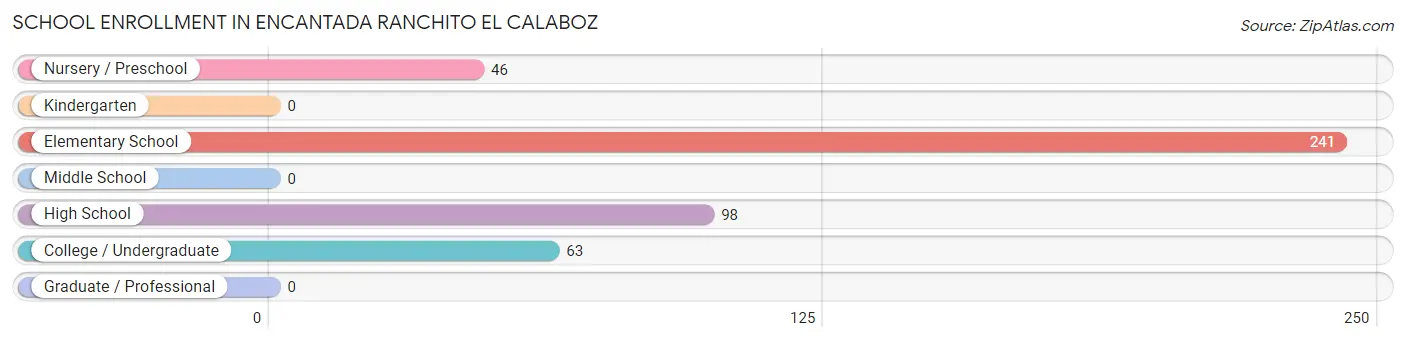
| School Level | # Students | % Students |
| Nursery / Preschool | 46 | 10.3% |
| Kindergarten | 0 | 0.0% |
| Elementary School | 241 | 53.8% |
| Middle School | 0 | 0.0% |
| High School | 98 | 21.9% |
| College / Undergraduate | 63 | 14.1% |
| Graduate / Professional | 0 | 0.0% |
| Total | 448 | 100.0% |
School Enrollment by Age by Funding Source in Encantada Ranchito El Calaboz
Out of a total of 448 students who are enrolled in schools in Encantada Ranchito El Calaboz, 41 (9.2%) attend a private institution, while the remaining 407 (90.8%) are enrolled in public schools. The age group of 5 to 9 year old has the highest likelihood of being enrolled in private schools, with 41 (17.0% in the age bracket) enrolled. Conversely, the age group of 10 to 14 year olds has the lowest likelihood of being enrolled in a private school, with 46 (100.0% in the age bracket) attending a public institution.
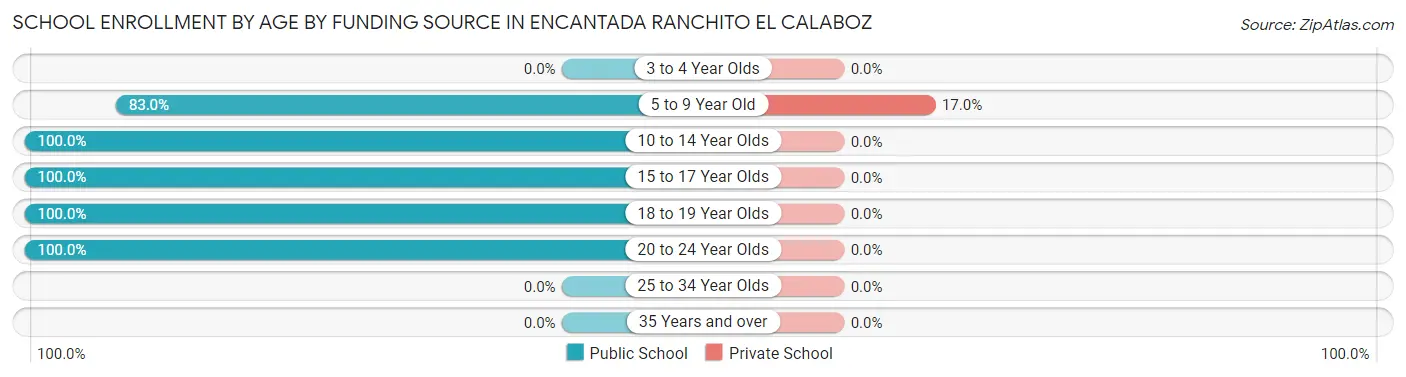
| Age Bracket | Public School | Private School |
| 3 to 4 Year Olds | 0 (0.0%) | 0 (0.0%) |
| 5 to 9 Year Old | 200 (83.0%) | 41 (17.0%) |
| 10 to 14 Year Olds | 46 (100.0%) | 0 (0.0%) |
| 15 to 17 Year Olds | 98 (100.0%) | 0 (0.0%) |
| 18 to 19 Year Olds | 41 (100.0%) | 0 (0.0%) |
| 20 to 24 Year Olds | 22 (100.0%) | 0 (0.0%) |
| 25 to 34 Year Olds | 0 (0.0%) | 0 (0.0%) |
| 35 Years and over | 0 (0.0%) | 0 (0.0%) |
| Total | 407 (90.8%) | 41 (9.2%) |
Educational Attainment by Field of Study in Encantada Ranchito El Calaboz
Business (71 | 67.6%), and education (34 | 32.4%) are the most common fields of study among 105 individuals in Encantada Ranchito El Calaboz who have obtained a bachelor's degree or higher.
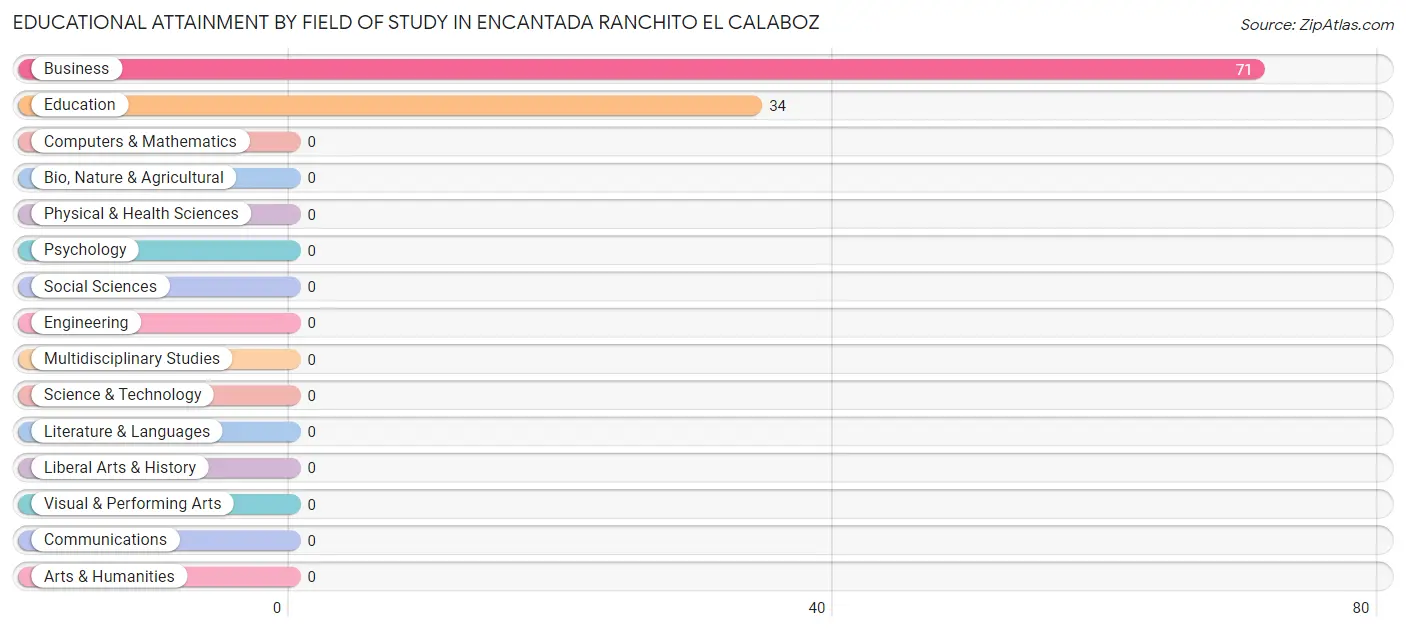
| Field of Study | # Graduates | % Graduates |
| Computers & Mathematics | 0 | 0.0% |
| Bio, Nature & Agricultural | 0 | 0.0% |
| Physical & Health Sciences | 0 | 0.0% |
| Psychology | 0 | 0.0% |
| Social Sciences | 0 | 0.0% |
| Engineering | 0 | 0.0% |
| Multidisciplinary Studies | 0 | 0.0% |
| Science & Technology | 0 | 0.0% |
| Business | 71 | 67.6% |
| Education | 34 | 32.4% |
| Literature & Languages | 0 | 0.0% |
| Liberal Arts & History | 0 | 0.0% |
| Visual & Performing Arts | 0 | 0.0% |
| Communications | 0 | 0.0% |
| Arts & Humanities | 0 | 0.0% |
| Total | 105 | 100.0% |
Transportation & Commute in Encantada Ranchito El Calaboz
Vehicle Availability by Sex in Encantada Ranchito El Calaboz
The most prevalent vehicle ownership categories in Encantada Ranchito El Calaboz are males with 3 vehicles (380, accounting for 78.0%) and females with 3 vehicles (139, making up 98.7%).
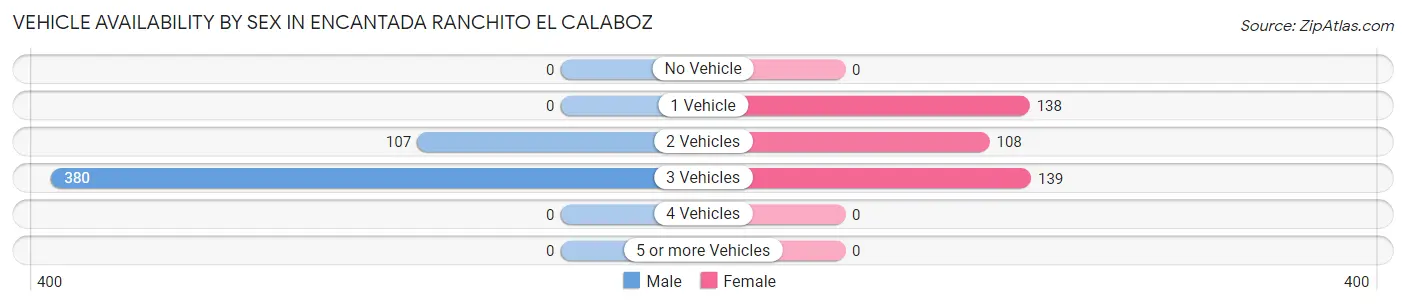
| Vehicles Available | Male | Female |
| No Vehicle | 0 (0.0%) | 0 (0.0%) |
| 1 Vehicle | 0 (0.0%) | 138 (35.8%) |
| 2 Vehicles | 107 (22.0%) | 108 (28.1%) |
| 3 Vehicles | 380 (78.0%) | 139 (36.1%) |
| 4 Vehicles | 0 (0.0%) | 0 (0.0%) |
| 5 or more Vehicles | 0 (0.0%) | 0 (0.0%) |
| Total | 487 (100.0%) | 385 (100.0%) |
Commute Time in Encantada Ranchito El Calaboz
The most frequently occuring commute durations in Encantada Ranchito El Calaboz are 10 to 14 minutes (336 commuters, 40.3%), 30 to 34 minutes (170 commuters, 20.4%), and 5 to 9 minutes (128 commuters, 15.4%).
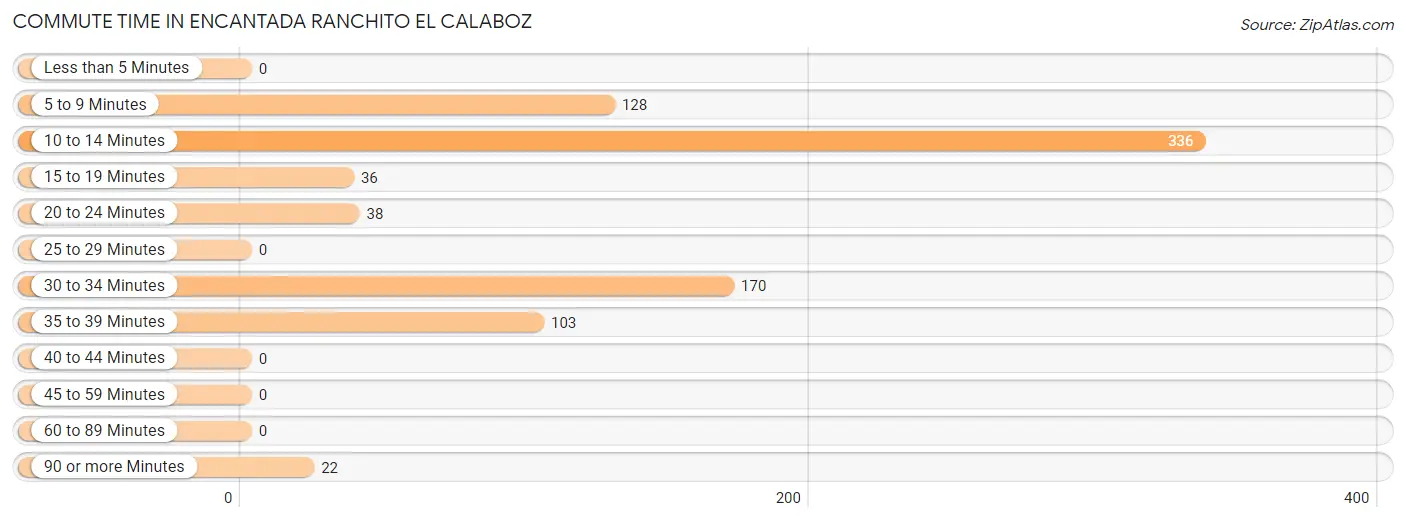
| Commute Time | # Commuters | % Commuters |
| Less than 5 Minutes | 0 | 0.0% |
| 5 to 9 Minutes | 128 | 15.4% |
| 10 to 14 Minutes | 336 | 40.3% |
| 15 to 19 Minutes | 36 | 4.3% |
| 20 to 24 Minutes | 38 | 4.6% |
| 25 to 29 Minutes | 0 | 0.0% |
| 30 to 34 Minutes | 170 | 20.4% |
| 35 to 39 Minutes | 103 | 12.4% |
| 40 to 44 Minutes | 0 | 0.0% |
| 45 to 59 Minutes | 0 | 0.0% |
| 60 to 89 Minutes | 0 | 0.0% |
| 90 or more Minutes | 22 | 2.6% |
Commute Time by Sex in Encantada Ranchito El Calaboz
The most common commute times in Encantada Ranchito El Calaboz are 10 to 14 minutes (255 commuters, 52.4%) for males and 10 to 14 minutes (81 commuters, 23.4%) for females.
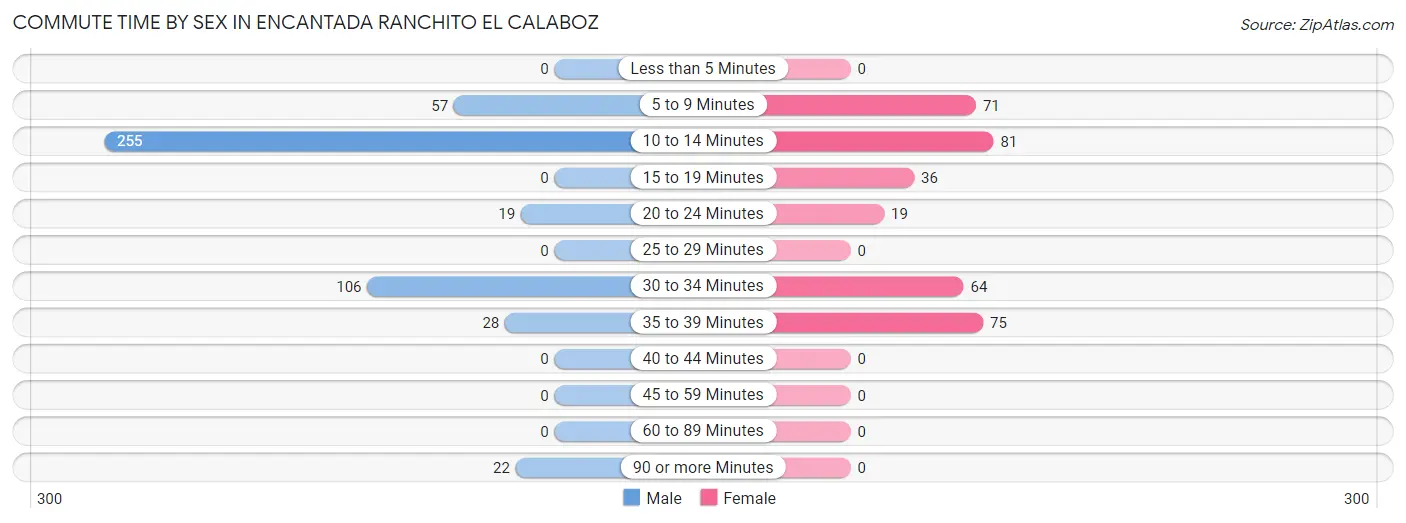
| Commute Time | Male | Female |
| Less than 5 Minutes | 0 (0.0%) | 0 (0.0%) |
| 5 to 9 Minutes | 57 (11.7%) | 71 (20.5%) |
| 10 to 14 Minutes | 255 (52.4%) | 81 (23.4%) |
| 15 to 19 Minutes | 0 (0.0%) | 36 (10.4%) |
| 20 to 24 Minutes | 19 (3.9%) | 19 (5.5%) |
| 25 to 29 Minutes | 0 (0.0%) | 0 (0.0%) |
| 30 to 34 Minutes | 106 (21.8%) | 64 (18.5%) |
| 35 to 39 Minutes | 28 (5.8%) | 75 (21.7%) |
| 40 to 44 Minutes | 0 (0.0%) | 0 (0.0%) |
| 45 to 59 Minutes | 0 (0.0%) | 0 (0.0%) |
| 60 to 89 Minutes | 0 (0.0%) | 0 (0.0%) |
| 90 or more Minutes | 22 (4.5%) | 0 (0.0%) |
Time of Departure to Work by Sex in Encantada Ranchito El Calaboz
The most frequent times of departure to work in Encantada Ranchito El Calaboz are 12:00 AM to 4:59 AM (257, 52.8%) for males and 5:30 AM to 5:59 AM (121, 35.0%) for females.
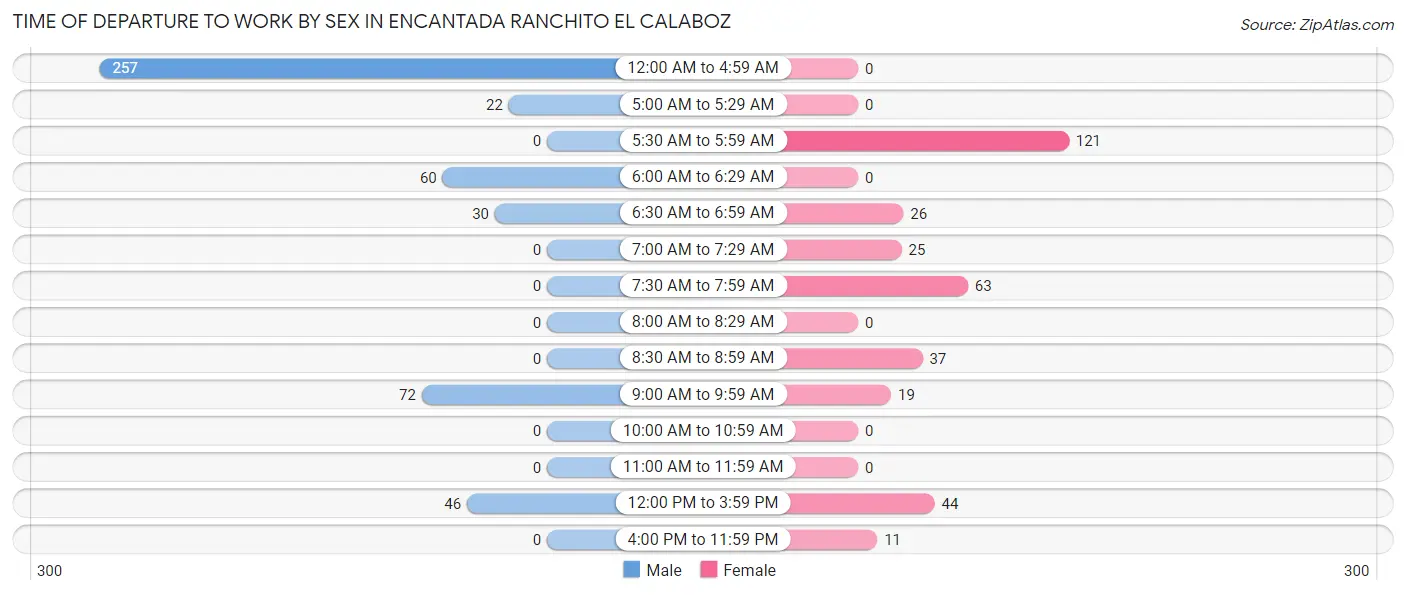
| Time of Departure | Male | Female |
| 12:00 AM to 4:59 AM | 257 (52.8%) | 0 (0.0%) |
| 5:00 AM to 5:29 AM | 22 (4.5%) | 0 (0.0%) |
| 5:30 AM to 5:59 AM | 0 (0.0%) | 121 (35.0%) |
| 6:00 AM to 6:29 AM | 60 (12.3%) | 0 (0.0%) |
| 6:30 AM to 6:59 AM | 30 (6.2%) | 26 (7.5%) |
| 7:00 AM to 7:29 AM | 0 (0.0%) | 25 (7.2%) |
| 7:30 AM to 7:59 AM | 0 (0.0%) | 63 (18.2%) |
| 8:00 AM to 8:29 AM | 0 (0.0%) | 0 (0.0%) |
| 8:30 AM to 8:59 AM | 0 (0.0%) | 37 (10.7%) |
| 9:00 AM to 9:59 AM | 72 (14.8%) | 19 (5.5%) |
| 10:00 AM to 10:59 AM | 0 (0.0%) | 0 (0.0%) |
| 11:00 AM to 11:59 AM | 0 (0.0%) | 0 (0.0%) |
| 12:00 PM to 3:59 PM | 46 (9.5%) | 44 (12.7%) |
| 4:00 PM to 11:59 PM | 0 (0.0%) | 11 (3.2%) |
| Total | 487 (100.0%) | 346 (100.0%) |
Housing Occupancy in Encantada Ranchito El Calaboz
Occupancy by Ownership in Encantada Ranchito El Calaboz
Of the total 806 dwellings in Encantada Ranchito El Calaboz, owner-occupied units account for 778 (96.5%), while renter-occupied units make up 28 (3.5%).
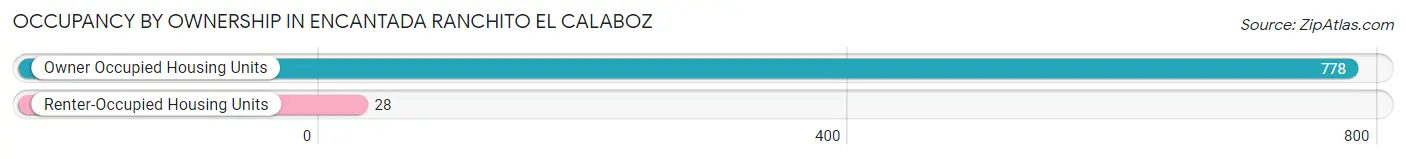
| Occupancy | # Housing Units | % Housing Units |
| Owner Occupied Housing Units | 778 | 96.5% |
| Renter-Occupied Housing Units | 28 | 3.5% |
| Total Occupied Housing Units | 806 | 100.0% |
Occupancy by Household Size in Encantada Ranchito El Calaboz
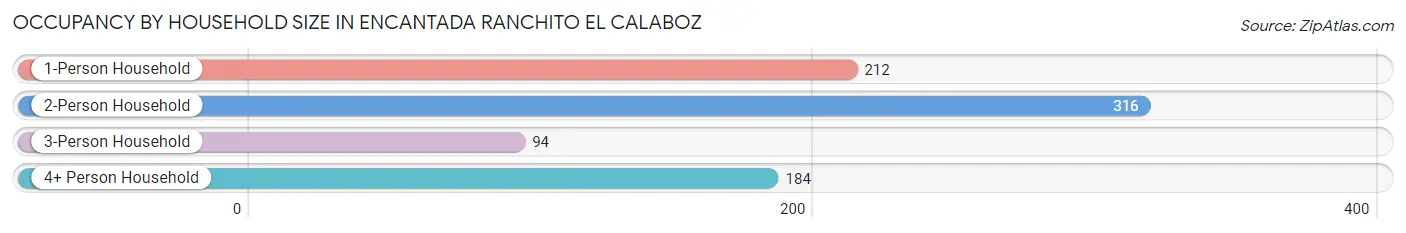
| Household Size | # Housing Units | % Housing Units |
| 1-Person Household | 212 | 26.3% |
| 2-Person Household | 316 | 39.2% |
| 3-Person Household | 94 | 11.7% |
| 4+ Person Household | 184 | 22.8% |
| Total Housing Units | 806 | 100.0% |
Occupancy by Ownership by Household Size in Encantada Ranchito El Calaboz
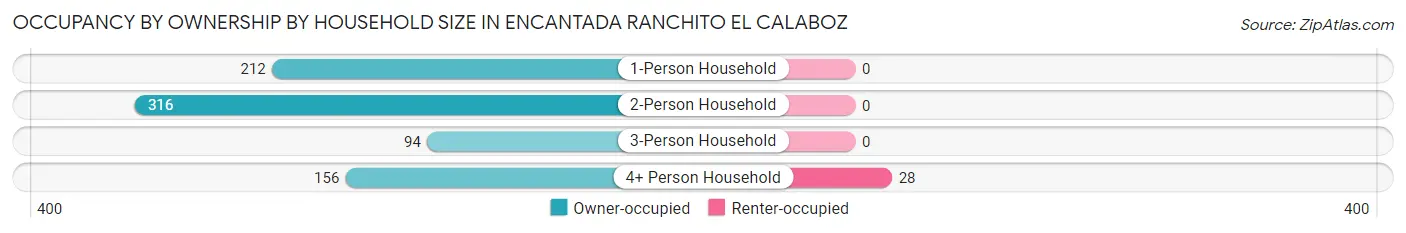
| Household Size | Owner-occupied | Renter-occupied |
| 1-Person Household | 212 (100.0%) | 0 (0.0%) |
| 2-Person Household | 316 (100.0%) | 0 (0.0%) |
| 3-Person Household | 94 (100.0%) | 0 (0.0%) |
| 4+ Person Household | 156 (84.8%) | 28 (15.2%) |
| Total Housing Units | 778 (96.5%) | 28 (3.5%) |
Occupancy by Educational Attainment in Encantada Ranchito El Calaboz
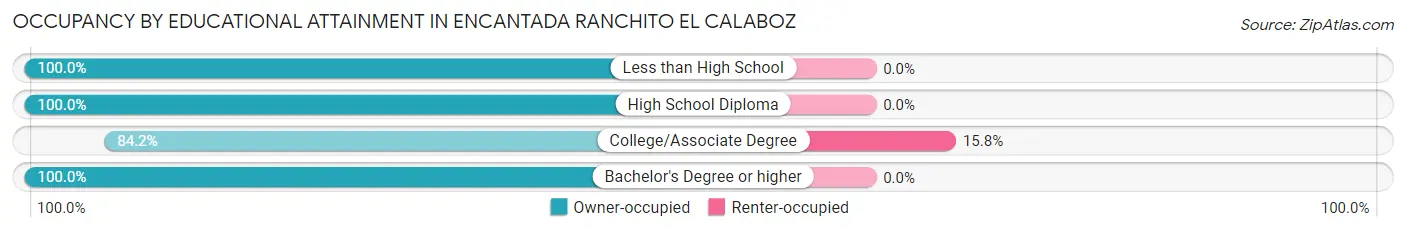
| Household Size | Owner-occupied | Renter-occupied |
| Less than High School | 492 (100.0%) | 0 (0.0%) |
| High School Diploma | 103 (100.0%) | 0 (0.0%) |
| College/Associate Degree | 149 (84.2%) | 28 (15.8%) |
| Bachelor's Degree or higher | 34 (100.0%) | 0 (0.0%) |
Occupancy by Age of Householder in Encantada Ranchito El Calaboz
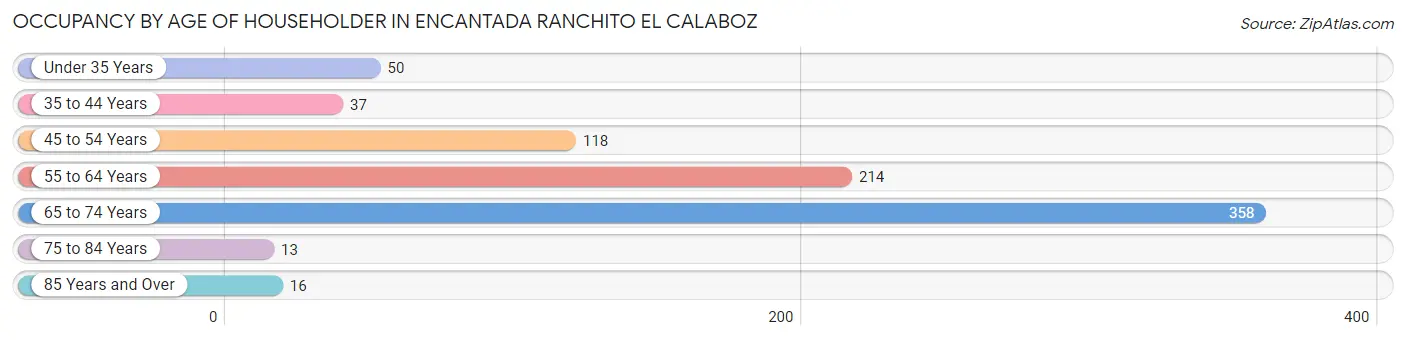
| Age Bracket | # Households | % Households |
| Under 35 Years | 50 | 6.2% |
| 35 to 44 Years | 37 | 4.6% |
| 45 to 54 Years | 118 | 14.6% |
| 55 to 64 Years | 214 | 26.6% |
| 65 to 74 Years | 358 | 44.4% |
| 75 to 84 Years | 13 | 1.6% |
| 85 Years and Over | 16 | 2.0% |
| Total | 806 | 100.0% |
Housing Finances in Encantada Ranchito El Calaboz
Median Income by Occupancy in Encantada Ranchito El Calaboz
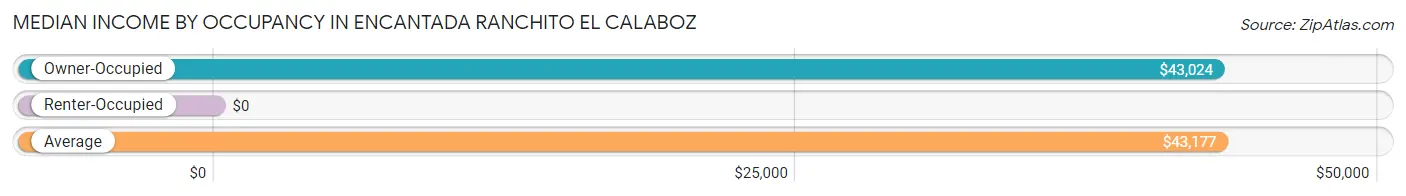
| Occupancy Type | # Households | Median Income |
| Owner-Occupied | 778 (96.5%) | $43,024 |
| Renter-Occupied | 28 (3.5%) | $0 |
| Average | 806 (100.0%) | $43,177 |
Occupancy by Householder Income Bracket in Encantada Ranchito El Calaboz
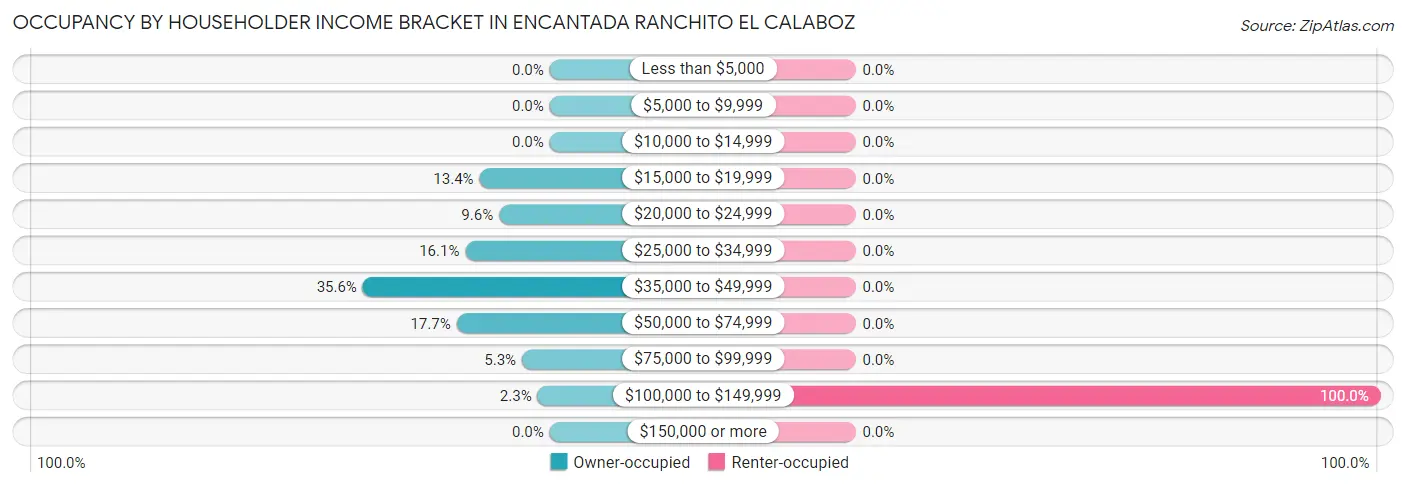
| Income Bracket | Owner-occupied | Renter-occupied |
| Less than $5,000 | 0 (0.0%) | 0 (0.0%) |
| $5,000 to $9,999 | 0 (0.0%) | 0 (0.0%) |
| $10,000 to $14,999 | 0 (0.0%) | 0 (0.0%) |
| $15,000 to $19,999 | 104 (13.4%) | 0 (0.0%) |
| $20,000 to $24,999 | 75 (9.6%) | 0 (0.0%) |
| $25,000 to $34,999 | 125 (16.1%) | 0 (0.0%) |
| $35,000 to $49,999 | 277 (35.6%) | 0 (0.0%) |
| $50,000 to $74,999 | 138 (17.7%) | 0 (0.0%) |
| $75,000 to $99,999 | 41 (5.3%) | 0 (0.0%) |
| $100,000 to $149,999 | 18 (2.3%) | 28 (100.0%) |
| $150,000 or more | 0 (0.0%) | 0 (0.0%) |
| Total | 778 (100.0%) | 28 (100.0%) |
Monthly Housing Cost Tiers in Encantada Ranchito El Calaboz
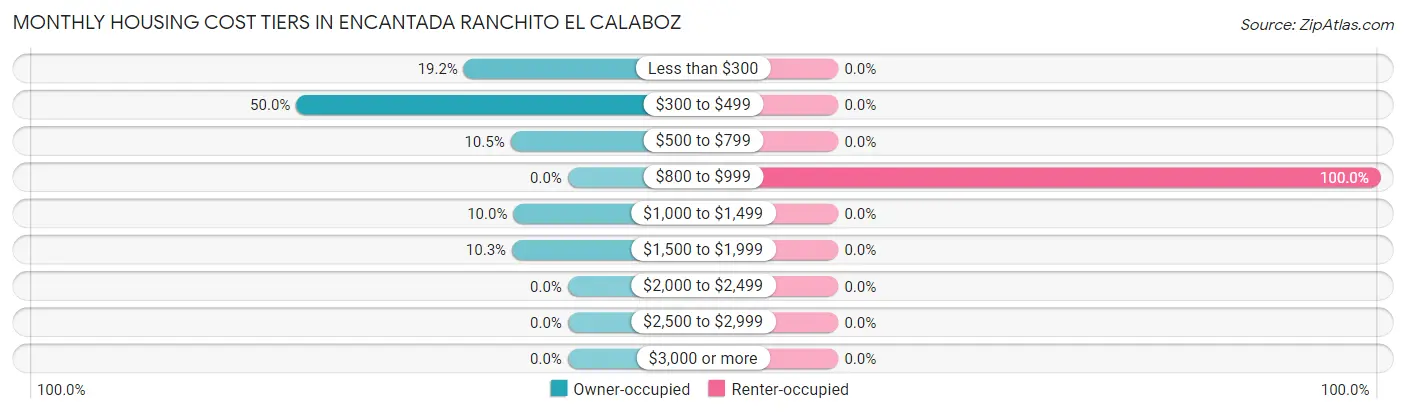
| Monthly Cost | Owner-occupied | Renter-occupied |
| Less than $300 | 149 (19.2%) | 0 (0.0%) |
| $300 to $499 | 389 (50.0%) | 0 (0.0%) |
| $500 to $799 | 82 (10.5%) | 0 (0.0%) |
| $800 to $999 | 0 (0.0%) | 28 (100.0%) |
| $1,000 to $1,499 | 78 (10.0%) | 0 (0.0%) |
| $1,500 to $1,999 | 80 (10.3%) | 0 (0.0%) |
| $2,000 to $2,499 | 0 (0.0%) | 0 (0.0%) |
| $2,500 to $2,999 | 0 (0.0%) | 0 (0.0%) |
| $3,000 or more | 0 (0.0%) | 0 (0.0%) |
| Total | 778 (100.0%) | 28 (100.0%) |
Physical Housing Characteristics in Encantada Ranchito El Calaboz
Housing Structures in Encantada Ranchito El Calaboz
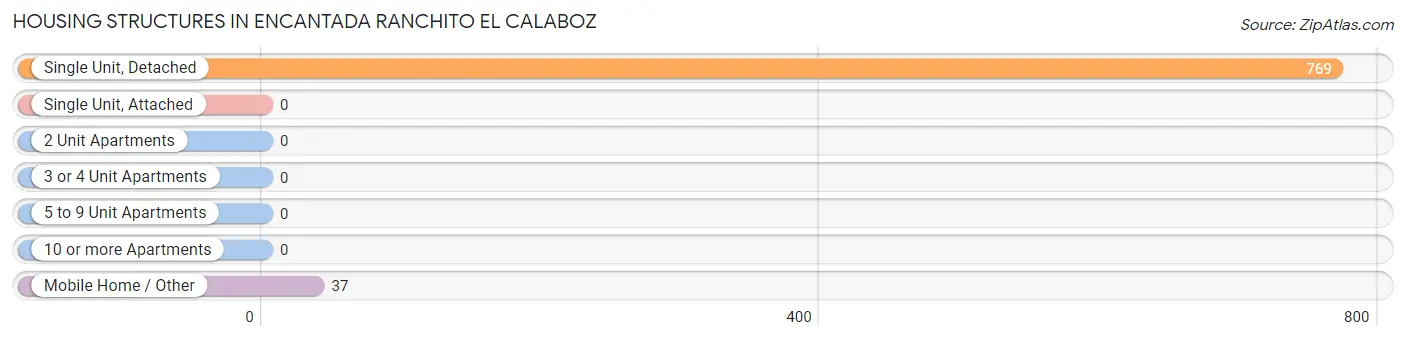
| Structure Type | # Housing Units | % Housing Units |
| Single Unit, Detached | 769 | 95.4% |
| Single Unit, Attached | 0 | 0.0% |
| 2 Unit Apartments | 0 | 0.0% |
| 3 or 4 Unit Apartments | 0 | 0.0% |
| 5 to 9 Unit Apartments | 0 | 0.0% |
| 10 or more Apartments | 0 | 0.0% |
| Mobile Home / Other | 37 | 4.6% |
| Total | 806 | 100.0% |
Housing Structures by Occupancy in Encantada Ranchito El Calaboz
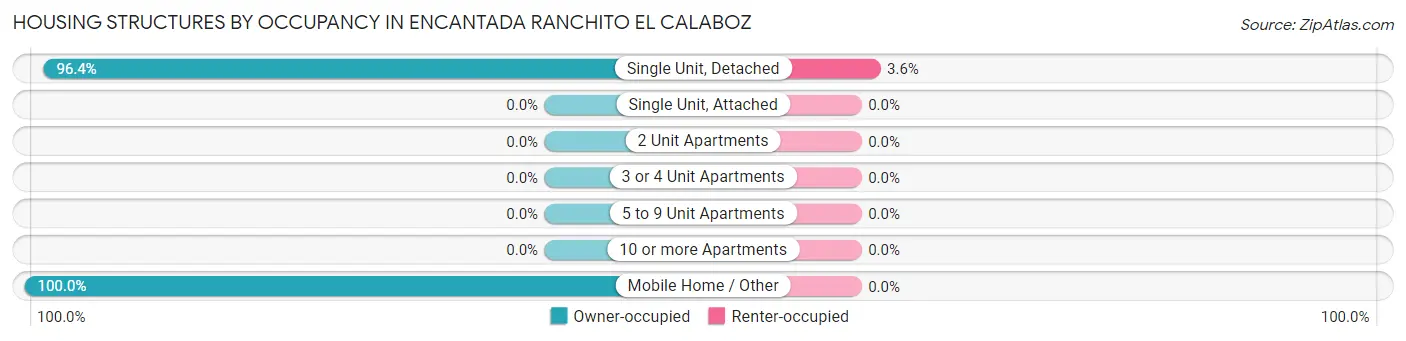
| Structure Type | Owner-occupied | Renter-occupied |
| Single Unit, Detached | 741 (96.4%) | 28 (3.6%) |
| Single Unit, Attached | 0 (0.0%) | 0 (0.0%) |
| 2 Unit Apartments | 0 (0.0%) | 0 (0.0%) |
| 3 or 4 Unit Apartments | 0 (0.0%) | 0 (0.0%) |
| 5 to 9 Unit Apartments | 0 (0.0%) | 0 (0.0%) |
| 10 or more Apartments | 0 (0.0%) | 0 (0.0%) |
| Mobile Home / Other | 37 (100.0%) | 0 (0.0%) |
| Total | 778 (96.5%) | 28 (3.5%) |
Housing Structures by Number of Rooms in Encantada Ranchito El Calaboz
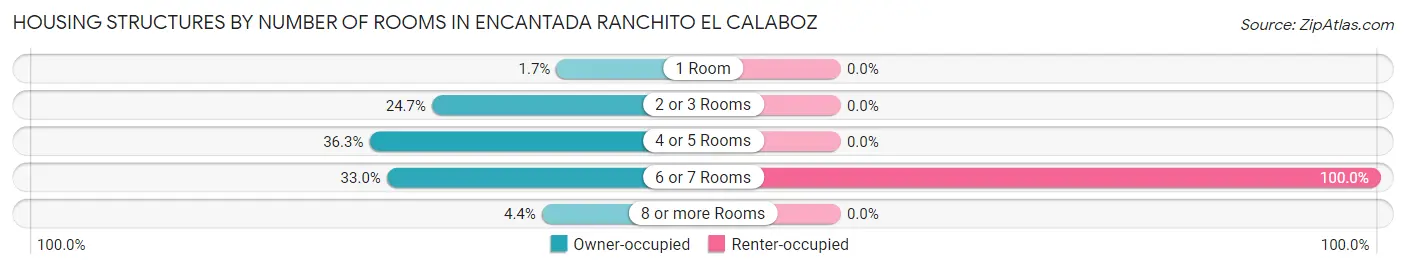
| Number of Rooms | Owner-occupied | Renter-occupied |
| 1 Room | 13 (1.7%) | 0 (0.0%) |
| 2 or 3 Rooms | 192 (24.7%) | 0 (0.0%) |
| 4 or 5 Rooms | 282 (36.2%) | 0 (0.0%) |
| 6 or 7 Rooms | 257 (33.0%) | 28 (100.0%) |
| 8 or more Rooms | 34 (4.4%) | 0 (0.0%) |
| Total | 778 (100.0%) | 28 (100.0%) |
Housing Structure by Heating Type in Encantada Ranchito El Calaboz
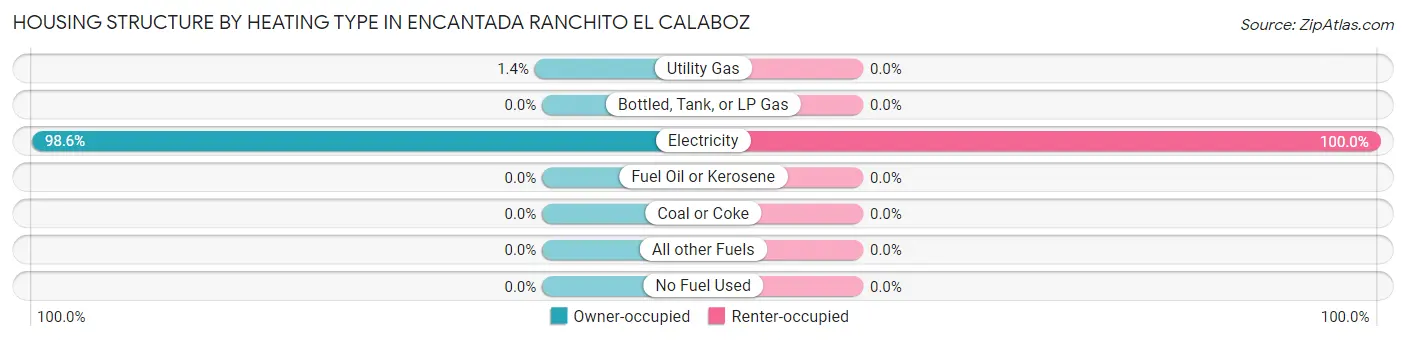
| Heating Type | Owner-occupied | Renter-occupied |
| Utility Gas | 11 (1.4%) | 0 (0.0%) |
| Bottled, Tank, or LP Gas | 0 (0.0%) | 0 (0.0%) |
| Electricity | 767 (98.6%) | 28 (100.0%) |
| Fuel Oil or Kerosene | 0 (0.0%) | 0 (0.0%) |
| Coal or Coke | 0 (0.0%) | 0 (0.0%) |
| All other Fuels | 0 (0.0%) | 0 (0.0%) |
| No Fuel Used | 0 (0.0%) | 0 (0.0%) |
| Total | 778 (100.0%) | 28 (100.0%) |
Household Vehicle Usage in Encantada Ranchito El Calaboz
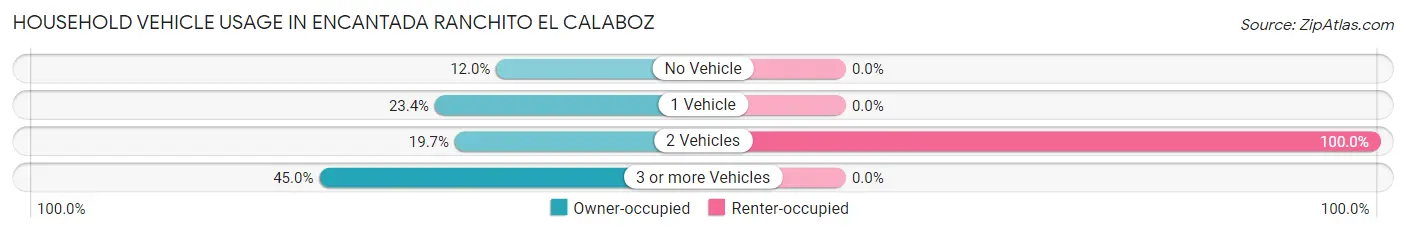
| Vehicles per Household | Owner-occupied | Renter-occupied |
| No Vehicle | 93 (11.9%) | 0 (0.0%) |
| 1 Vehicle | 182 (23.4%) | 0 (0.0%) |
| 2 Vehicles | 153 (19.7%) | 28 (100.0%) |
| 3 or more Vehicles | 350 (45.0%) | 0 (0.0%) |
| Total | 778 (100.0%) | 28 (100.0%) |
Real Estate & Mortgages in Encantada Ranchito El Calaboz
Real Estate and Mortgage Overview in Encantada Ranchito El Calaboz
| Characteristic | Without Mortgage | With Mortgage |
| Housing Units | 583 | 195 |
| Median Property Value | $64,300 | $0 |
| Median Household Income | $43,947 | $0 |
| Monthly Housing Costs | $358 | $0 |
| Real Estate Taxes | $687 | $0 |
Property Value by Mortgage Status in Encantada Ranchito El Calaboz
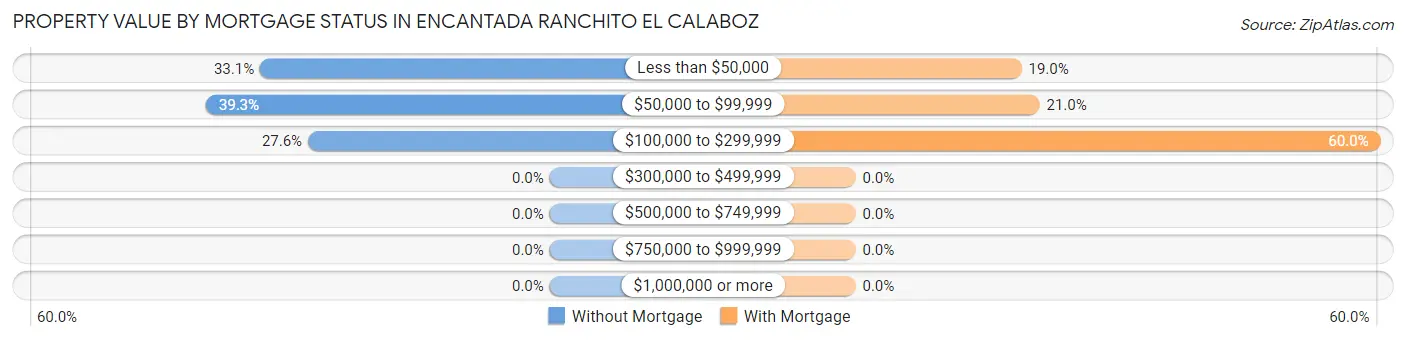
| Property Value | Without Mortgage | With Mortgage |
| Less than $50,000 | 193 (33.1%) | 37 (19.0%) |
| $50,000 to $99,999 | 229 (39.3%) | 41 (21.0%) |
| $100,000 to $299,999 | 161 (27.6%) | 117 (60.0%) |
| $300,000 to $499,999 | 0 (0.0%) | 0 (0.0%) |
| $500,000 to $749,999 | 0 (0.0%) | 0 (0.0%) |
| $750,000 to $999,999 | 0 (0.0%) | 0 (0.0%) |
| $1,000,000 or more | 0 (0.0%) | 0 (0.0%) |
| Total | 583 (100.0%) | 195 (100.0%) |
Household Income by Mortgage Status in Encantada Ranchito El Calaboz
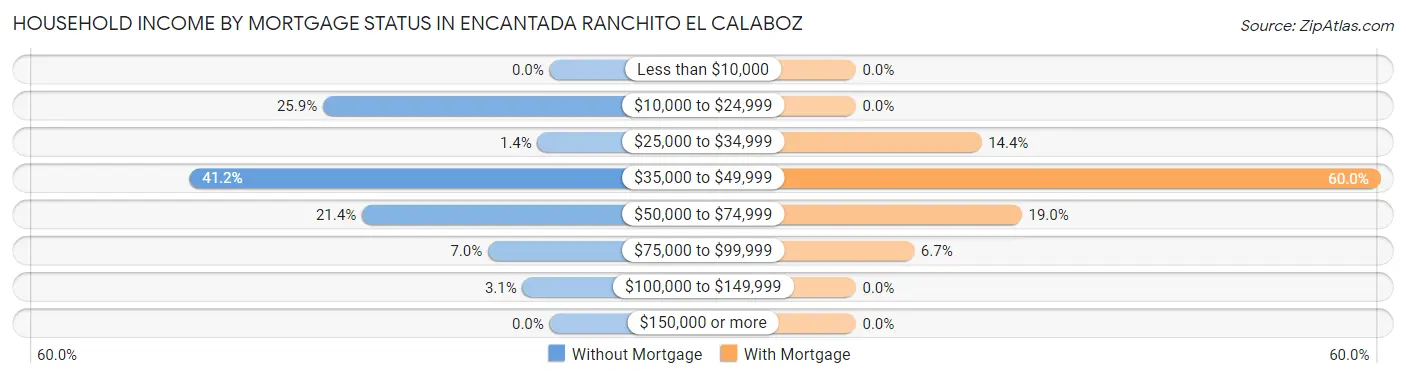
| Household Income | Without Mortgage | With Mortgage |
| Less than $10,000 | 0 (0.0%) | 0 (0.0%) |
| $10,000 to $24,999 | 151 (25.9%) | 0 (0.0%) |
| $25,000 to $34,999 | 8 (1.4%) | 28 (14.4%) |
| $35,000 to $49,999 | 240 (41.2%) | 117 (60.0%) |
| $50,000 to $74,999 | 125 (21.4%) | 37 (19.0%) |
| $75,000 to $99,999 | 41 (7.0%) | 13 (6.7%) |
| $100,000 to $149,999 | 18 (3.1%) | 0 (0.0%) |
| $150,000 or more | 0 (0.0%) | 0 (0.0%) |
| Total | 583 (100.0%) | 195 (100.0%) |
Property Value to Household Income Ratio in Encantada Ranchito El Calaboz
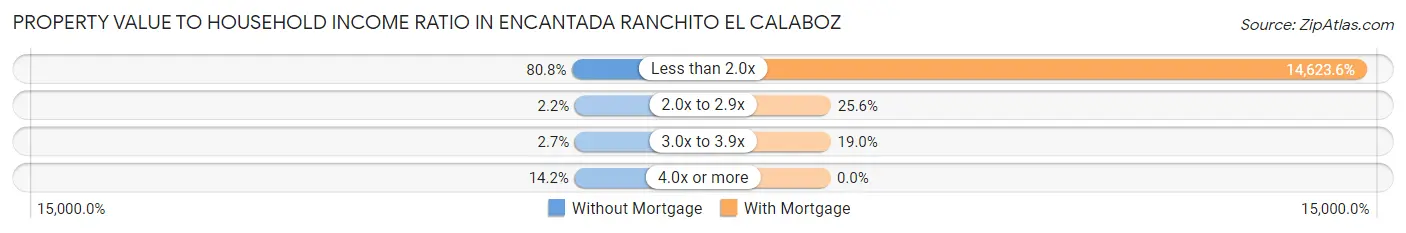
| Value-to-Income Ratio | Without Mortgage | With Mortgage |
| Less than 2.0x | 471 (80.8%) | 28,516 (14,623.6%) |
| 2.0x to 2.9x | 13 (2.2%) | 50 (25.6%) |
| 3.0x to 3.9x | 16 (2.7%) | 37 (19.0%) |
| 4.0x or more | 83 (14.2%) | 0 (0.0%) |
| Total | 583 (100.0%) | 195 (100.0%) |
Real Estate Taxes by Mortgage Status in Encantada Ranchito El Calaboz
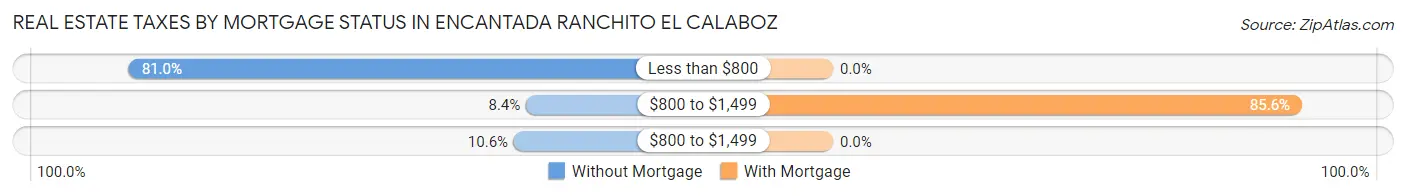
| Property Taxes | Without Mortgage | With Mortgage |
| Less than $800 | 472 (81.0%) | 0 (0.0%) |
| $800 to $1,499 | 49 (8.4%) | 167 (85.6%) |
| $800 to $1,499 | 62 (10.6%) | 0 (0.0%) |
| Total | 583 (100.0%) | 195 (100.0%) |
Health & Disability in Encantada Ranchito El Calaboz
Health Insurance Coverage by Age in Encantada Ranchito El Calaboz
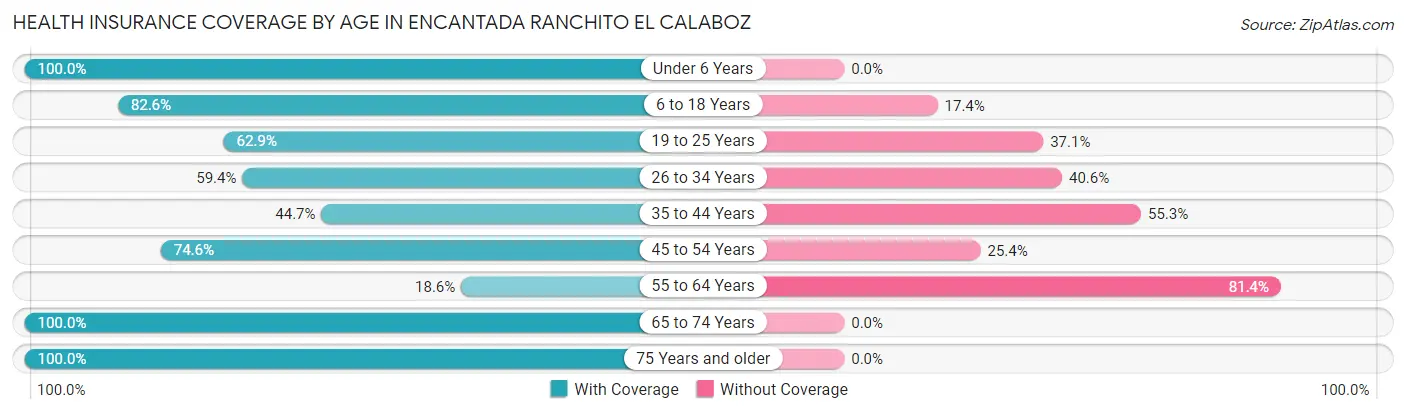
| Age Bracket | With Coverage | Without Coverage |
| Under 6 Years | 174 (100.0%) | 0 (0.0%) |
| 6 to 18 Years | 280 (82.6%) | 59 (17.4%) |
| 19 to 25 Years | 139 (62.9%) | 82 (37.1%) |
| 26 to 34 Years | 79 (59.4%) | 54 (40.6%) |
| 35 to 44 Years | 46 (44.7%) | 57 (55.3%) |
| 45 to 54 Years | 135 (74.6%) | 46 (25.4%) |
| 55 to 64 Years | 56 (18.6%) | 245 (81.4%) |
| 65 to 74 Years | 563 (100.0%) | 0 (0.0%) |
| 75 Years and older | 48 (100.0%) | 0 (0.0%) |
| Total | 1,520 (73.7%) | 543 (26.3%) |
Health Insurance Coverage by Citizenship Status in Encantada Ranchito El Calaboz
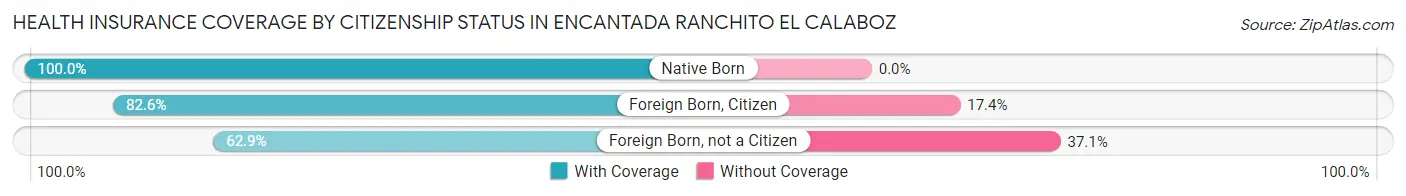
| Citizenship Status | With Coverage | Without Coverage |
| Native Born | 174 (100.0%) | 0 (0.0%) |
| Foreign Born, Citizen | 280 (82.6%) | 59 (17.4%) |
| Foreign Born, not a Citizen | 139 (62.9%) | 82 (37.1%) |
Health Insurance Coverage by Household Income in Encantada Ranchito El Calaboz
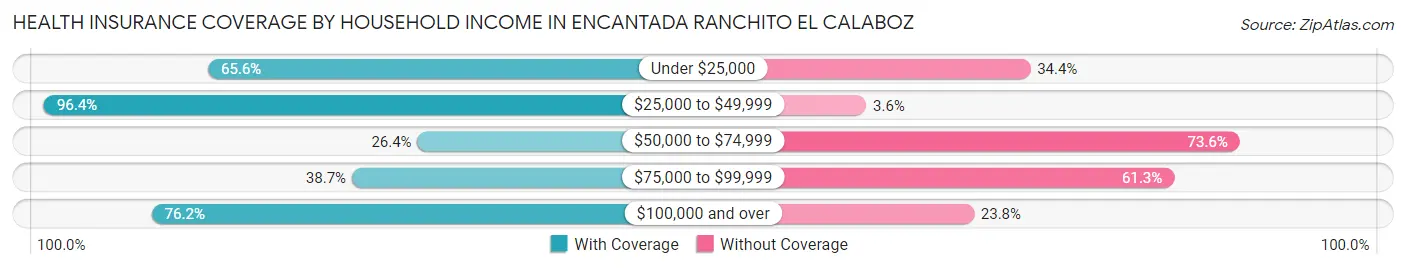
| Household Income | With Coverage | Without Coverage |
| Under $25,000 | 256 (65.6%) | 134 (34.4%) |
| $25,000 to $49,999 | 985 (96.4%) | 37 (3.6%) |
| $50,000 to $74,999 | 94 (26.4%) | 262 (73.6%) |
| $75,000 to $99,999 | 41 (38.7%) | 65 (61.3%) |
| $100,000 and over | 144 (76.2%) | 45 (23.8%) |
Public vs Private Health Insurance Coverage by Age in Encantada Ranchito El Calaboz
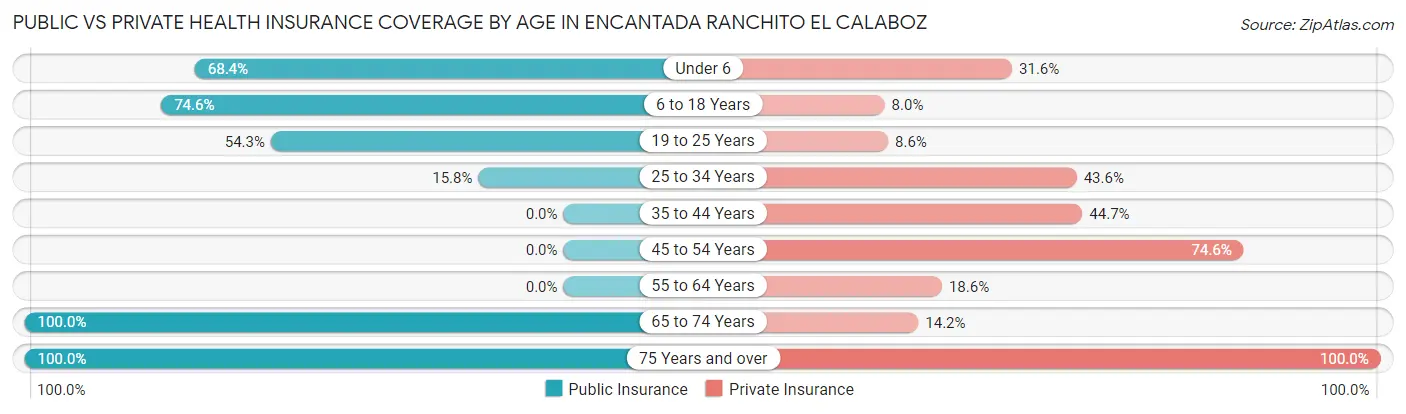
| Age Bracket | Public Insurance | Private Insurance |
| Under 6 | 119 (68.4%) | 55 (31.6%) |
| 6 to 18 Years | 253 (74.6%) | 27 (8.0%) |
| 19 to 25 Years | 120 (54.3%) | 19 (8.6%) |
| 25 to 34 Years | 21 (15.8%) | 58 (43.6%) |
| 35 to 44 Years | 0 (0.0%) | 46 (44.7%) |
| 45 to 54 Years | 0 (0.0%) | 135 (74.6%) |
| 55 to 64 Years | 0 (0.0%) | 56 (18.6%) |
| 65 to 74 Years | 563 (100.0%) | 80 (14.2%) |
| 75 Years and over | 48 (100.0%) | 48 (100.0%) |
| Total | 1,124 (54.5%) | 524 (25.4%) |
Disability Status by Sex by Age in Encantada Ranchito El Calaboz
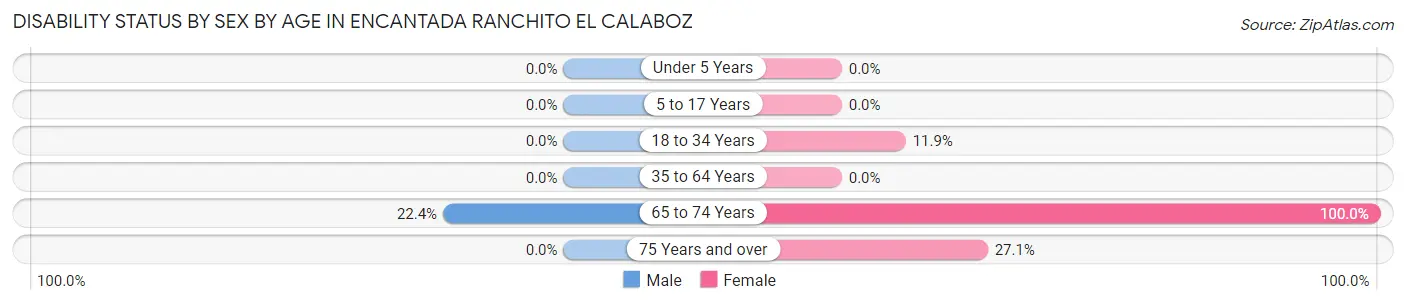
| Age Bracket | Male | Female |
| Under 5 Years | 0 (0.0%) | 0 (0.0%) |
| 5 to 17 Years | 0 (0.0%) | 0 (0.0%) |
| 18 to 34 Years | 0 (0.0%) | 21 (11.9%) |
| 35 to 64 Years | 0 (0.0%) | 0 (0.0%) |
| 65 to 74 Years | 80 (22.4%) | 205 (100.0%) |
| 75 Years and over | 0 (0.0%) | 13 (27.1%) |
Disability Class by Sex by Age in Encantada Ranchito El Calaboz
Disability Class: Hearing Difficulty
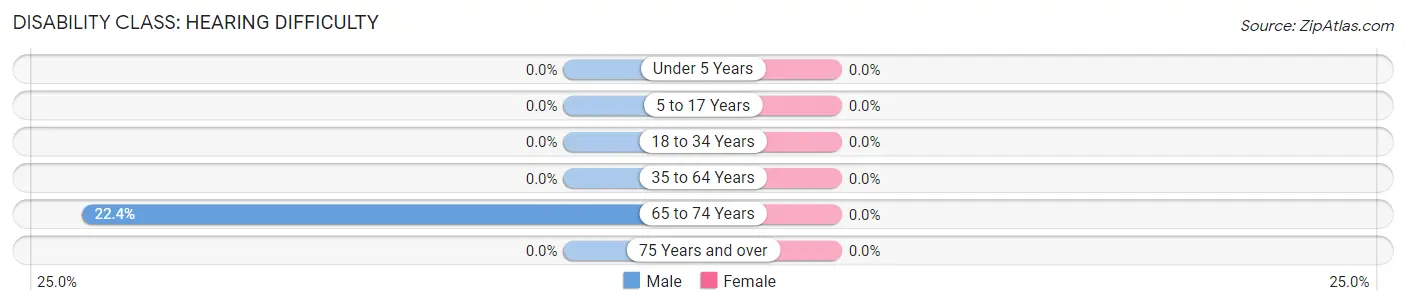
| Age Bracket | Male | Female |
| Under 5 Years | 0 (0.0%) | 0 (0.0%) |
| 5 to 17 Years | 0 (0.0%) | 0 (0.0%) |
| 18 to 34 Years | 0 (0.0%) | 0 (0.0%) |
| 35 to 64 Years | 0 (0.0%) | 0 (0.0%) |
| 65 to 74 Years | 80 (22.4%) | 0 (0.0%) |
| 75 Years and over | 0 (0.0%) | 0 (0.0%) |
Disability Class: Vision Difficulty
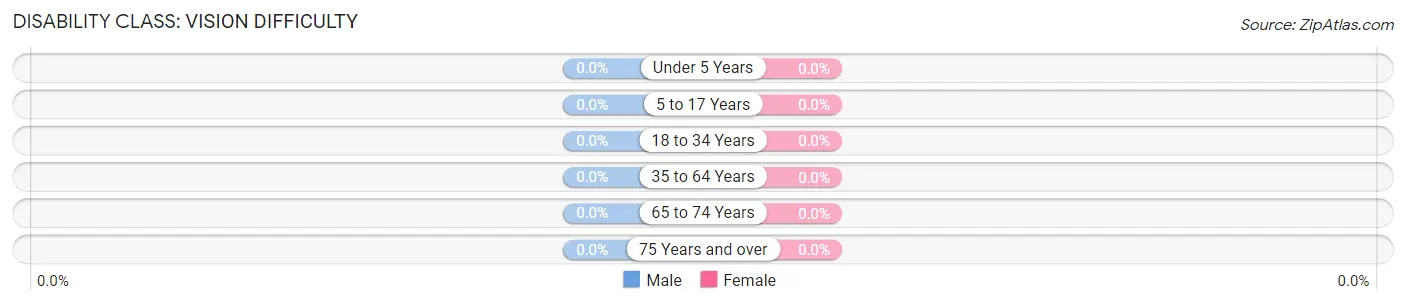
| Age Bracket | Male | Female |
| Under 5 Years | 0 (0.0%) | 0 (0.0%) |
| 5 to 17 Years | 0 (0.0%) | 0 (0.0%) |
| 18 to 34 Years | 0 (0.0%) | 0 (0.0%) |
| 35 to 64 Years | 0 (0.0%) | 0 (0.0%) |
| 65 to 74 Years | 0 (0.0%) | 0 (0.0%) |
| 75 Years and over | 0 (0.0%) | 0 (0.0%) |
Disability Class: Cognitive Difficulty
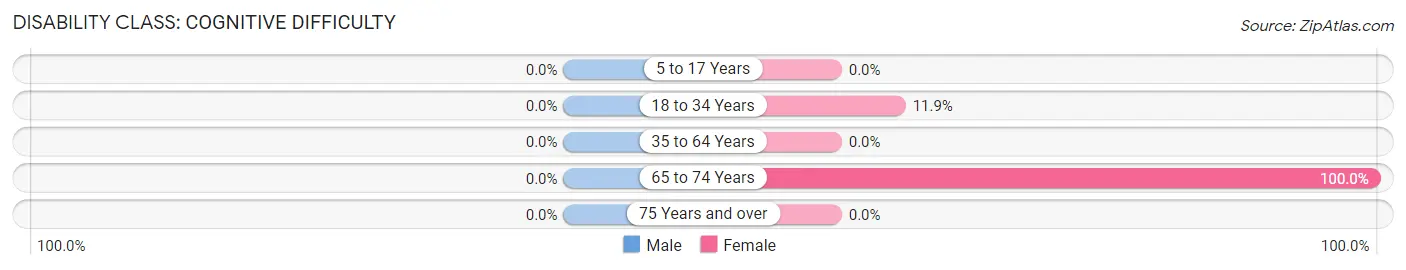
| Age Bracket | Male | Female |
| 5 to 17 Years | 0 (0.0%) | 0 (0.0%) |
| 18 to 34 Years | 0 (0.0%) | 21 (11.9%) |
| 35 to 64 Years | 0 (0.0%) | 0 (0.0%) |
| 65 to 74 Years | 0 (0.0%) | 205 (100.0%) |
| 75 Years and over | 0 (0.0%) | 0 (0.0%) |
Disability Class: Ambulatory Difficulty
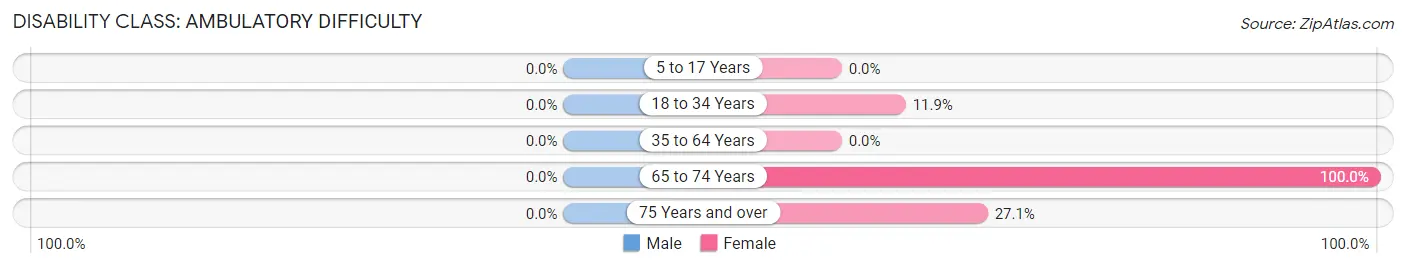
| Age Bracket | Male | Female |
| 5 to 17 Years | 0 (0.0%) | 0 (0.0%) |
| 18 to 34 Years | 0 (0.0%) | 21 (11.9%) |
| 35 to 64 Years | 0 (0.0%) | 0 (0.0%) |
| 65 to 74 Years | 0 (0.0%) | 205 (100.0%) |
| 75 Years and over | 0 (0.0%) | 13 (27.1%) |
Disability Class: Self-Care Difficulty
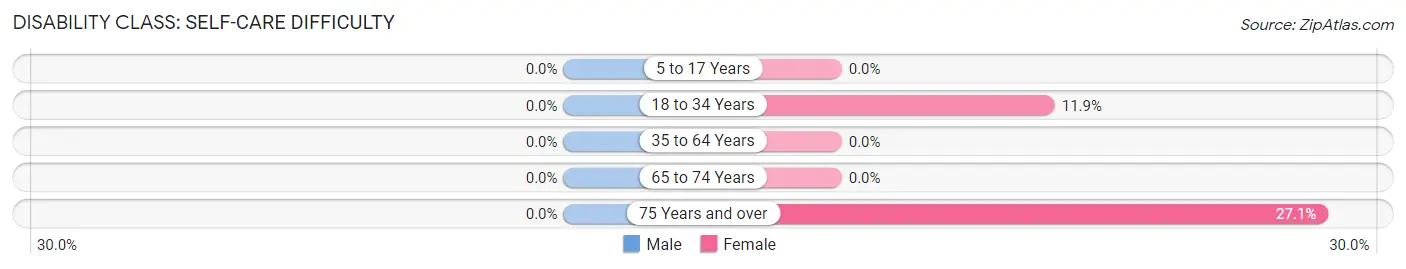
| Age Bracket | Male | Female |
| 5 to 17 Years | 0 (0.0%) | 0 (0.0%) |
| 18 to 34 Years | 0 (0.0%) | 21 (11.9%) |
| 35 to 64 Years | 0 (0.0%) | 0 (0.0%) |
| 65 to 74 Years | 0 (0.0%) | 0 (0.0%) |
| 75 Years and over | 0 (0.0%) | 13 (27.1%) |
Technology Access in Encantada Ranchito El Calaboz
Computing Device Access in Encantada Ranchito El Calaboz
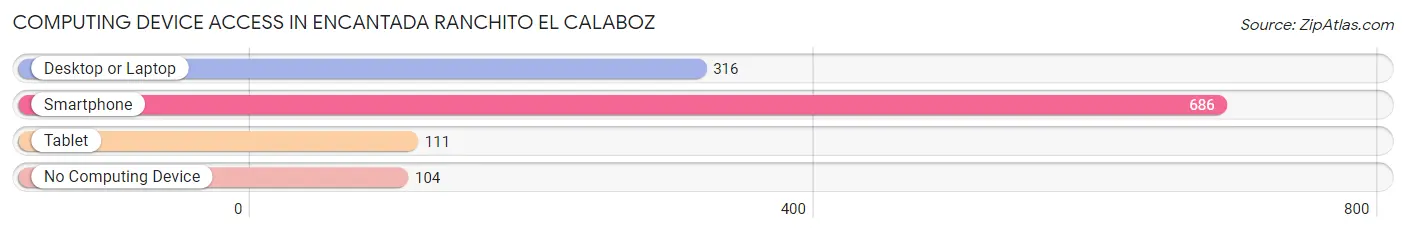
| Device Type | # Households | % Households |
| Desktop or Laptop | 316 | 39.2% |
| Smartphone | 686 | 85.1% |
| Tablet | 111 | 13.8% |
| No Computing Device | 104 | 12.9% |
| Total | 806 | 100.0% |
Internet Access in Encantada Ranchito El Calaboz
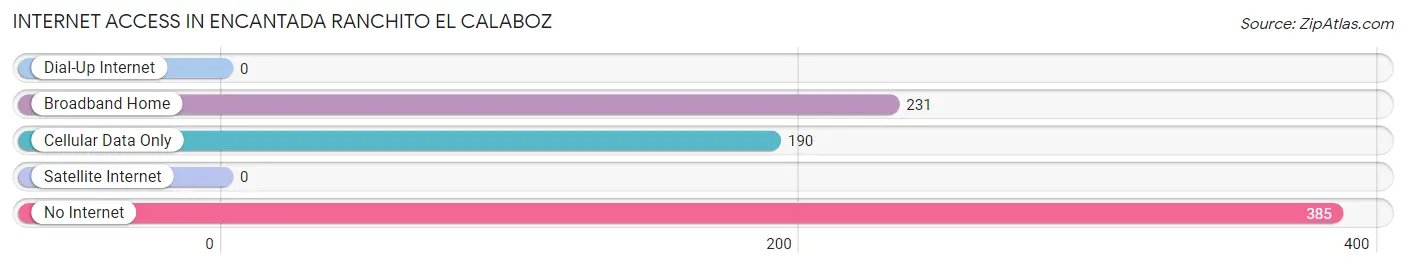
| Internet Type | # Households | % Households |
| Dial-Up Internet | 0 | 0.0% |
| Broadband Home | 231 | 28.7% |
| Cellular Data Only | 190 | 23.6% |
| Satellite Internet | 0 | 0.0% |
| No Internet | 385 | 47.8% |
| Total | 806 | 100.0% |
Encantada Ranchito El Calaboz Summary
Enchanted Ranchito El Calaboz, TX is a small unincorporated community located in the western part of Starr County, Texas. It is situated along the Rio Grande River, approximately 20 miles south of Rio Grande City. The community is part of the Rio Grande Valley, a region known for its rich cultural heritage and agricultural production.
History
Enchanted Ranchito El Calaboz, TX was founded in the late 19th century by a group of Mexican settlers. The settlers were attracted to the area due to its fertile soil and abundant water supply from the Rio Grande River. The community was originally known as El Calaboz, which translates to “the box” in English. The name was derived from the shape of the area, which resembled a box.
The community was initially a small farming village, with the majority of the population engaged in agricultural activities. The main crops grown in the area were corn, beans, and squash. The community also had a small number of cattle and sheep.
In the early 20th century, the community began to grow and develop. The population increased as more people moved to the area in search of work. The community also began to attract businesses, such as a general store, a post office, and a school.
Geography
Enchanted Ranchito El Calaboz, TX is located in the western part of Starr County, Texas. It is situated along the Rio Grande River, approximately 20 miles south of Rio Grande City. The community is part of the Rio Grande Valley, a region known for its rich cultural heritage and agricultural production.
The area is characterized by flat terrain, with an elevation of approximately 200 feet above sea level. The climate is semi-arid, with hot summers and mild winters. The average annual temperature is around 70 degrees Fahrenheit.
Economy
The economy of Enchanted Ranchito El Calaboz, TX is largely based on agriculture. The main crops grown in the area are corn, beans, and squash. The community also has a small number of cattle and sheep.
In addition to agriculture, the community also has a few small businesses, such as a general store, a post office, and a school. The community also has a few restaurants and bars.
Demographics
As of the 2010 census, the population of Enchanted Ranchito El Calaboz, TX was 1,845. The racial makeup of the community was 97.3% Hispanic or Latino, 1.2% White, 0.3% African American, 0.2% Native American, and 0.9% from other races.
The median household income in the community was $20,938, and the median family income was $25,000. The per capita income was $9,845. Approximately 28.3% of the population was below the poverty line.
Common Questions
What is Per Capita Income in Encantada Ranchito El Calaboz?
Per Capita income in Encantada Ranchito El Calaboz is $17,997.
What is the Median Family Income in Encantada Ranchito El Calaboz?
Median Family Income in Encantada Ranchito El Calaboz is $44,039.
What is the Median Household income in Encantada Ranchito El Calaboz?
Median Household Income in Encantada Ranchito El Calaboz is $43,177.
What is Income or Wage Gap in Encantada Ranchito El Calaboz?
Income or Wage Gap in Encantada Ranchito El Calaboz is 14.4%.
Women in Encantada Ranchito El Calaboz earn 85.6 cents for every dollar earned by a man.
What is Inequality or Gini Index in Encantada Ranchito El Calaboz?
Inequality or Gini Index in Encantada Ranchito El Calaboz is 0.30.
What is the Total Population of Encantada Ranchito El Calaboz?
Total Population of Encantada Ranchito El Calaboz is 2,063.
What is the Total Male Population of Encantada Ranchito El Calaboz?
Total Male Population of Encantada Ranchito El Calaboz is 886.
What is the Total Female Population of Encantada Ranchito El Calaboz?
Total Female Population of Encantada Ranchito El Calaboz is 1,177.
What is the Ratio of Males per 100 Females in Encantada Ranchito El Calaboz?
There are 75.28 Males per 100 Females in Encantada Ranchito El Calaboz.
What is the Ratio of Females per 100 Males in Encantada Ranchito El Calaboz?
There are 132.84 Females per 100 Males in Encantada Ranchito El Calaboz.
What is the Median Population Age in Encantada Ranchito El Calaboz?
Median Population Age in Encantada Ranchito El Calaboz is 45.6 Years.
What is the Average Family Size in Encantada Ranchito El Calaboz
Average Family Size in Encantada Ranchito El Calaboz is 3.2 People.
What is the Average Household Size in Encantada Ranchito El Calaboz
Average Household Size in Encantada Ranchito El Calaboz is 2.6 People.
How Large is the Labor Force in Encantada Ranchito El Calaboz?
There are 872 People in the Labor Forcein in Encantada Ranchito El Calaboz.
What is the Percentage of People in the Labor Force in Encantada Ranchito El Calaboz?
54.2% of People are in the Labor Force in Encantada Ranchito El Calaboz.