La Grulla, TX Map & Demographics
La Grulla Map
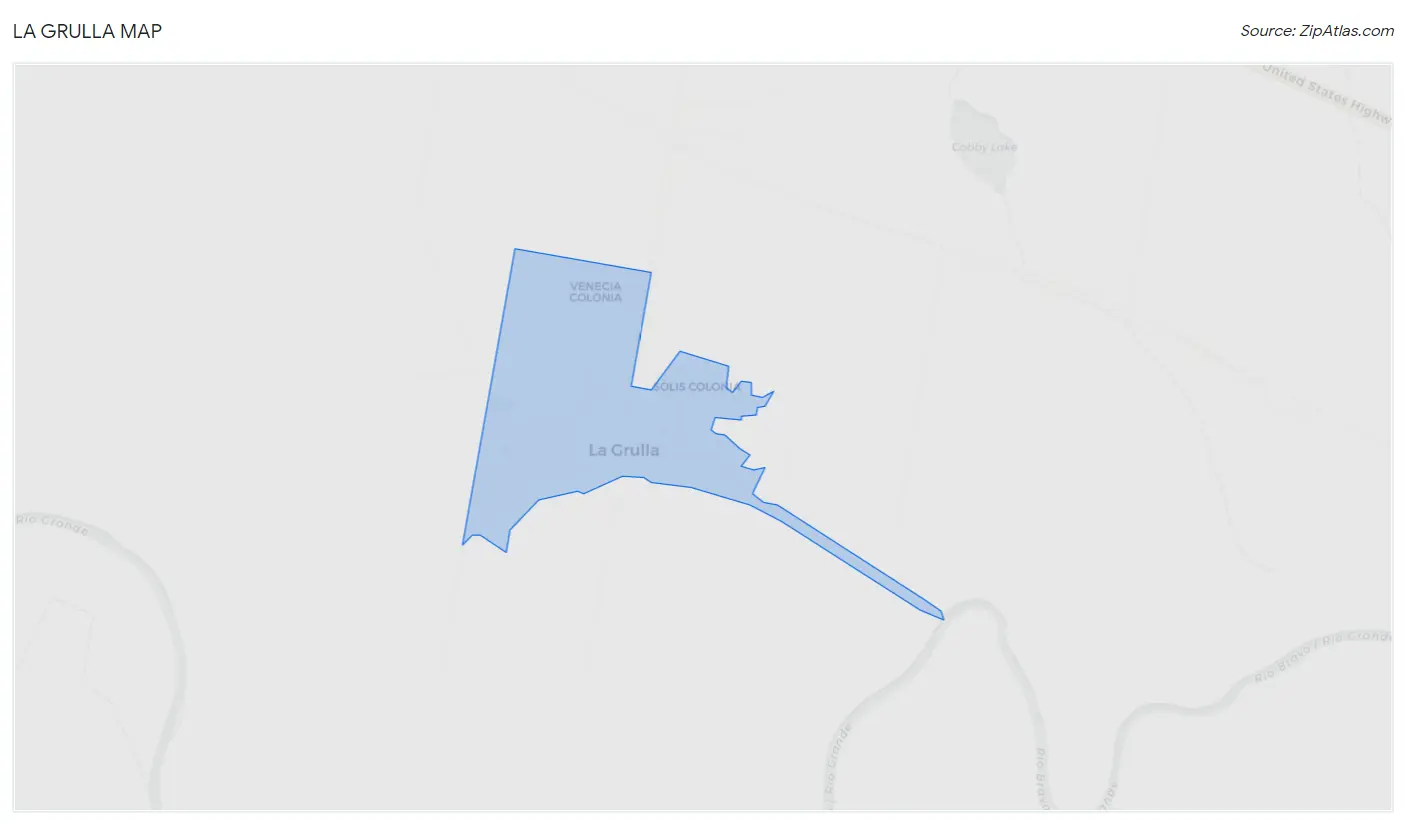
La Grulla Overview
$16,488
PER CAPITA INCOME
$44,397
AVG FAMILY INCOME
$38,611
AVG HOUSEHOLD INCOME
17.6%
WAGE / INCOME GAP [ % ]
82.4¢/ $1
WAGE / INCOME GAP [ $ ]
0.46
INEQUALITY / GINI INDEX
1,375
TOTAL POPULATION
710
MALE POPULATION
665
FEMALE POPULATION
106.77
MALES / 100 FEMALES
93.66
FEMALES / 100 MALES
30.0
MEDIAN AGE
3.5
AVG FAMILY SIZE
3.0
AVG HOUSEHOLD SIZE
568
LABOR FORCE [ PEOPLE ]
59.4%
PERCENT IN LABOR FORCE
8.1%
UNEMPLOYMENT RATE
La Grulla Area Codes
Income in La Grulla
Income Overview in La Grulla
Per Capita Income in La Grulla is $16,488, while median incomes of families and households are $44,397 and $38,611 respectively.
| Characteristic | Number | Measure |
| Per Capita Income | 1,375 | $16,488 |
| Median Family Income | 350 | $44,397 |
| Mean Family Income | 350 | $52,286 |
| Median Household Income | 462 | $38,611 |
| Mean Household Income | 462 | $47,566 |
| Income Deficit | 350 | $0 |
| Wage / Income Gap (%) | 1,375 | 17.62% |
| Wage / Income Gap ($) | 1,375 | 82.38¢ per $1 |
| Gini / Inequality Index | 1,375 | 0.46 |
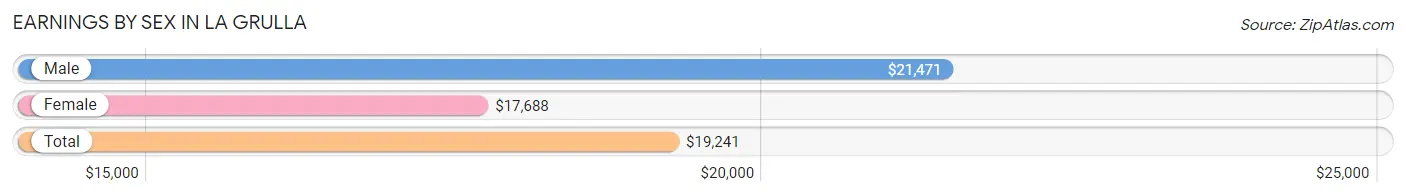
Earnings by Sex in La Grulla
Average Earnings in La Grulla are $19,241, $21,471 for men and $17,688 for women, a difference of 17.6%.
| Sex | Number | Average Earnings |
| Male | 262 (43.2%) | $21,471 |
| Female | 345 (56.8%) | $17,688 |
| Total | 607 (100.0%) | $19,241 |
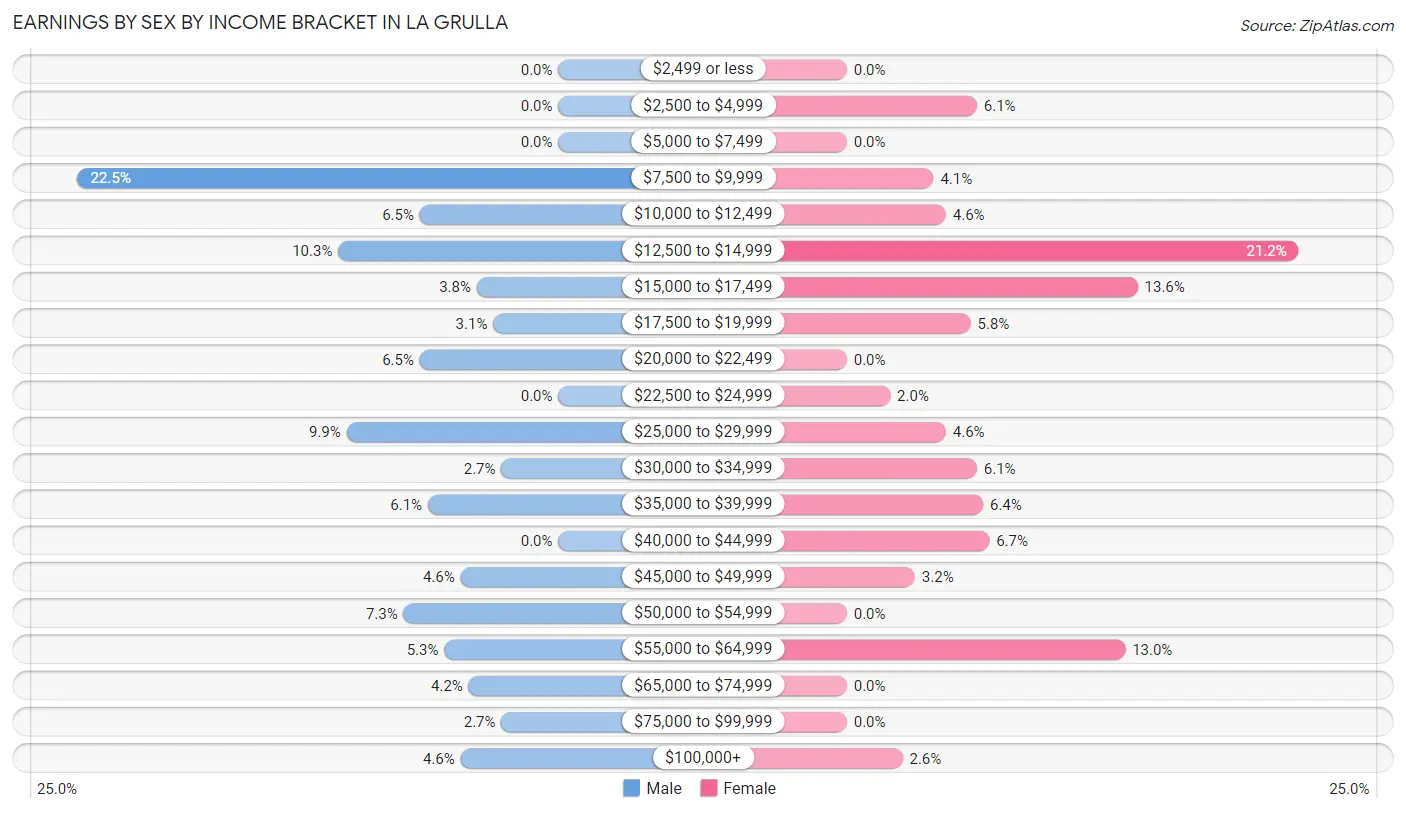
Earnings by Sex by Income Bracket in La Grulla
The most common earnings brackets in La Grulla are $7,500 to $9,999 for men (59 | 22.5%) and $12,500 to $14,999 for women (73 | 21.2%).
| Income | Male | Female |
| $2,499 or less | 0 (0.0%) | 0 (0.0%) |
| $2,500 to $4,999 | 0 (0.0%) | 21 (6.1%) |
| $5,000 to $7,499 | 0 (0.0%) | 0 (0.0%) |
| $7,500 to $9,999 | 59 (22.5%) | 14 (4.1%) |
| $10,000 to $12,499 | 17 (6.5%) | 16 (4.6%) |
| $12,500 to $14,999 | 27 (10.3%) | 73 (21.2%) |
| $15,000 to $17,499 | 10 (3.8%) | 47 (13.6%) |
| $17,500 to $19,999 | 8 (3.0%) | 20 (5.8%) |
| $20,000 to $22,499 | 17 (6.5%) | 0 (0.0%) |
| $22,500 to $24,999 | 0 (0.0%) | 7 (2.0%) |
| $25,000 to $29,999 | 26 (9.9%) | 16 (4.6%) |
| $30,000 to $34,999 | 7 (2.7%) | 21 (6.1%) |
| $35,000 to $39,999 | 16 (6.1%) | 22 (6.4%) |
| $40,000 to $44,999 | 0 (0.0%) | 23 (6.7%) |
| $45,000 to $49,999 | 12 (4.6%) | 11 (3.2%) |
| $50,000 to $54,999 | 19 (7.2%) | 0 (0.0%) |
| $55,000 to $64,999 | 14 (5.3%) | 45 (13.0%) |
| $65,000 to $74,999 | 11 (4.2%) | 0 (0.0%) |
| $75,000 to $99,999 | 7 (2.7%) | 0 (0.0%) |
| $100,000+ | 12 (4.6%) | 9 (2.6%) |
| Total | 262 (100.0%) | 345 (100.0%) |
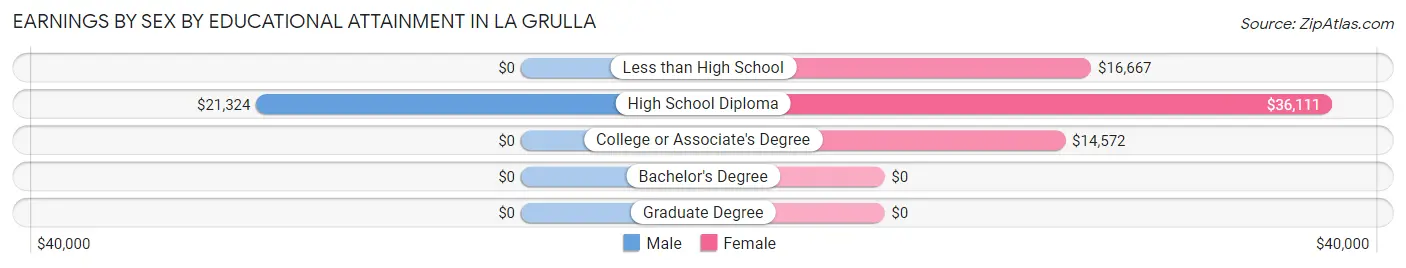
Earnings by Sex by Educational Attainment in La Grulla
Average earnings in La Grulla are $31,250 for men and $19,750 for women, a difference of 36.8%. Men with an educational attainment of high school diploma enjoy the highest average annual earnings of $21,324, while those with high school diploma education earn the least with $21,324. Women with an educational attainment of high school diploma earn the most with the average annual earnings of $36,111, while those with college or associate's degree education have the smallest earnings of $14,572.
| Educational Attainment | Male Income | Female Income |
| Less than High School | - | - |
| High School Diploma | $21,324 | $36,111 |
| College or Associate's Degree | - | - |
| Bachelor's Degree | - | - |
| Graduate Degree | - | - |
| Total | $31,250 | $19,750 |
Family Income in La Grulla
Family Income Brackets in La Grulla
According to the La Grulla family income data, there are 72 families falling into the $35,000 to $49,999 income range, which is the most common income bracket and makes up 20.6% of all families.
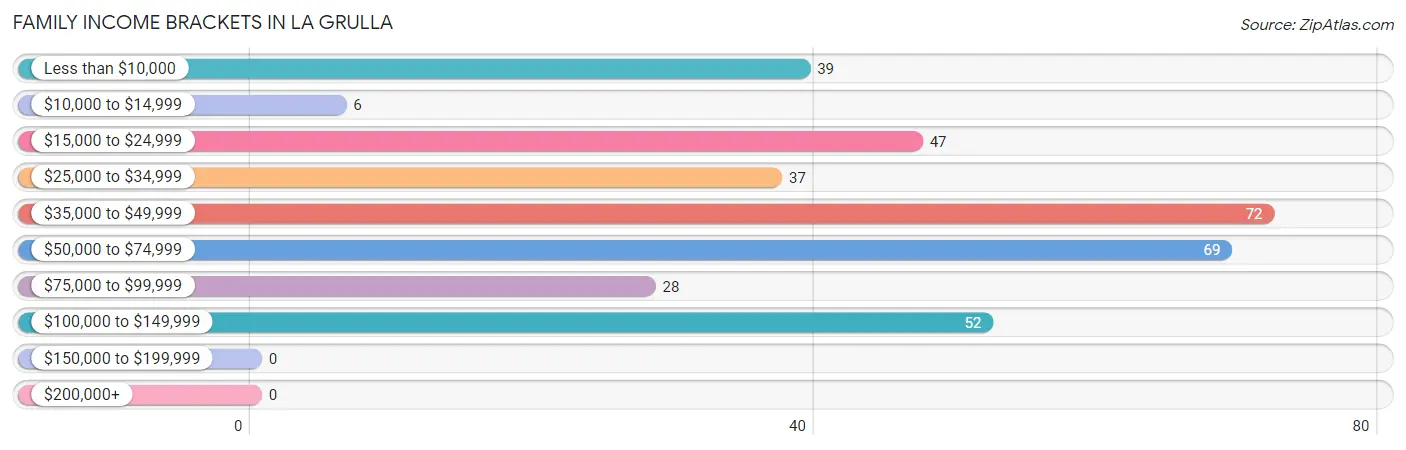
| Income Bracket | # Families | % Families |
| Less than $10,000 | 39 | 11.1% |
| $10,000 to $14,999 | 6 | 1.7% |
| $15,000 to $24,999 | 47 | 13.4% |
| $25,000 to $34,999 | 37 | 10.6% |
| $35,000 to $49,999 | 72 | 20.6% |
| $50,000 to $74,999 | 69 | 19.7% |
| $75,000 to $99,999 | 28 | 8.0% |
| $100,000 to $149,999 | 52 | 14.9% |
| $150,000 to $199,999 | 0 | 0.0% |
| $200,000+ | 0 | 0.0% |
Family Income by Famaliy Size in La Grulla
4-person families (91 | 26.0%) account for the highest median family income in La Grulla with $96,806 per family, while 4-person families (91 | 26.0%) have the highest median income of $24,202 per family member.
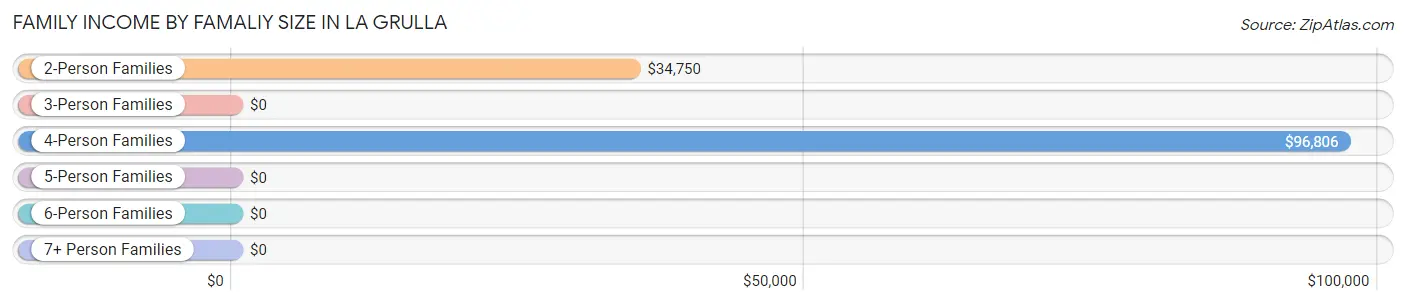
| Income Bracket | # Families | Median Income |
| 2-Person Families | 138 (39.4%) | $34,750 |
| 3-Person Families | 105 (30.0%) | $0 |
| 4-Person Families | 91 (26.0%) | $96,806 |
| 5-Person Families | 0 (0.0%) | $0 |
| 6-Person Families | 16 (4.6%) | $0 |
| 7+ Person Families | 0 (0.0%) | $0 |
| Total | 350 (100.0%) | $44,397 |
Family Income by Number of Earners in La Grulla
The median family income in La Grulla is $44,397, with families comprising 3+ earners (27) having the highest median family income of $76,094, while families with no earners (48) have the lowest median family income of $7,083, accounting for 7.7% and 13.7% of families, respectively.
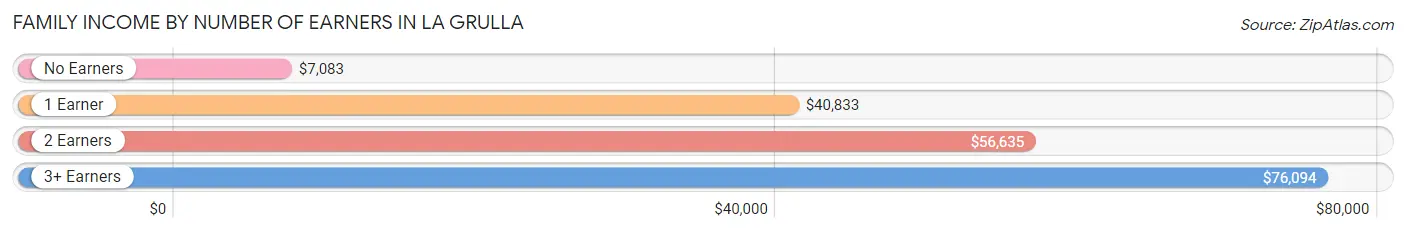
| Number of Earners | # Families | Median Income |
| No Earners | 48 (13.7%) | $7,083 |
| 1 Earner | 144 (41.1%) | $40,833 |
| 2 Earners | 131 (37.4%) | $56,635 |
| 3+ Earners | 27 (7.7%) | $76,094 |
| Total | 350 (100.0%) | $44,397 |
Household Income in La Grulla
Household Income Brackets in La Grulla
With 81 households falling in the category, the $35,000 to $49,999 income range is the most frequent in La Grulla, accounting for 17.5% of all households.
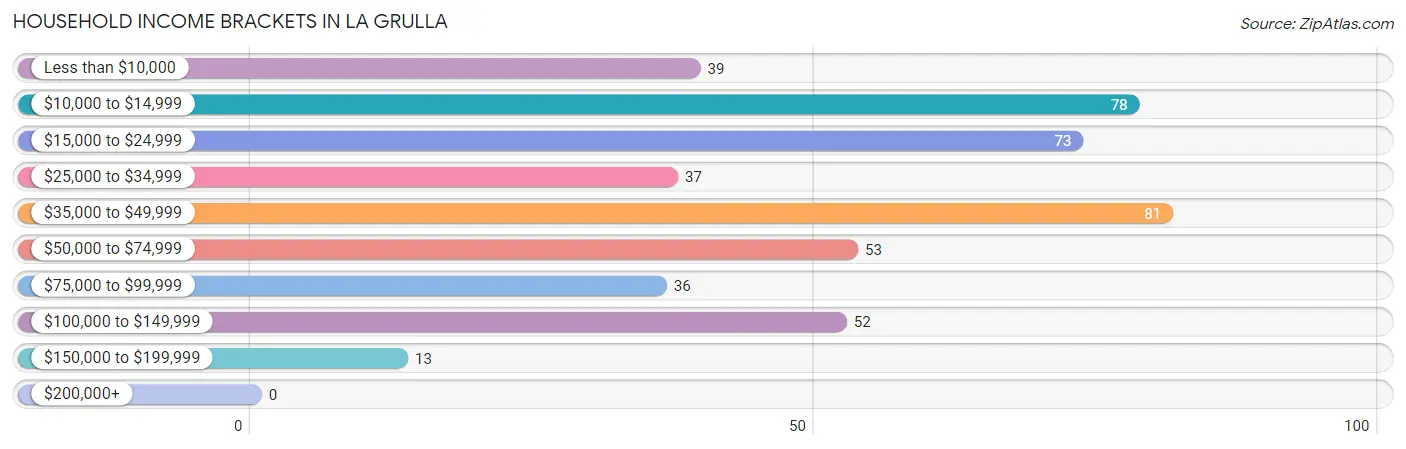
| Income Bracket | # Households | % Households |
| Less than $10,000 | 39 | 8.4% |
| $10,000 to $14,999 | 78 | 16.9% |
| $15,000 to $24,999 | 73 | 15.8% |
| $25,000 to $34,999 | 37 | 8.0% |
| $35,000 to $49,999 | 81 | 17.5% |
| $50,000 to $74,999 | 53 | 11.5% |
| $75,000 to $99,999 | 36 | 7.8% |
| $100,000 to $149,999 | 52 | 11.3% |
| $150,000 to $199,999 | 13 | 2.8% |
| $200,000+ | 0 | 0.0% |
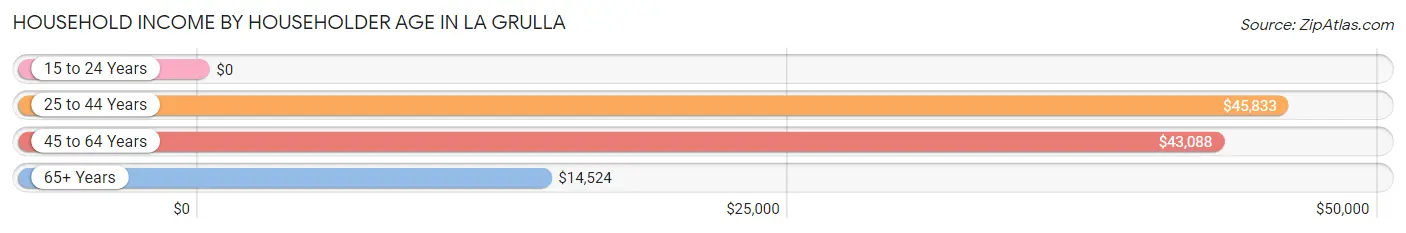
Household Income by Householder Age in La Grulla
The median household income in La Grulla is $38,611, with the highest median household income of $45,833 found in the 25 to 44 years age bracket for the primary householder. A total of 98 households (21.2%) fall into this category.
| Income Bracket | # Households | Median Income |
| 15 to 24 Years | 0 (0.0%) | $0 |
| 25 to 44 Years | 98 (21.2%) | $45,833 |
| 45 to 64 Years | 212 (45.9%) | $43,088 |
| 65+ Years | 152 (32.9%) | $14,524 |
| Total | 462 (100.0%) | $38,611 |
Poverty in La Grulla
Income Below Poverty by Sex and Age in La Grulla
With 20.8% poverty level for males and 29.2% for females among the residents of La Grulla, 5 year old males and 12 to 14 year old females are the most vulnerable to poverty, with 13 males (100.0%) and 32 females (69.6%) in their respective age groups living below the poverty level.
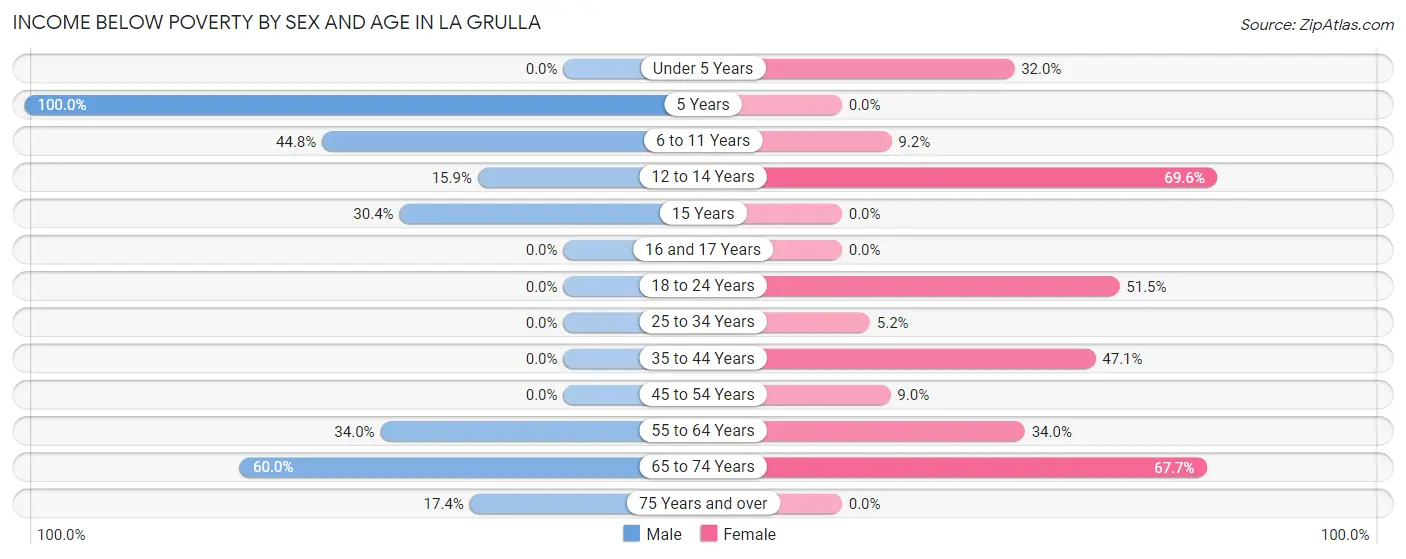
| Age Bracket | Male | Female |
| Under 5 Years | 0 (0.0%) | 8 (32.0%) |
| 5 Years | 13 (100.0%) | 0 (0.0%) |
| 6 to 11 Years | 30 (44.8%) | 7 (9.2%) |
| 12 to 14 Years | 17 (15.9%) | 32 (69.6%) |
| 15 Years | 14 (30.4%) | 0 (0.0%) |
| 16 and 17 Years | 0 (0.0%) | 0 (0.0%) |
| 18 to 24 Years | 0 (0.0%) | 17 (51.5%) |
| 25 to 34 Years | 0 (0.0%) | 5 (5.2%) |
| 35 to 44 Years | 0 (0.0%) | 32 (47.1%) |
| 45 to 54 Years | 0 (0.0%) | 11 (9.0%) |
| 55 to 64 Years | 36 (34.0%) | 36 (34.0%) |
| 65 to 74 Years | 30 (60.0%) | 46 (67.6%) |
| 75 Years and over | 8 (17.4%) | 0 (0.0%) |
| Total | 148 (20.8%) | 194 (29.2%) |
Income Above Poverty by Sex and Age in La Grulla
According to the poverty statistics in La Grulla, males aged under 5 years and females aged 5 years are the age groups that are most secure financially, with 100.0% of males and 100.0% of females in these age groups living above the poverty line.
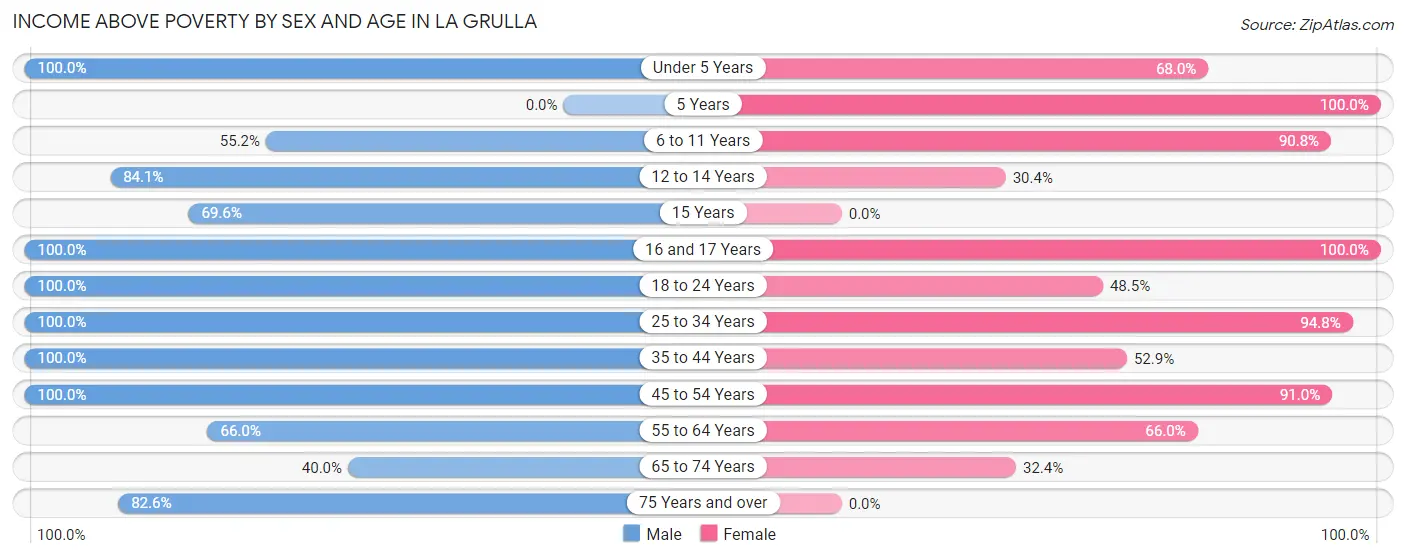
| Age Bracket | Male | Female |
| Under 5 Years | 25 (100.0%) | 17 (68.0%) |
| 5 Years | 0 (0.0%) | 14 (100.0%) |
| 6 to 11 Years | 37 (55.2%) | 69 (90.8%) |
| 12 to 14 Years | 90 (84.1%) | 14 (30.4%) |
| 15 Years | 32 (69.6%) | 0 (0.0%) |
| 16 and 17 Years | 19 (100.0%) | 11 (100.0%) |
| 18 to 24 Years | 119 (100.0%) | 16 (48.5%) |
| 25 to 34 Years | 26 (100.0%) | 91 (94.8%) |
| 35 to 44 Years | 49 (100.0%) | 36 (52.9%) |
| 45 to 54 Years | 37 (100.0%) | 111 (91.0%) |
| 55 to 64 Years | 70 (66.0%) | 70 (66.0%) |
| 65 to 74 Years | 20 (40.0%) | 22 (32.4%) |
| 75 Years and over | 38 (82.6%) | 0 (0.0%) |
| Total | 562 (79.1%) | 471 (70.8%) |
Income Below Poverty Among Married-Couple Families in La Grulla
The poverty statistics for married-couple families in La Grulla show that 14.7% or 25 of the total 170 families live below the poverty line. Families with no children have the highest poverty rate of 24.5%, comprising of 25 families. On the other hand, families with 1 or 2 children have the lowest poverty rate of 0.0%, which includes 0 families.
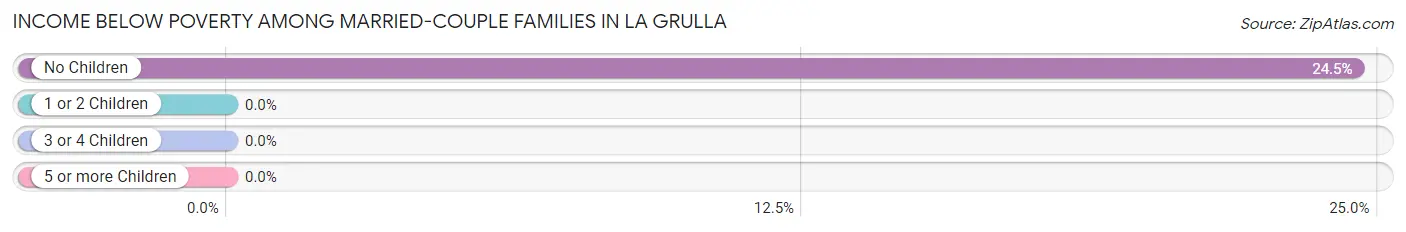
| Children | Above Poverty | Below Poverty |
| No Children | 77 (75.5%) | 25 (24.5%) |
| 1 or 2 Children | 52 (100.0%) | 0 (0.0%) |
| 3 or 4 Children | 16 (100.0%) | 0 (0.0%) |
| 5 or more Children | 0 (0.0%) | 0 (0.0%) |
| Total | 145 (85.3%) | 25 (14.7%) |
Income Below Poverty Among Single-Parent Households in La Grulla
According to the poverty data in La Grulla, 23.7% or 9 single-father households and 34.5% or 49 single-mother households are living below the poverty line. Among single-father households, those with 1 or 2 children have the highest poverty rate, with 9 households (100.0%) experiencing poverty. Likewise, among single-mother households, those with 1 or 2 children have the highest poverty rate, with 49 households (47.1%) falling below the poverty line.
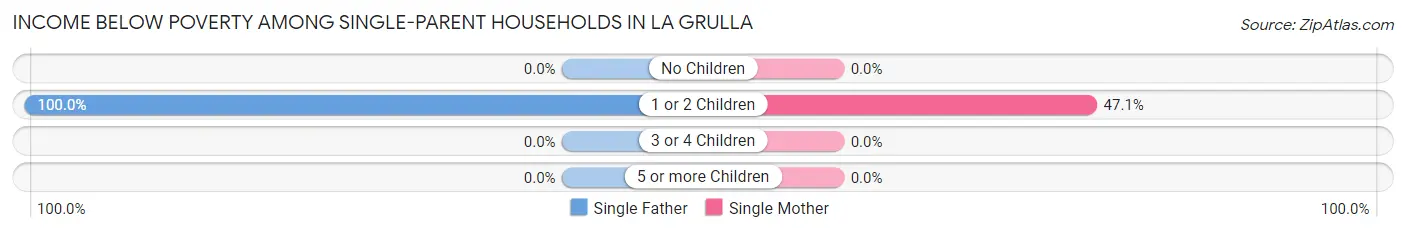
| Children | Single Father | Single Mother |
| No Children | 0 (0.0%) | 0 (0.0%) |
| 1 or 2 Children | 9 (100.0%) | 49 (47.1%) |
| 3 or 4 Children | 0 (0.0%) | 0 (0.0%) |
| 5 or more Children | 0 (0.0%) | 0 (0.0%) |
| Total | 9 (23.7%) | 49 (34.5%) |
Income Below Poverty Among Married-Couple vs Single-Parent Households in La Grulla
The poverty data for La Grulla shows that 25 of the married-couple family households (14.7%) and 58 of the single-parent households (32.2%) are living below the poverty level. Within the married-couple family households, those with no children have the highest poverty rate, with 25 households (24.5%) falling below the poverty line. Among the single-parent households, those with 1 or 2 children have the highest poverty rate, with 58 household (51.3%) living below poverty.
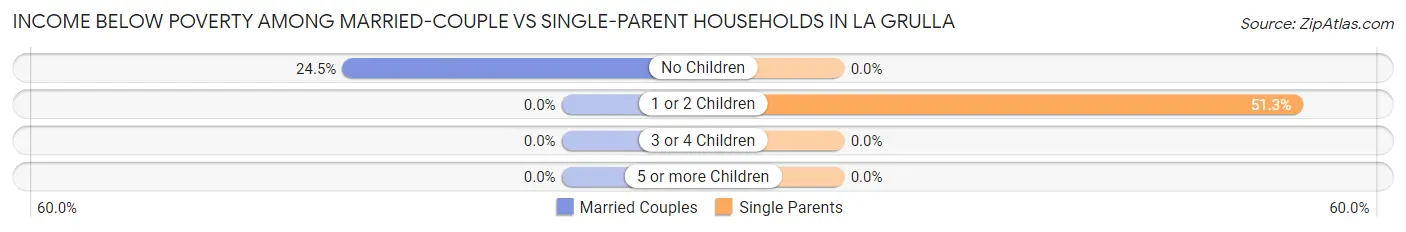
| Children | Married-Couple Families | Single-Parent Households |
| No Children | 25 (24.5%) | 0 (0.0%) |
| 1 or 2 Children | 0 (0.0%) | 58 (51.3%) |
| 3 or 4 Children | 0 (0.0%) | 0 (0.0%) |
| 5 or more Children | 0 (0.0%) | 0 (0.0%) |
| Total | 25 (14.7%) | 58 (32.2%) |
Race in La Grulla
The most populous races in La Grulla are Hispanic or Latino (1,375 | 100.0%), Two or more Races (728 | 52.9%), and White / Caucasian (647 | 47.0%).
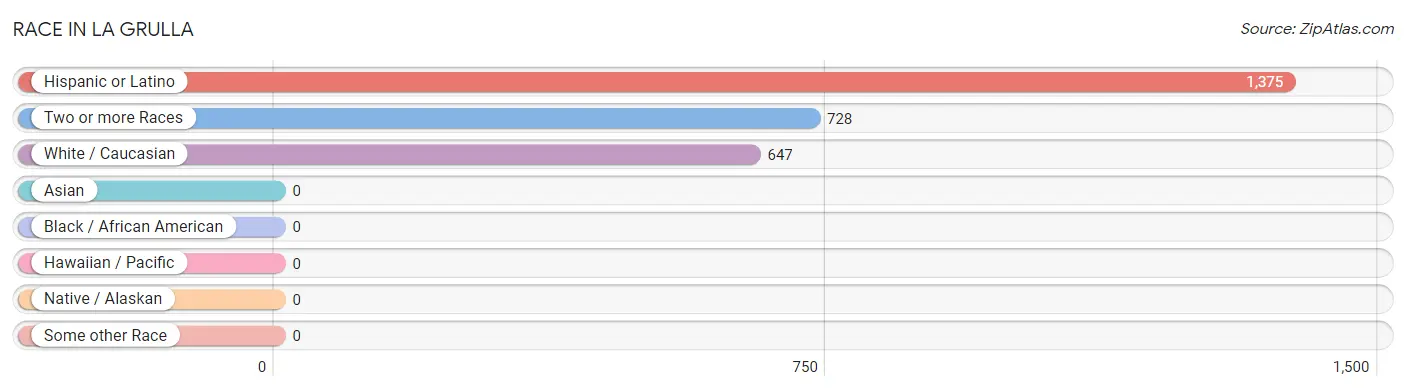
| Race | # Population | % Population |
| Asian | 0 | 0.0% |
| Black / African American | 0 | 0.0% |
| Hawaiian / Pacific | 0 | 0.0% |
| Hispanic or Latino | 1,375 | 100.0% |
| Native / Alaskan | 0 | 0.0% |
| White / Caucasian | 647 | 47.0% |
| Two or more Races | 728 | 52.9% |
| Some other Race | 0 | 0.0% |
| Total | 1,375 | 100.0% |
Ancestry in La Grulla
The most populous ancestries reported in La Grulla are Mexican (1,224 | 89.0%), and Spaniard (132 | 9.6%), together accounting for 98.6% of all La Grulla residents.
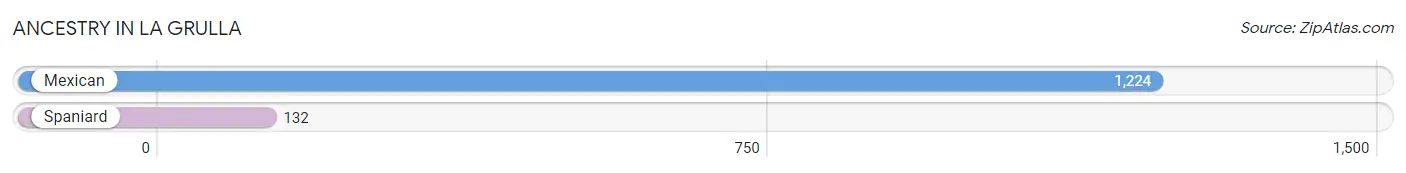
| Ancestry | # Population | % Population |
| Mexican | 1,224 | 89.0% |
| Spaniard | 132 | 9.6% | View All 2 Rows |
Immigrants in La Grulla
The most numerous immigrant groups reported in La Grulla came from Central America (231 | 16.8%), Latin America (231 | 16.8%), and Mexico (231 | 16.8%), together accounting for 50.4% of all La Grulla residents.
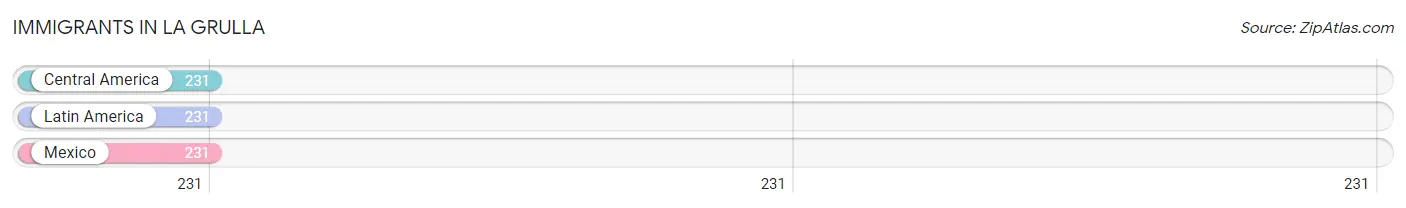
| Immigration Origin | # Population | % Population |
| Central America | 231 | 16.8% |
| Latin America | 231 | 16.8% |
| Mexico | 231 | 16.8% | View All 3 Rows |
Sex and Age in La Grulla
Sex and Age in La Grulla
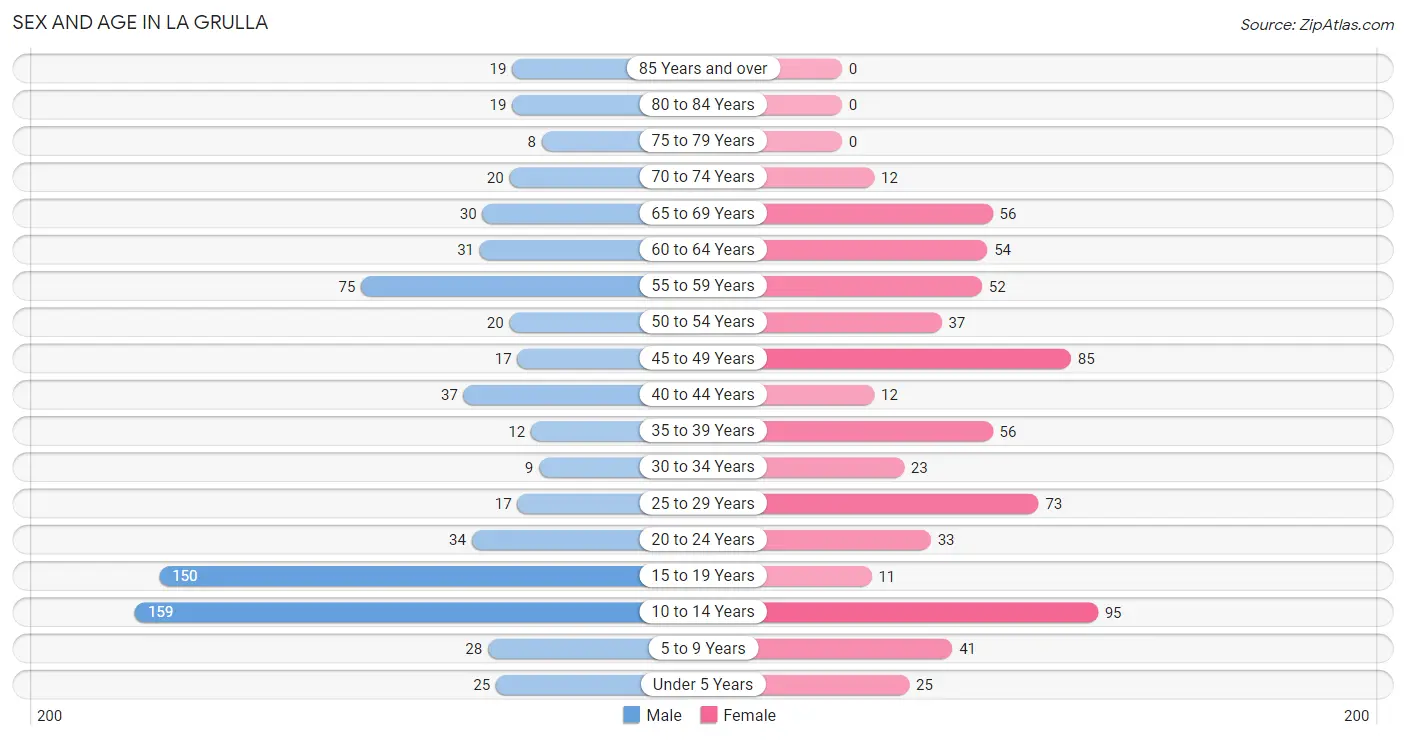
The most populous age groups in La Grulla are 10 to 14 Years (159 | 22.4%) for men and 10 to 14 Years (95 | 14.3%) for women.
| Age Bracket | Male | Female |
| Under 5 Years | 25 (3.5%) | 25 (3.8%) |
| 5 to 9 Years | 28 (3.9%) | 41 (6.2%) |
| 10 to 14 Years | 159 (22.4%) | 95 (14.3%) |
| 15 to 19 Years | 150 (21.1%) | 11 (1.7%) |
| 20 to 24 Years | 34 (4.8%) | 33 (5.0%) |
| 25 to 29 Years | 17 (2.4%) | 73 (11.0%) |
| 30 to 34 Years | 9 (1.3%) | 23 (3.5%) |
| 35 to 39 Years | 12 (1.7%) | 56 (8.4%) |
| 40 to 44 Years | 37 (5.2%) | 12 (1.8%) |
| 45 to 49 Years | 17 (2.4%) | 85 (12.8%) |
| 50 to 54 Years | 20 (2.8%) | 37 (5.6%) |
| 55 to 59 Years | 75 (10.6%) | 52 (7.8%) |
| 60 to 64 Years | 31 (4.4%) | 54 (8.1%) |
| 65 to 69 Years | 30 (4.2%) | 56 (8.4%) |
| 70 to 74 Years | 20 (2.8%) | 12 (1.8%) |
| 75 to 79 Years | 8 (1.1%) | 0 (0.0%) |
| 80 to 84 Years | 19 (2.7%) | 0 (0.0%) |
| 85 Years and over | 19 (2.7%) | 0 (0.0%) |
| Total | 710 (100.0%) | 665 (100.0%) |
Families and Households in La Grulla
Median Family Size in La Grulla
The median family size in La Grulla is 3.50 persons per family, with single female/mother families (142 | 40.6%) accounting for the largest median family size of 4.17 persons per family. On the other hand, single male/father families (38 | 10.9%) represent the smallest median family size with 2.58 persons per family.
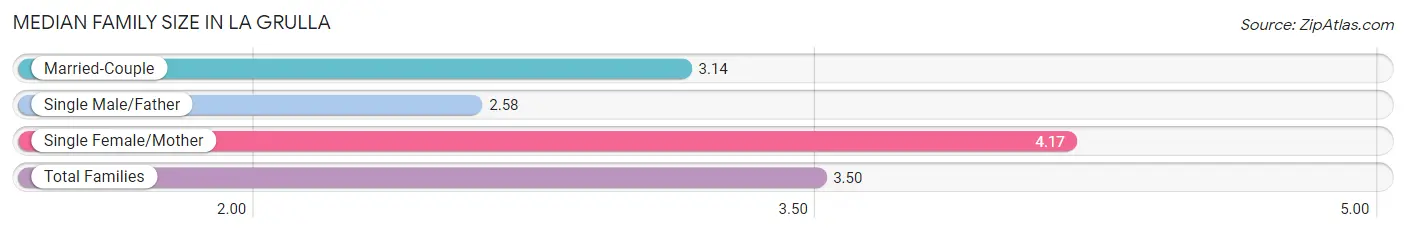
| Family Type | # Families | Family Size |
| Married-Couple | 170 (48.6%) | 3.14 |
| Single Male/Father | 38 (10.9%) | 2.58 |
| Single Female/Mother | 142 (40.6%) | 4.17 |
| Total Families | 350 (100.0%) | 3.50 |
Median Household Size in La Grulla
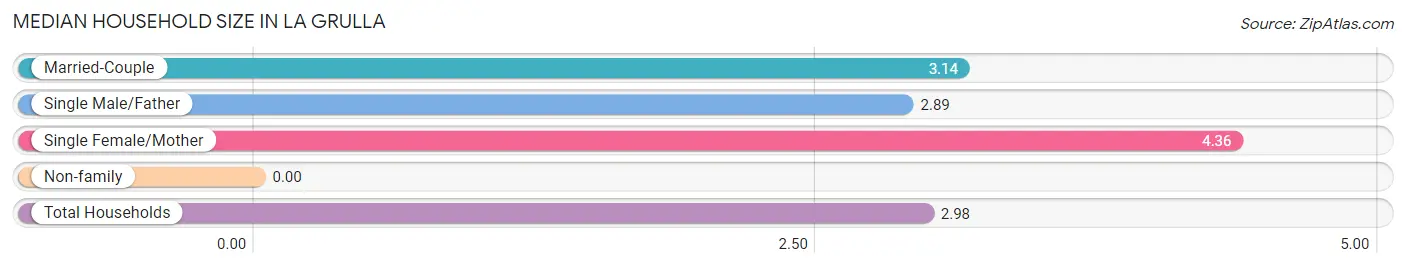
| Household Type | # Households | Household Size |
| Married-Couple | 170 (36.8%) | 3.14 |
| Single Male/Father | 38 (8.2%) | 2.89 |
| Single Female/Mother | 142 (30.7%) | 4.36 |
| Non-family | 112 (24.2%) | - |
| Total Households | 462 (100.0%) | 2.98 |
Household Size by Marriage Status in La Grulla
Out of a total of 462 households in La Grulla, 350 (75.8%) are family households, while 112 (24.2%) are nonfamily households. The most numerous type of family households are 2-person households, comprising 129, and the most common type of nonfamily households are 1-person households, comprising 112.
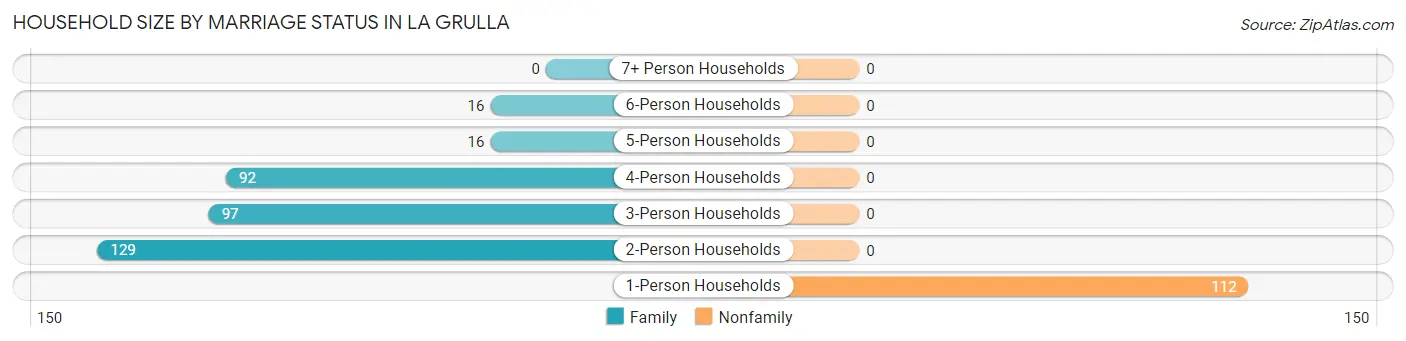
| Household Size | Family Households | Nonfamily Households |
| 1-Person Households | - | 112 (24.2%) |
| 2-Person Households | 129 (27.9%) | 0 (0.0%) |
| 3-Person Households | 97 (21.0%) | 0 (0.0%) |
| 4-Person Households | 92 (19.9%) | 0 (0.0%) |
| 5-Person Households | 16 (3.5%) | 0 (0.0%) |
| 6-Person Households | 16 (3.5%) | 0 (0.0%) |
| 7+ Person Households | 0 (0.0%) | 0 (0.0%) |
| Total | 350 (75.8%) | 112 (24.2%) |
Female Fertility in La Grulla
Fertility by Age in La Grulla
Average fertility rate in La Grulla is 41.0 births per 1,000 women. Women in the age bracket of 20 to 34 years have the highest fertility rate with 93.0 births per 1,000 women. Women in the age bracket of 20 to 34 years acount for 100.0% of all women with births.
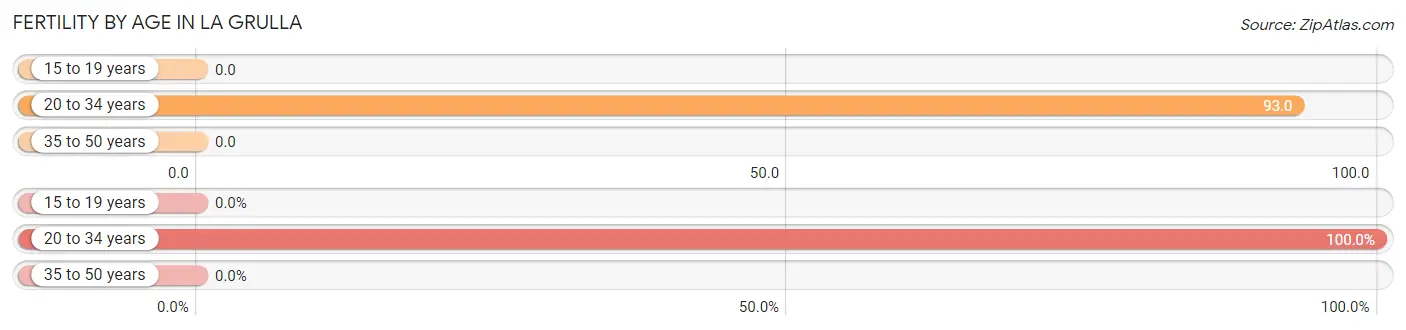
| Age Bracket | Women with Births | Births / 1,000 Women |
| 15 to 19 years | 0 (0.0%) | 0.0 |
| 20 to 34 years | 12 (100.0%) | 93.0 |
| 35 to 50 years | 0 (0.0%) | 0.0 |
| Total | 12 (100.0%) | 41.0 |
Fertility by Age by Marriage Status in La Grulla
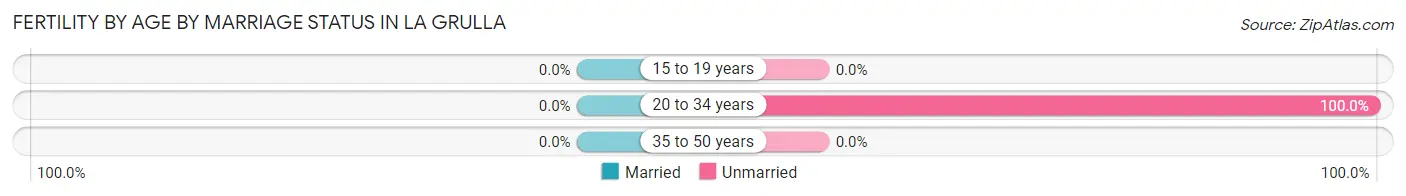
| Age Bracket | Married | Unmarried |
| 15 to 19 years | 0 (0.0%) | 0 (0.0%) |
| 20 to 34 years | 0 (0.0%) | 12 (100.0%) |
| 35 to 50 years | 0 (0.0%) | 0 (0.0%) |
| Total | 0 (0.0%) | 12 (100.0%) |
Fertility by Education in La Grulla
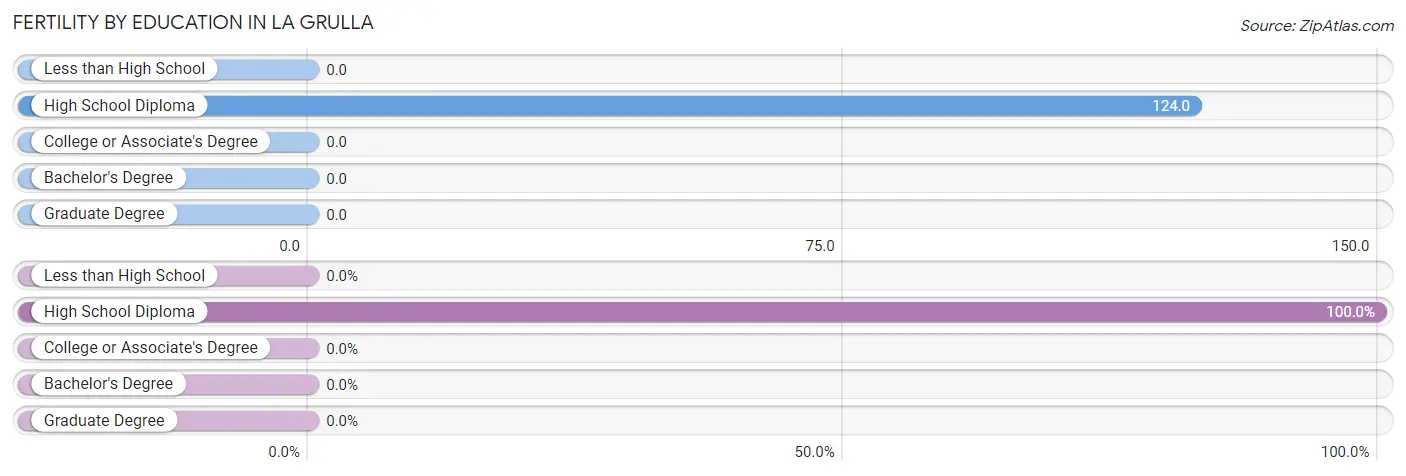
| Educational Attainment | Women with Births | Births / 1,000 Women |
| Less than High School | 0 (0.0%) | 0.0 |
| High School Diploma | 12 (100.0%) | 124.0 |
| College or Associate's Degree | 0 (0.0%) | 0.0 |
| Bachelor's Degree | 0 (0.0%) | 0.0 |
| Graduate Degree | 0 (0.0%) | 0.0 |
| Total | 12 (100.0%) | 41.0 |
Fertility by Education by Marriage Status in La Grulla
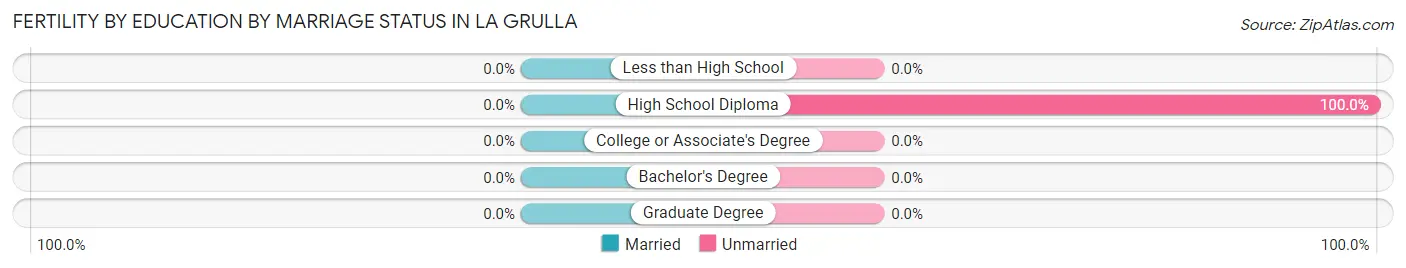
| Educational Attainment | Married | Unmarried |
| Less than High School | 0 (0.0%) | 0 (0.0%) |
| High School Diploma | 0 (0.0%) | 12 (100.0%) |
| College or Associate's Degree | 0 (0.0%) | 0 (0.0%) |
| Bachelor's Degree | 0 (0.0%) | 0 (0.0%) |
| Graduate Degree | 0 (0.0%) | 0 (0.0%) |
| Total | 0 (0.0%) | 12 (100.0%) |
Employment Characteristics in La Grulla
Employment by Class of Employer in La Grulla
Among the 522 employed individuals in La Grulla, private company employees (311 | 59.6%), not-for-profit organizations (96 | 18.4%), and state government employees (42 | 8.1%) make up the most common classes of employment.
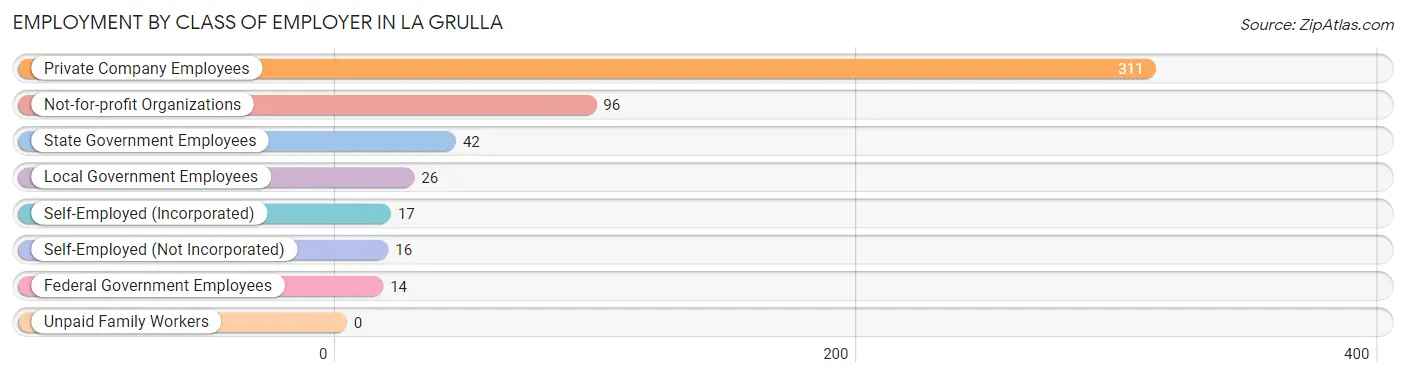
| Employer Class | # Employees | % Employees |
| Private Company Employees | 311 | 59.6% |
| Self-Employed (Incorporated) | 17 | 3.3% |
| Self-Employed (Not Incorporated) | 16 | 3.1% |
| Not-for-profit Organizations | 96 | 18.4% |
| Local Government Employees | 26 | 5.0% |
| State Government Employees | 42 | 8.1% |
| Federal Government Employees | 14 | 2.7% |
| Unpaid Family Workers | 0 | 0.0% |
| Total | 522 | 100.0% |
Employment Status by Age in La Grulla
According to the labor force statistics for La Grulla, out of the total population over 16 years of age (956), 59.4% or 568 individuals are in the labor force, with 8.1% or 46 of them unemployed. The age group with the highest labor force participation rate is 25 to 29 years, with 100.0% or 90 individuals in the labor force. Within the labor force, the 60 to 64 years age range has the highest percentage of unemployed individuals, with 28.6% or 8 of them being unemployed.
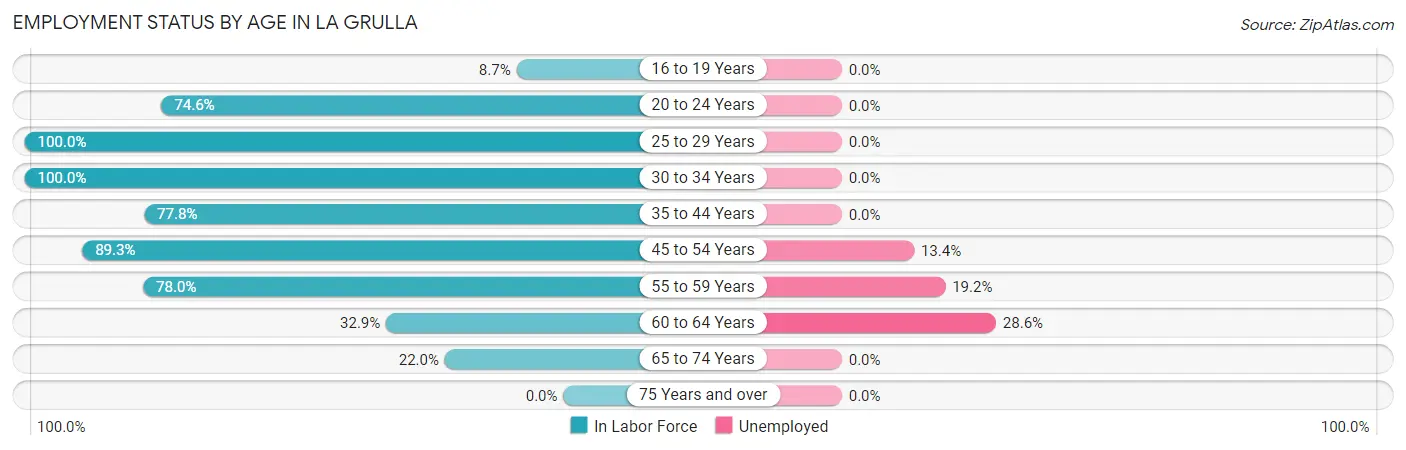
| Age Bracket | In Labor Force | Unemployed |
| 16 to 19 Years | 10 (8.7%) | 0 (0.0%) |
| 20 to 24 Years | 50 (74.6%) | 0 (0.0%) |
| 25 to 29 Years | 90 (100.0%) | 0 (0.0%) |
| 30 to 34 Years | 32 (100.0%) | 0 (0.0%) |
| 35 to 44 Years | 91 (77.8%) | 0 (0.0%) |
| 45 to 54 Years | 142 (89.3%) | 19 (13.4%) |
| 55 to 59 Years | 99 (78.0%) | 19 (19.2%) |
| 60 to 64 Years | 28 (32.9%) | 8 (28.6%) |
| 65 to 74 Years | 26 (22.0%) | 0 (0.0%) |
| 75 Years and over | 0 (0.0%) | 0 (0.0%) |
| Total | 568 (59.4%) | 46 (8.1%) |
Employment Status by Educational Attainment in La Grulla
According to labor force statistics for La Grulla, 79.0% of individuals (482) out of the total population between 25 and 64 years of age (610) are in the labor force, with 9.5% or 46 of them being unemployed. The group with the highest labor force participation rate are those with the educational attainment of bachelor's degree or higher, with 100.0% or 9 individuals in the labor force. Within the labor force, individuals with less than high school education have the highest percentage of unemployment, with 18.6% or 18 of them being unemployed.
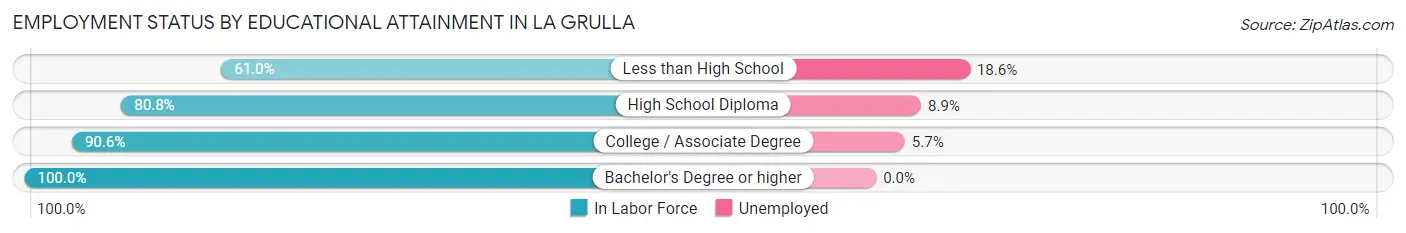
| Educational Attainment | In Labor Force | Unemployed |
| Less than High School | 97 (61.0%) | 30 (18.6%) |
| High School Diploma | 202 (80.8%) | 22 (8.9%) |
| College / Associate Degree | 174 (90.6%) | 11 (5.7%) |
| Bachelor's Degree or higher | 9 (100.0%) | 0 (0.0%) |
| Total | 482 (79.0%) | 58 (9.5%) |
Employment Occupations by Sex in La Grulla
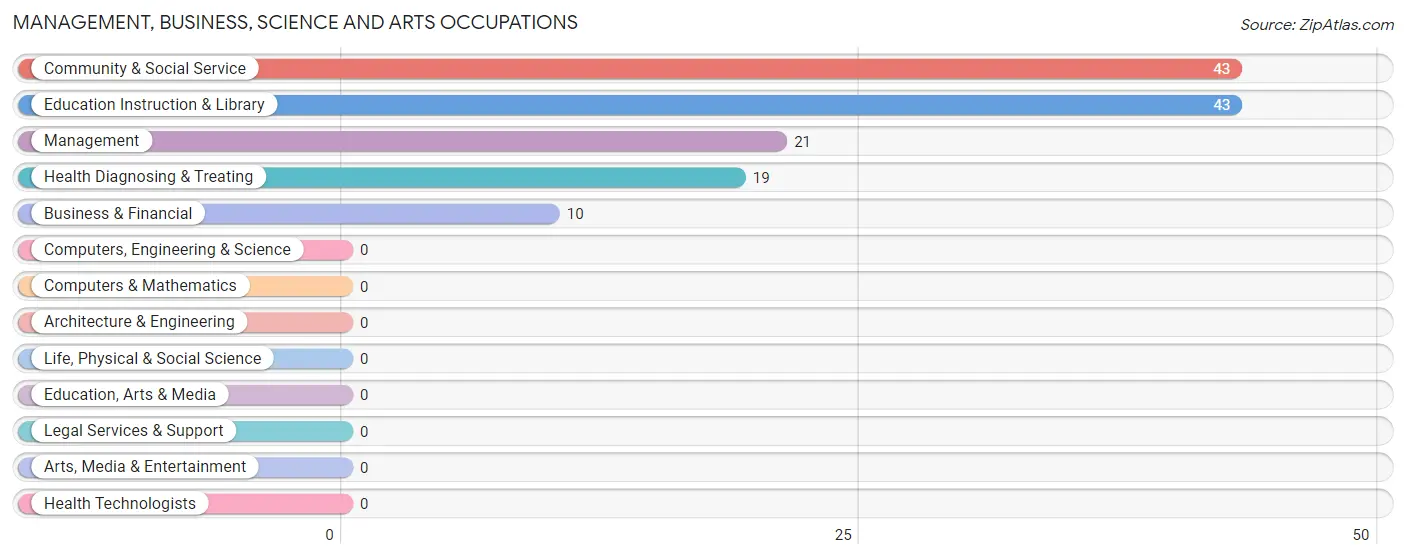
Management, Business, Science and Arts Occupations
The most common Management, Business, Science and Arts occupations in La Grulla are Community & Social Service (43 | 8.2%), Education Instruction & Library (43 | 8.2%), Management (21 | 4.0%), Health Diagnosing & Treating (19 | 3.6%), and Business & Financial (10 | 1.9%).
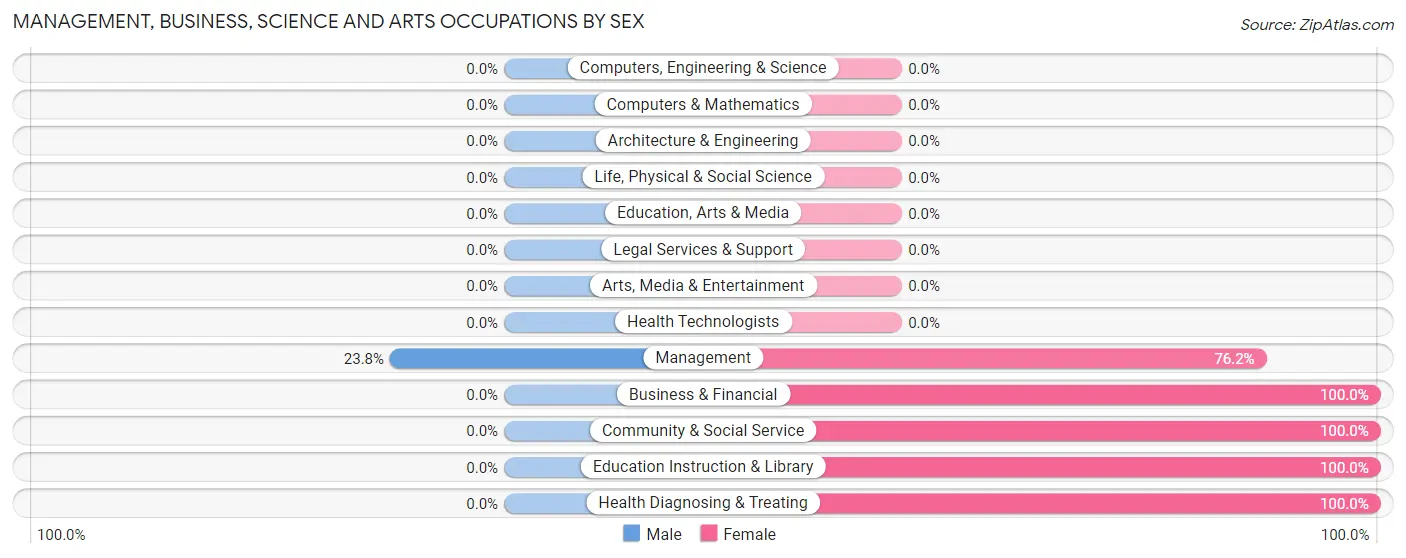
Management, Business, Science and Arts Occupations by Sex
| Occupation | Male | Female |
| Management | 5 (23.8%) | 16 (76.2%) |
| Business & Financial | 0 (0.0%) | 10 (100.0%) |
| Computers, Engineering & Science | 0 (0.0%) | 0 (0.0%) |
| Computers & Mathematics | 0 (0.0%) | 0 (0.0%) |
| Architecture & Engineering | 0 (0.0%) | 0 (0.0%) |
| Life, Physical & Social Science | 0 (0.0%) | 0 (0.0%) |
| Community & Social Service | 0 (0.0%) | 43 (100.0%) |
| Education, Arts & Media | 0 (0.0%) | 0 (0.0%) |
| Legal Services & Support | 0 (0.0%) | 0 (0.0%) |
| Education Instruction & Library | 0 (0.0%) | 43 (100.0%) |
| Arts, Media & Entertainment | 0 (0.0%) | 0 (0.0%) |
| Health Diagnosing & Treating | 0 (0.0%) | 19 (100.0%) |
| Health Technologists | 0 (0.0%) | 0 (0.0%) |
| Total (Category) | 5 (5.4%) | 88 (94.6%) |
| Total (Overall) | 196 (37.6%) | 326 (62.5%) |
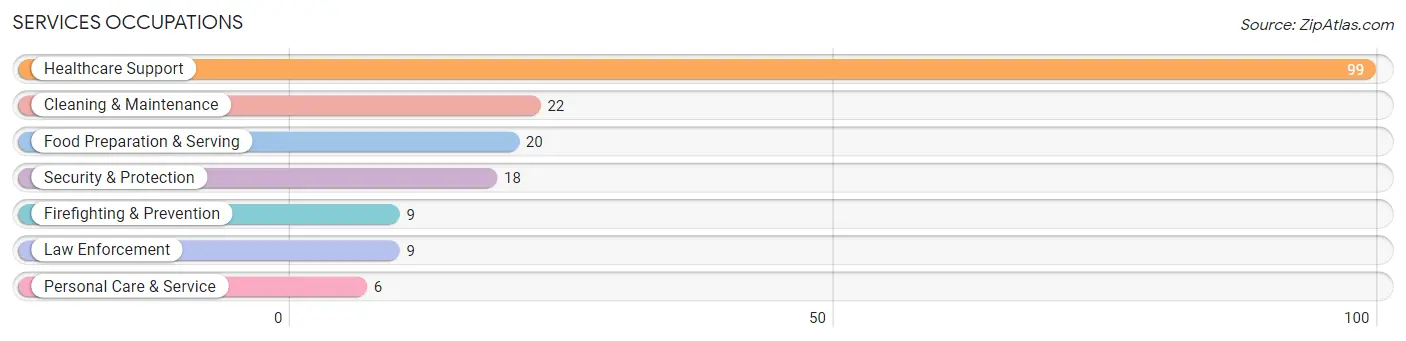
Services Occupations
The most common Services occupations in La Grulla are Healthcare Support (99 | 19.0%), Cleaning & Maintenance (22 | 4.2%), Food Preparation & Serving (20 | 3.8%), Security & Protection (18 | 3.5%), and Firefighting & Prevention (9 | 1.7%).
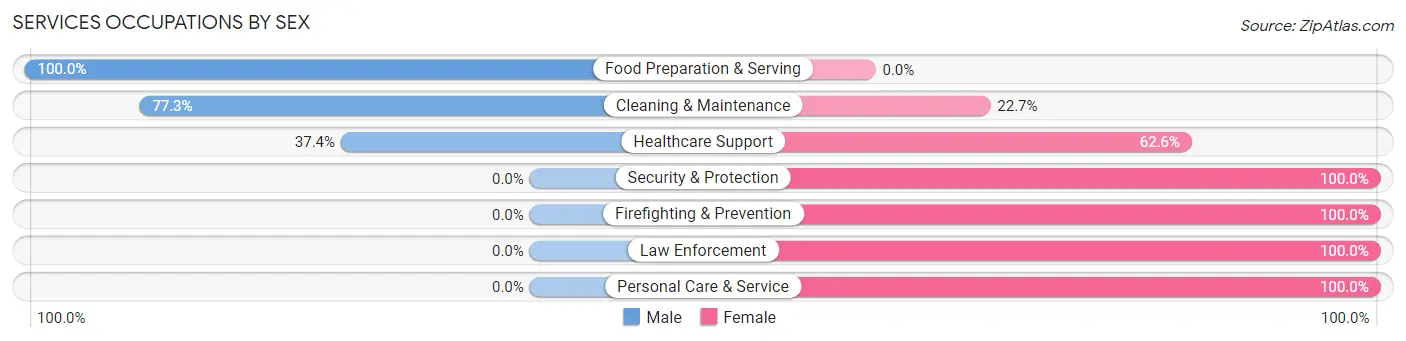
Services Occupations by Sex
Within the Services occupations in La Grulla, the most male-oriented occupations are Food Preparation & Serving (100.0%), Cleaning & Maintenance (77.3%), and Healthcare Support (37.4%), while the most female-oriented occupations are Security & Protection (100.0%), Firefighting & Prevention (100.0%), and Law Enforcement (100.0%).
| Occupation | Male | Female |
| Healthcare Support | 37 (37.4%) | 62 (62.6%) |
| Security & Protection | 0 (0.0%) | 18 (100.0%) |
| Firefighting & Prevention | 0 (0.0%) | 9 (100.0%) |
| Law Enforcement | 0 (0.0%) | 9 (100.0%) |
| Food Preparation & Serving | 20 (100.0%) | 0 (0.0%) |
| Cleaning & Maintenance | 17 (77.3%) | 5 (22.7%) |
| Personal Care & Service | 0 (0.0%) | 6 (100.0%) |
| Total (Category) | 74 (44.9%) | 91 (55.1%) |
| Total (Overall) | 196 (37.6%) | 326 (62.5%) |
Sales and Office Occupations
The most common Sales and Office occupations in La Grulla are Sales & Related (33 | 6.3%), and Office & Administration (29 | 5.6%).
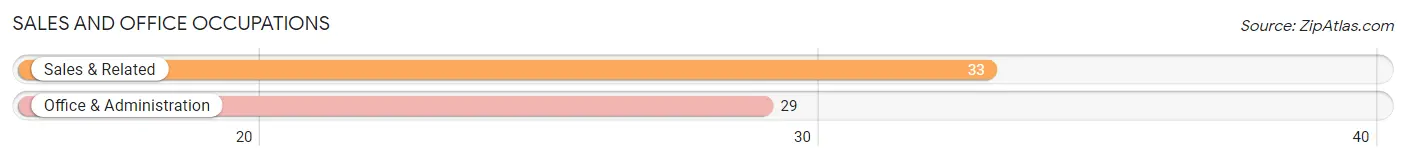
Sales and Office Occupations by Sex

| Occupation | Male | Female |
| Sales & Related | 33 (100.0%) | 0 (0.0%) |
| Office & Administration | 0 (0.0%) | 29 (100.0%) |
| Total (Category) | 33 (53.2%) | 29 (46.8%) |
| Total (Overall) | 196 (37.6%) | 326 (62.5%) |
Natural Resources, Construction and Maintenance Occupations
The most common Natural Resources, Construction and Maintenance occupations in La Grulla are Construction & Extraction (55 | 10.5%), and Installation, Maintenance & Repair (22 | 4.2%).
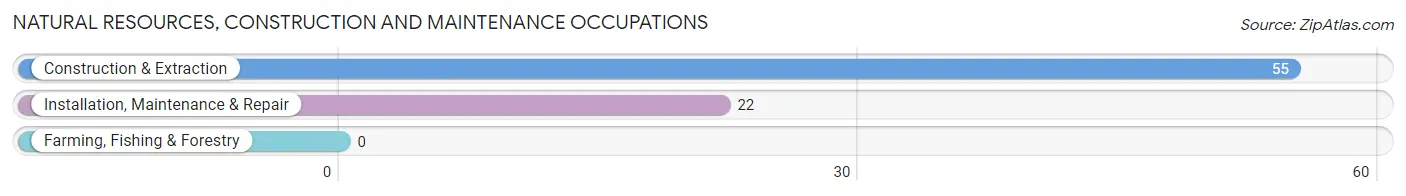
Natural Resources, Construction and Maintenance Occupations by Sex
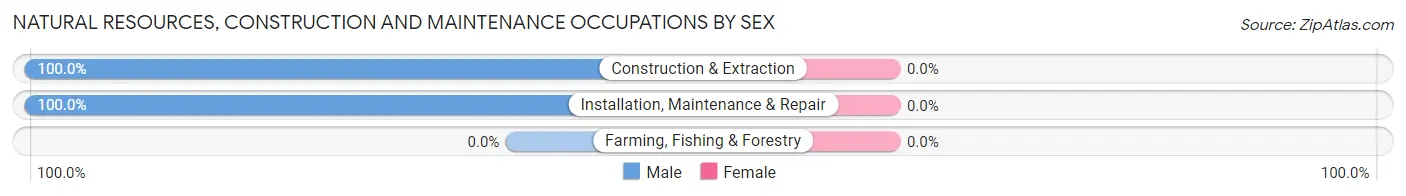
| Occupation | Male | Female |
| Farming, Fishing & Forestry | 0 (0.0%) | 0 (0.0%) |
| Construction & Extraction | 55 (100.0%) | 0 (0.0%) |
| Installation, Maintenance & Repair | 22 (100.0%) | 0 (0.0%) |
| Total (Category) | 77 (100.0%) | 0 (0.0%) |
| Total (Overall) | 196 (37.6%) | 326 (62.5%) |
Production, Transportation and Moving Occupations
The most common Production, Transportation and Moving occupations in La Grulla are Transportation (80 | 15.3%), Production (27 | 5.2%), and Material Moving (18 | 3.5%).
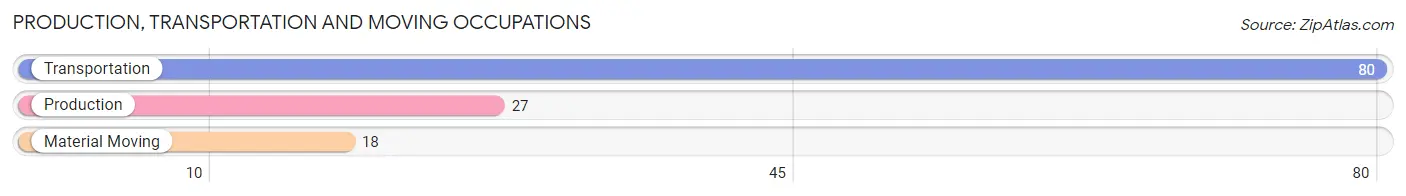
Production, Transportation and Moving Occupations by Sex
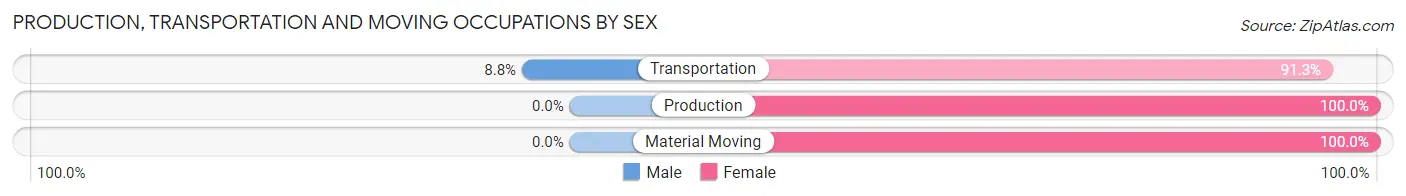
| Occupation | Male | Female |
| Production | 0 (0.0%) | 27 (100.0%) |
| Transportation | 7 (8.7%) | 73 (91.2%) |
| Material Moving | 0 (0.0%) | 18 (100.0%) |
| Total (Category) | 7 (5.6%) | 118 (94.4%) |
| Total (Overall) | 196 (37.6%) | 326 (62.5%) |
Employment Industries by Sex in La Grulla
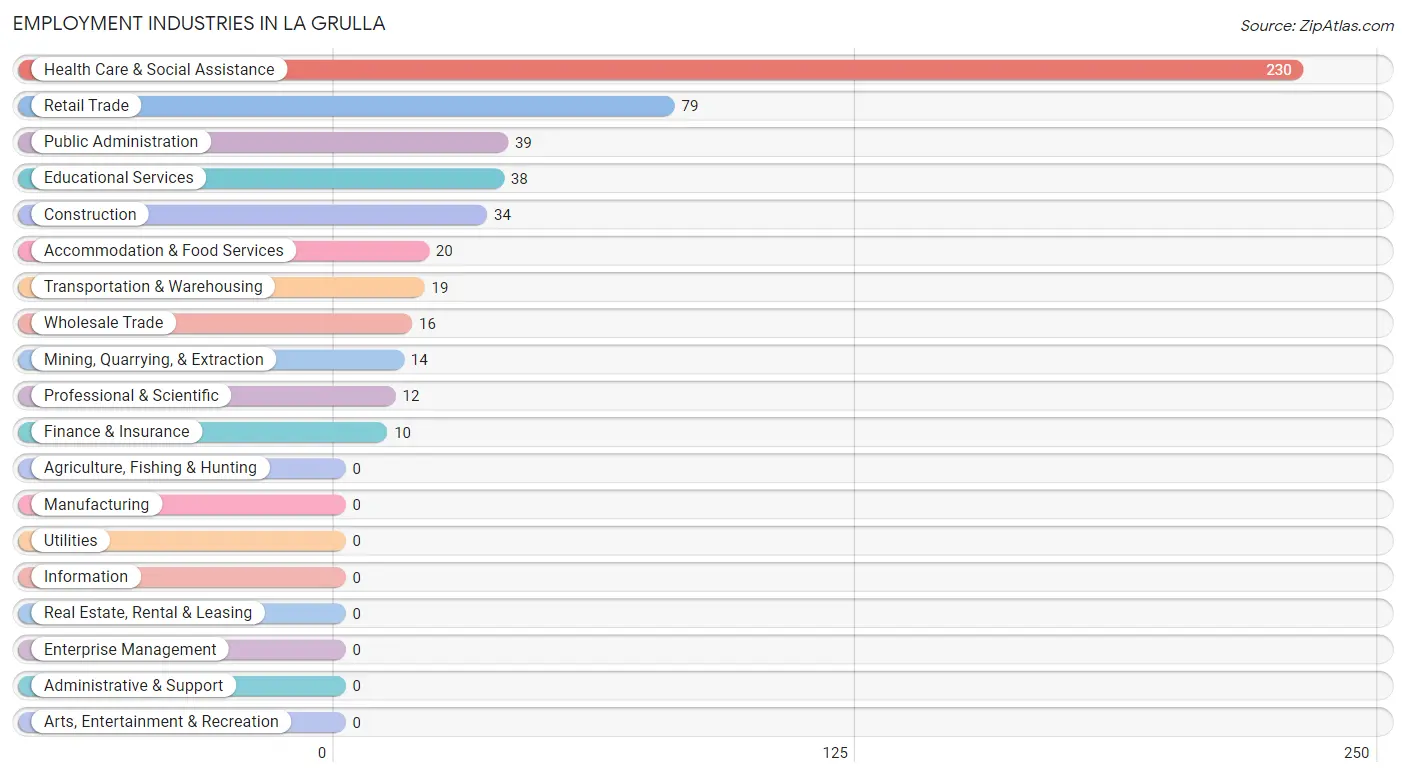
Employment Industries in La Grulla
The major employment industries in La Grulla include Health Care & Social Assistance (230 | 44.1%), Retail Trade (79 | 15.1%), Public Administration (39 | 7.5%), Educational Services (38 | 7.3%), and Construction (34 | 6.5%).
Employment Industries by Sex in La Grulla
The La Grulla industries that see more men than women are Mining, Quarrying, & Extraction (100.0%), Construction (100.0%), and Wholesale Trade (100.0%), whereas the industries that tend to have a higher number of women are Finance & Insurance (100.0%), Professional & Scientific (100.0%), and Health Care & Social Assistance (83.9%).
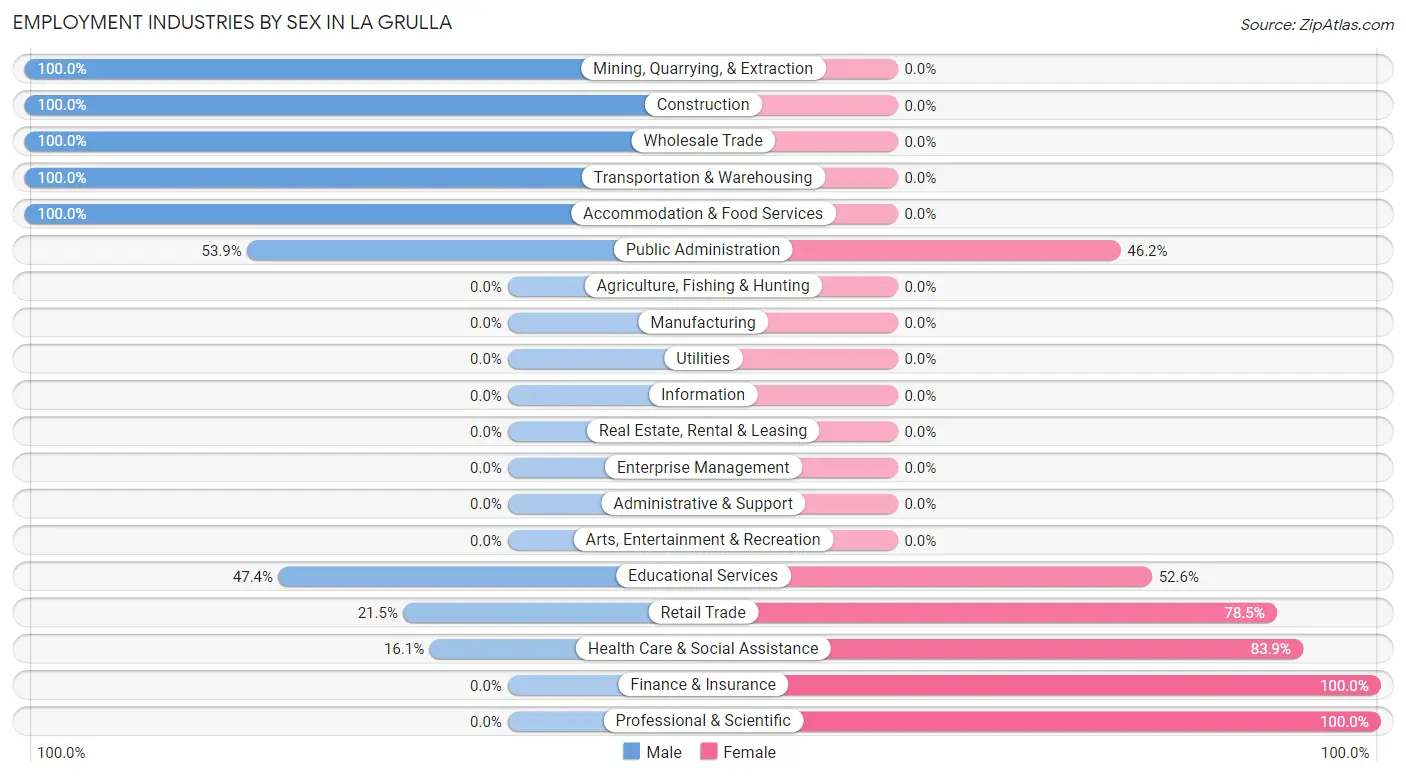
| Industry | Male | Female |
| Agriculture, Fishing & Hunting | 0 (0.0%) | 0 (0.0%) |
| Mining, Quarrying, & Extraction | 14 (100.0%) | 0 (0.0%) |
| Construction | 34 (100.0%) | 0 (0.0%) |
| Manufacturing | 0 (0.0%) | 0 (0.0%) |
| Wholesale Trade | 16 (100.0%) | 0 (0.0%) |
| Retail Trade | 17 (21.5%) | 62 (78.5%) |
| Transportation & Warehousing | 19 (100.0%) | 0 (0.0%) |
| Utilities | 0 (0.0%) | 0 (0.0%) |
| Information | 0 (0.0%) | 0 (0.0%) |
| Finance & Insurance | 0 (0.0%) | 10 (100.0%) |
| Real Estate, Rental & Leasing | 0 (0.0%) | 0 (0.0%) |
| Professional & Scientific | 0 (0.0%) | 12 (100.0%) |
| Enterprise Management | 0 (0.0%) | 0 (0.0%) |
| Administrative & Support | 0 (0.0%) | 0 (0.0%) |
| Educational Services | 18 (47.4%) | 20 (52.6%) |
| Health Care & Social Assistance | 37 (16.1%) | 193 (83.9%) |
| Arts, Entertainment & Recreation | 0 (0.0%) | 0 (0.0%) |
| Accommodation & Food Services | 20 (100.0%) | 0 (0.0%) |
| Public Administration | 21 (53.8%) | 18 (46.2%) |
| Total | 196 (37.6%) | 326 (62.5%) |
Education in La Grulla
School Enrollment in La Grulla
The most common levels of schooling among the 574 students in La Grulla are middle school (219 | 38.2%), college / undergraduate (126 | 22.0%), and high school (125 | 21.8%).
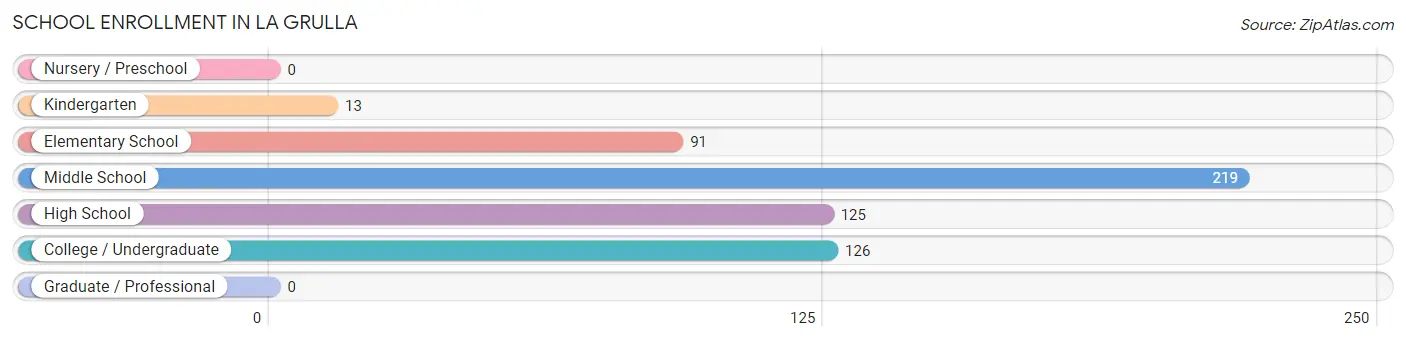
| School Level | # Students | % Students |
| Nursery / Preschool | 0 | 0.0% |
| Kindergarten | 13 | 2.3% |
| Elementary School | 91 | 15.9% |
| Middle School | 219 | 38.2% |
| High School | 125 | 21.8% |
| College / Undergraduate | 126 | 22.0% |
| Graduate / Professional | 0 | 0.0% |
| Total | 574 | 100.0% |
School Enrollment by Age by Funding Source in La Grulla
Out of a total of 574 students who are enrolled in schools in La Grulla, 14 (2.4%) attend a private institution, while the remaining 560 (97.6%) are enrolled in public schools. The age group of 18 to 19 year olds has the highest likelihood of being enrolled in private schools, with 14 (16.5% in the age bracket) enrolled. Conversely, the age group of 5 to 9 year old has the lowest likelihood of being enrolled in a private school, with 69 (100.0% in the age bracket) attending a public institution.
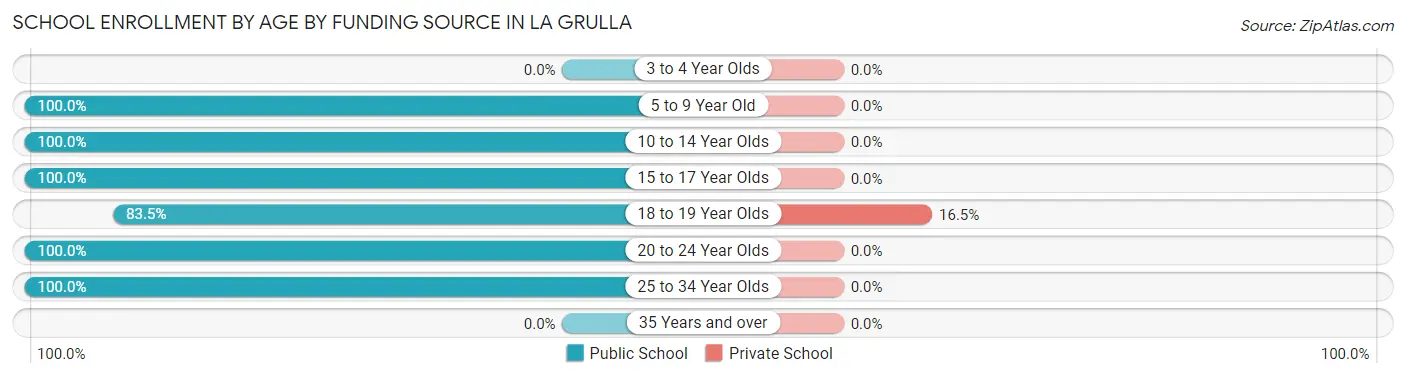
| Age Bracket | Public School | Private School |
| 3 to 4 Year Olds | 0 (0.0%) | 0 (0.0%) |
| 5 to 9 Year Old | 69 (100.0%) | 0 (0.0%) |
| 10 to 14 Year Olds | 254 (100.0%) | 0 (0.0%) |
| 15 to 17 Year Olds | 76 (100.0%) | 0 (0.0%) |
| 18 to 19 Year Olds | 71 (83.5%) | 14 (16.5%) |
| 20 to 24 Year Olds | 17 (100.0%) | 0 (0.0%) |
| 25 to 34 Year Olds | 73 (100.0%) | 0 (0.0%) |
| 35 Years and over | 0 (0.0%) | 0 (0.0%) |
| Total | 560 (97.6%) | 14 (2.4%) |
Educational Attainment by Field of Study in La Grulla
, and arts & humanities (16 | 100.0%) are the most common fields of study among 16 individuals in La Grulla who have obtained a bachelor's degree or higher.
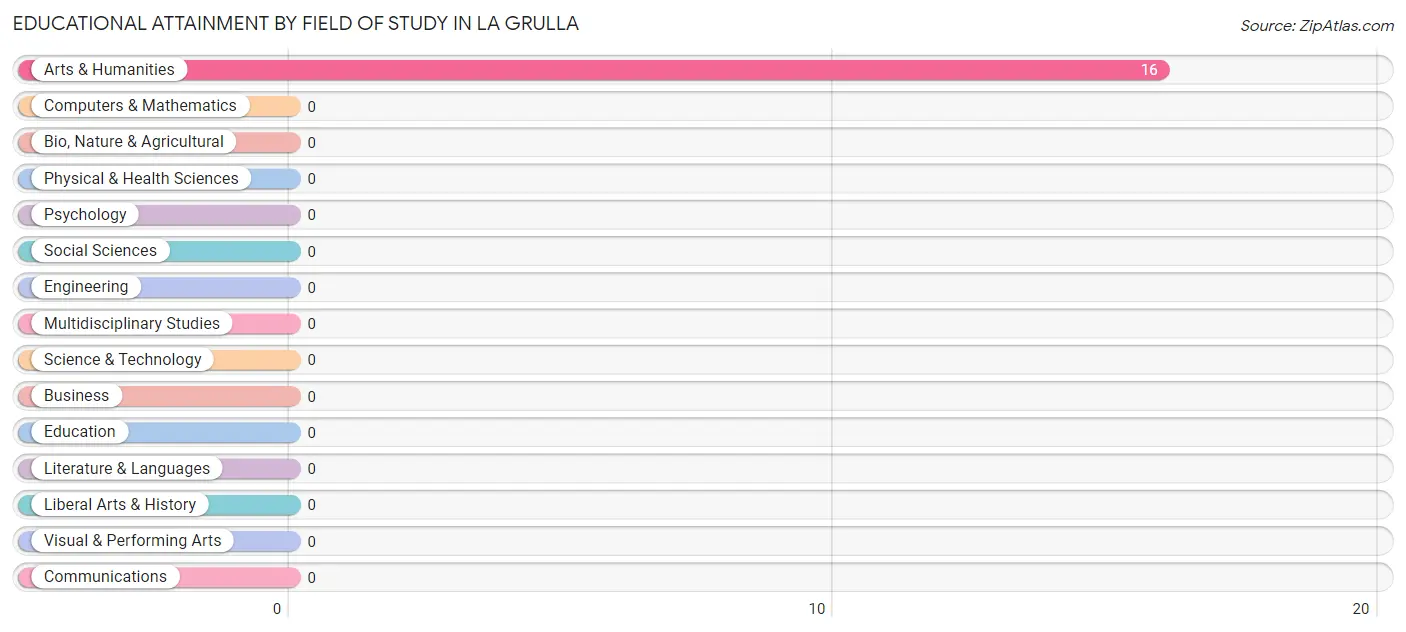
| Field of Study | # Graduates | % Graduates |
| Computers & Mathematics | 0 | 0.0% |
| Bio, Nature & Agricultural | 0 | 0.0% |
| Physical & Health Sciences | 0 | 0.0% |
| Psychology | 0 | 0.0% |
| Social Sciences | 0 | 0.0% |
| Engineering | 0 | 0.0% |
| Multidisciplinary Studies | 0 | 0.0% |
| Science & Technology | 0 | 0.0% |
| Business | 0 | 0.0% |
| Education | 0 | 0.0% |
| Literature & Languages | 0 | 0.0% |
| Liberal Arts & History | 0 | 0.0% |
| Visual & Performing Arts | 0 | 0.0% |
| Communications | 0 | 0.0% |
| Arts & Humanities | 16 | 100.0% |
| Total | 16 | 100.0% |
Transportation & Commute in La Grulla
Vehicle Availability by Sex in La Grulla
The most prevalent vehicle ownership categories in La Grulla are males with 2 vehicles (109, accounting for 55.6%) and females with 2 vehicles (93, making up 33.4%).
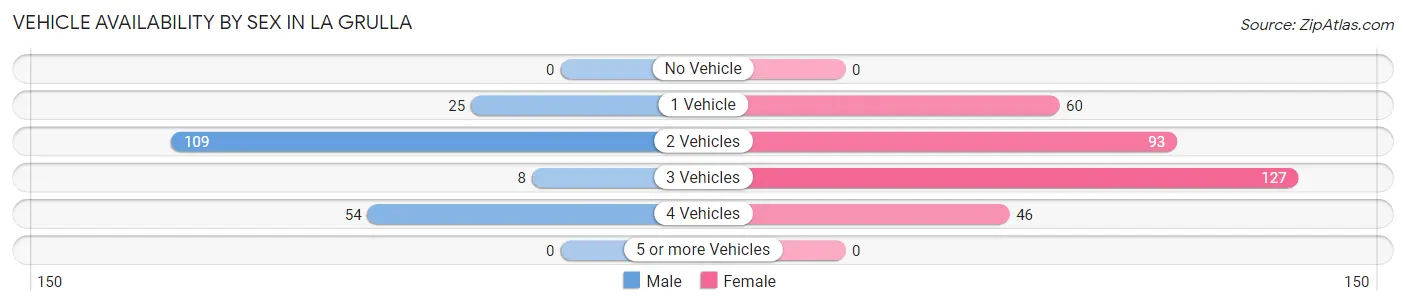
| Vehicles Available | Male | Female |
| No Vehicle | 0 (0.0%) | 0 (0.0%) |
| 1 Vehicle | 25 (12.8%) | 60 (18.4%) |
| 2 Vehicles | 109 (55.6%) | 93 (28.5%) |
| 3 Vehicles | 8 (4.1%) | 127 (39.0%) |
| 4 Vehicles | 54 (27.6%) | 46 (14.1%) |
| 5 or more Vehicles | 0 (0.0%) | 0 (0.0%) |
| Total | 196 (100.0%) | 326 (100.0%) |
Commute Time in La Grulla
The most frequently occuring commute durations in La Grulla are 15 to 19 minutes (166 commuters, 35.5%), 30 to 34 minutes (72 commuters, 15.4%), and 10 to 14 minutes (59 commuters, 12.6%).
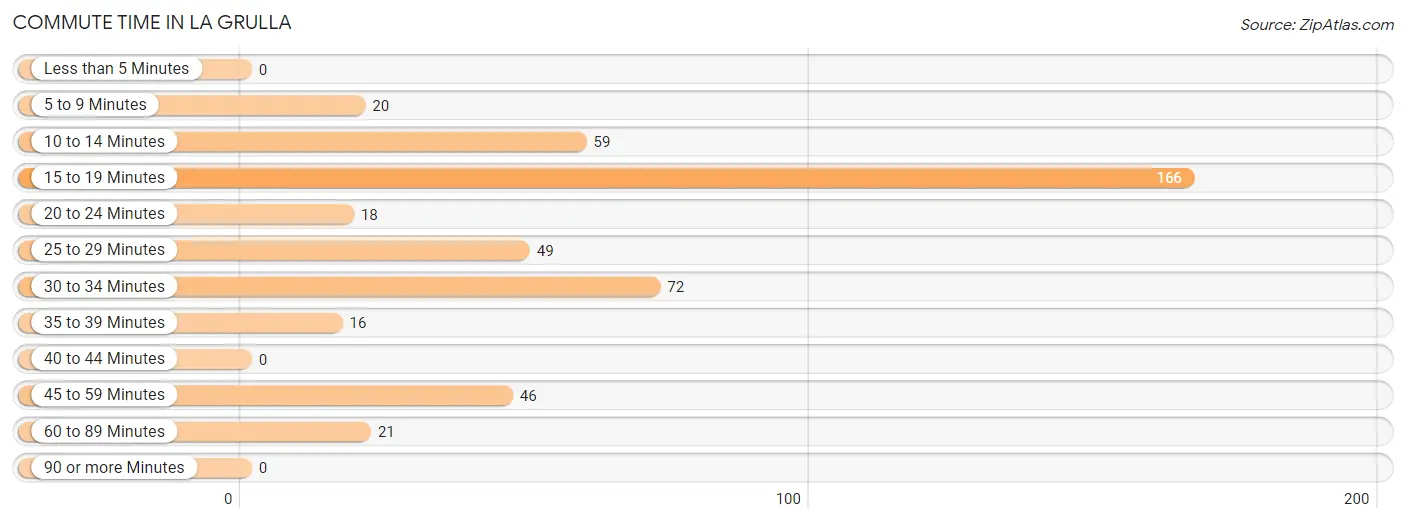
| Commute Time | # Commuters | % Commuters |
| Less than 5 Minutes | 0 | 0.0% |
| 5 to 9 Minutes | 20 | 4.3% |
| 10 to 14 Minutes | 59 | 12.6% |
| 15 to 19 Minutes | 166 | 35.5% |
| 20 to 24 Minutes | 18 | 3.8% |
| 25 to 29 Minutes | 49 | 10.5% |
| 30 to 34 Minutes | 72 | 15.4% |
| 35 to 39 Minutes | 16 | 3.4% |
| 40 to 44 Minutes | 0 | 0.0% |
| 45 to 59 Minutes | 46 | 9.9% |
| 60 to 89 Minutes | 21 | 4.5% |
| 90 or more Minutes | 0 | 0.0% |
Commute Time by Sex in La Grulla
The most common commute times in La Grulla are 10 to 14 minutes (47 commuters, 29.6%) for males and 15 to 19 minutes (141 commuters, 45.8%) for females.
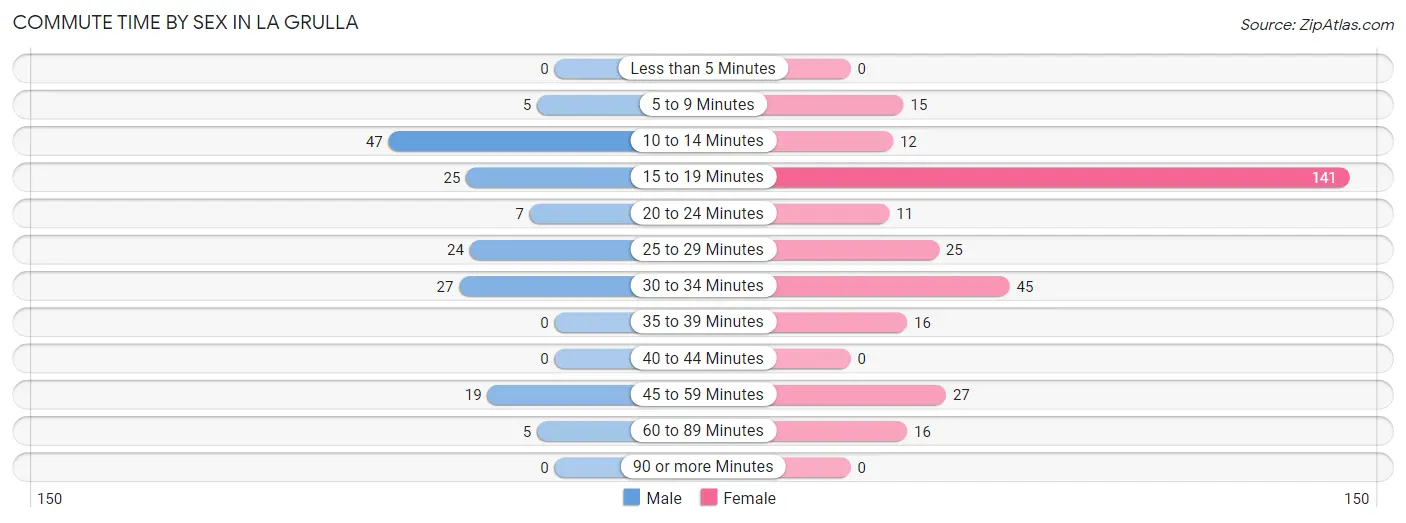
| Commute Time | Male | Female |
| Less than 5 Minutes | 0 (0.0%) | 0 (0.0%) |
| 5 to 9 Minutes | 5 (3.1%) | 15 (4.9%) |
| 10 to 14 Minutes | 47 (29.6%) | 12 (3.9%) |
| 15 to 19 Minutes | 25 (15.7%) | 141 (45.8%) |
| 20 to 24 Minutes | 7 (4.4%) | 11 (3.6%) |
| 25 to 29 Minutes | 24 (15.1%) | 25 (8.1%) |
| 30 to 34 Minutes | 27 (17.0%) | 45 (14.6%) |
| 35 to 39 Minutes | 0 (0.0%) | 16 (5.2%) |
| 40 to 44 Minutes | 0 (0.0%) | 0 (0.0%) |
| 45 to 59 Minutes | 19 (11.9%) | 27 (8.8%) |
| 60 to 89 Minutes | 5 (3.1%) | 16 (5.2%) |
| 90 or more Minutes | 0 (0.0%) | 0 (0.0%) |
Time of Departure to Work by Sex in La Grulla
The most frequent times of departure to work in La Grulla are 6:00 AM to 6:29 AM (41, 25.8%) for males and 6:30 AM to 6:59 AM (138, 44.8%) for females.
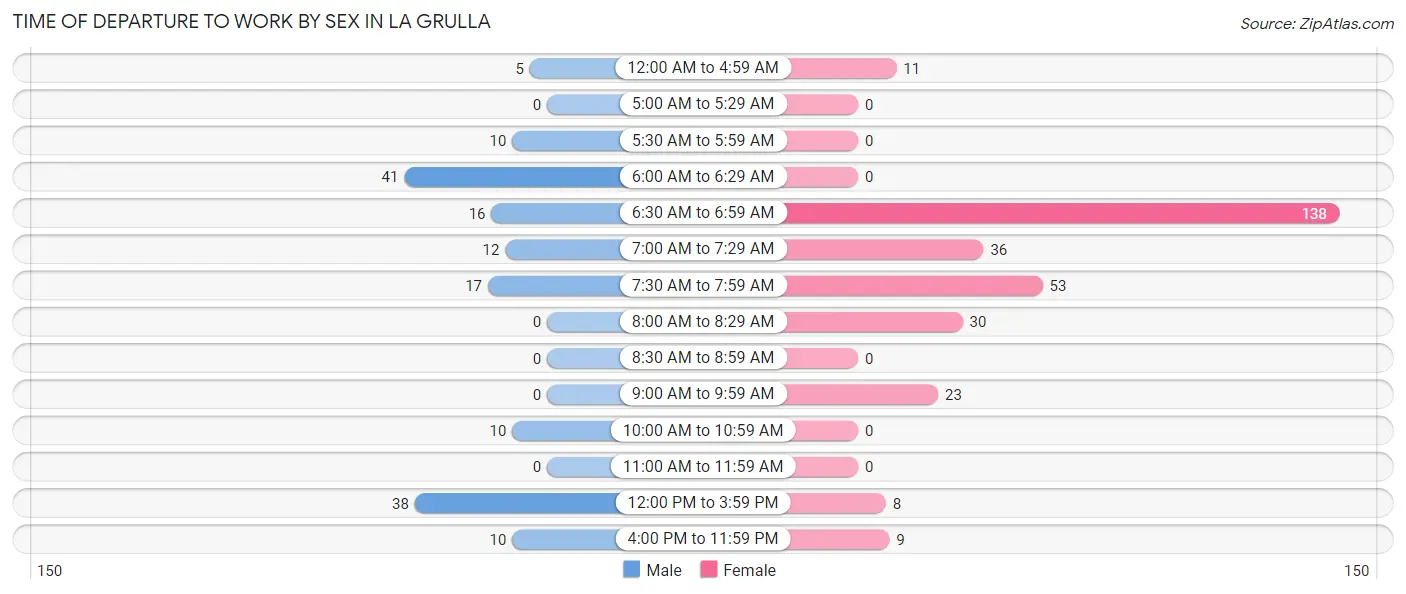
| Time of Departure | Male | Female |
| 12:00 AM to 4:59 AM | 5 (3.1%) | 11 (3.6%) |
| 5:00 AM to 5:29 AM | 0 (0.0%) | 0 (0.0%) |
| 5:30 AM to 5:59 AM | 10 (6.3%) | 0 (0.0%) |
| 6:00 AM to 6:29 AM | 41 (25.8%) | 0 (0.0%) |
| 6:30 AM to 6:59 AM | 16 (10.1%) | 138 (44.8%) |
| 7:00 AM to 7:29 AM | 12 (7.5%) | 36 (11.7%) |
| 7:30 AM to 7:59 AM | 17 (10.7%) | 53 (17.2%) |
| 8:00 AM to 8:29 AM | 0 (0.0%) | 30 (9.7%) |
| 8:30 AM to 8:59 AM | 0 (0.0%) | 0 (0.0%) |
| 9:00 AM to 9:59 AM | 0 (0.0%) | 23 (7.5%) |
| 10:00 AM to 10:59 AM | 10 (6.3%) | 0 (0.0%) |
| 11:00 AM to 11:59 AM | 0 (0.0%) | 0 (0.0%) |
| 12:00 PM to 3:59 PM | 38 (23.9%) | 8 (2.6%) |
| 4:00 PM to 11:59 PM | 10 (6.3%) | 9 (2.9%) |
| Total | 159 (100.0%) | 308 (100.0%) |
Housing Occupancy in La Grulla
Occupancy by Ownership in La Grulla
Of the total 462 dwellings in La Grulla, owner-occupied units account for 369 (79.9%), while renter-occupied units make up 93 (20.1%).
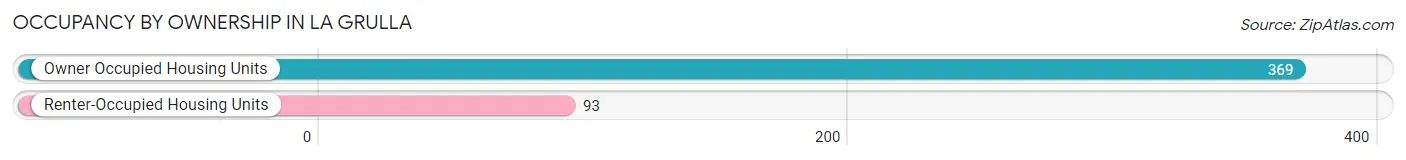
| Occupancy | # Housing Units | % Housing Units |
| Owner Occupied Housing Units | 369 | 79.9% |
| Renter-Occupied Housing Units | 93 | 20.1% |
| Total Occupied Housing Units | 462 | 100.0% |
Occupancy by Household Size in La Grulla
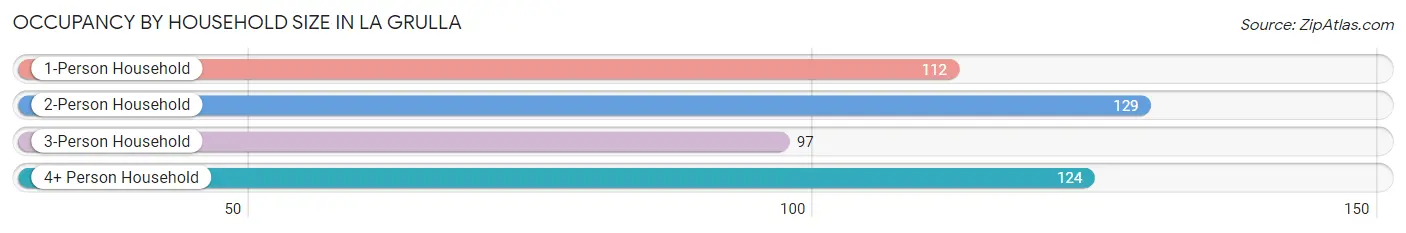
| Household Size | # Housing Units | % Housing Units |
| 1-Person Household | 112 | 24.2% |
| 2-Person Household | 129 | 27.9% |
| 3-Person Household | 97 | 21.0% |
| 4+ Person Household | 124 | 26.8% |
| Total Housing Units | 462 | 100.0% |
Occupancy by Ownership by Household Size in La Grulla
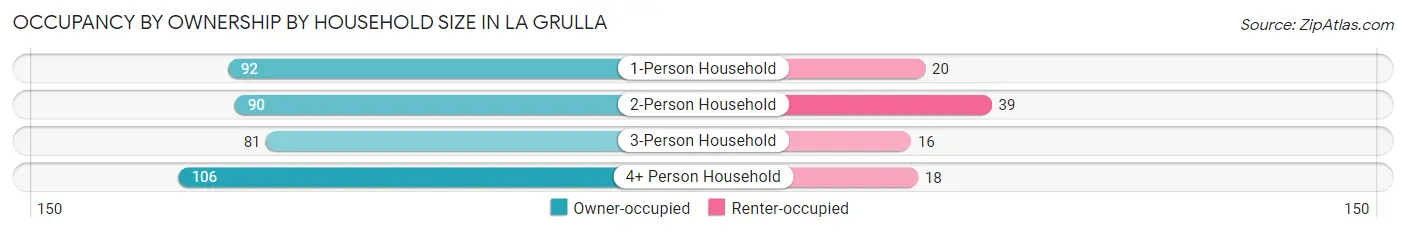
| Household Size | Owner-occupied | Renter-occupied |
| 1-Person Household | 92 (82.1%) | 20 (17.9%) |
| 2-Person Household | 90 (69.8%) | 39 (30.2%) |
| 3-Person Household | 81 (83.5%) | 16 (16.5%) |
| 4+ Person Household | 106 (85.5%) | 18 (14.5%) |
| Total Housing Units | 369 (79.9%) | 93 (20.1%) |
Occupancy by Educational Attainment in La Grulla
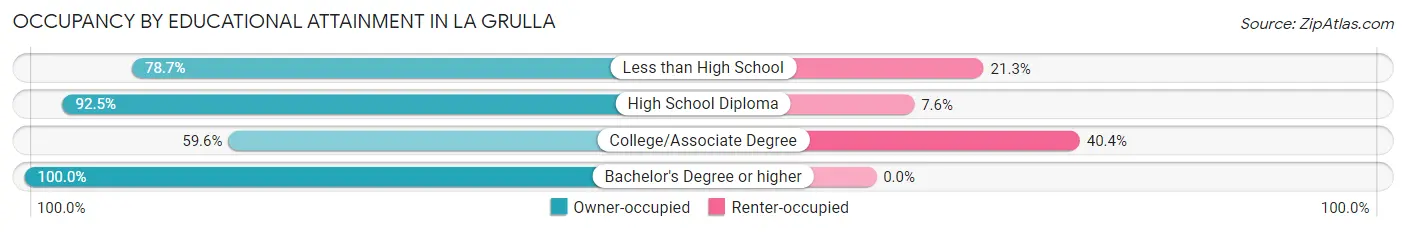
| Household Size | Owner-occupied | Renter-occupied |
| Less than High School | 144 (78.7%) | 39 (21.3%) |
| High School Diploma | 147 (92.4%) | 12 (7.5%) |
| College/Associate Degree | 62 (59.6%) | 42 (40.4%) |
| Bachelor's Degree or higher | 16 (100.0%) | 0 (0.0%) |
Occupancy by Age of Householder in La Grulla
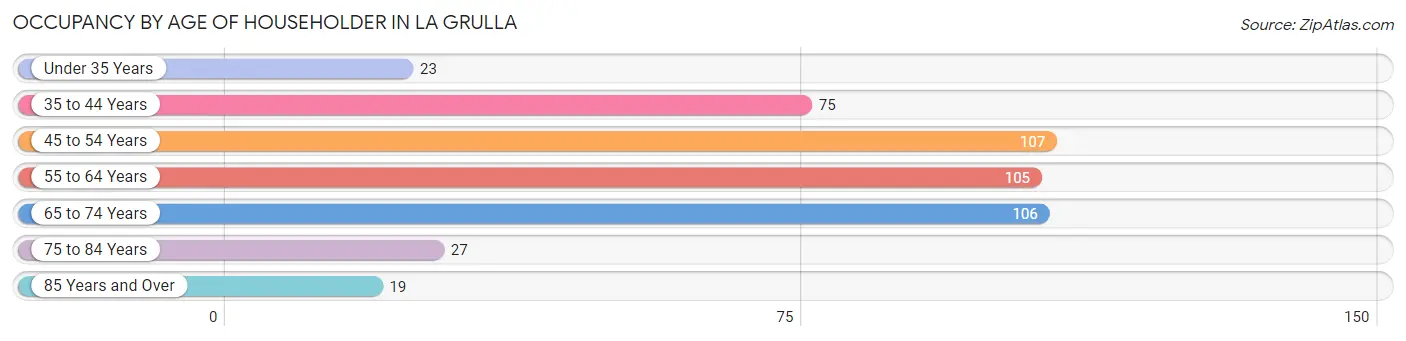
| Age Bracket | # Households | % Households |
| Under 35 Years | 23 | 5.0% |
| 35 to 44 Years | 75 | 16.2% |
| 45 to 54 Years | 107 | 23.2% |
| 55 to 64 Years | 105 | 22.7% |
| 65 to 74 Years | 106 | 22.9% |
| 75 to 84 Years | 27 | 5.8% |
| 85 Years and Over | 19 | 4.1% |
| Total | 462 | 100.0% |
Housing Finances in La Grulla
Median Income by Occupancy in La Grulla
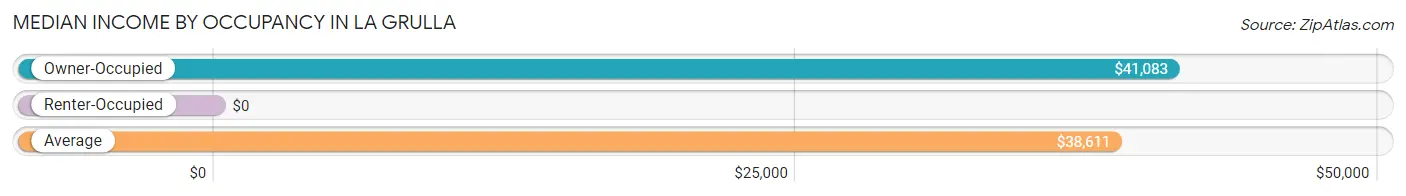
| Occupancy Type | # Households | Median Income |
| Owner-Occupied | 369 (79.9%) | $41,083 |
| Renter-Occupied | 93 (20.1%) | $0 |
| Average | 462 (100.0%) | $38,611 |
Occupancy by Householder Income Bracket in La Grulla
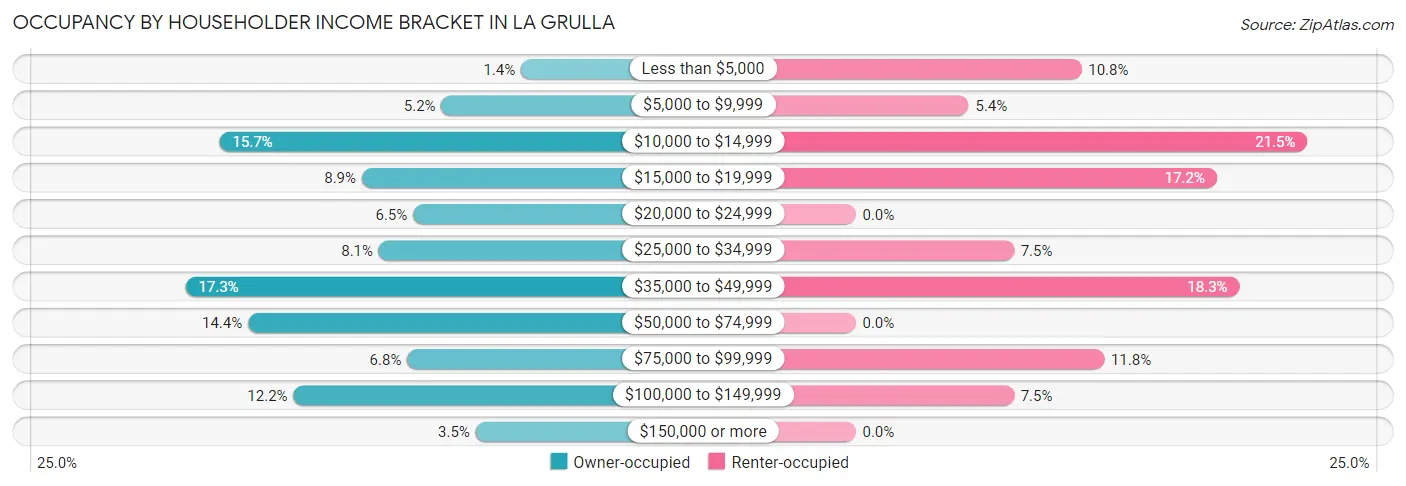
| Income Bracket | Owner-occupied | Renter-occupied |
| Less than $5,000 | 5 (1.4%) | 10 (10.7%) |
| $5,000 to $9,999 | 19 (5.1%) | 5 (5.4%) |
| $10,000 to $14,999 | 58 (15.7%) | 20 (21.5%) |
| $15,000 to $19,999 | 33 (8.9%) | 16 (17.2%) |
| $20,000 to $24,999 | 24 (6.5%) | 0 (0.0%) |
| $25,000 to $34,999 | 30 (8.1%) | 7 (7.5%) |
| $35,000 to $49,999 | 64 (17.3%) | 17 (18.3%) |
| $50,000 to $74,999 | 53 (14.4%) | 0 (0.0%) |
| $75,000 to $99,999 | 25 (6.8%) | 11 (11.8%) |
| $100,000 to $149,999 | 45 (12.2%) | 7 (7.5%) |
| $150,000 or more | 13 (3.5%) | 0 (0.0%) |
| Total | 369 (100.0%) | 93 (100.0%) |
Monthly Housing Cost Tiers in La Grulla
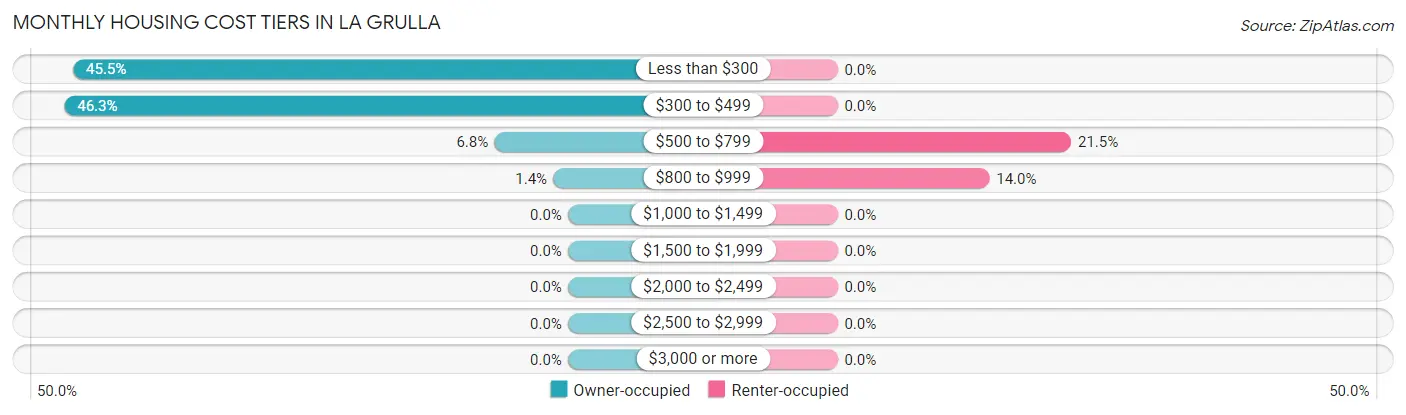
| Monthly Cost | Owner-occupied | Renter-occupied |
| Less than $300 | 168 (45.5%) | 0 (0.0%) |
| $300 to $499 | 171 (46.3%) | 0 (0.0%) |
| $500 to $799 | 25 (6.8%) | 20 (21.5%) |
| $800 to $999 | 5 (1.4%) | 13 (14.0%) |
| $1,000 to $1,499 | 0 (0.0%) | 0 (0.0%) |
| $1,500 to $1,999 | 0 (0.0%) | 0 (0.0%) |
| $2,000 to $2,499 | 0 (0.0%) | 0 (0.0%) |
| $2,500 to $2,999 | 0 (0.0%) | 0 (0.0%) |
| $3,000 or more | 0 (0.0%) | 0 (0.0%) |
| Total | 369 (100.0%) | 93 (100.0%) |
Physical Housing Characteristics in La Grulla
Housing Structures in La Grulla
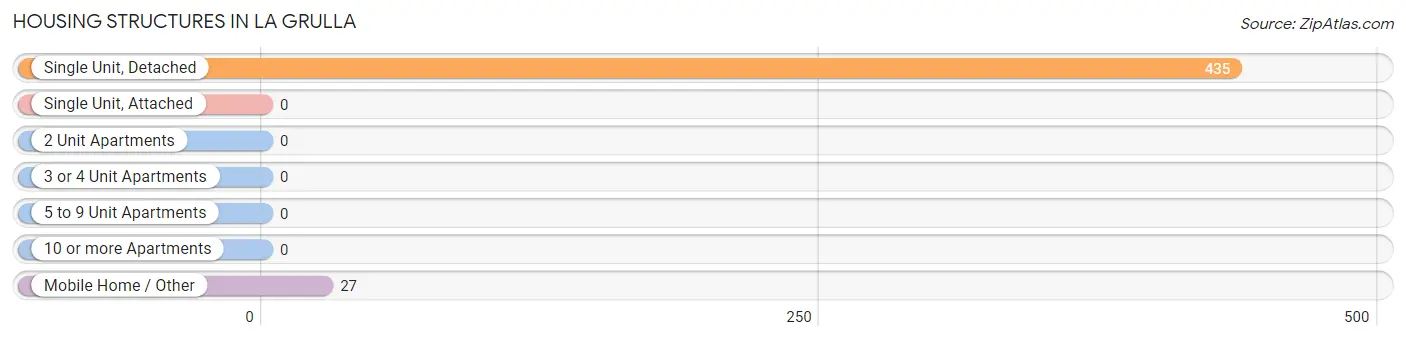
| Structure Type | # Housing Units | % Housing Units |
| Single Unit, Detached | 435 | 94.2% |
| Single Unit, Attached | 0 | 0.0% |
| 2 Unit Apartments | 0 | 0.0% |
| 3 or 4 Unit Apartments | 0 | 0.0% |
| 5 to 9 Unit Apartments | 0 | 0.0% |
| 10 or more Apartments | 0 | 0.0% |
| Mobile Home / Other | 27 | 5.8% |
| Total | 462 | 100.0% |
Housing Structures by Occupancy in La Grulla
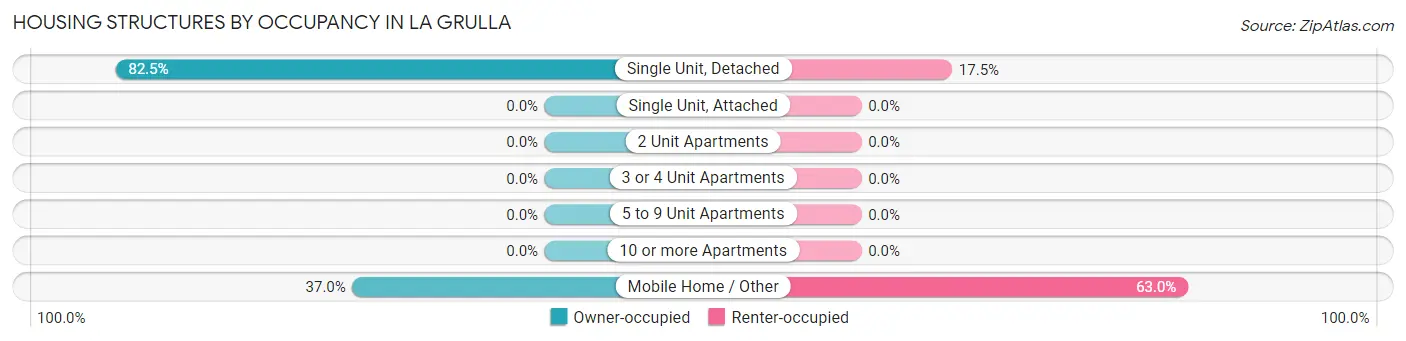
| Structure Type | Owner-occupied | Renter-occupied |
| Single Unit, Detached | 359 (82.5%) | 76 (17.5%) |
| Single Unit, Attached | 0 (0.0%) | 0 (0.0%) |
| 2 Unit Apartments | 0 (0.0%) | 0 (0.0%) |
| 3 or 4 Unit Apartments | 0 (0.0%) | 0 (0.0%) |
| 5 to 9 Unit Apartments | 0 (0.0%) | 0 (0.0%) |
| 10 or more Apartments | 0 (0.0%) | 0 (0.0%) |
| Mobile Home / Other | 10 (37.0%) | 17 (63.0%) |
| Total | 369 (79.9%) | 93 (20.1%) |
Housing Structures by Number of Rooms in La Grulla
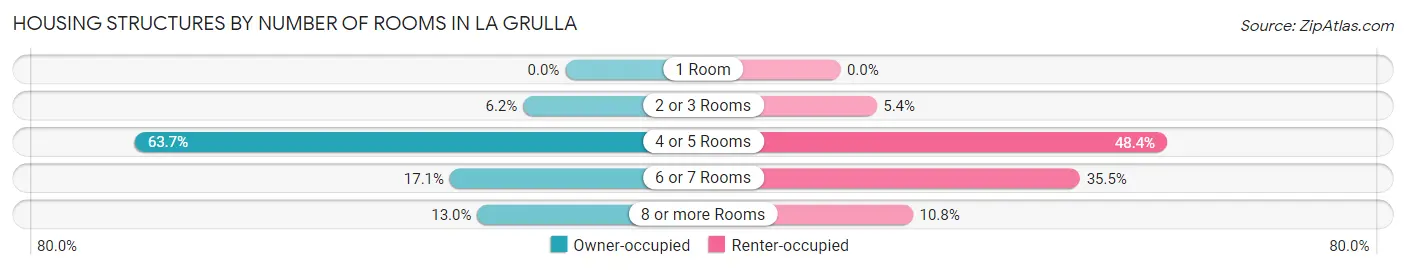
| Number of Rooms | Owner-occupied | Renter-occupied |
| 1 Room | 0 (0.0%) | 0 (0.0%) |
| 2 or 3 Rooms | 23 (6.2%) | 5 (5.4%) |
| 4 or 5 Rooms | 235 (63.7%) | 45 (48.4%) |
| 6 or 7 Rooms | 63 (17.1%) | 33 (35.5%) |
| 8 or more Rooms | 48 (13.0%) | 10 (10.7%) |
| Total | 369 (100.0%) | 93 (100.0%) |
Housing Structure by Heating Type in La Grulla
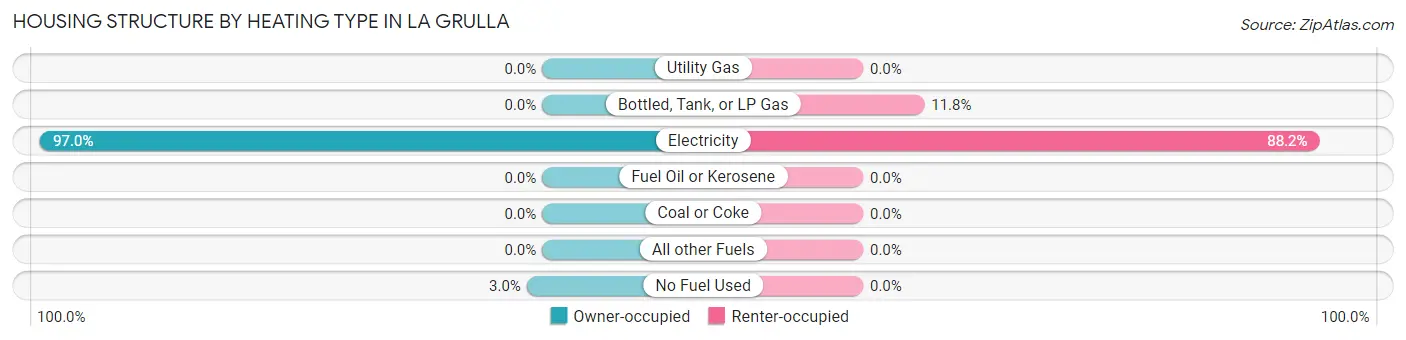
| Heating Type | Owner-occupied | Renter-occupied |
| Utility Gas | 0 (0.0%) | 0 (0.0%) |
| Bottled, Tank, or LP Gas | 0 (0.0%) | 11 (11.8%) |
| Electricity | 358 (97.0%) | 82 (88.2%) |
| Fuel Oil or Kerosene | 0 (0.0%) | 0 (0.0%) |
| Coal or Coke | 0 (0.0%) | 0 (0.0%) |
| All other Fuels | 0 (0.0%) | 0 (0.0%) |
| No Fuel Used | 11 (3.0%) | 0 (0.0%) |
| Total | 369 (100.0%) | 93 (100.0%) |
Household Vehicle Usage in La Grulla
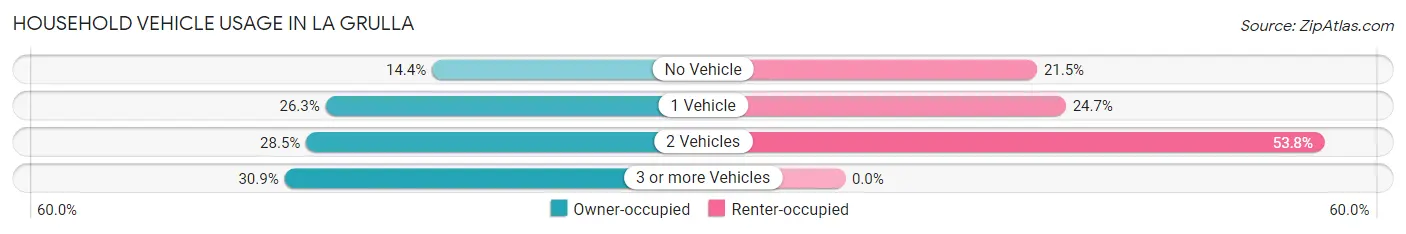
| Vehicles per Household | Owner-occupied | Renter-occupied |
| No Vehicle | 53 (14.4%) | 20 (21.5%) |
| 1 Vehicle | 97 (26.3%) | 23 (24.7%) |
| 2 Vehicles | 105 (28.5%) | 50 (53.8%) |
| 3 or more Vehicles | 114 (30.9%) | 0 (0.0%) |
| Total | 369 (100.0%) | 93 (100.0%) |
Real Estate & Mortgages in La Grulla
Real Estate and Mortgage Overview in La Grulla
| Characteristic | Without Mortgage | With Mortgage |
| Housing Units | 369 | 0 |
| Median Property Value | $43,500 | $0 |
| Median Household Income | $41,083 | $0 |
| Monthly Housing Costs | $359 | $0 |
| Real Estate Taxes | $377 | $0 |
Property Value by Mortgage Status in La Grulla
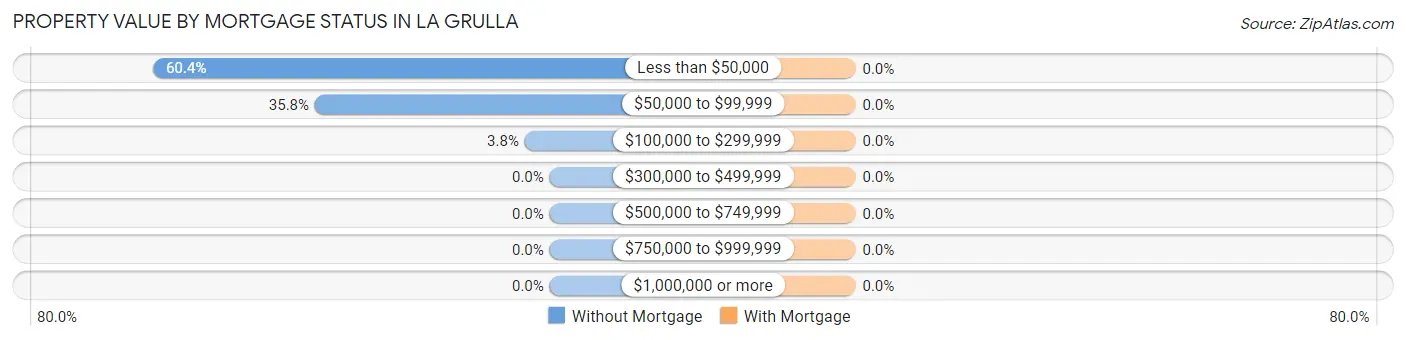
| Property Value | Without Mortgage | With Mortgage |
| Less than $50,000 | 223 (60.4%) | 0 (0.0%) |
| $50,000 to $99,999 | 132 (35.8%) | 0 (0.0%) |
| $100,000 to $299,999 | 14 (3.8%) | 0 (0.0%) |
| $300,000 to $499,999 | 0 (0.0%) | 0 (0.0%) |
| $500,000 to $749,999 | 0 (0.0%) | 0 (0.0%) |
| $750,000 to $999,999 | 0 (0.0%) | 0 (0.0%) |
| $1,000,000 or more | 0 (0.0%) | 0 (0.0%) |
| Total | 369 (100.0%) | 0 (0.0%) |
Household Income by Mortgage Status in La Grulla
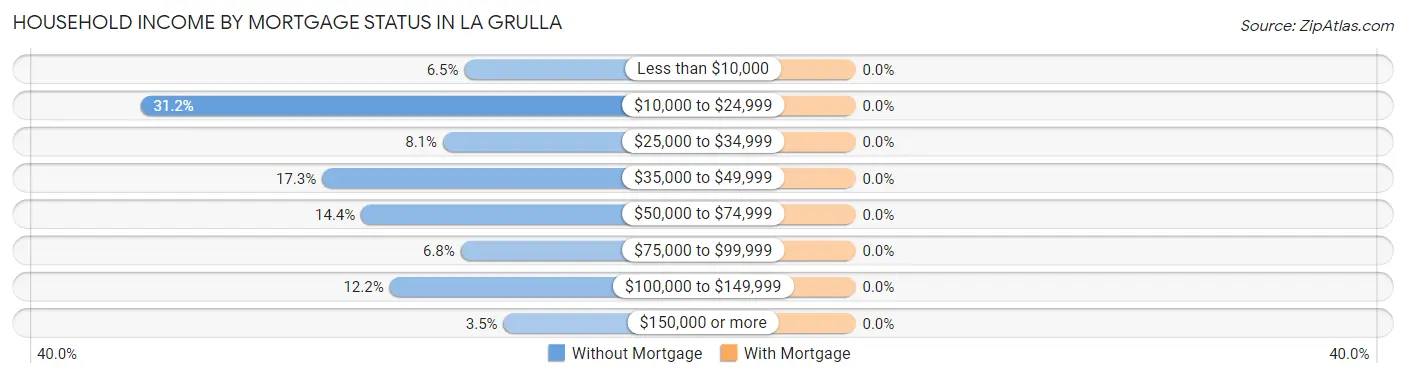
| Household Income | Without Mortgage | With Mortgage |
| Less than $10,000 | 24 (6.5%) | 0 (0.0%) |
| $10,000 to $24,999 | 115 (31.2%) | 0 (0.0%) |
| $25,000 to $34,999 | 30 (8.1%) | 0 (0.0%) |
| $35,000 to $49,999 | 64 (17.3%) | 0 (0.0%) |
| $50,000 to $74,999 | 53 (14.4%) | 0 (0.0%) |
| $75,000 to $99,999 | 25 (6.8%) | 0 (0.0%) |
| $100,000 to $149,999 | 45 (12.2%) | 0 (0.0%) |
| $150,000 or more | 13 (3.5%) | 0 (0.0%) |
| Total | 369 (100.0%) | 0 (0.0%) |
Property Value to Household Income Ratio in La Grulla
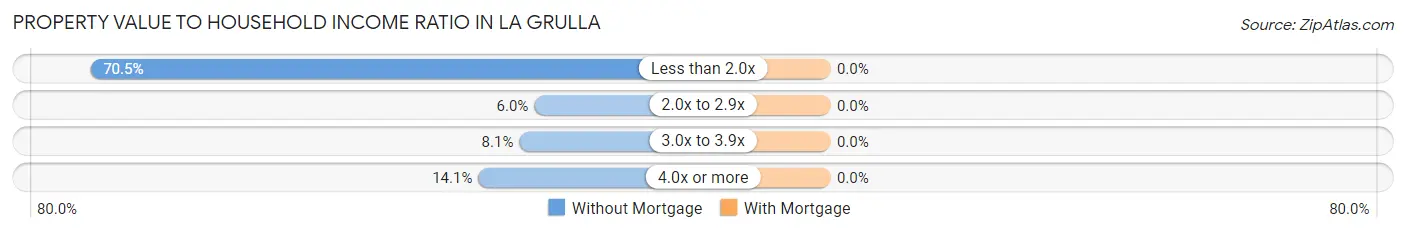
| Value-to-Income Ratio | Without Mortgage | With Mortgage |
| Less than 2.0x | 260 (70.5%) | 0 (0.0%) |
| 2.0x to 2.9x | 22 (6.0%) | 0 (0.0%) |
| 3.0x to 3.9x | 30 (8.1%) | 0 (0.0%) |
| 4.0x or more | 52 (14.1%) | 0 (0.0%) |
| Total | 369 (100.0%) | 0 (0.0%) |
Real Estate Taxes by Mortgage Status in La Grulla
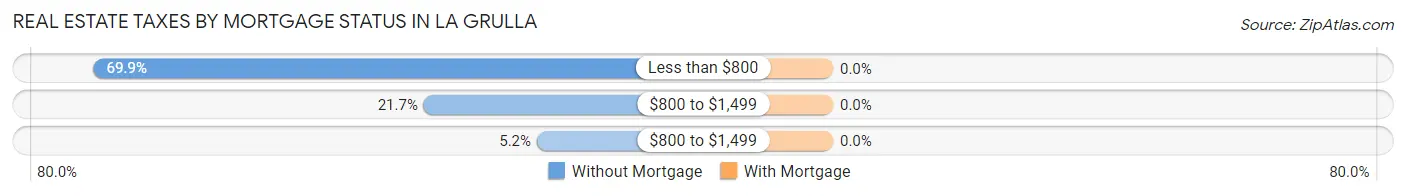
| Property Taxes | Without Mortgage | With Mortgage |
| Less than $800 | 258 (69.9%) | 0 (0.0%) |
| $800 to $1,499 | 80 (21.7%) | 0 (0.0%) |
| $800 to $1,499 | 19 (5.1%) | 0 (0.0%) |
| Total | 369 (100.0%) | 0 (0.0%) |
Health & Disability in La Grulla
Health Insurance Coverage by Age in La Grulla
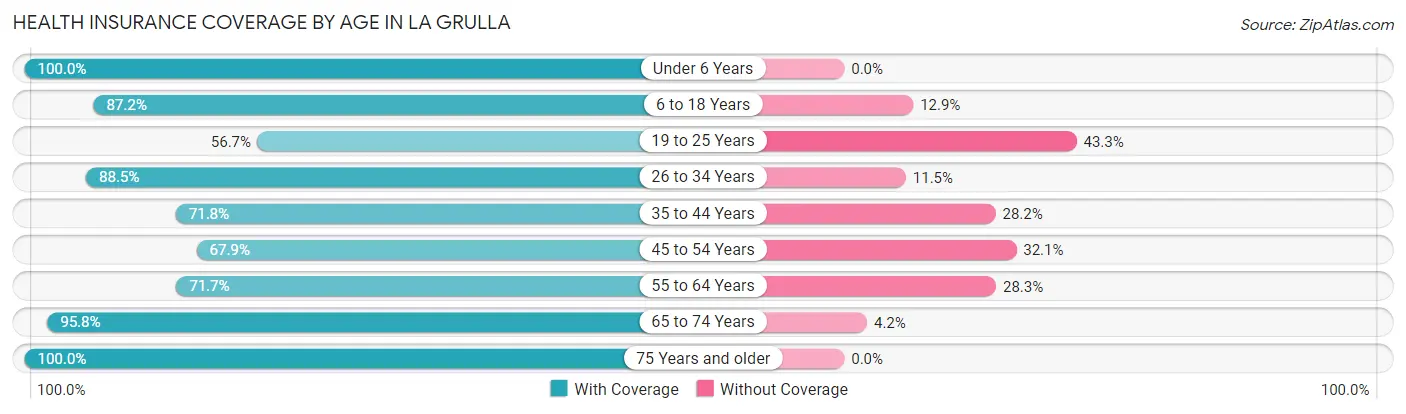
| Age Bracket | With Coverage | Without Coverage |
| Under 6 Years | 77 (100.0%) | 0 (0.0%) |
| 6 to 18 Years | 346 (87.2%) | 51 (12.9%) |
| 19 to 25 Years | 72 (56.7%) | 55 (43.3%) |
| 26 to 34 Years | 108 (88.5%) | 14 (11.5%) |
| 35 to 44 Years | 84 (71.8%) | 33 (28.2%) |
| 45 to 54 Years | 108 (67.9%) | 51 (32.1%) |
| 55 to 64 Years | 152 (71.7%) | 60 (28.3%) |
| 65 to 74 Years | 113 (95.8%) | 5 (4.2%) |
| 75 Years and older | 46 (100.0%) | 0 (0.0%) |
| Total | 1,106 (80.4%) | 269 (19.6%) |
Health Insurance Coverage by Citizenship Status in La Grulla

| Citizenship Status | With Coverage | Without Coverage |
| Native Born | 77 (100.0%) | 0 (0.0%) |
| Foreign Born, Citizen | 346 (87.2%) | 51 (12.9%) |
| Foreign Born, not a Citizen | 72 (56.7%) | 55 (43.3%) |
Health Insurance Coverage by Household Income in La Grulla
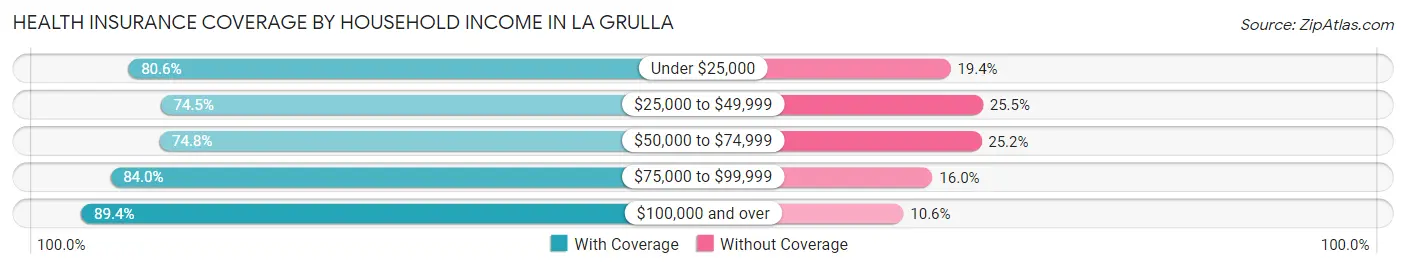
| Household Income | With Coverage | Without Coverage |
| Under $25,000 | 278 (80.6%) | 67 (19.4%) |
| $25,000 to $49,999 | 234 (74.5%) | 80 (25.5%) |
| $50,000 to $74,999 | 184 (74.8%) | 62 (25.2%) |
| $75,000 to $99,999 | 157 (84.0%) | 30 (16.0%) |
| $100,000 and over | 253 (89.4%) | 30 (10.6%) |
Public vs Private Health Insurance Coverage by Age in La Grulla
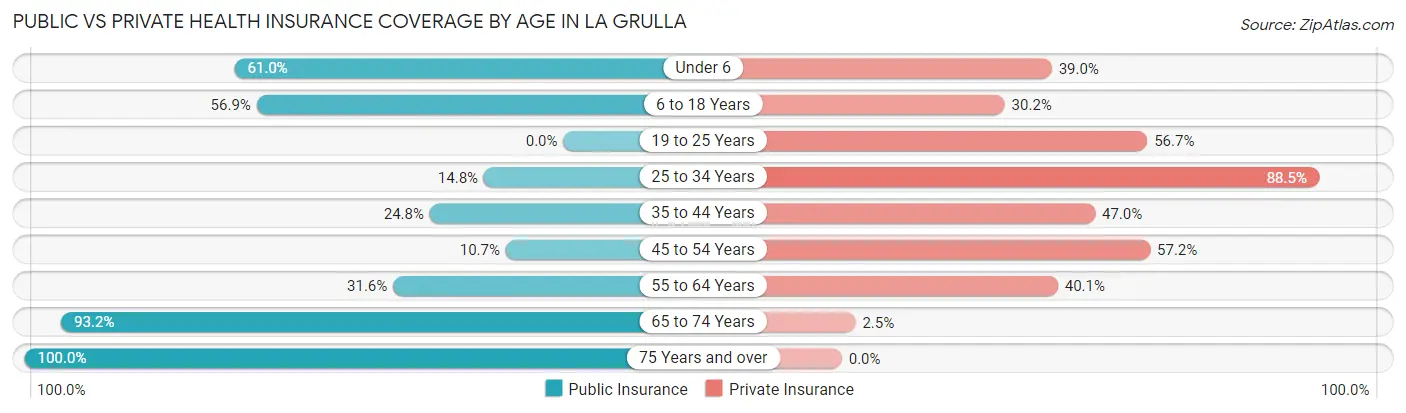
| Age Bracket | Public Insurance | Private Insurance |
| Under 6 | 47 (61.0%) | 30 (39.0%) |
| 6 to 18 Years | 226 (56.9%) | 120 (30.2%) |
| 19 to 25 Years | 0 (0.0%) | 72 (56.7%) |
| 25 to 34 Years | 18 (14.7%) | 108 (88.5%) |
| 35 to 44 Years | 29 (24.8%) | 55 (47.0%) |
| 45 to 54 Years | 17 (10.7%) | 91 (57.2%) |
| 55 to 64 Years | 67 (31.6%) | 85 (40.1%) |
| 65 to 74 Years | 110 (93.2%) | 3 (2.5%) |
| 75 Years and over | 46 (100.0%) | 0 (0.0%) |
| Total | 560 (40.7%) | 564 (41.0%) |
Disability Status by Sex by Age in La Grulla
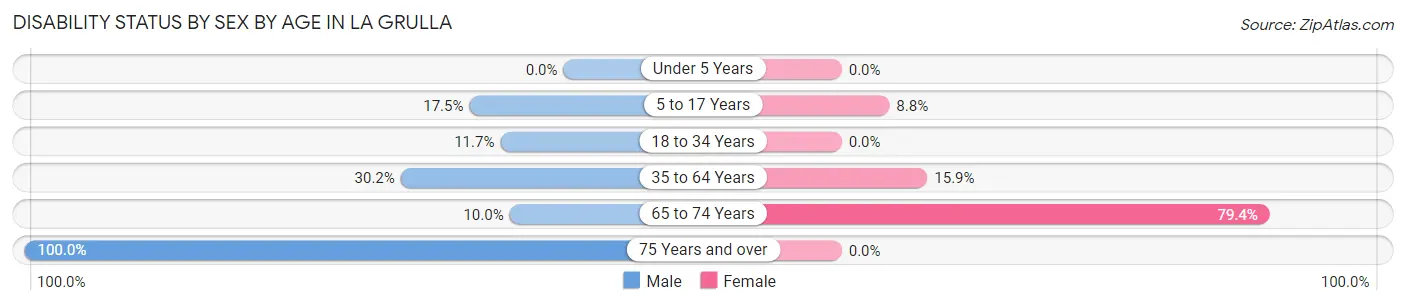
| Age Bracket | Male | Female |
| Under 5 Years | 0 (0.0%) | 0 (0.0%) |
| 5 to 17 Years | 44 (17.5%) | 13 (8.8%) |
| 18 to 34 Years | 17 (11.7%) | 0 (0.0%) |
| 35 to 64 Years | 58 (30.2%) | 47 (15.9%) |
| 65 to 74 Years | 5 (10.0%) | 54 (79.4%) |
| 75 Years and over | 46 (100.0%) | 0 (0.0%) |
Disability Class by Sex by Age in La Grulla
Disability Class: Hearing Difficulty
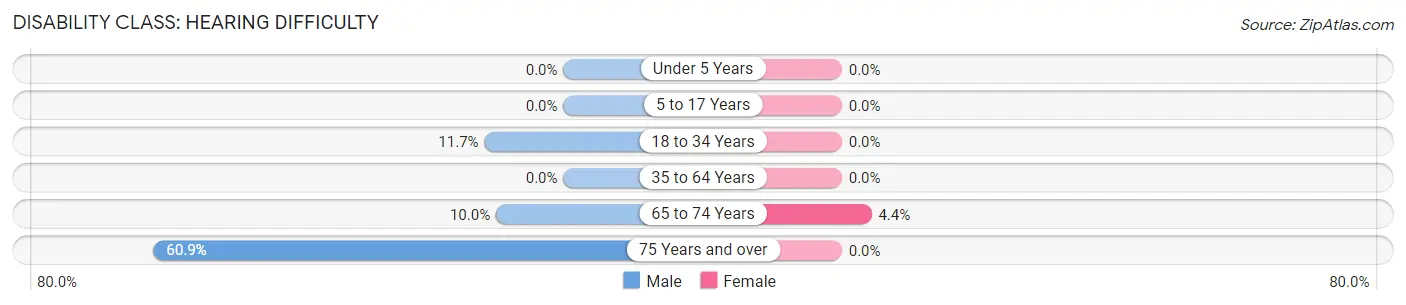
| Age Bracket | Male | Female |
| Under 5 Years | 0 (0.0%) | 0 (0.0%) |
| 5 to 17 Years | 0 (0.0%) | 0 (0.0%) |
| 18 to 34 Years | 17 (11.7%) | 0 (0.0%) |
| 35 to 64 Years | 0 (0.0%) | 0 (0.0%) |
| 65 to 74 Years | 5 (10.0%) | 3 (4.4%) |
| 75 Years and over | 28 (60.9%) | 0 (0.0%) |
Disability Class: Vision Difficulty
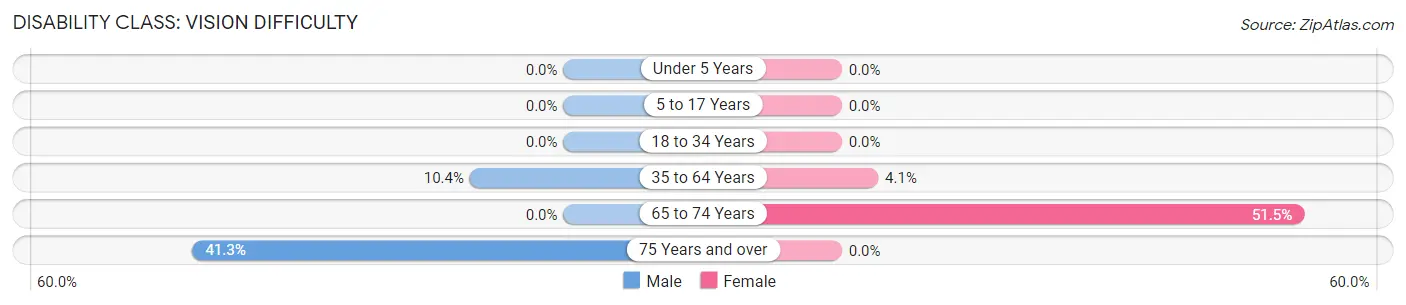
| Age Bracket | Male | Female |
| Under 5 Years | 0 (0.0%) | 0 (0.0%) |
| 5 to 17 Years | 0 (0.0%) | 0 (0.0%) |
| 18 to 34 Years | 0 (0.0%) | 0 (0.0%) |
| 35 to 64 Years | 20 (10.4%) | 12 (4.1%) |
| 65 to 74 Years | 0 (0.0%) | 35 (51.5%) |
| 75 Years and over | 19 (41.3%) | 0 (0.0%) |
Disability Class: Cognitive Difficulty
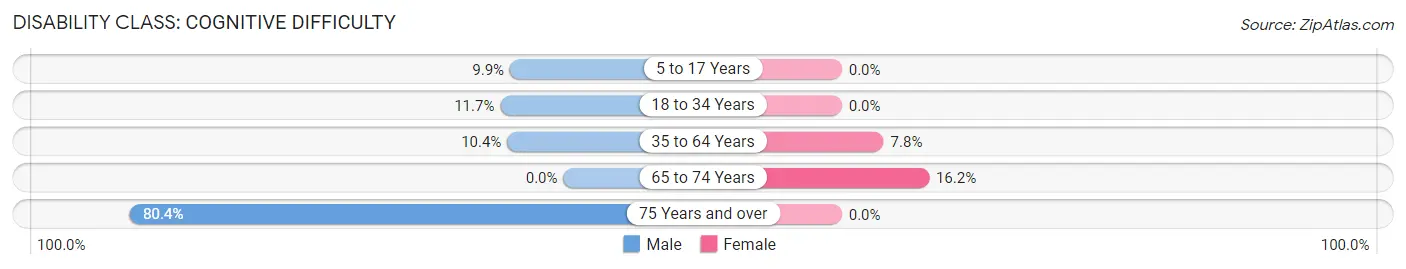
| Age Bracket | Male | Female |
| 5 to 17 Years | 25 (9.9%) | 0 (0.0%) |
| 18 to 34 Years | 17 (11.7%) | 0 (0.0%) |
| 35 to 64 Years | 20 (10.4%) | 23 (7.8%) |
| 65 to 74 Years | 0 (0.0%) | 11 (16.2%) |
| 75 Years and over | 37 (80.4%) | 0 (0.0%) |
Disability Class: Ambulatory Difficulty
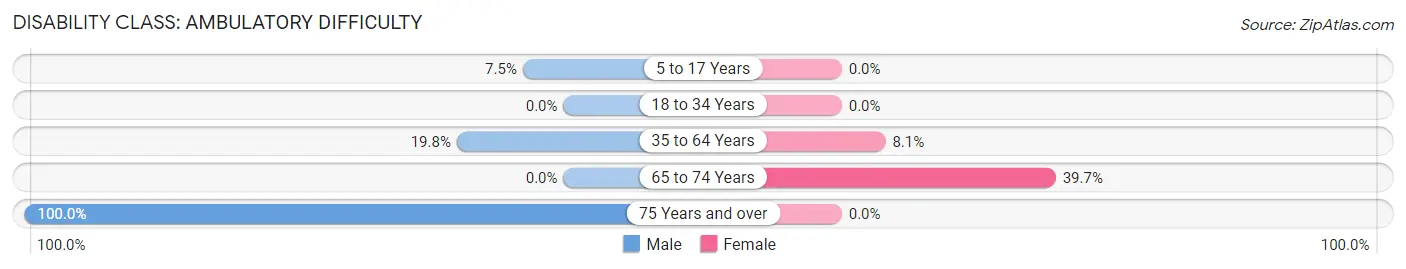
| Age Bracket | Male | Female |
| 5 to 17 Years | 19 (7.5%) | 0 (0.0%) |
| 18 to 34 Years | 0 (0.0%) | 0 (0.0%) |
| 35 to 64 Years | 38 (19.8%) | 24 (8.1%) |
| 65 to 74 Years | 0 (0.0%) | 27 (39.7%) |
| 75 Years and over | 46 (100.0%) | 0 (0.0%) |
Disability Class: Self-Care Difficulty
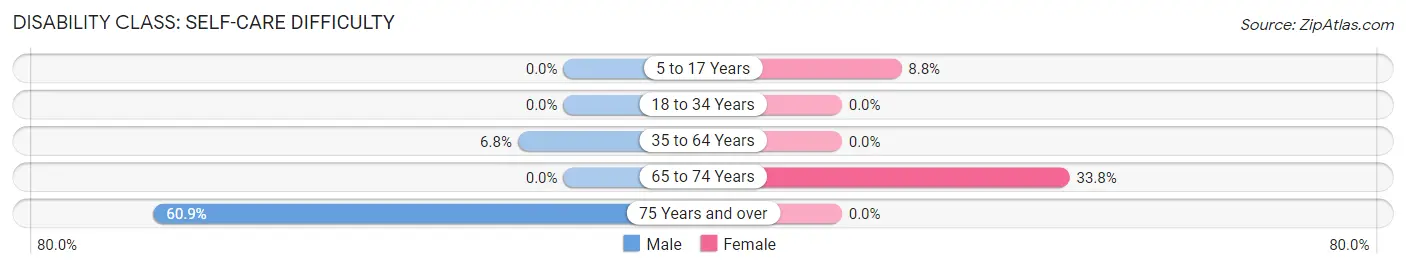
| Age Bracket | Male | Female |
| 5 to 17 Years | 0 (0.0%) | 13 (8.8%) |
| 18 to 34 Years | 0 (0.0%) | 0 (0.0%) |
| 35 to 64 Years | 13 (6.8%) | 0 (0.0%) |
| 65 to 74 Years | 0 (0.0%) | 23 (33.8%) |
| 75 Years and over | 28 (60.9%) | 0 (0.0%) |
Technology Access in La Grulla
Computing Device Access in La Grulla
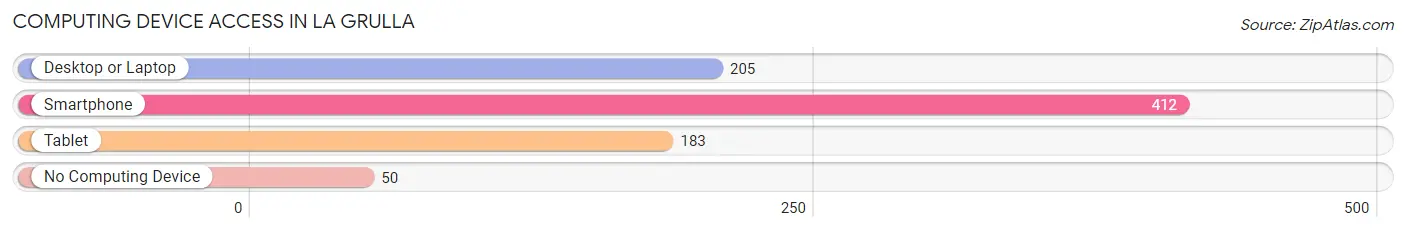
| Device Type | # Households | % Households |
| Desktop or Laptop | 205 | 44.4% |
| Smartphone | 412 | 89.2% |
| Tablet | 183 | 39.6% |
| No Computing Device | 50 | 10.8% |
| Total | 462 | 100.0% |
Internet Access in La Grulla
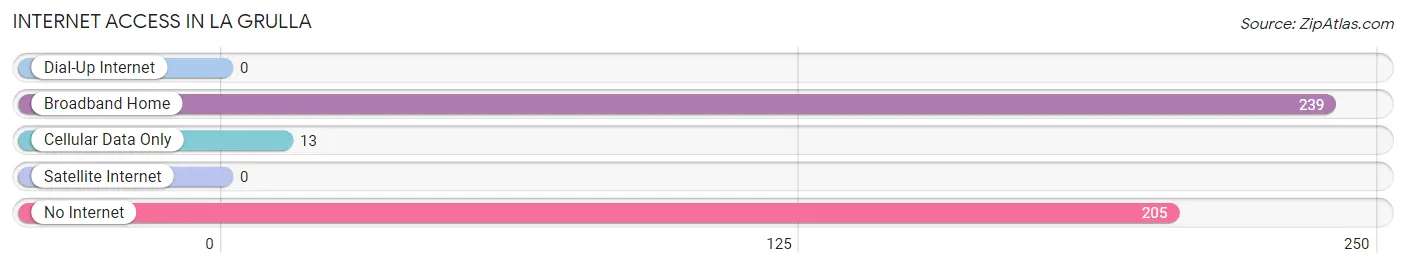
| Internet Type | # Households | % Households |
| Dial-Up Internet | 0 | 0.0% |
| Broadband Home | 239 | 51.7% |
| Cellular Data Only | 13 | 2.8% |
| Satellite Internet | 0 | 0.0% |
| No Internet | 205 | 44.4% |
| Total | 462 | 100.0% |
La Grulla Summary
Grulla, Texas is a small unincorporated community located in Starr County, Texas. It is situated on the Rio Grande, approximately 20 miles south of Rio Grande City and about 10 miles north of the Mexican border. The population of Grulla was estimated to be 1,845 in 2019.
History
Grulla, Texas was founded in 1848 by a group of Mexican settlers who were looking for a place to settle and raise their families. The name “Grulla” is derived from the Spanish word for crane, which is a bird that is commonly found in the area. The settlers chose this name because of the abundance of cranes in the area.
The first settlers of Grulla were mostly farmers and ranchers, and the town quickly grew to become a thriving agricultural community. In the late 1800s, the town was home to several stores, a post office, a school, and a church.
In the early 1900s, Grulla experienced a period of growth and development. The town was connected to the rest of the state by the St. Louis, Brownsville and Mexico Railway, which allowed for the transportation of goods and people. This railway also allowed for the development of a cotton gin and a sugar mill, which helped to further the town’s economy.
Geography
Grulla is located in Starr County, Texas, approximately 20 miles south of Rio Grande City and about 10 miles north of the Mexican border. The town is situated on the Rio Grande, which serves as the international border between the United States and Mexico.
The terrain of Grulla is mostly flat, with some rolling hills. The climate is semi-arid, with hot summers and mild winters. The average annual temperature is around 70 degrees Fahrenheit.
Economy
Grulla’s economy is largely based on agriculture. The town is home to several farms and ranches, which produce a variety of crops, including cotton, corn, sorghum, and wheat. The town is also home to several businesses, including a grocery store, a hardware store, and a restaurant.
The town is also home to several manufacturing companies, which produce a variety of products, including furniture, clothing, and electronics. The town is also home to several oil and gas companies, which are involved in the exploration and production of oil and gas in the area.
Demographics
Grulla is a predominantly Hispanic community, with a population of 1,845 in 2019. The majority of the population is of Mexican descent, with a small percentage of other ethnicities, including African American, Asian, and Native American.
The median household income in Grulla is $25,000, and the median home value is $50,000. The town has a poverty rate of 28.3%, which is higher than the national average.
Conclusion
Grulla, Texas is a small unincorporated community located in Starr County, Texas. It is situated on the Rio Grande, approximately 20 miles south of Rio Grande City and about 10 miles north of the Mexican border. The population of Grulla was estimated to be 1,845 in 2019. The town’s economy is largely based on agriculture, with several farms and ranches producing a variety of crops. The town is also home to several businesses, including a grocery store, a hardware store, and a restaurant. The town is predominantly Hispanic, with a population of 1,845 in 2019. The median household income in Grulla is $25,000, and the median home value is $50,000.
Common Questions
What is Per Capita Income in La Grulla?
Per Capita income in La Grulla is $16,488.
What is the Median Family Income in La Grulla?
Median Family Income in La Grulla is $44,397.
What is the Median Household income in La Grulla?
Median Household Income in La Grulla is $38,611.
What is Income or Wage Gap in La Grulla?
Income or Wage Gap in La Grulla is 17.6%.
Women in La Grulla earn 82.4 cents for every dollar earned by a man.
What is Inequality or Gini Index in La Grulla?
Inequality or Gini Index in La Grulla is 0.46.
What is the Total Population of La Grulla?
Total Population of La Grulla is 1,375.
What is the Total Male Population of La Grulla?
Total Male Population of La Grulla is 710.
What is the Total Female Population of La Grulla?
Total Female Population of La Grulla is 665.
What is the Ratio of Males per 100 Females in La Grulla?
There are 106.77 Males per 100 Females in La Grulla.
What is the Ratio of Females per 100 Males in La Grulla?
There are 93.66 Females per 100 Males in La Grulla.
What is the Median Population Age in La Grulla?
Median Population Age in La Grulla is 30.0 Years.
What is the Average Family Size in La Grulla
Average Family Size in La Grulla is 3.5 People.
What is the Average Household Size in La Grulla
Average Household Size in La Grulla is 3.0 People.
How Large is the Labor Force in La Grulla?
There are 568 People in the Labor Forcein in La Grulla.
What is the Percentage of People in the Labor Force in La Grulla?
59.4% of People are in the Labor Force in La Grulla.
What is the Unemployment Rate in La Grulla?
Unemployment Rate in La Grulla is 8.1%.