El Rancho Vela, TX Map & Demographics
El Rancho Vela Map
El Rancho Vela Overview
$22,867
PER CAPITA INCOME
$46,989
AVG HOUSEHOLD INCOME
0.29
INEQUALITY / GINI INDEX
594
TOTAL POPULATION
268
MALE POPULATION
326
FEMALE POPULATION
82.21
MALES / 100 FEMALES
121.64
FEMALES / 100 MALES
29.8
MEDIAN AGE
2.5
AVG FAMILY SIZE
2.9
AVG HOUSEHOLD SIZE
326
LABOR FORCE [ PEOPLE ]
57.5%
PERCENT IN LABOR FORCE
Income in El Rancho Vela
Income Overview in El Rancho Vela
| Characteristic | Number | Measure |
| Per Capita Income | 594 | $22,867 |
| Median Family Income | 155 | $0 |
| Mean Family Income | 155 | $72,393 |
| Median Household Income | 205 | $46,989 |
| Mean Household Income | 205 | $65,784 |
| Income Deficit | 155 | $0 |
| Wage / Income Gap (%) | 594 | 0.00% |
| Wage / Income Gap ($) | 594 | 100.00¢ per $1 |
| Gini / Inequality Index | 594 | 0.29 |
Earnings by Sex in El Rancho Vela
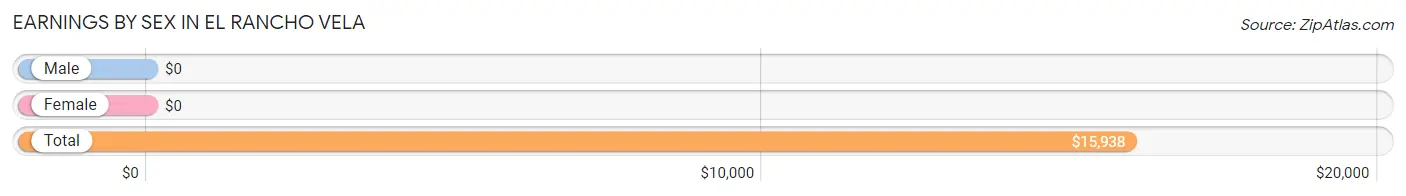
| Sex | Number | Average Earnings |
| Male | 200 (54.6%) | $0 |
| Female | 166 (45.4%) | $0 |
| Total | 366 (100.0%) | $15,938 |
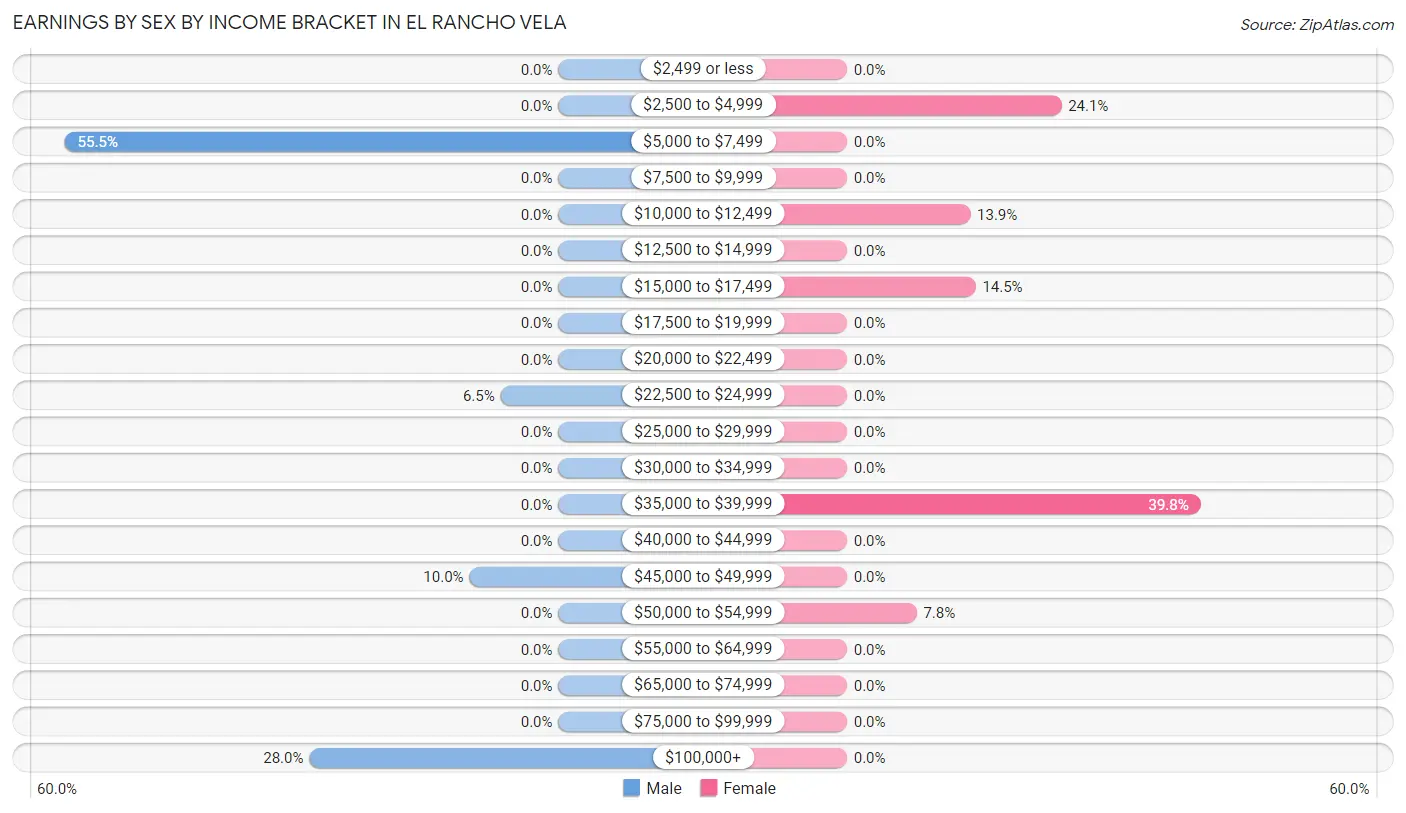
Earnings by Sex by Income Bracket in El Rancho Vela
The most common earnings brackets in El Rancho Vela are $5,000 to $7,499 for men (111 | 55.5%) and $35,000 to $39,999 for women (66 | 39.8%).
| Income | Male | Female |
| $2,499 or less | 0 (0.0%) | 0 (0.0%) |
| $2,500 to $4,999 | 0 (0.0%) | 40 (24.1%) |
| $5,000 to $7,499 | 111 (55.5%) | 0 (0.0%) |
| $7,500 to $9,999 | 0 (0.0%) | 0 (0.0%) |
| $10,000 to $12,499 | 0 (0.0%) | 23 (13.9%) |
| $12,500 to $14,999 | 0 (0.0%) | 0 (0.0%) |
| $15,000 to $17,499 | 0 (0.0%) | 24 (14.5%) |
| $17,500 to $19,999 | 0 (0.0%) | 0 (0.0%) |
| $20,000 to $22,499 | 0 (0.0%) | 0 (0.0%) |
| $22,500 to $24,999 | 13 (6.5%) | 0 (0.0%) |
| $25,000 to $29,999 | 0 (0.0%) | 0 (0.0%) |
| $30,000 to $34,999 | 0 (0.0%) | 0 (0.0%) |
| $35,000 to $39,999 | 0 (0.0%) | 66 (39.8%) |
| $40,000 to $44,999 | 0 (0.0%) | 0 (0.0%) |
| $45,000 to $49,999 | 20 (10.0%) | 0 (0.0%) |
| $50,000 to $54,999 | 0 (0.0%) | 13 (7.8%) |
| $55,000 to $64,999 | 0 (0.0%) | 0 (0.0%) |
| $65,000 to $74,999 | 0 (0.0%) | 0 (0.0%) |
| $75,000 to $99,999 | 0 (0.0%) | 0 (0.0%) |
| $100,000+ | 56 (28.0%) | 0 (0.0%) |
| Total | 200 (100.0%) | 166 (100.0%) |
Earnings by Sex by Educational Attainment in El Rancho Vela
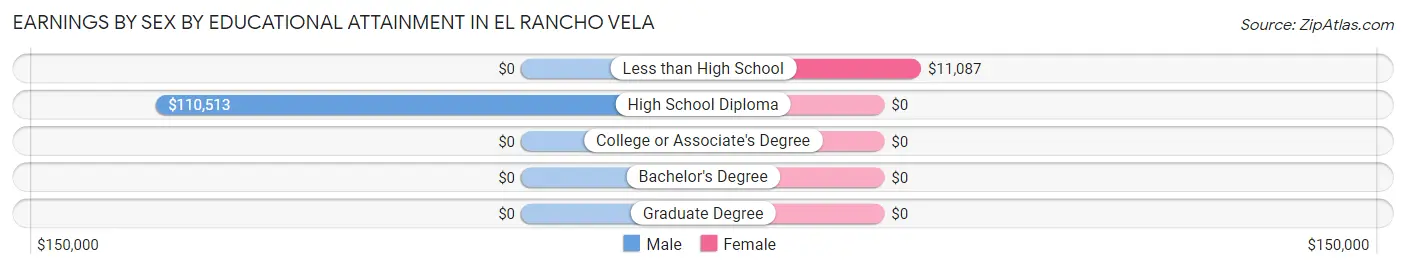
| Educational Attainment | Male Income | Female Income |
| Less than High School | - | - |
| High School Diploma | $110,513 | $0 |
| College or Associate's Degree | - | - |
| Bachelor's Degree | - | - |
| Graduate Degree | - | - |
| Total | - | - |
Family Income in El Rancho Vela
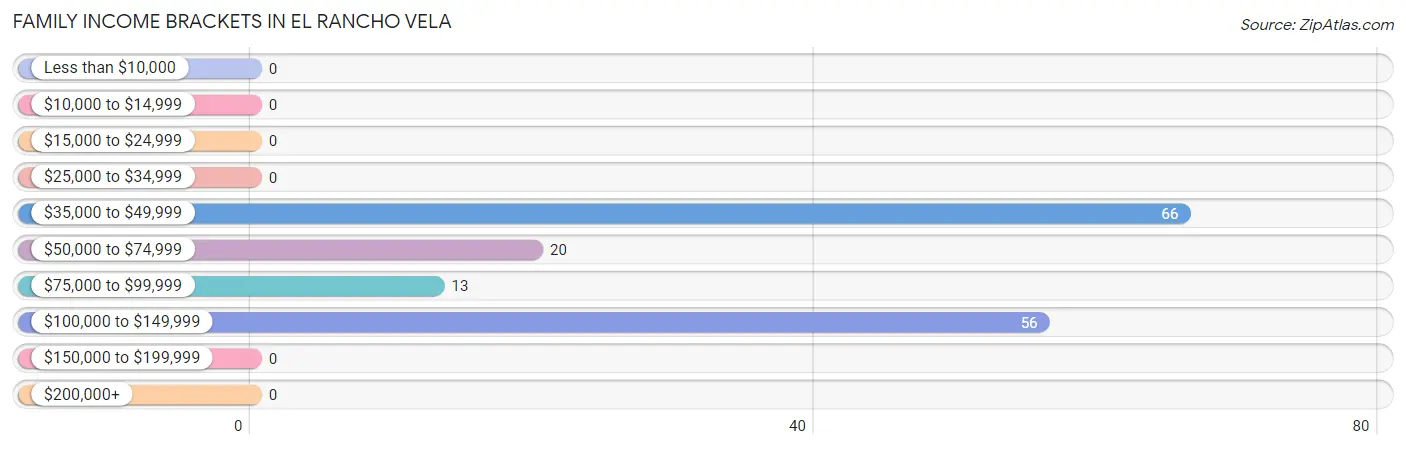
Family Income Brackets in El Rancho Vela
According to the El Rancho Vela family income data, there are 66 families falling into the $35,000 to $49,999 income range, which is the most common income bracket and makes up 42.6% of all families.
| Income Bracket | # Families | % Families |
| Less than $10,000 | 0 | 0.0% |
| $10,000 to $14,999 | 0 | 0.0% |
| $15,000 to $24,999 | 0 | 0.0% |
| $25,000 to $34,999 | 0 | 0.0% |
| $35,000 to $49,999 | 66 | 42.6% |
| $50,000 to $74,999 | 20 | 12.9% |
| $75,000 to $99,999 | 13 | 8.4% |
| $100,000 to $149,999 | 56 | 36.1% |
| $150,000 to $199,999 | 0 | 0.0% |
| $200,000+ | 0 | 0.0% |
Family Income by Famaliy Size in El Rancho Vela
| Income Bracket | # Families | Median Income |
| 2-Person Families | 69 (44.5%) | $0 |
| 3-Person Families | 86 (55.5%) | $0 |
| 4-Person Families | 0 (0.0%) | $0 |
| 5-Person Families | 0 (0.0%) | $0 |
| 6-Person Families | 0 (0.0%) | $0 |
| 7+ Person Families | 0 (0.0%) | $0 |
| Total | 155 (100.0%) | $0 |
Family Income by Number of Earners in El Rancho Vela
| Number of Earners | # Families | Median Income |
| No Earners | 0 (0.0%) | $0 |
| 1 Earner | 122 (78.7%) | $0 |
| 2 Earners | 33 (21.3%) | $0 |
| 3+ Earners | 0 (0.0%) | $0 |
| Total | 155 (100.0%) | $0 |
Household Income in El Rancho Vela
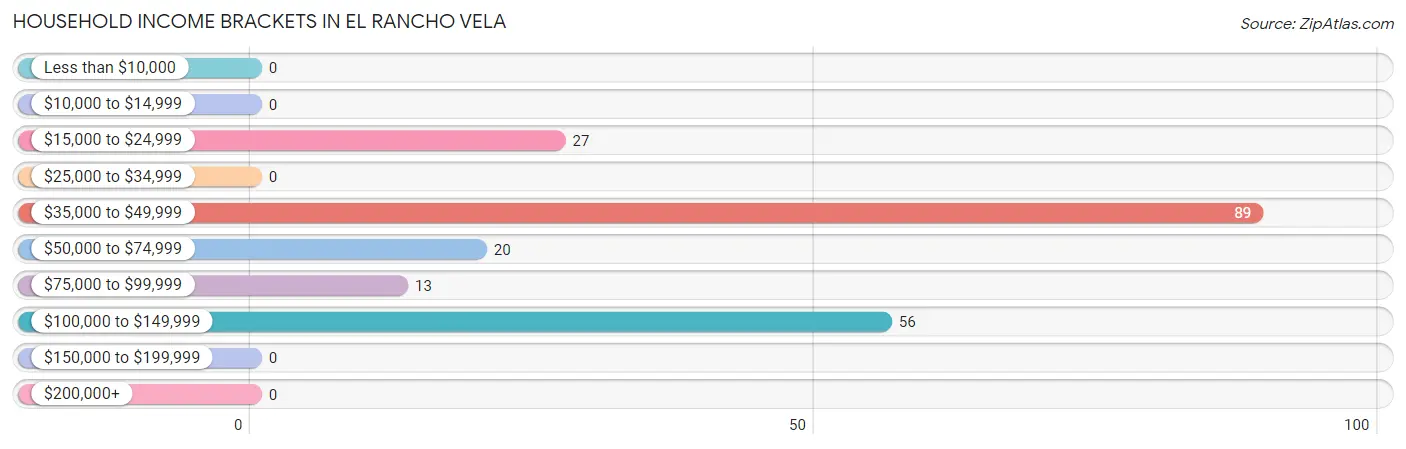
Household Income Brackets in El Rancho Vela
With 89 households falling in the category, the $35,000 to $49,999 income range is the most frequent in El Rancho Vela, accounting for 43.4% of all households.
| Income Bracket | # Households | % Households |
| Less than $10,000 | 0 | 0.0% |
| $10,000 to $14,999 | 0 | 0.0% |
| $15,000 to $24,999 | 27 | 13.2% |
| $25,000 to $34,999 | 0 | 0.0% |
| $35,000 to $49,999 | 89 | 43.4% |
| $50,000 to $74,999 | 20 | 9.8% |
| $75,000 to $99,999 | 13 | 6.3% |
| $100,000 to $149,999 | 56 | 27.3% |
| $150,000 to $199,999 | 0 | 0.0% |
| $200,000+ | 0 | 0.0% |
Household Income by Householder Age in El Rancho Vela
The median household income in El Rancho Vela is $46,989, with the highest median household income of $46,780 found in the 45 to 64 years age bracket for the primary householder. A total of 104 households (50.7%) fall into this category.
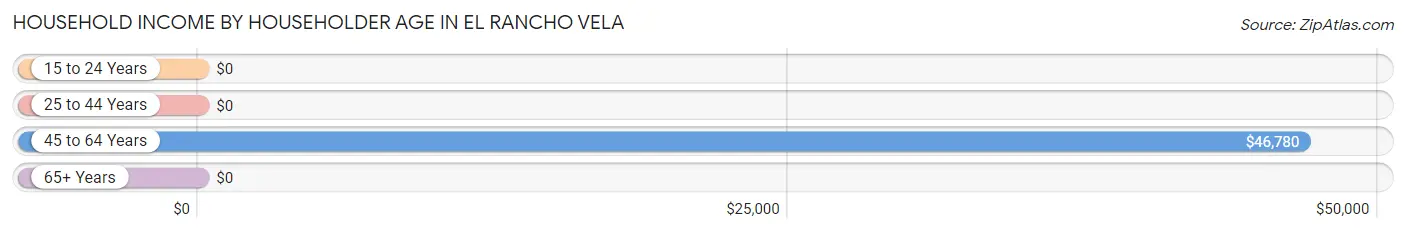
| Income Bracket | # Households | Median Income |
| 15 to 24 Years | 0 (0.0%) | $0 |
| 25 to 44 Years | 56 (27.3%) | $0 |
| 45 to 64 Years | 104 (50.7%) | $46,780 |
| 65+ Years | 45 (22.0%) | $0 |
| Total | 205 (100.0%) | $46,989 |
Poverty in El Rancho Vela
Income Below Poverty by Sex and Age in El Rancho Vela
With 41.4% poverty level for males and 12.3% for females among the residents of El Rancho Vela, 25 to 34 year old males and 35 to 44 year old females are the most vulnerable to poverty, with 111 males (100.0%) and 40 females (100.0%) in their respective age groups living below the poverty level.
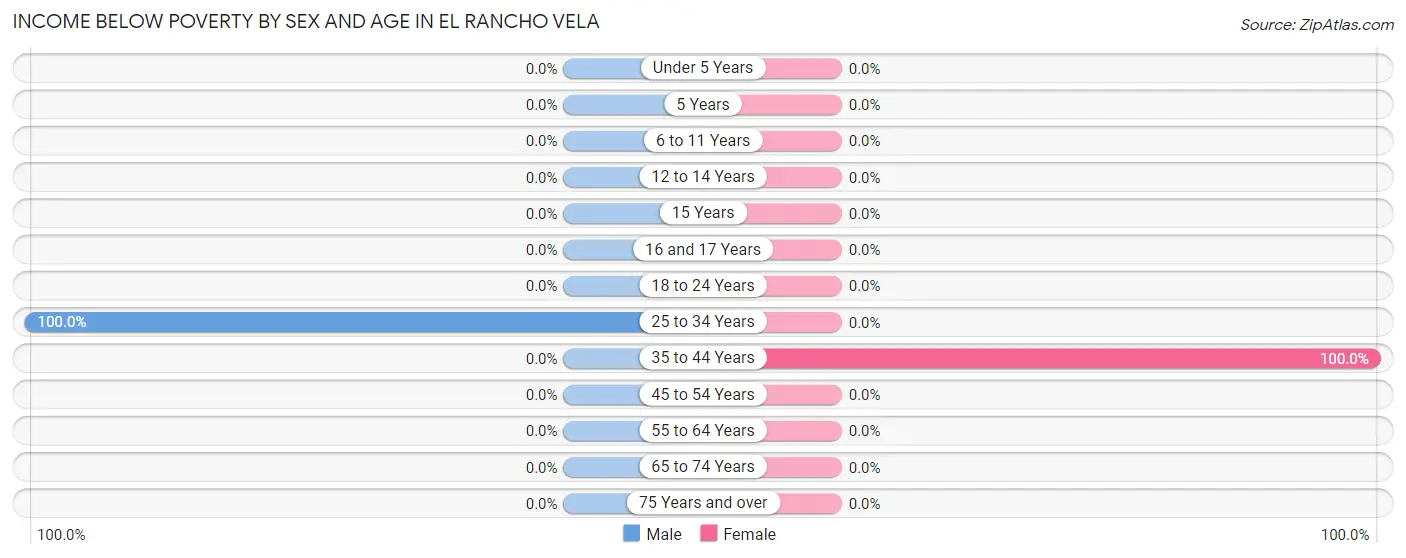
| Age Bracket | Male | Female |
| Under 5 Years | 0 (0.0%) | 0 (0.0%) |
| 5 Years | 0 (0.0%) | 0 (0.0%) |
| 6 to 11 Years | 0 (0.0%) | 0 (0.0%) |
| 12 to 14 Years | 0 (0.0%) | 0 (0.0%) |
| 15 Years | 0 (0.0%) | 0 (0.0%) |
| 16 and 17 Years | 0 (0.0%) | 0 (0.0%) |
| 18 to 24 Years | 0 (0.0%) | 0 (0.0%) |
| 25 to 34 Years | 111 (100.0%) | 0 (0.0%) |
| 35 to 44 Years | 0 (0.0%) | 40 (100.0%) |
| 45 to 54 Years | 0 (0.0%) | 0 (0.0%) |
| 55 to 64 Years | 0 (0.0%) | 0 (0.0%) |
| 65 to 74 Years | 0 (0.0%) | 0 (0.0%) |
| 75 Years and over | 0 (0.0%) | 0 (0.0%) |
| Total | 111 (41.4%) | 40 (12.3%) |
Income Above Poverty by Sex and Age in El Rancho Vela
According to the poverty statistics in El Rancho Vela, males aged 16 and 17 years and females aged 12 to 14 years are the age groups that are most secure financially, with 100.0% of males and 100.0% of females in these age groups living above the poverty line.
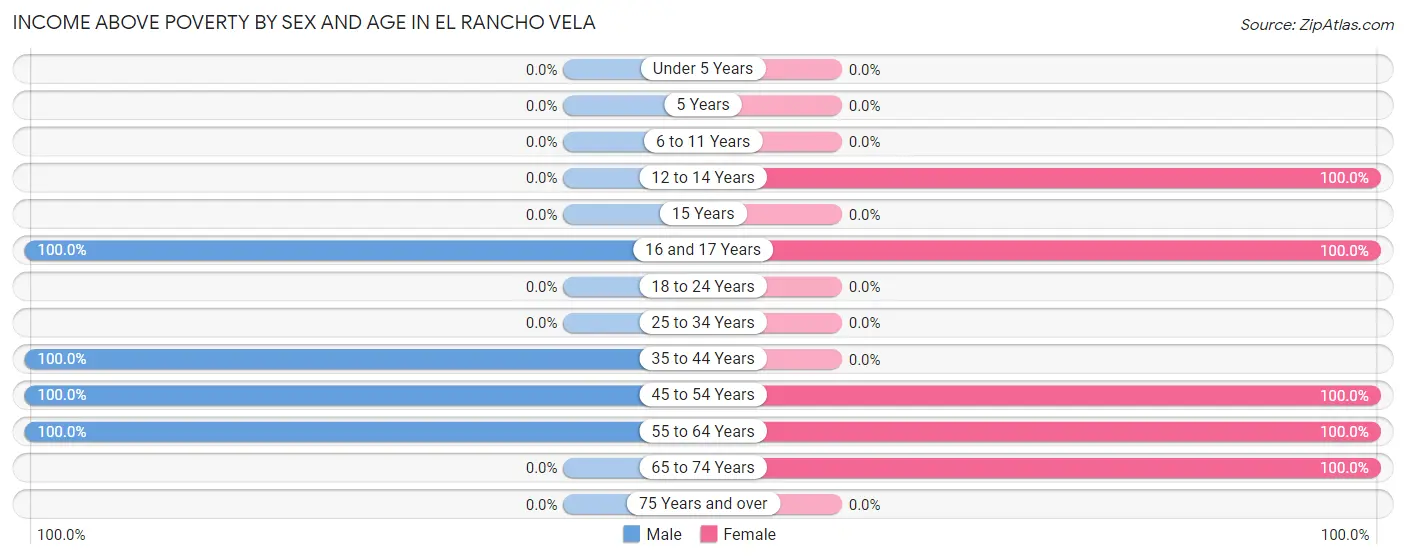
| Age Bracket | Male | Female |
| Under 5 Years | 0 (0.0%) | 0 (0.0%) |
| 5 Years | 0 (0.0%) | 0 (0.0%) |
| 6 to 11 Years | 0 (0.0%) | 0 (0.0%) |
| 12 to 14 Years | 0 (0.0%) | 27 (100.0%) |
| 15 Years | 0 (0.0%) | 0 (0.0%) |
| 16 and 17 Years | 68 (100.0%) | 111 (100.0%) |
| 18 to 24 Years | 0 (0.0%) | 0 (0.0%) |
| 25 to 34 Years | 0 (0.0%) | 0 (0.0%) |
| 35 to 44 Years | 56 (100.0%) | 0 (0.0%) |
| 45 to 54 Years | 20 (100.0%) | 98 (100.0%) |
| 55 to 64 Years | 13 (100.0%) | 5 (100.0%) |
| 65 to 74 Years | 0 (0.0%) | 45 (100.0%) |
| 75 Years and over | 0 (0.0%) | 0 (0.0%) |
| Total | 157 (58.6%) | 286 (87.7%) |
Income Below Poverty Among Married-Couple Families in El Rancho Vela
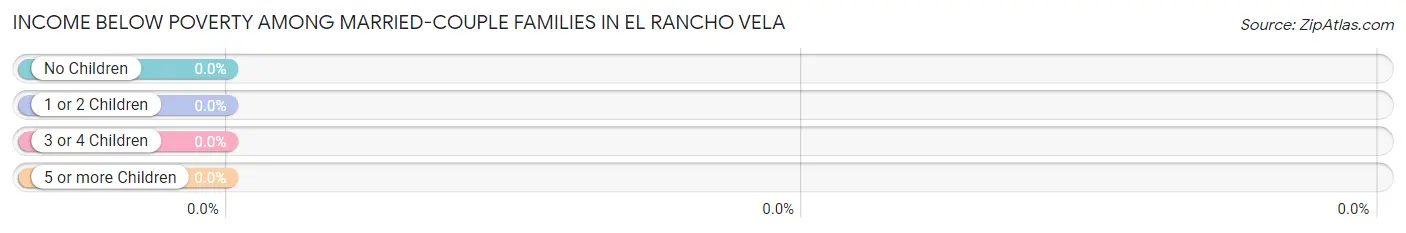
| Children | Above Poverty | Below Poverty |
| No Children | 13 (100.0%) | 0 (0.0%) |
| 1 or 2 Children | 20 (100.0%) | 0 (0.0%) |
| 3 or 4 Children | 0 (0.0%) | 0 (0.0%) |
| 5 or more Children | 0 (0.0%) | 0 (0.0%) |
| Total | 33 (100.0%) | 0 (0.0%) |
Income Below Poverty Among Single-Parent Households in El Rancho Vela
| Children | Single Father | Single Mother |
| No Children | 0 (0.0%) | 0 (0.0%) |
| 1 or 2 Children | 0 (0.0%) | 0 (0.0%) |
| 3 or 4 Children | 0 (0.0%) | 0 (0.0%) |
| 5 or more Children | 0 (0.0%) | 0 (0.0%) |
| Total | 0 (0.0%) | 0 (0.0%) |
Income Below Poverty Among Married-Couple vs Single-Parent Households in El Rancho Vela
| Children | Married-Couple Families | Single-Parent Households |
| No Children | 0 (0.0%) | 0 (0.0%) |
| 1 or 2 Children | 0 (0.0%) | 0 (0.0%) |
| 3 or 4 Children | 0 (0.0%) | 0 (0.0%) |
| 5 or more Children | 0 (0.0%) | 0 (0.0%) |
| Total | 0 (0.0%) | 0 (0.0%) |
Race in El Rancho Vela
The most populous races in El Rancho Vela are Hispanic or Latino (594 | 100.0%), White / Caucasian (544 | 91.6%), and Two or more Races (50 | 8.4%).
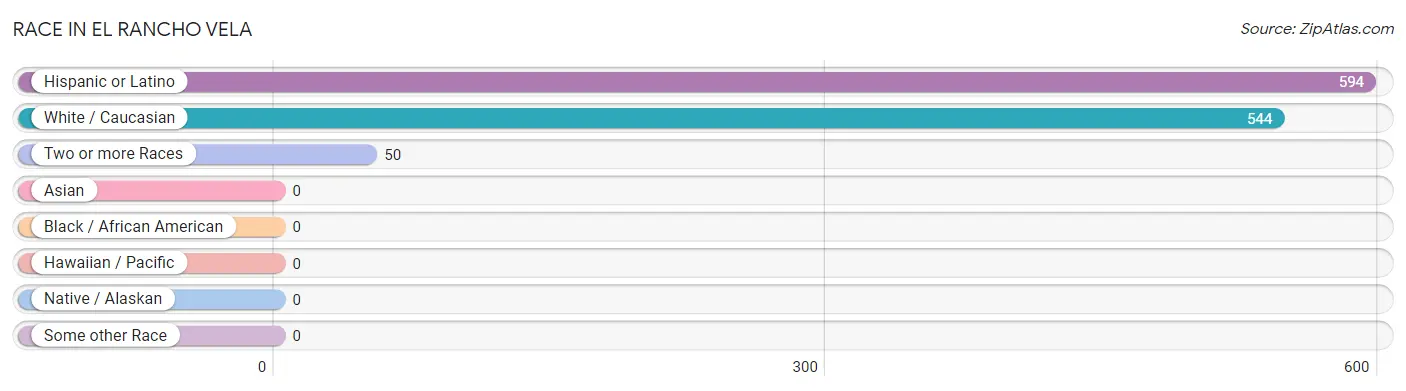
| Race | # Population | % Population |
| Asian | 0 | 0.0% |
| Black / African American | 0 | 0.0% |
| Hawaiian / Pacific | 0 | 0.0% |
| Hispanic or Latino | 594 | 100.0% |
| Native / Alaskan | 0 | 0.0% |
| White / Caucasian | 544 | 91.6% |
| Two or more Races | 50 | 8.4% |
| Some other Race | 0 | 0.0% |
| Total | 594 | 100.0% |
Ancestry in El Rancho Vela
The most populous ancestries reported in El Rancho Vela are , and Mexican (594 | 100.0%), together accounting for 100.0% of all El Rancho Vela residents.

| Ancestry | # Population | % Population |
| Mexican | 594 | 100.0% | View All 1 Rows |
Immigrants in El Rancho Vela
The most numerous immigrant groups reported in El Rancho Vela came from Central America (67 | 11.3%), Latin America (67 | 11.3%), and Mexico (67 | 11.3%), together accounting for 33.8% of all El Rancho Vela residents.
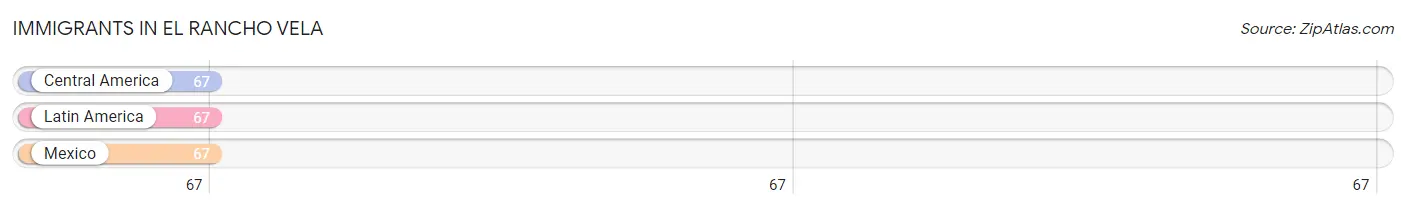
| Immigration Origin | # Population | % Population |
| Central America | 67 | 11.3% |
| Latin America | 67 | 11.3% |
| Mexico | 67 | 11.3% | View All 3 Rows |
Sex and Age in El Rancho Vela
Sex and Age in El Rancho Vela
The most populous age groups in El Rancho Vela are 25 to 29 Years (111 | 41.4%) for men and 15 to 19 Years (111 | 34.1%) for women.
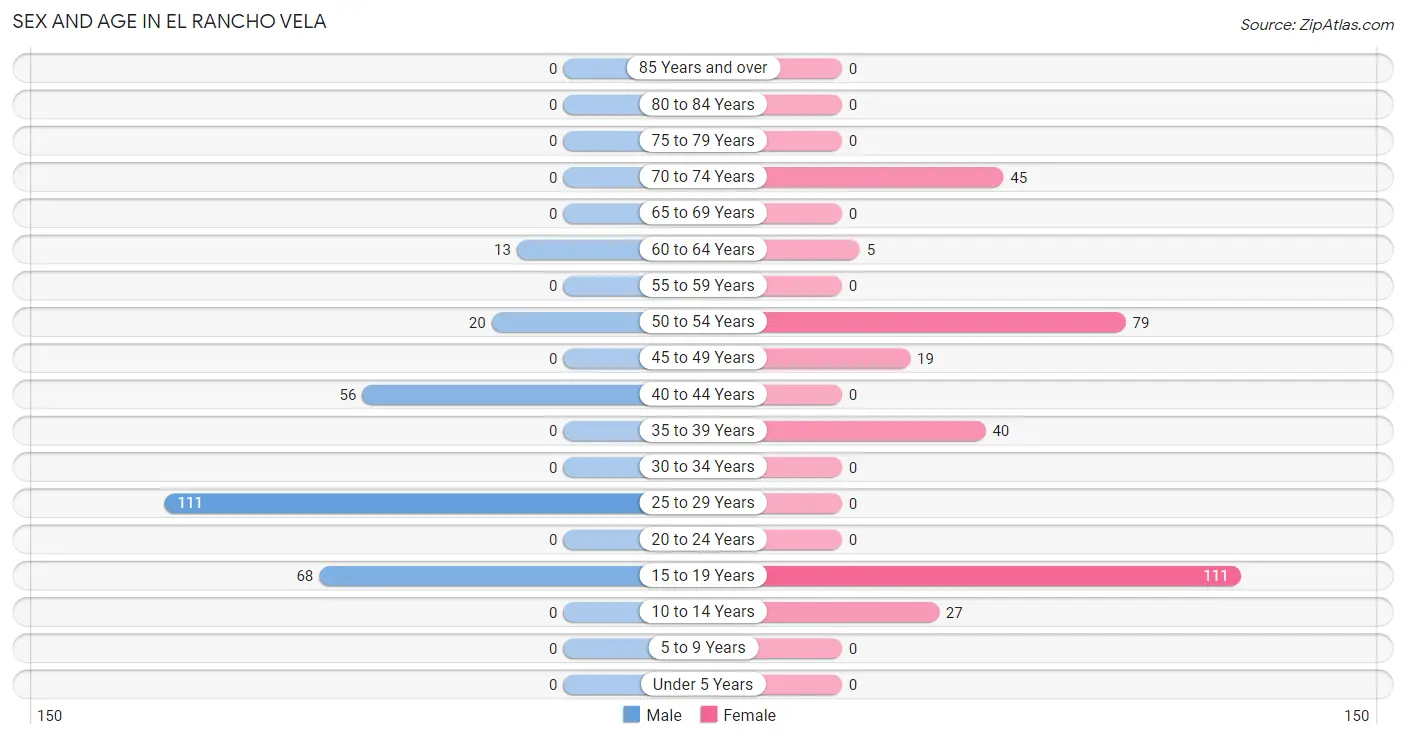
| Age Bracket | Male | Female |
| Under 5 Years | 0 (0.0%) | 0 (0.0%) |
| 5 to 9 Years | 0 (0.0%) | 0 (0.0%) |
| 10 to 14 Years | 0 (0.0%) | 27 (8.3%) |
| 15 to 19 Years | 68 (25.4%) | 111 (34.1%) |
| 20 to 24 Years | 0 (0.0%) | 0 (0.0%) |
| 25 to 29 Years | 111 (41.4%) | 0 (0.0%) |
| 30 to 34 Years | 0 (0.0%) | 0 (0.0%) |
| 35 to 39 Years | 0 (0.0%) | 40 (12.3%) |
| 40 to 44 Years | 56 (20.9%) | 0 (0.0%) |
| 45 to 49 Years | 0 (0.0%) | 19 (5.8%) |
| 50 to 54 Years | 20 (7.5%) | 79 (24.2%) |
| 55 to 59 Years | 0 (0.0%) | 0 (0.0%) |
| 60 to 64 Years | 13 (4.9%) | 5 (1.5%) |
| 65 to 69 Years | 0 (0.0%) | 0 (0.0%) |
| 70 to 74 Years | 0 (0.0%) | 45 (13.8%) |
| 75 to 79 Years | 0 (0.0%) | 0 (0.0%) |
| 80 to 84 Years | 0 (0.0%) | 0 (0.0%) |
| 85 Years and over | 0 (0.0%) | 0 (0.0%) |
| Total | 268 (100.0%) | 326 (100.0%) |
Families and Households in El Rancho Vela
Median Family Size in El Rancho Vela
The median family size in El Rancho Vela is 2.54 persons per family, with single female/mother families (66 | 42.6%) accounting for the largest median family size of 3.12 persons per family. On the other hand, single male/father families (56 | 36.1%) represent the smallest median family size with 1.70 persons per family.
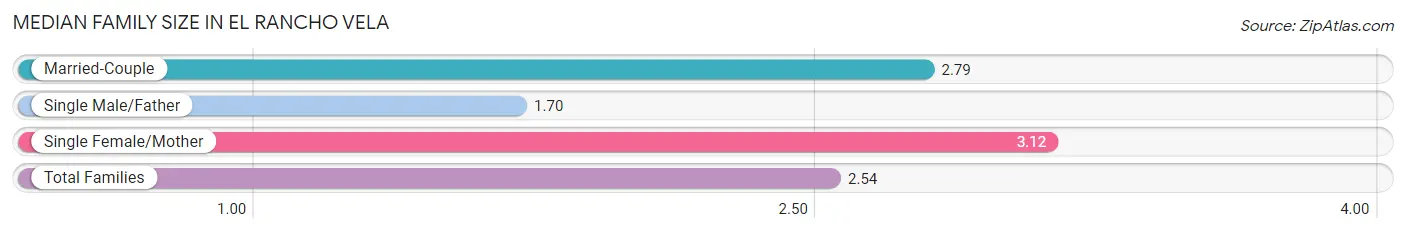
| Family Type | # Families | Family Size |
| Married-Couple | 33 (21.3%) | 2.79 |
| Single Male/Father | 56 (36.1%) | 1.70 |
| Single Female/Mother | 66 (42.6%) | 3.12 |
| Total Families | 155 (100.0%) | 2.54 |
Median Household Size in El Rancho Vela
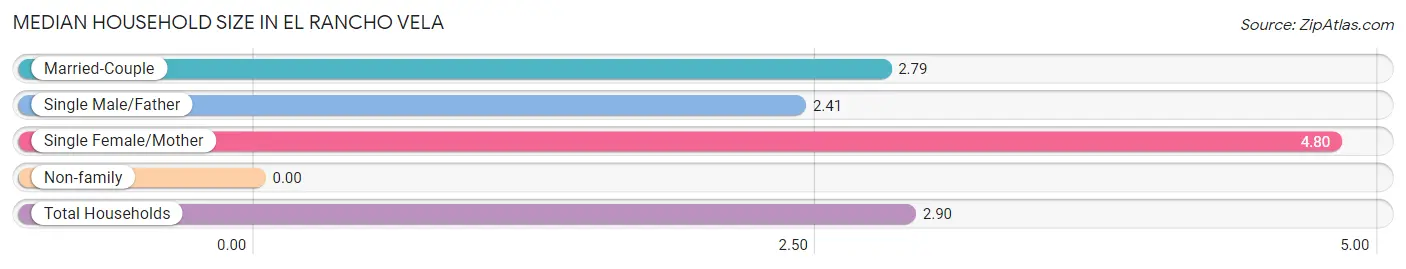
| Household Type | # Households | Household Size |
| Married-Couple | 33 (16.1%) | 2.79 |
| Single Male/Father | 56 (27.3%) | 2.41 |
| Single Female/Mother | 66 (32.2%) | 4.80 |
| Non-family | 50 (24.4%) | - |
| Total Households | 205 (100.0%) | 2.90 |
Household Size by Marriage Status in El Rancho Vela
Out of a total of 205 households in El Rancho Vela, 155 (75.6%) are family households, while 50 (24.4%) are nonfamily households. The most numerous type of family households are 3-person households, comprising 76, and the most common type of nonfamily households are 1-person households, comprising 50.
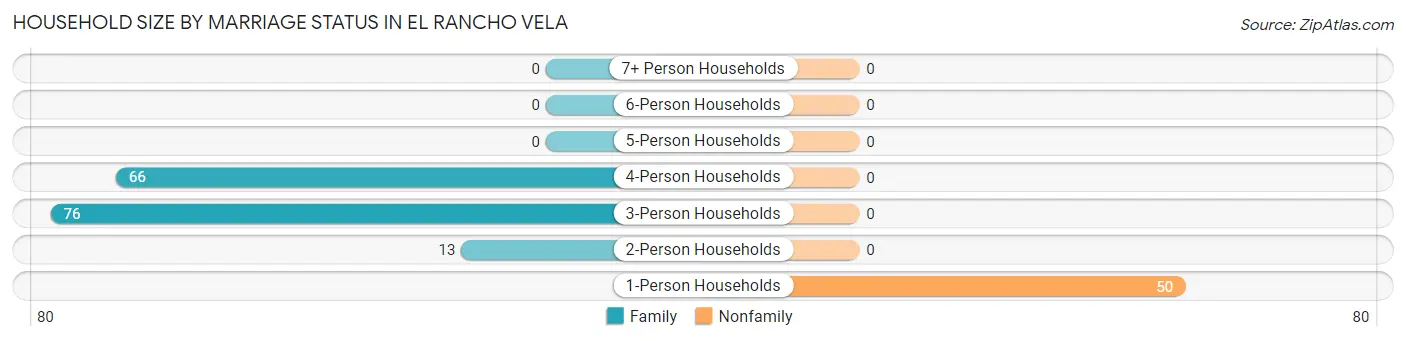
| Household Size | Family Households | Nonfamily Households |
| 1-Person Households | - | 50 (24.4%) |
| 2-Person Households | 13 (6.3%) | 0 (0.0%) |
| 3-Person Households | 76 (37.1%) | 0 (0.0%) |
| 4-Person Households | 66 (32.2%) | 0 (0.0%) |
| 5-Person Households | 0 (0.0%) | 0 (0.0%) |
| 6-Person Households | 0 (0.0%) | 0 (0.0%) |
| 7+ Person Households | 0 (0.0%) | 0 (0.0%) |
| Total | 155 (75.6%) | 50 (24.4%) |
Female Fertility in El Rancho Vela
Fertility by Age in El Rancho Vela
| Age Bracket | Women with Births | Births / 1,000 Women |
| 15 to 19 years | 0 (0.0%) | 0.0 |
| 20 to 34 years | 0 (0.0%) | 0.0 |
| 35 to 50 years | 0 (0.0%) | 0.0 |
| Total | 0 (0.0%) | 0.0 |
Fertility by Age by Marriage Status in El Rancho Vela
| Age Bracket | Married | Unmarried |
| 15 to 19 years | 0 (0.0%) | 0 (0.0%) |
| 20 to 34 years | 0 (0.0%) | 0 (0.0%) |
| 35 to 50 years | 0 (0.0%) | 0 (0.0%) |
| Total | 0 (0.0%) | 0 (0.0%) |
Fertility by Education in El Rancho Vela
| Educational Attainment | Women with Births | Births / 1,000 Women |
| Less than High School | 0 (0.0%) | 0.0 |
| High School Diploma | 0 (0.0%) | 0.0 |
| College or Associate's Degree | 0 (0.0%) | 0.0 |
| Bachelor's Degree | 0 (0.0%) | 0.0 |
| Graduate Degree | 0 (0.0%) | 0.0 |
| Total | 0 (0.0%) | 0.0 |
Fertility by Education by Marriage Status in El Rancho Vela
| Educational Attainment | Married | Unmarried |
| Less than High School | 0 (0.0%) | 0 (0.0%) |
| High School Diploma | 0 (0.0%) | 0 (0.0%) |
| College or Associate's Degree | 0 (0.0%) | 0 (0.0%) |
| Bachelor's Degree | 0 (0.0%) | 0 (0.0%) |
| Graduate Degree | 0 (0.0%) | 0 (0.0%) |
| Total | 0 (0.0%) | 0 (0.0%) |
Employment Characteristics in El Rancho Vela
Employment by Class of Employer in El Rancho Vela
Among the 326 employed individuals in El Rancho Vela, self-employed (not incorporated) (111 | 34.1%), federal government employees (75 | 23.0%), and not-for-profit organizations (66 | 20.3%) make up the most common classes of employment.
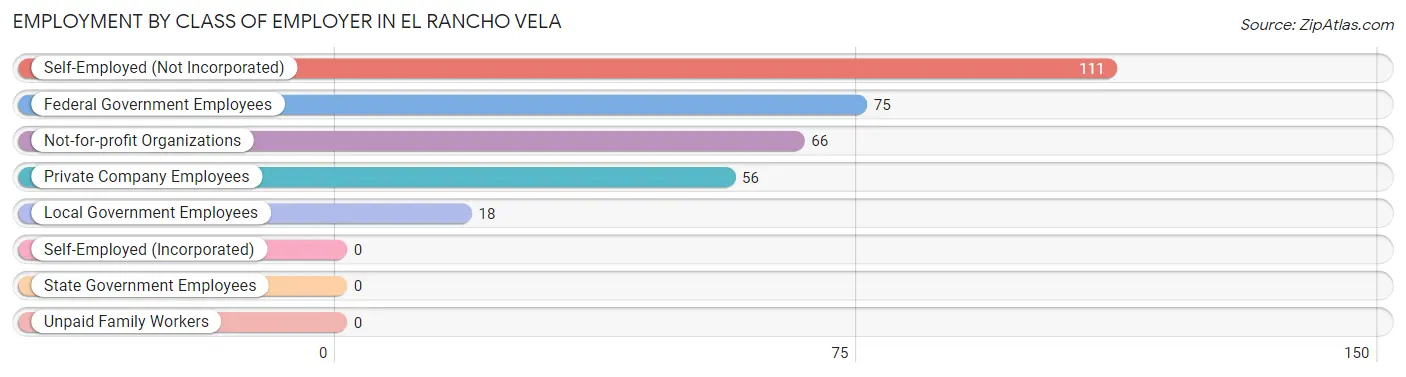
| Employer Class | # Employees | % Employees |
| Private Company Employees | 56 | 17.2% |
| Self-Employed (Incorporated) | 0 | 0.0% |
| Self-Employed (Not Incorporated) | 111 | 34.1% |
| Not-for-profit Organizations | 66 | 20.3% |
| Local Government Employees | 18 | 5.5% |
| State Government Employees | 0 | 0.0% |
| Federal Government Employees | 75 | 23.0% |
| Unpaid Family Workers | 0 | 0.0% |
| Total | 326 | 100.0% |
Employment Status by Age in El Rancho Vela
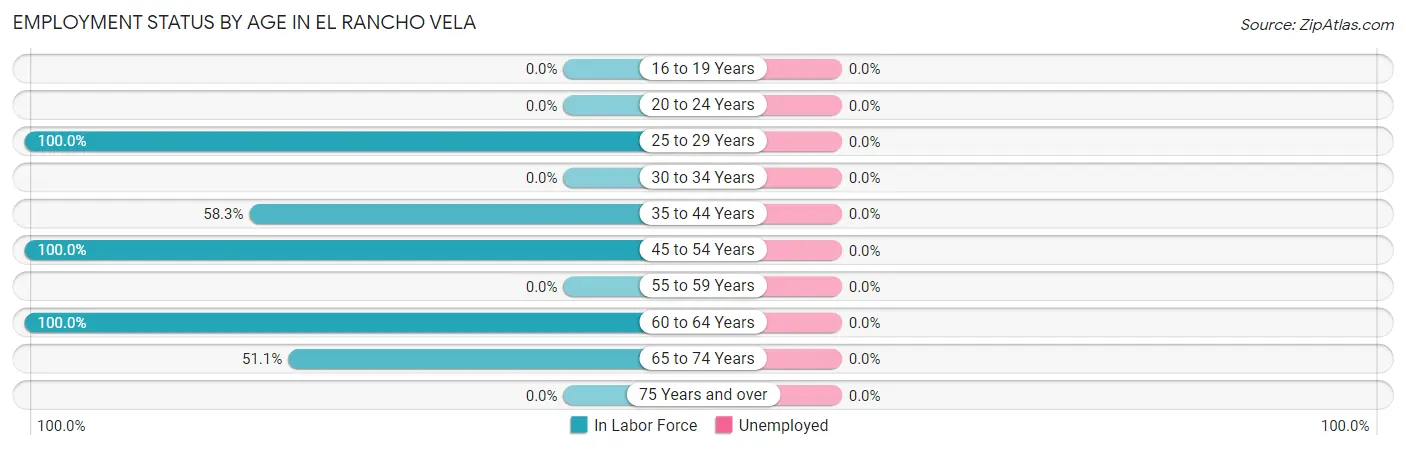
| Age Bracket | In Labor Force | Unemployed |
| 16 to 19 Years | 0 (0.0%) | 0 (0.0%) |
| 20 to 24 Years | 0 (0.0%) | 0 (0.0%) |
| 25 to 29 Years | 111 (100.0%) | 0 (0.0%) |
| 30 to 34 Years | 0 (0.0%) | 0 (0.0%) |
| 35 to 44 Years | 56 (58.3%) | 0 (0.0%) |
| 45 to 54 Years | 118 (100.0%) | 0 (0.0%) |
| 55 to 59 Years | 0 (0.0%) | 0 (0.0%) |
| 60 to 64 Years | 18 (100.0%) | 0 (0.0%) |
| 65 to 74 Years | 23 (51.1%) | 0 (0.0%) |
| 75 Years and over | 0 (0.0%) | 0 (0.0%) |
| Total | 326 (57.5%) | 0 (0.0%) |
Employment Status by Educational Attainment in El Rancho Vela
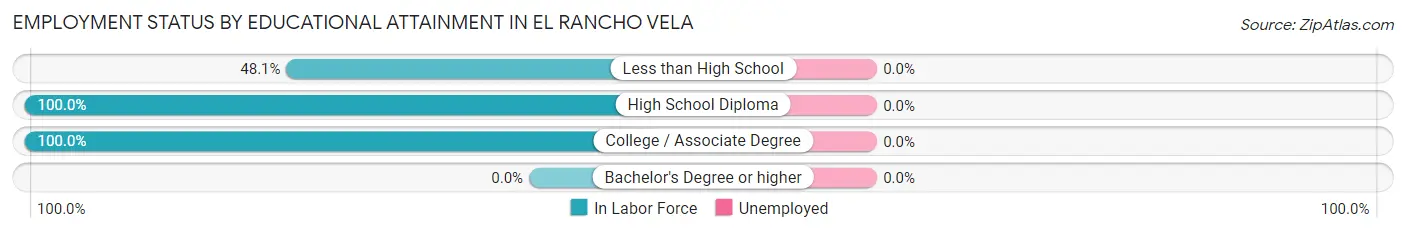
| Educational Attainment | In Labor Force | Unemployed |
| Less than High School | 37 (48.1%) | 0 (0.0%) |
| High School Diploma | 89 (100.0%) | 0 (0.0%) |
| College / Associate Degree | 177 (100.0%) | 0 (0.0%) |
| Bachelor's Degree or higher | 0 (0.0%) | 0 (0.0%) |
| Total | 303 (88.3%) | 0 (0.0%) |
Employment Occupations by Sex in El Rancho Vela
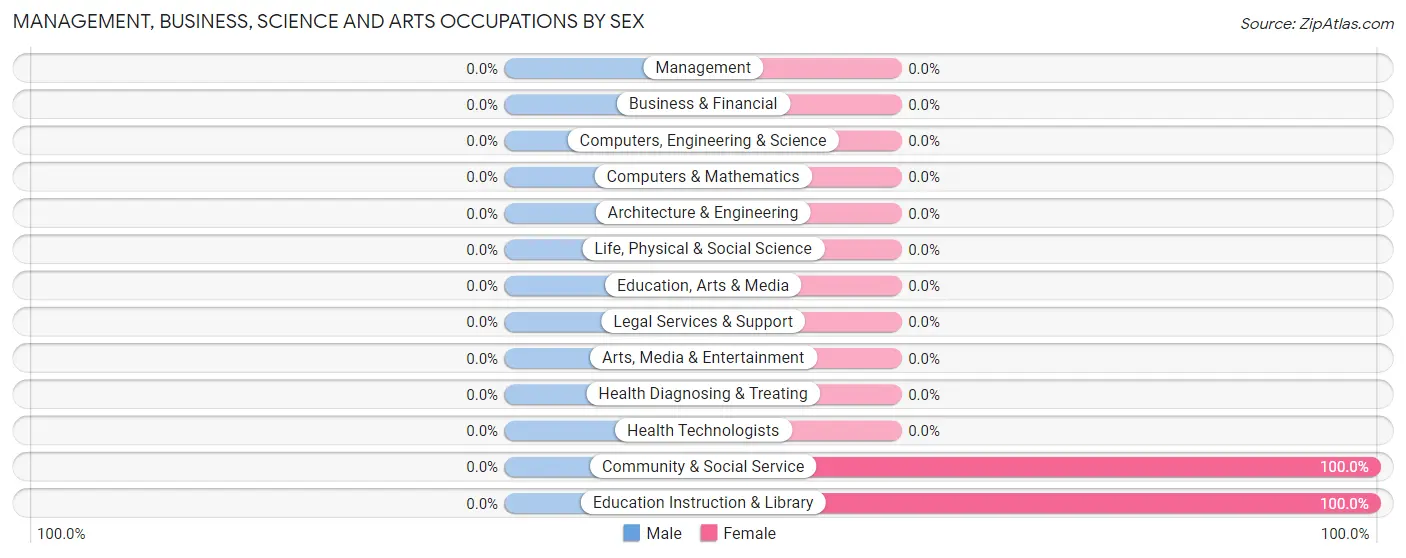
Management, Business, Science and Arts Occupations
The most common Management, Business, Science and Arts occupations in El Rancho Vela are Community & Social Service (66 | 20.3%), and Education Instruction & Library (66 | 20.3%).
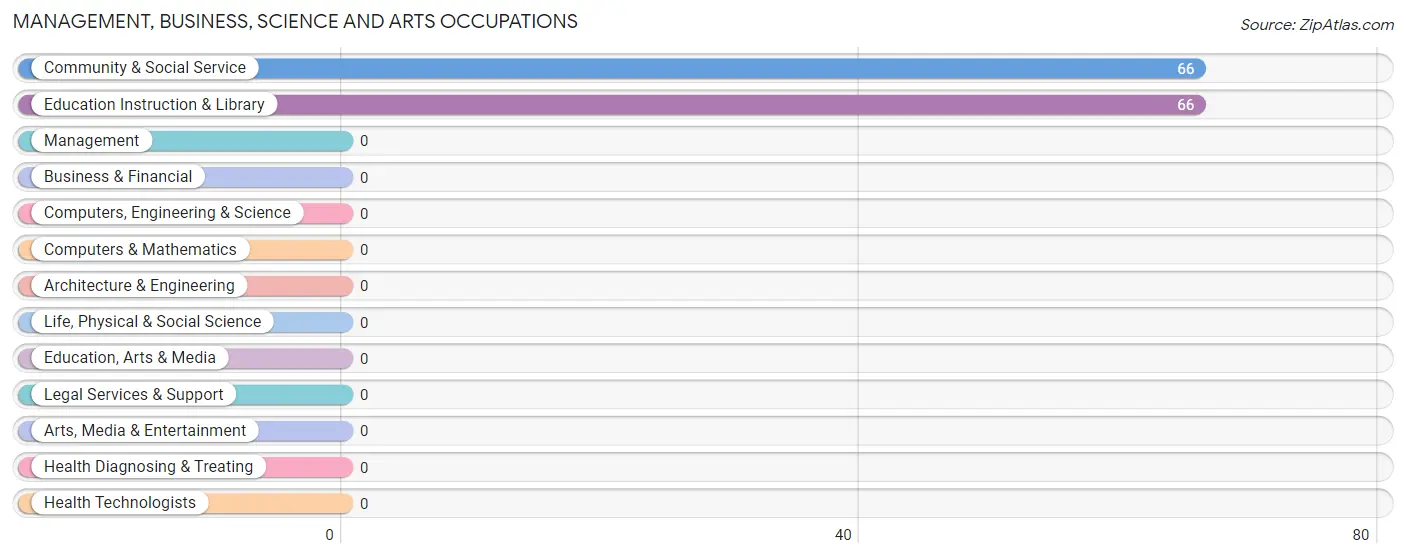
Management, Business, Science and Arts Occupations by Sex
| Occupation | Male | Female |
| Management | 0 (0.0%) | 0 (0.0%) |
| Business & Financial | 0 (0.0%) | 0 (0.0%) |
| Computers, Engineering & Science | 0 (0.0%) | 0 (0.0%) |
| Computers & Mathematics | 0 (0.0%) | 0 (0.0%) |
| Architecture & Engineering | 0 (0.0%) | 0 (0.0%) |
| Life, Physical & Social Science | 0 (0.0%) | 0 (0.0%) |
| Community & Social Service | 0 (0.0%) | 66 (100.0%) |
| Education, Arts & Media | 0 (0.0%) | 0 (0.0%) |
| Legal Services & Support | 0 (0.0%) | 0 (0.0%) |
| Education Instruction & Library | 0 (0.0%) | 66 (100.0%) |
| Arts, Media & Entertainment | 0 (0.0%) | 0 (0.0%) |
| Health Diagnosing & Treating | 0 (0.0%) | 0 (0.0%) |
| Health Technologists | 0 (0.0%) | 0 (0.0%) |
| Total (Category) | 0 (0.0%) | 66 (100.0%) |
| Total (Overall) | 200 (61.4%) | 126 (38.7%) |
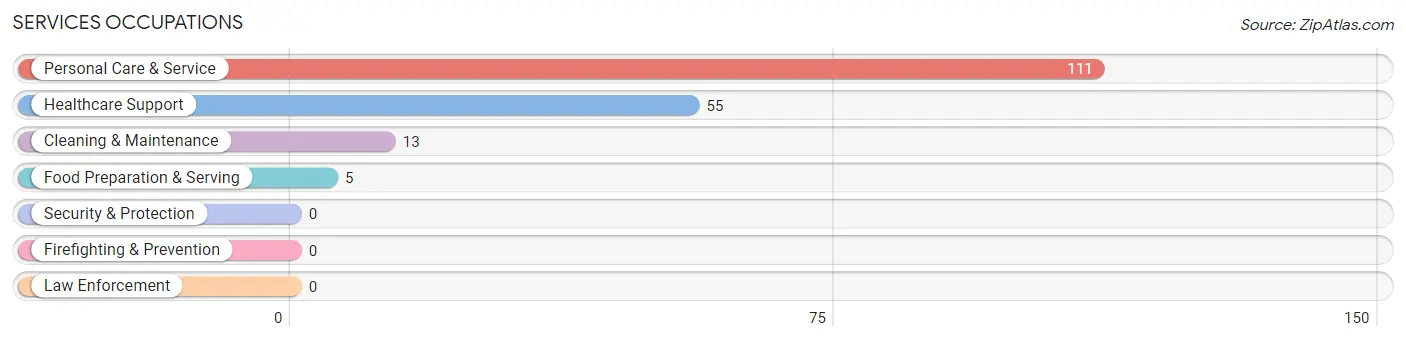
Services Occupations
The most common Services occupations in El Rancho Vela are Personal Care & Service (111 | 34.1%), Healthcare Support (55 | 16.9%), Cleaning & Maintenance (13 | 4.0%), and Food Preparation & Serving (5 | 1.5%).
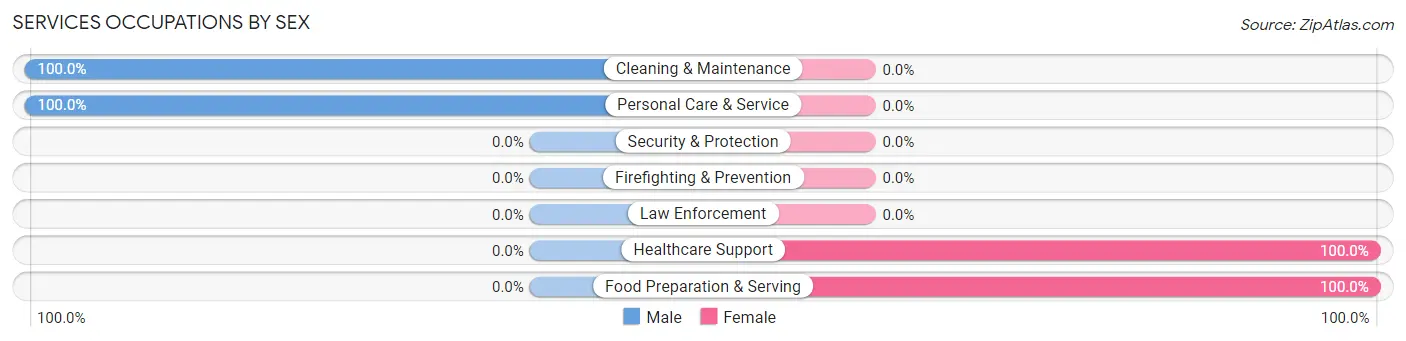
Services Occupations by Sex
Within the Services occupations in El Rancho Vela, the most male-oriented occupations are Cleaning & Maintenance (100.0%), and Personal Care & Service (100.0%), while the most female-oriented occupations are Healthcare Support (100.0%), and Food Preparation & Serving (100.0%).
| Occupation | Male | Female |
| Healthcare Support | 0 (0.0%) | 55 (100.0%) |
| Security & Protection | 0 (0.0%) | 0 (0.0%) |
| Firefighting & Prevention | 0 (0.0%) | 0 (0.0%) |
| Law Enforcement | 0 (0.0%) | 0 (0.0%) |
| Food Preparation & Serving | 0 (0.0%) | 5 (100.0%) |
| Cleaning & Maintenance | 13 (100.0%) | 0 (0.0%) |
| Personal Care & Service | 111 (100.0%) | 0 (0.0%) |
| Total (Category) | 124 (67.4%) | 60 (32.6%) |
| Total (Overall) | 200 (61.4%) | 126 (38.7%) |
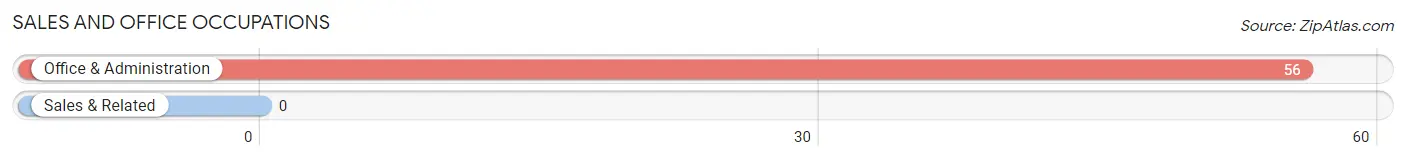
Sales and Office Occupations
The most common Sales and Office occupations in El Rancho Vela are , and Office & Administration (56 | 17.2%).
Sales and Office Occupations by Sex

| Occupation | Male | Female |
| Sales & Related | 0 (0.0%) | 0 (0.0%) |
| Office & Administration | 56 (100.0%) | 0 (0.0%) |
| Total (Category) | 56 (100.0%) | 0 (0.0%) |
| Total (Overall) | 200 (61.4%) | 126 (38.7%) |
Natural Resources, Construction and Maintenance Occupations
The most common Natural Resources, Construction and Maintenance occupations in El Rancho Vela are , and Construction & Extraction (20 | 6.1%).
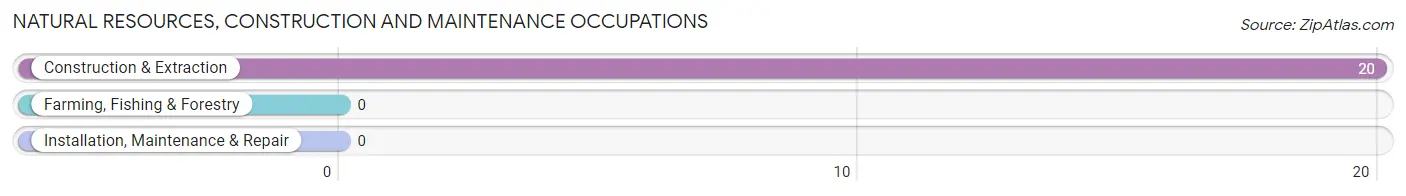
Natural Resources, Construction and Maintenance Occupations by Sex
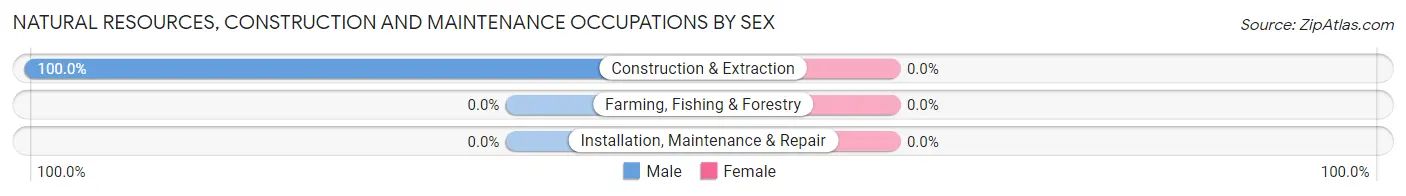
| Occupation | Male | Female |
| Farming, Fishing & Forestry | 0 (0.0%) | 0 (0.0%) |
| Construction & Extraction | 20 (100.0%) | 0 (0.0%) |
| Installation, Maintenance & Repair | 0 (0.0%) | 0 (0.0%) |
| Total (Category) | 20 (100.0%) | 0 (0.0%) |
| Total (Overall) | 200 (61.4%) | 126 (38.7%) |
Production, Transportation and Moving Occupations
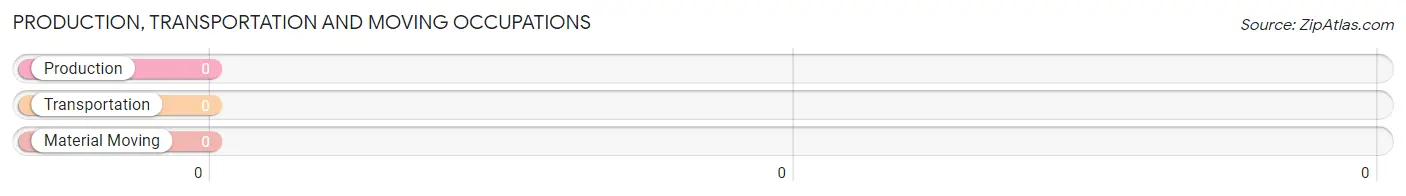
Production, Transportation and Moving Occupations by Sex
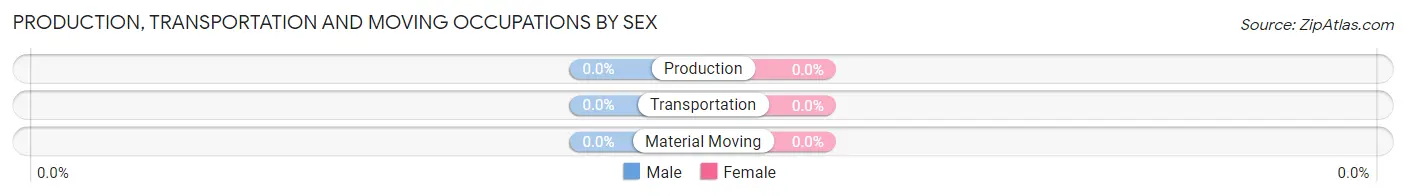
| Occupation | Male | Female |
| Production | 0 (0.0%) | 0 (0.0%) |
| Transportation | 0 (0.0%) | 0 (0.0%) |
| Material Moving | 0 (0.0%) | 0 (0.0%) |
| Total (Category) | 0 (0.0%) | 0 (0.0%) |
| Total (Overall) | 200 (61.4%) | 126 (38.7%) |
Employment Industries by Sex in El Rancho Vela
Employment Industries in El Rancho Vela
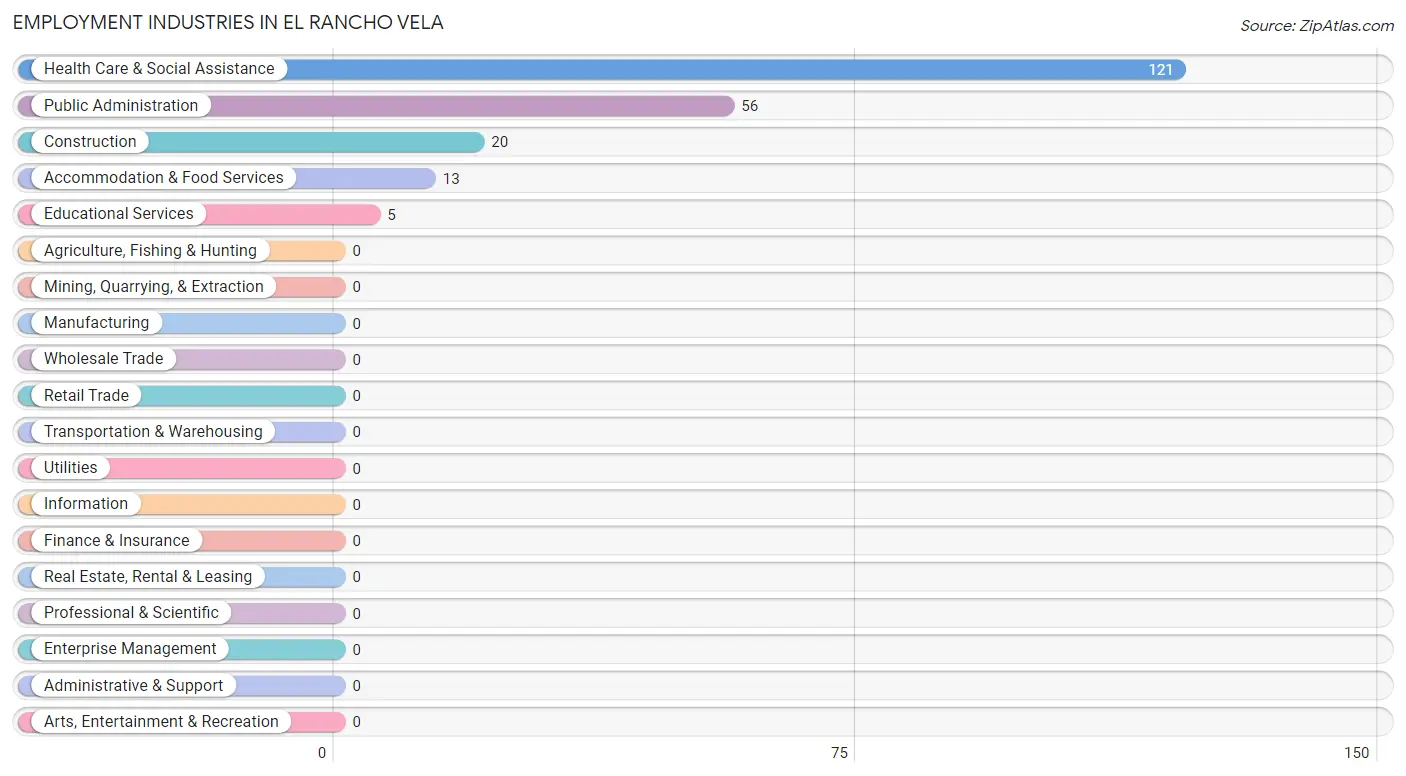
The major employment industries in El Rancho Vela include Health Care & Social Assistance (121 | 37.1%), Public Administration (56 | 17.2%), Construction (20 | 6.1%), Accommodation & Food Services (13 | 4.0%), and Educational Services (5 | 1.5%).
Employment Industries by Sex in El Rancho Vela
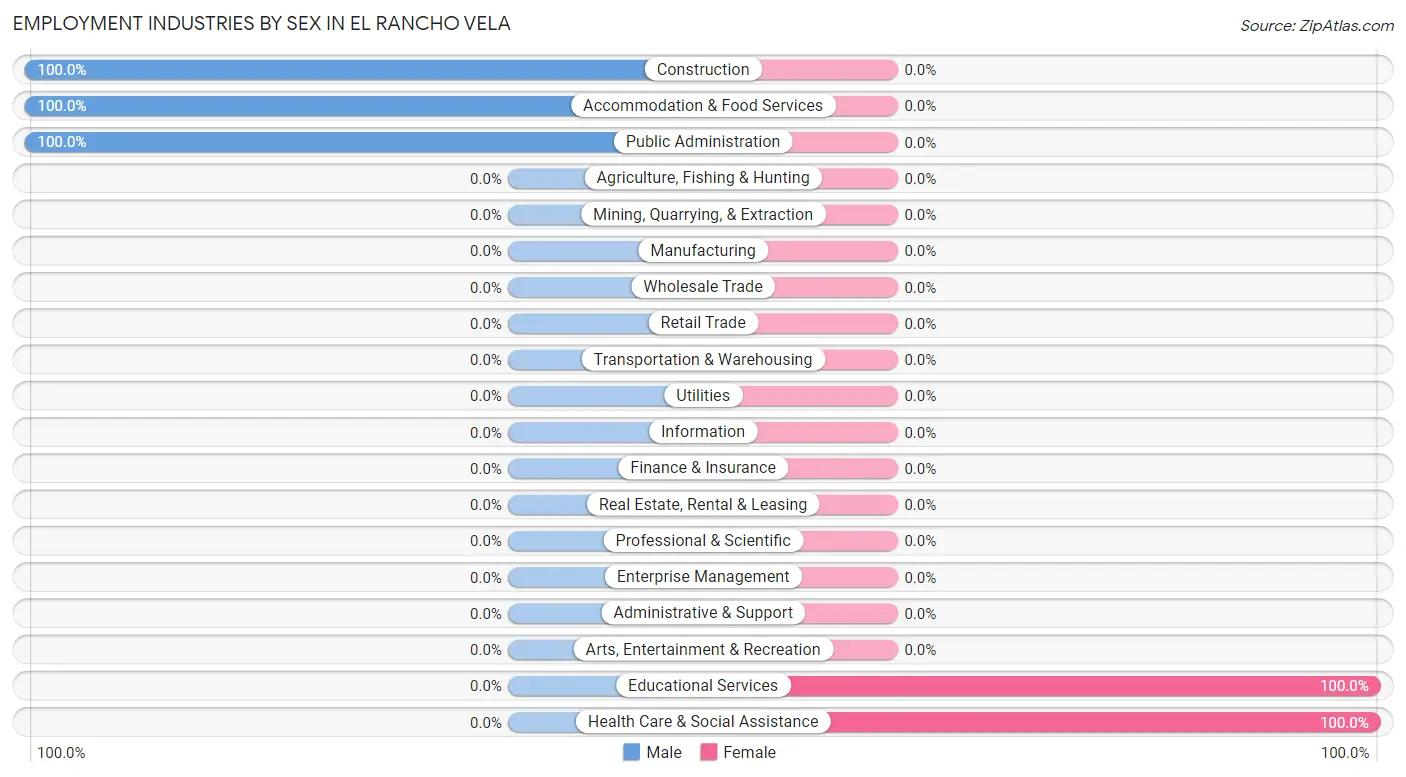
The El Rancho Vela industries that see more men than women are Construction (100.0%), Accommodation & Food Services (100.0%), and Public Administration (100.0%), whereas the industries that tend to have a higher number of women are Educational Services (100.0%), and Health Care & Social Assistance (100.0%).
| Industry | Male | Female |
| Agriculture, Fishing & Hunting | 0 (0.0%) | 0 (0.0%) |
| Mining, Quarrying, & Extraction | 0 (0.0%) | 0 (0.0%) |
| Construction | 20 (100.0%) | 0 (0.0%) |
| Manufacturing | 0 (0.0%) | 0 (0.0%) |
| Wholesale Trade | 0 (0.0%) | 0 (0.0%) |
| Retail Trade | 0 (0.0%) | 0 (0.0%) |
| Transportation & Warehousing | 0 (0.0%) | 0 (0.0%) |
| Utilities | 0 (0.0%) | 0 (0.0%) |
| Information | 0 (0.0%) | 0 (0.0%) |
| Finance & Insurance | 0 (0.0%) | 0 (0.0%) |
| Real Estate, Rental & Leasing | 0 (0.0%) | 0 (0.0%) |
| Professional & Scientific | 0 (0.0%) | 0 (0.0%) |
| Enterprise Management | 0 (0.0%) | 0 (0.0%) |
| Administrative & Support | 0 (0.0%) | 0 (0.0%) |
| Educational Services | 0 (0.0%) | 5 (100.0%) |
| Health Care & Social Assistance | 0 (0.0%) | 121 (100.0%) |
| Arts, Entertainment & Recreation | 0 (0.0%) | 0 (0.0%) |
| Accommodation & Food Services | 13 (100.0%) | 0 (0.0%) |
| Public Administration | 56 (100.0%) | 0 (0.0%) |
| Total | 200 (61.4%) | 126 (38.7%) |
Education in El Rancho Vela
School Enrollment in El Rancho Vela
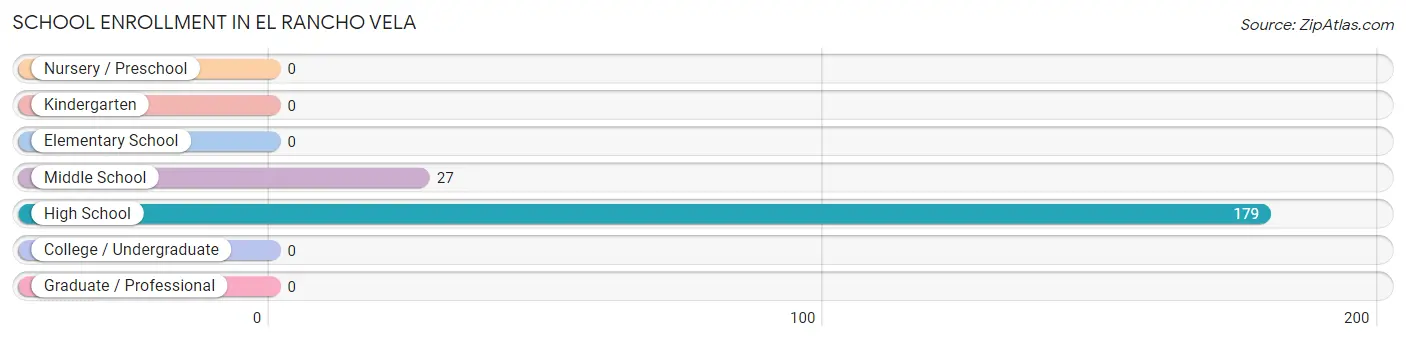
The most common levels of schooling among the 206 students in El Rancho Vela are high school (179 | 86.9%), and middle school (27 | 13.1%).
| School Level | # Students | % Students |
| Nursery / Preschool | 0 | 0.0% |
| Kindergarten | 0 | 0.0% |
| Elementary School | 0 | 0.0% |
| Middle School | 27 | 13.1% |
| High School | 179 | 86.9% |
| College / Undergraduate | 0 | 0.0% |
| Graduate / Professional | 0 | 0.0% |
| Total | 206 | 100.0% |
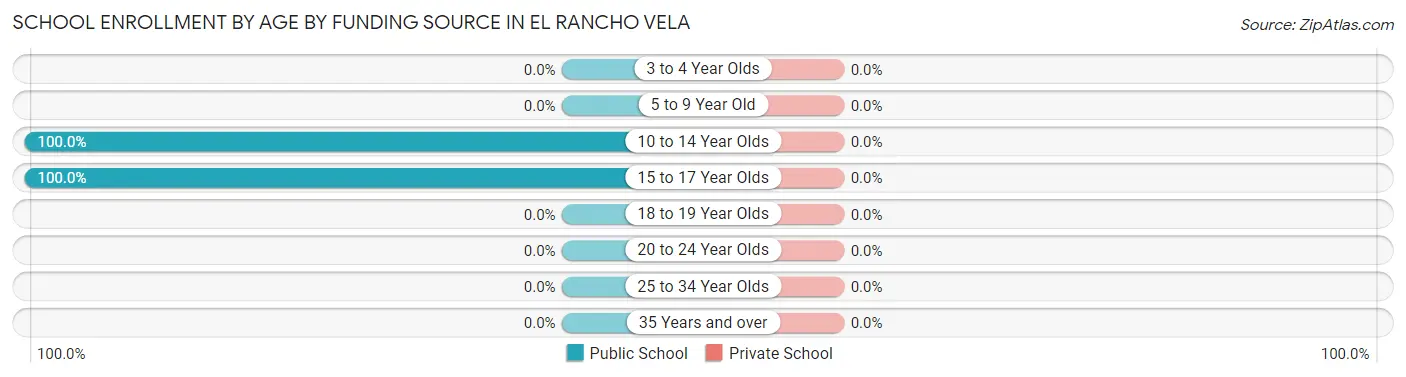
School Enrollment by Age by Funding Source in El Rancho Vela
| Age Bracket | Public School | Private School |
| 3 to 4 Year Olds | 0 (0.0%) | 0 (0.0%) |
| 5 to 9 Year Old | 0 (0.0%) | 0 (0.0%) |
| 10 to 14 Year Olds | 27 (100.0%) | 0 (0.0%) |
| 15 to 17 Year Olds | 179 (100.0%) | 0 (0.0%) |
| 18 to 19 Year Olds | 0 (0.0%) | 0 (0.0%) |
| 20 to 24 Year Olds | 0 (0.0%) | 0 (0.0%) |
| 25 to 34 Year Olds | 0 (0.0%) | 0 (0.0%) |
| 35 Years and over | 0 (0.0%) | 0 (0.0%) |
| Total | 206 (100.0%) | 0 (0.0%) |
Educational Attainment by Field of Study in El Rancho Vela
| Field of Study | # Graduates | % Graduates |
| Computers & Mathematics | 0 | 0.0% |
| Bio, Nature & Agricultural | 0 | 0.0% |
| Physical & Health Sciences | 0 | 0.0% |
| Psychology | 0 | 0.0% |
| Social Sciences | 0 | 0.0% |
| Engineering | 0 | 0.0% |
| Multidisciplinary Studies | 0 | 0.0% |
| Science & Technology | 0 | 0.0% |
| Business | 0 | 0.0% |
| Education | 0 | 0.0% |
| Literature & Languages | 0 | 0.0% |
| Liberal Arts & History | 0 | 0.0% |
| Visual & Performing Arts | 0 | 0.0% |
| Communications | 0 | 0.0% |
| Arts & Humanities | 0 | 0.0% |
| Total | 0 | 0.0% |
Transportation & Commute in El Rancho Vela
Vehicle Availability by Sex in El Rancho Vela
The most prevalent vehicle ownership categories in El Rancho Vela are males with 2 vehicles (124, accounting for 62.0%) and females with 2 vehicles (79, making up 98.4%).
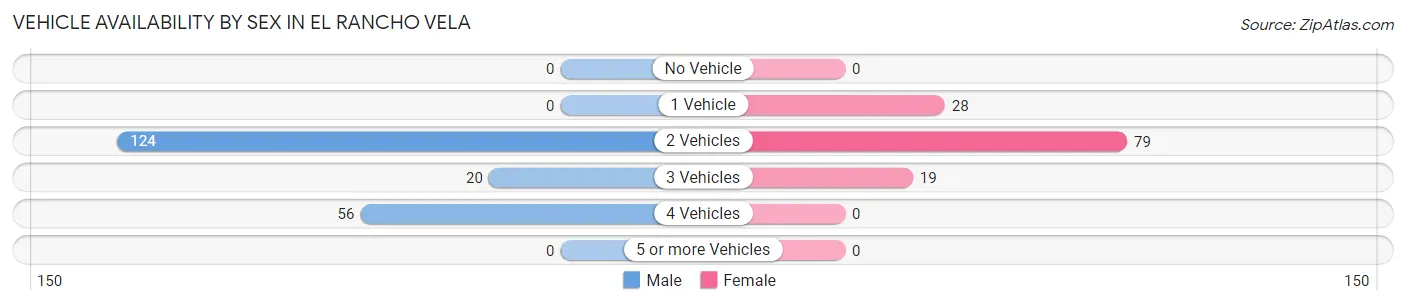
| Vehicles Available | Male | Female |
| No Vehicle | 0 (0.0%) | 0 (0.0%) |
| 1 Vehicle | 0 (0.0%) | 28 (22.2%) |
| 2 Vehicles | 124 (62.0%) | 79 (62.7%) |
| 3 Vehicles | 20 (10.0%) | 19 (15.1%) |
| 4 Vehicles | 56 (28.0%) | 0 (0.0%) |
| 5 or more Vehicles | 0 (0.0%) | 0 (0.0%) |
| Total | 200 (100.0%) | 126 (100.0%) |
Commute Time in El Rancho Vela
The most frequently occuring commute durations in El Rancho Vela are 10 to 14 minutes (124 commuters, 38.0%), 20 to 24 minutes (98 commuters, 30.1%), and 60 to 89 minutes (56 commuters, 17.2%).
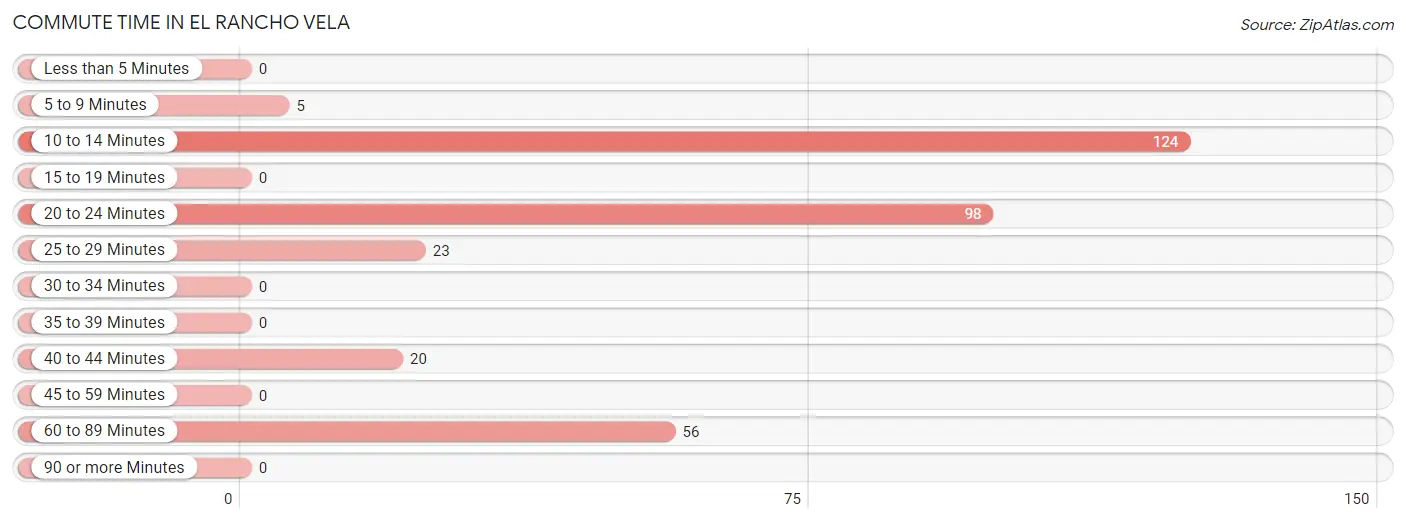
| Commute Time | # Commuters | % Commuters |
| Less than 5 Minutes | 0 | 0.0% |
| 5 to 9 Minutes | 5 | 1.5% |
| 10 to 14 Minutes | 124 | 38.0% |
| 15 to 19 Minutes | 0 | 0.0% |
| 20 to 24 Minutes | 98 | 30.1% |
| 25 to 29 Minutes | 23 | 7.1% |
| 30 to 34 Minutes | 0 | 0.0% |
| 35 to 39 Minutes | 0 | 0.0% |
| 40 to 44 Minutes | 20 | 6.1% |
| 45 to 59 Minutes | 0 | 0.0% |
| 60 to 89 Minutes | 56 | 17.2% |
| 90 or more Minutes | 0 | 0.0% |
Commute Time by Sex in El Rancho Vela
The most common commute times in El Rancho Vela are 10 to 14 minutes (111 commuters, 55.5%) for males and 20 to 24 minutes (85 commuters, 67.5%) for females.
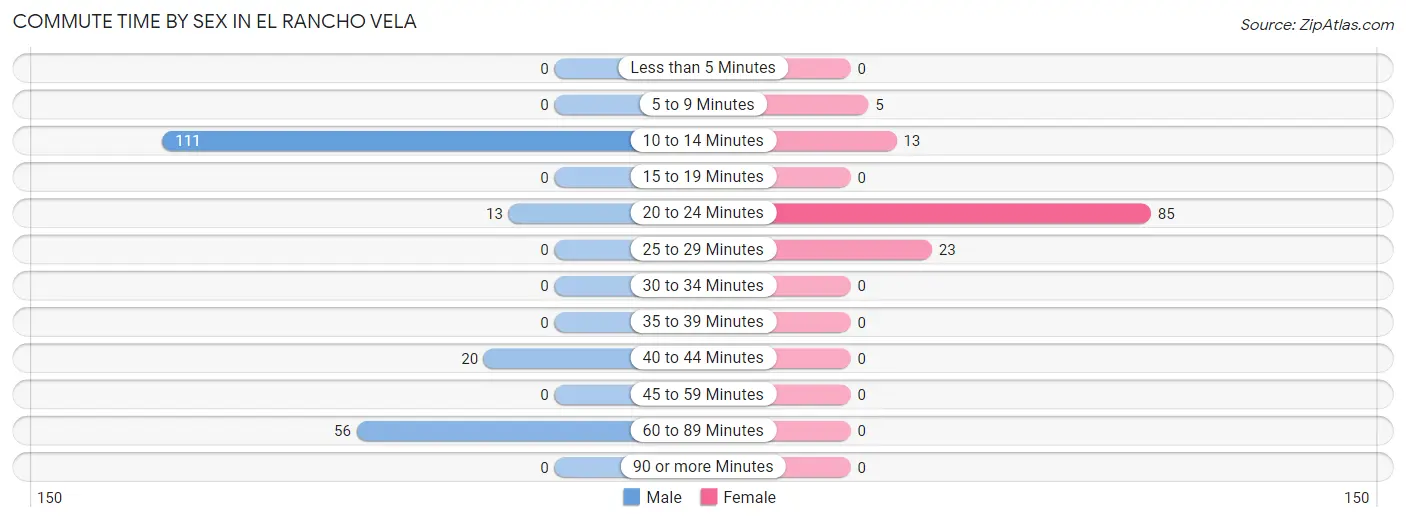
| Commute Time | Male | Female |
| Less than 5 Minutes | 0 (0.0%) | 0 (0.0%) |
| 5 to 9 Minutes | 0 (0.0%) | 5 (4.0%) |
| 10 to 14 Minutes | 111 (55.5%) | 13 (10.3%) |
| 15 to 19 Minutes | 0 (0.0%) | 0 (0.0%) |
| 20 to 24 Minutes | 13 (6.5%) | 85 (67.5%) |
| 25 to 29 Minutes | 0 (0.0%) | 23 (18.2%) |
| 30 to 34 Minutes | 0 (0.0%) | 0 (0.0%) |
| 35 to 39 Minutes | 0 (0.0%) | 0 (0.0%) |
| 40 to 44 Minutes | 20 (10.0%) | 0 (0.0%) |
| 45 to 59 Minutes | 0 (0.0%) | 0 (0.0%) |
| 60 to 89 Minutes | 56 (28.0%) | 0 (0.0%) |
| 90 or more Minutes | 0 (0.0%) | 0 (0.0%) |
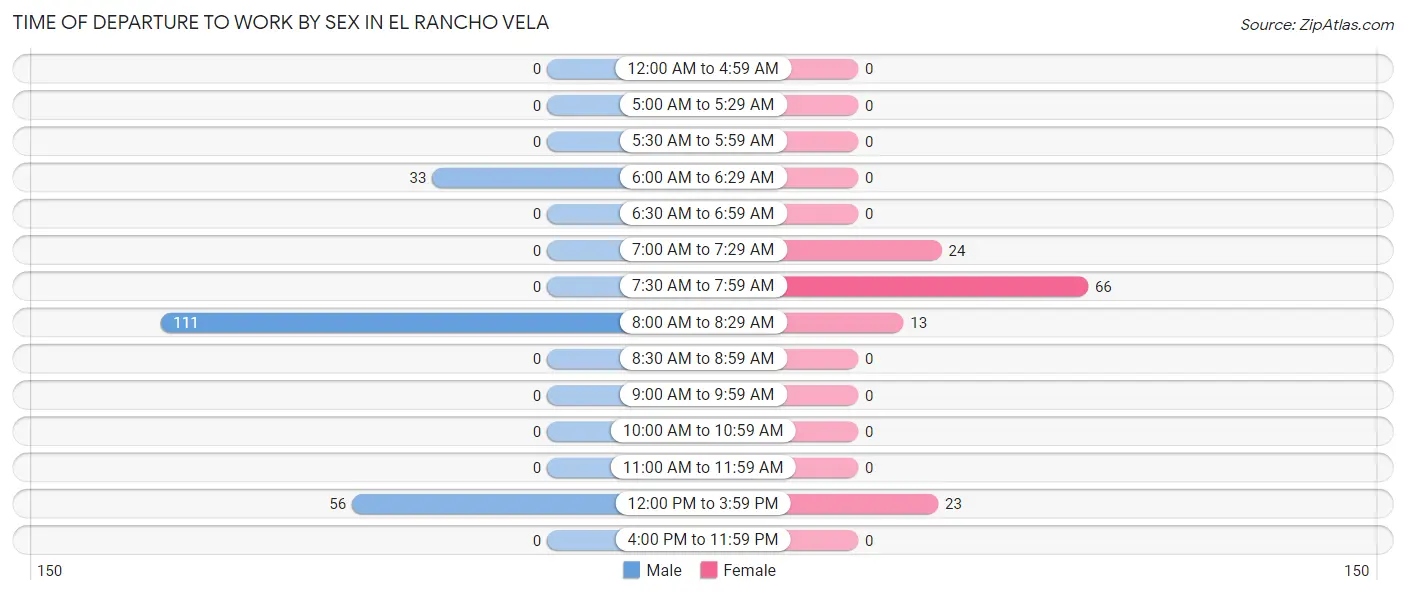
Time of Departure to Work by Sex in El Rancho Vela
The most frequent times of departure to work in El Rancho Vela are 8:00 AM to 8:29 AM (111, 55.5%) for males and 7:30 AM to 7:59 AM (66, 52.4%) for females.
| Time of Departure | Male | Female |
| 12:00 AM to 4:59 AM | 0 (0.0%) | 0 (0.0%) |
| 5:00 AM to 5:29 AM | 0 (0.0%) | 0 (0.0%) |
| 5:30 AM to 5:59 AM | 0 (0.0%) | 0 (0.0%) |
| 6:00 AM to 6:29 AM | 33 (16.5%) | 0 (0.0%) |
| 6:30 AM to 6:59 AM | 0 (0.0%) | 0 (0.0%) |
| 7:00 AM to 7:29 AM | 0 (0.0%) | 24 (19.1%) |
| 7:30 AM to 7:59 AM | 0 (0.0%) | 66 (52.4%) |
| 8:00 AM to 8:29 AM | 111 (55.5%) | 13 (10.3%) |
| 8:30 AM to 8:59 AM | 0 (0.0%) | 0 (0.0%) |
| 9:00 AM to 9:59 AM | 0 (0.0%) | 0 (0.0%) |
| 10:00 AM to 10:59 AM | 0 (0.0%) | 0 (0.0%) |
| 11:00 AM to 11:59 AM | 0 (0.0%) | 0 (0.0%) |
| 12:00 PM to 3:59 PM | 56 (28.0%) | 23 (18.2%) |
| 4:00 PM to 11:59 PM | 0 (0.0%) | 0 (0.0%) |
| Total | 200 (100.0%) | 126 (100.0%) |
Housing Occupancy in El Rancho Vela
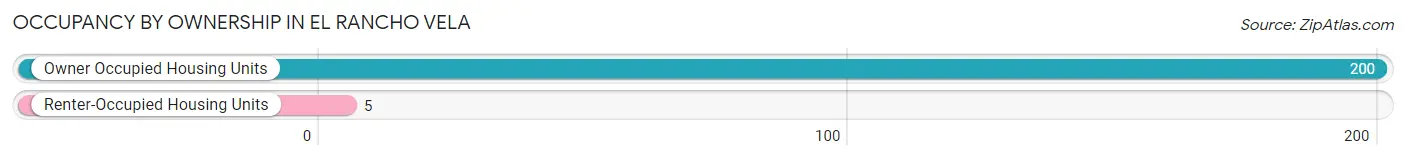
Occupancy by Ownership in El Rancho Vela
Of the total 205 dwellings in El Rancho Vela, owner-occupied units account for 200 (97.6%), while renter-occupied units make up 5 (2.4%).
| Occupancy | # Housing Units | % Housing Units |
| Owner Occupied Housing Units | 200 | 97.6% |
| Renter-Occupied Housing Units | 5 | 2.4% |
| Total Occupied Housing Units | 205 | 100.0% |
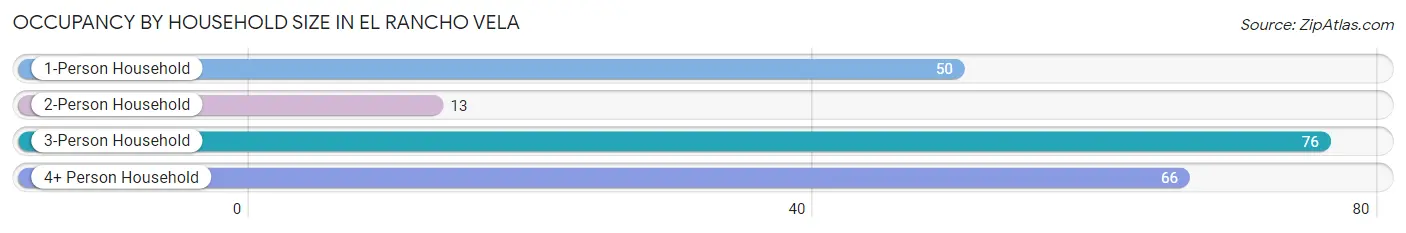
Occupancy by Household Size in El Rancho Vela
| Household Size | # Housing Units | % Housing Units |
| 1-Person Household | 50 | 24.4% |
| 2-Person Household | 13 | 6.3% |
| 3-Person Household | 76 | 37.1% |
| 4+ Person Household | 66 | 32.2% |
| Total Housing Units | 205 | 100.0% |
Occupancy by Ownership by Household Size in El Rancho Vela
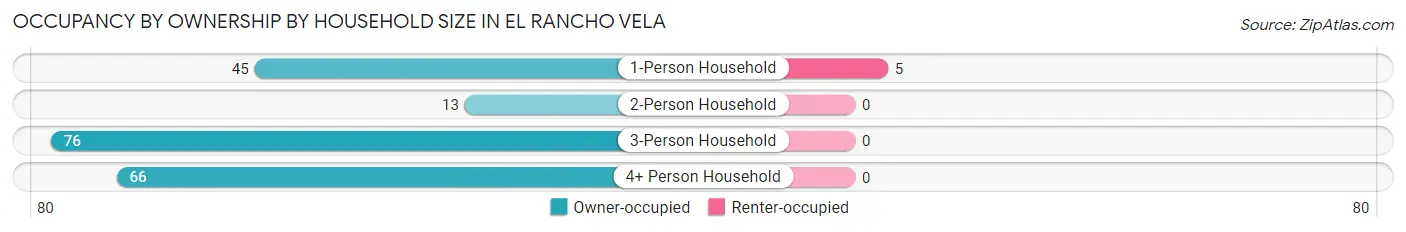
| Household Size | Owner-occupied | Renter-occupied |
| 1-Person Household | 45 (90.0%) | 5 (10.0%) |
| 2-Person Household | 13 (100.0%) | 0 (0.0%) |
| 3-Person Household | 76 (100.0%) | 0 (0.0%) |
| 4+ Person Household | 66 (100.0%) | 0 (0.0%) |
| Total Housing Units | 200 (97.6%) | 5 (2.4%) |
Occupancy by Educational Attainment in El Rancho Vela
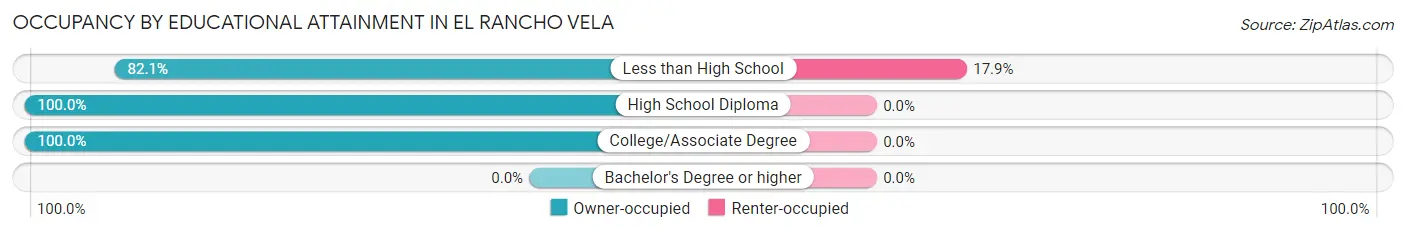
| Household Size | Owner-occupied | Renter-occupied |
| Less than High School | 23 (82.1%) | 5 (17.9%) |
| High School Diploma | 89 (100.0%) | 0 (0.0%) |
| College/Associate Degree | 88 (100.0%) | 0 (0.0%) |
| Bachelor's Degree or higher | 0 (0.0%) | 0 (0.0%) |
Occupancy by Age of Householder in El Rancho Vela
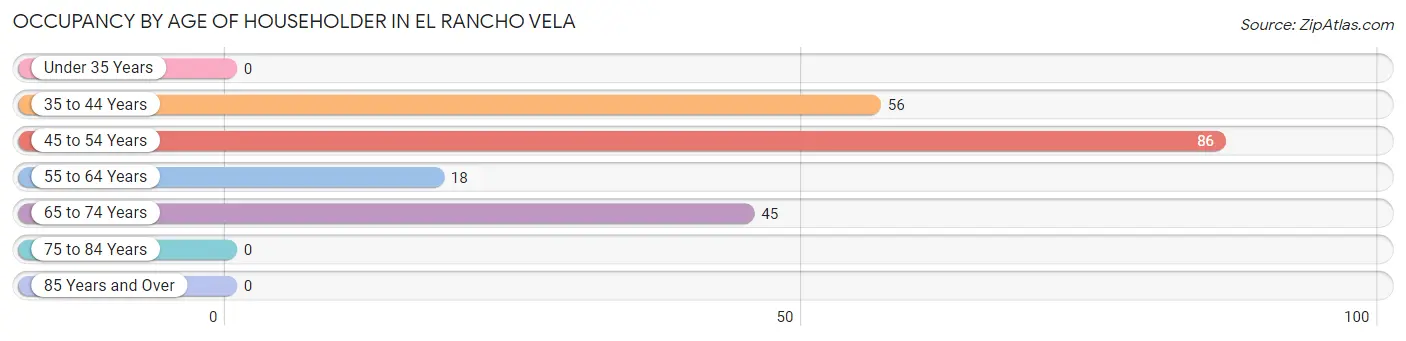
| Age Bracket | # Households | % Households |
| Under 35 Years | 0 | 0.0% |
| 35 to 44 Years | 56 | 27.3% |
| 45 to 54 Years | 86 | 41.9% |
| 55 to 64 Years | 18 | 8.8% |
| 65 to 74 Years | 45 | 22.0% |
| 75 to 84 Years | 0 | 0.0% |
| 85 Years and Over | 0 | 0.0% |
| Total | 205 | 100.0% |
Housing Finances in El Rancho Vela
Median Income by Occupancy in El Rancho Vela
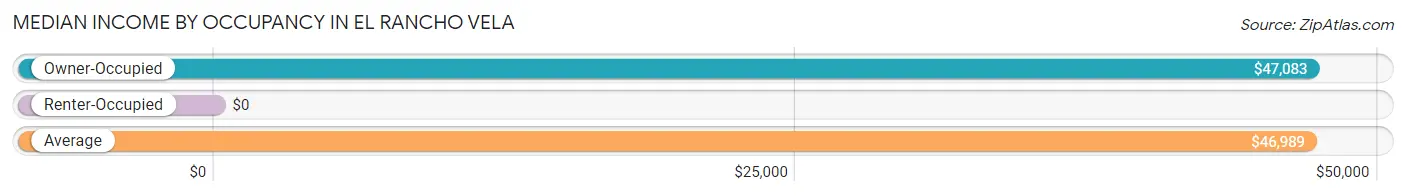
| Occupancy Type | # Households | Median Income |
| Owner-Occupied | 200 (97.6%) | $47,083 |
| Renter-Occupied | 5 (2.4%) | $0 |
| Average | 205 (100.0%) | $46,989 |
Occupancy by Householder Income Bracket in El Rancho Vela
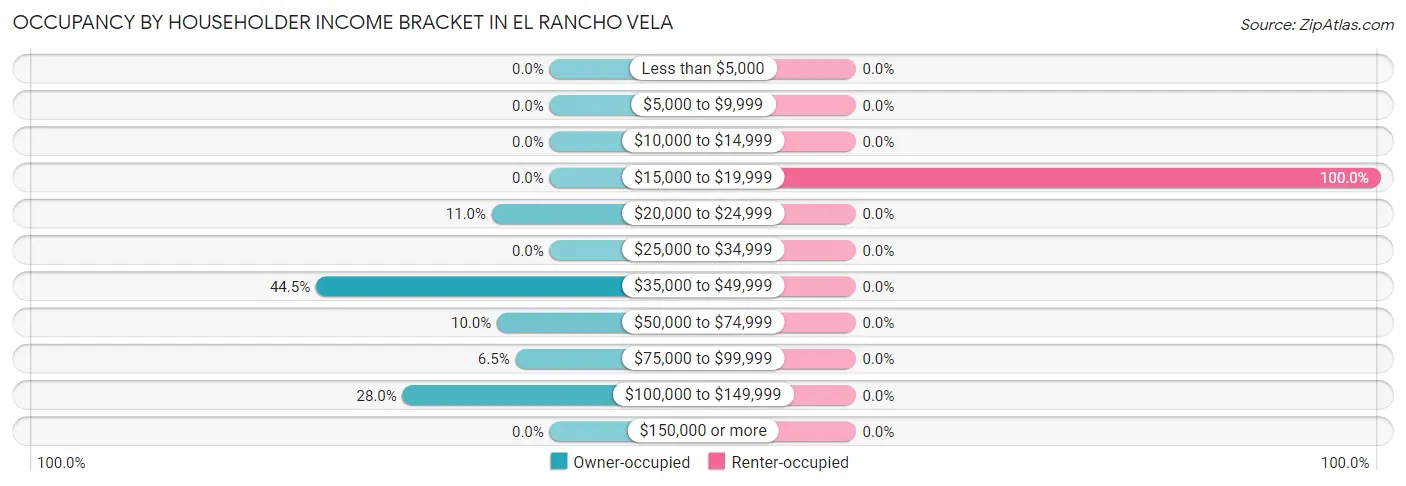
| Income Bracket | Owner-occupied | Renter-occupied |
| Less than $5,000 | 0 (0.0%) | 0 (0.0%) |
| $5,000 to $9,999 | 0 (0.0%) | 0 (0.0%) |
| $10,000 to $14,999 | 0 (0.0%) | 0 (0.0%) |
| $15,000 to $19,999 | 0 (0.0%) | 5 (100.0%) |
| $20,000 to $24,999 | 22 (11.0%) | 0 (0.0%) |
| $25,000 to $34,999 | 0 (0.0%) | 0 (0.0%) |
| $35,000 to $49,999 | 89 (44.5%) | 0 (0.0%) |
| $50,000 to $74,999 | 20 (10.0%) | 0 (0.0%) |
| $75,000 to $99,999 | 13 (6.5%) | 0 (0.0%) |
| $100,000 to $149,999 | 56 (28.0%) | 0 (0.0%) |
| $150,000 or more | 0 (0.0%) | 0 (0.0%) |
| Total | 200 (100.0%) | 5 (100.0%) |
Monthly Housing Cost Tiers in El Rancho Vela
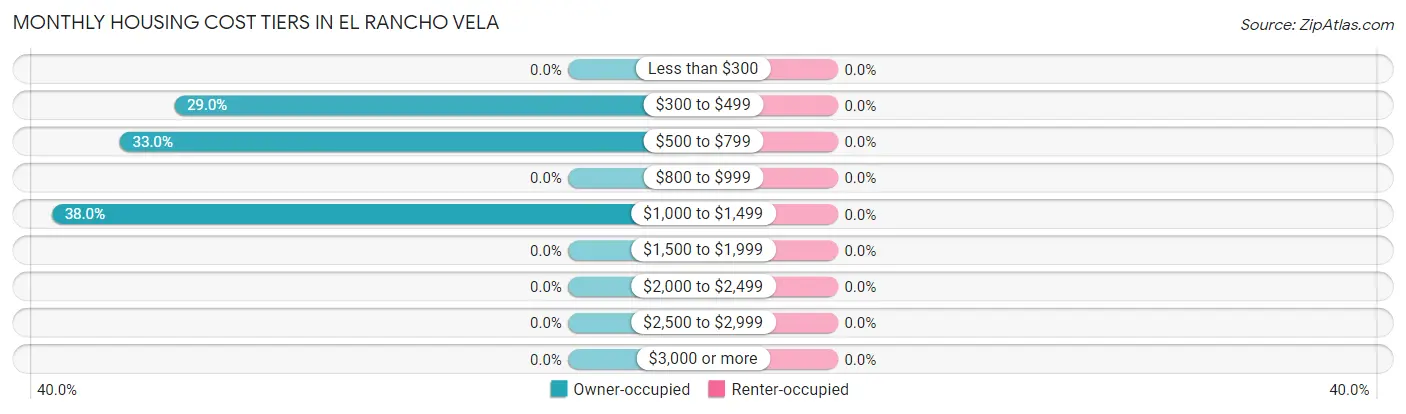
| Monthly Cost | Owner-occupied | Renter-occupied |
| Less than $300 | 0 (0.0%) | 0 (0.0%) |
| $300 to $499 | 58 (29.0%) | 0 (0.0%) |
| $500 to $799 | 66 (33.0%) | 0 (0.0%) |
| $800 to $999 | 0 (0.0%) | 0 (0.0%) |
| $1,000 to $1,499 | 76 (38.0%) | 0 (0.0%) |
| $1,500 to $1,999 | 0 (0.0%) | 0 (0.0%) |
| $2,000 to $2,499 | 0 (0.0%) | 0 (0.0%) |
| $2,500 to $2,999 | 0 (0.0%) | 0 (0.0%) |
| $3,000 or more | 0 (0.0%) | 0 (0.0%) |
| Total | 200 (100.0%) | 5 (100.0%) |
Physical Housing Characteristics in El Rancho Vela
Housing Structures in El Rancho Vela
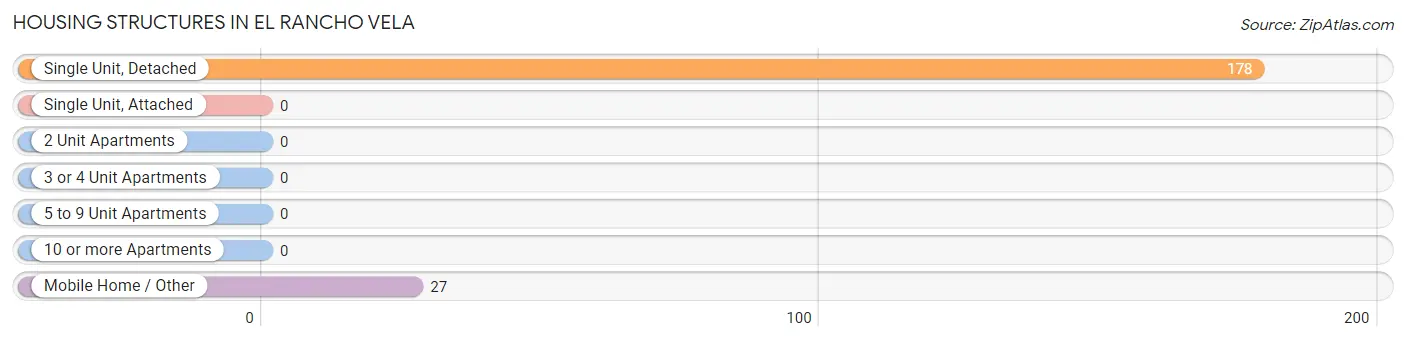
| Structure Type | # Housing Units | % Housing Units |
| Single Unit, Detached | 178 | 86.8% |
| Single Unit, Attached | 0 | 0.0% |
| 2 Unit Apartments | 0 | 0.0% |
| 3 or 4 Unit Apartments | 0 | 0.0% |
| 5 to 9 Unit Apartments | 0 | 0.0% |
| 10 or more Apartments | 0 | 0.0% |
| Mobile Home / Other | 27 | 13.2% |
| Total | 205 | 100.0% |
Housing Structures by Occupancy in El Rancho Vela
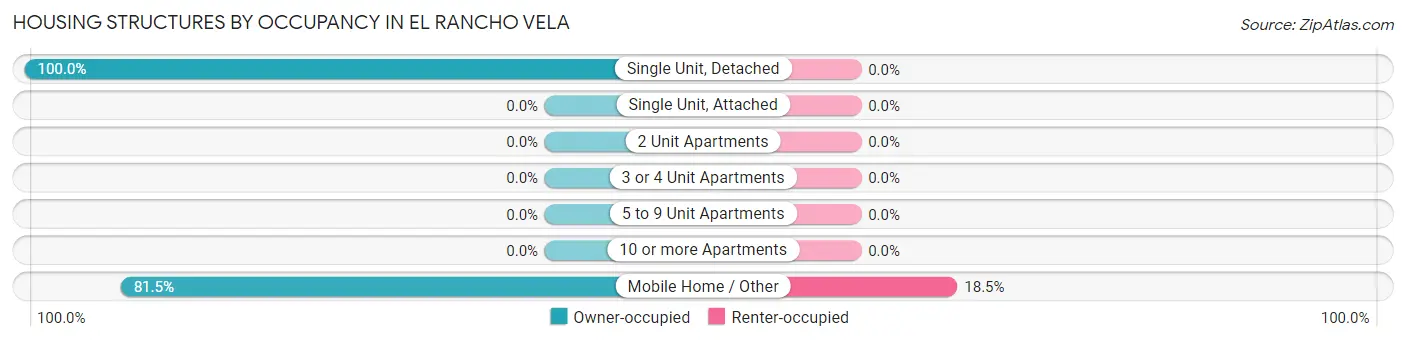
| Structure Type | Owner-occupied | Renter-occupied |
| Single Unit, Detached | 178 (100.0%) | 0 (0.0%) |
| Single Unit, Attached | 0 (0.0%) | 0 (0.0%) |
| 2 Unit Apartments | 0 (0.0%) | 0 (0.0%) |
| 3 or 4 Unit Apartments | 0 (0.0%) | 0 (0.0%) |
| 5 to 9 Unit Apartments | 0 (0.0%) | 0 (0.0%) |
| 10 or more Apartments | 0 (0.0%) | 0 (0.0%) |
| Mobile Home / Other | 22 (81.5%) | 5 (18.5%) |
| Total | 200 (97.6%) | 5 (2.4%) |
Housing Structures by Number of Rooms in El Rancho Vela
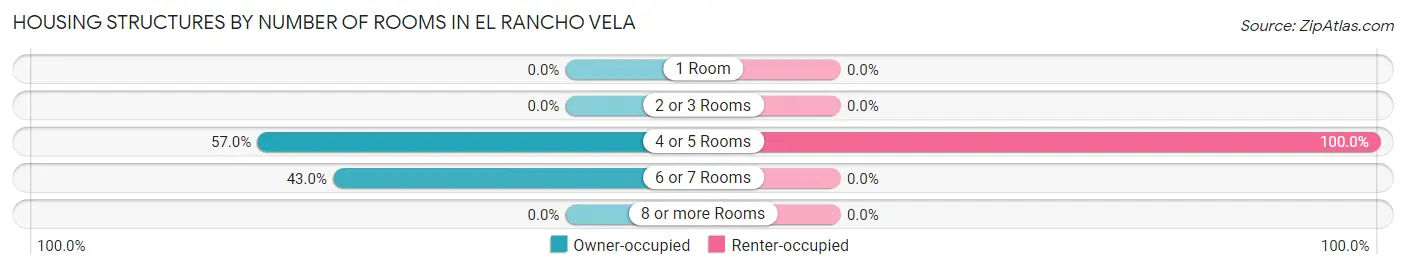
| Number of Rooms | Owner-occupied | Renter-occupied |
| 1 Room | 0 (0.0%) | 0 (0.0%) |
| 2 or 3 Rooms | 0 (0.0%) | 0 (0.0%) |
| 4 or 5 Rooms | 114 (57.0%) | 5 (100.0%) |
| 6 or 7 Rooms | 86 (43.0%) | 0 (0.0%) |
| 8 or more Rooms | 0 (0.0%) | 0 (0.0%) |
| Total | 200 (100.0%) | 5 (100.0%) |
Housing Structure by Heating Type in El Rancho Vela
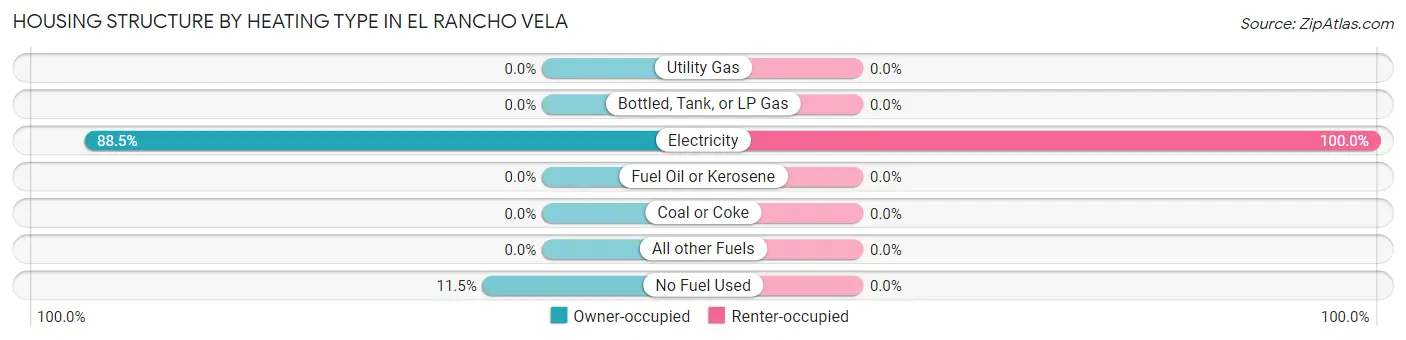
| Heating Type | Owner-occupied | Renter-occupied |
| Utility Gas | 0 (0.0%) | 0 (0.0%) |
| Bottled, Tank, or LP Gas | 0 (0.0%) | 0 (0.0%) |
| Electricity | 177 (88.5%) | 5 (100.0%) |
| Fuel Oil or Kerosene | 0 (0.0%) | 0 (0.0%) |
| Coal or Coke | 0 (0.0%) | 0 (0.0%) |
| All other Fuels | 0 (0.0%) | 0 (0.0%) |
| No Fuel Used | 23 (11.5%) | 0 (0.0%) |
| Total | 200 (100.0%) | 5 (100.0%) |
Household Vehicle Usage in El Rancho Vela
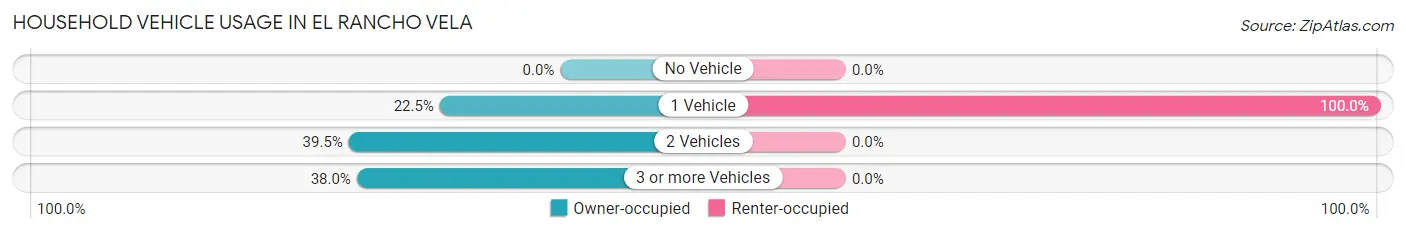
| Vehicles per Household | Owner-occupied | Renter-occupied |
| No Vehicle | 0 (0.0%) | 0 (0.0%) |
| 1 Vehicle | 45 (22.5%) | 5 (100.0%) |
| 2 Vehicles | 79 (39.5%) | 0 (0.0%) |
| 3 or more Vehicles | 76 (38.0%) | 0 (0.0%) |
| Total | 200 (100.0%) | 5 (100.0%) |
Real Estate & Mortgages in El Rancho Vela
Real Estate and Mortgage Overview in El Rancho Vela
| Characteristic | Without Mortgage | With Mortgage |
| Housing Units | 124 | 76 |
| Median Property Value | - | - |
| Median Household Income | $45,644 | $0 |
| Monthly Housing Costs | $506 | $0 |
| Real Estate Taxes | $3,061 | $0 |
Property Value by Mortgage Status in El Rancho Vela
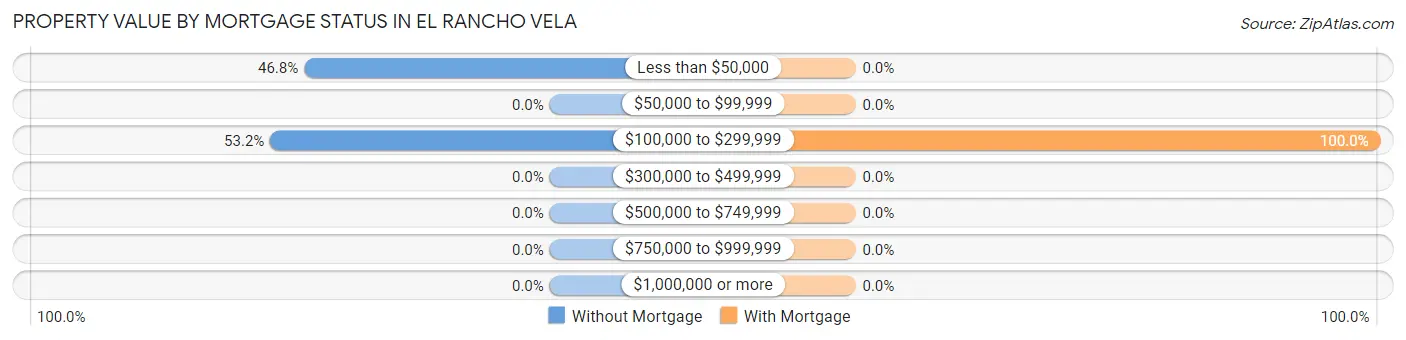
| Property Value | Without Mortgage | With Mortgage |
| Less than $50,000 | 58 (46.8%) | 0 (0.0%) |
| $50,000 to $99,999 | 0 (0.0%) | 0 (0.0%) |
| $100,000 to $299,999 | 66 (53.2%) | 76 (100.0%) |
| $300,000 to $499,999 | 0 (0.0%) | 0 (0.0%) |
| $500,000 to $749,999 | 0 (0.0%) | 0 (0.0%) |
| $750,000 to $999,999 | 0 (0.0%) | 0 (0.0%) |
| $1,000,000 or more | 0 (0.0%) | 0 (0.0%) |
| Total | 124 (100.0%) | 76 (100.0%) |
Household Income by Mortgage Status in El Rancho Vela
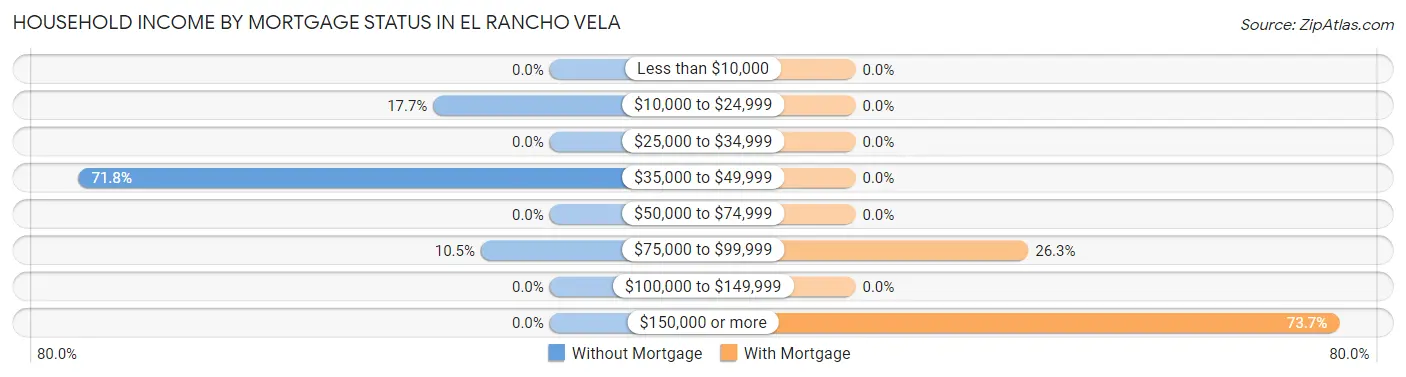
| Household Income | Without Mortgage | With Mortgage |
| Less than $10,000 | 0 (0.0%) | 0 (0.0%) |
| $10,000 to $24,999 | 22 (17.7%) | 0 (0.0%) |
| $25,000 to $34,999 | 0 (0.0%) | 0 (0.0%) |
| $35,000 to $49,999 | 89 (71.8%) | 0 (0.0%) |
| $50,000 to $74,999 | 0 (0.0%) | 0 (0.0%) |
| $75,000 to $99,999 | 13 (10.5%) | 20 (26.3%) |
| $100,000 to $149,999 | 0 (0.0%) | 0 (0.0%) |
| $150,000 or more | 0 (0.0%) | 56 (73.7%) |
| Total | 124 (100.0%) | 76 (100.0%) |
Property Value to Household Income Ratio in El Rancho Vela
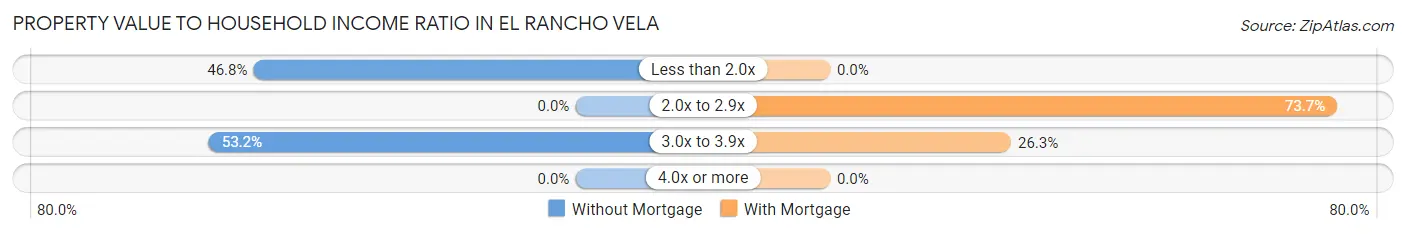
| Value-to-Income Ratio | Without Mortgage | With Mortgage |
| Less than 2.0x | 58 (46.8%) | 0 (0.0%) |
| 2.0x to 2.9x | 0 (0.0%) | 56 (73.7%) |
| 3.0x to 3.9x | 66 (53.2%) | 20 (26.3%) |
| 4.0x or more | 0 (0.0%) | 0 (0.0%) |
| Total | 124 (100.0%) | 76 (100.0%) |
Real Estate Taxes by Mortgage Status in El Rancho Vela
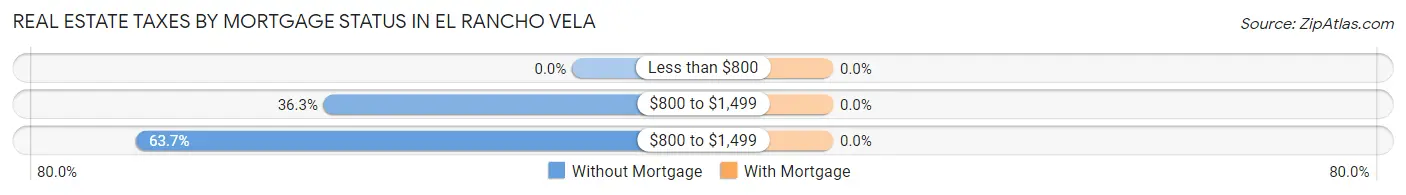
| Property Taxes | Without Mortgage | With Mortgage |
| Less than $800 | 0 (0.0%) | 0 (0.0%) |
| $800 to $1,499 | 45 (36.3%) | 0 (0.0%) |
| $800 to $1,499 | 79 (63.7%) | 0 (0.0%) |
| Total | 124 (100.0%) | 76 (100.0%) |
Health & Disability in El Rancho Vela
Health Insurance Coverage by Age in El Rancho Vela
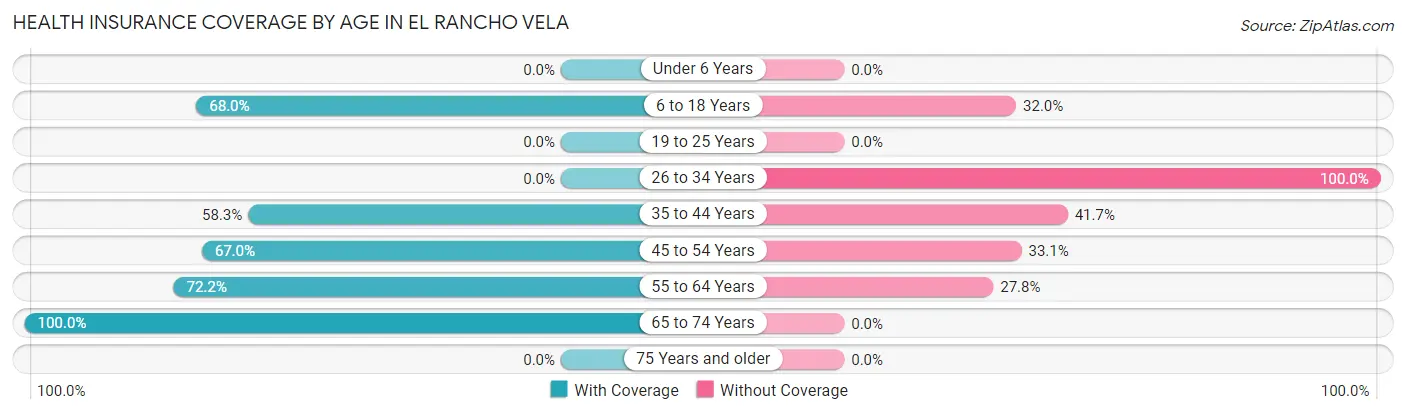
| Age Bracket | With Coverage | Without Coverage |
| Under 6 Years | 0 (0.0%) | 0 (0.0%) |
| 6 to 18 Years | 140 (68.0%) | 66 (32.0%) |
| 19 to 25 Years | 0 (0.0%) | 0 (0.0%) |
| 26 to 34 Years | 0 (0.0%) | 111 (100.0%) |
| 35 to 44 Years | 56 (58.3%) | 40 (41.7%) |
| 45 to 54 Years | 79 (66.9%) | 39 (33.1%) |
| 55 to 64 Years | 13 (72.2%) | 5 (27.8%) |
| 65 to 74 Years | 45 (100.0%) | 0 (0.0%) |
| 75 Years and older | 0 (0.0%) | 0 (0.0%) |
| Total | 333 (56.1%) | 261 (43.9%) |
Health Insurance Coverage by Citizenship Status in El Rancho Vela
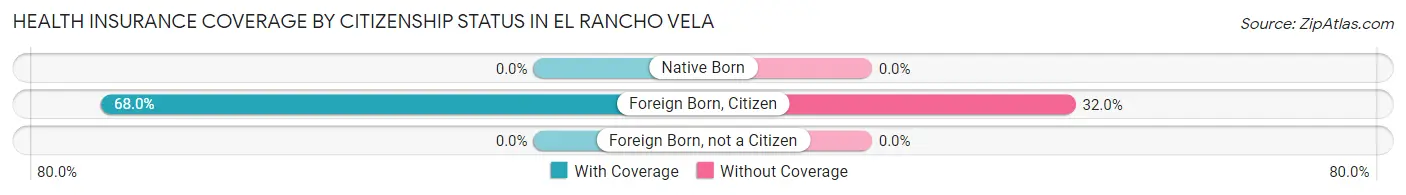
| Citizenship Status | With Coverage | Without Coverage |
| Native Born | 0 (0.0%) | 0 (0.0%) |
| Foreign Born, Citizen | 140 (68.0%) | 66 (32.0%) |
| Foreign Born, not a Citizen | 0 (0.0%) | 0 (0.0%) |
Health Insurance Coverage by Household Income in El Rancho Vela
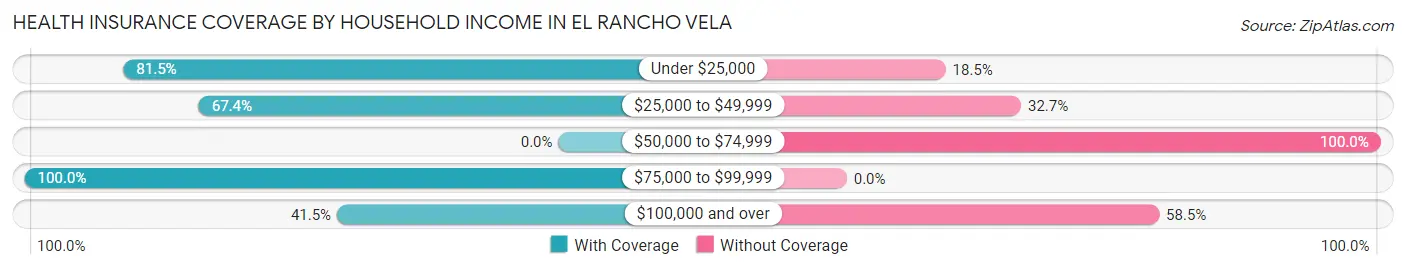
| Household Income | With Coverage | Without Coverage |
| Under $25,000 | 22 (81.5%) | 5 (18.5%) |
| $25,000 to $49,999 | 229 (67.3%) | 111 (32.7%) |
| $50,000 to $74,999 | 0 (0.0%) | 66 (100.0%) |
| $75,000 to $99,999 | 26 (100.0%) | 0 (0.0%) |
| $100,000 and over | 56 (41.5%) | 79 (58.5%) |
Public vs Private Health Insurance Coverage by Age in El Rancho Vela
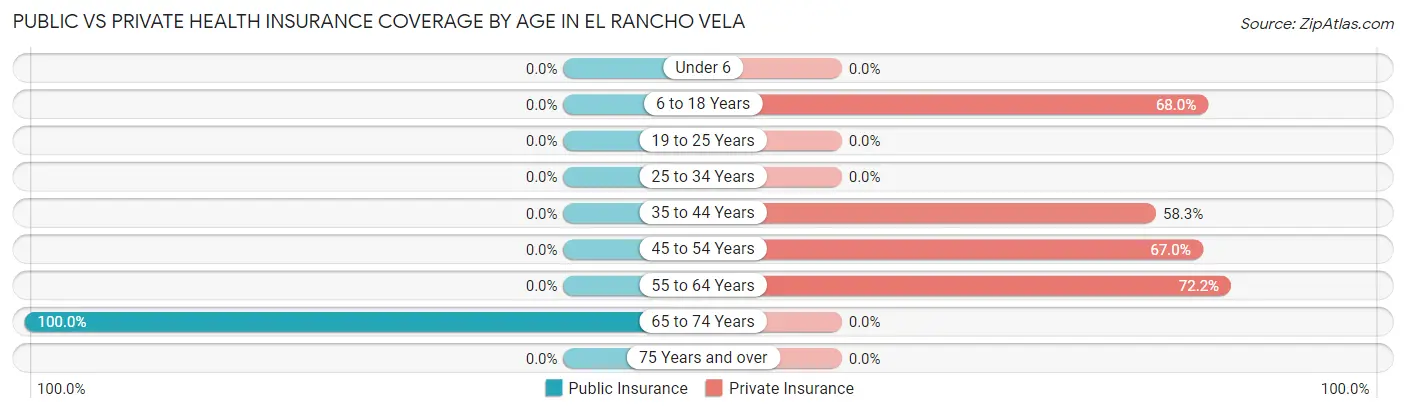
| Age Bracket | Public Insurance | Private Insurance |
| Under 6 | 0 (0.0%) | 0 (0.0%) |
| 6 to 18 Years | 0 (0.0%) | 140 (68.0%) |
| 19 to 25 Years | 0 (0.0%) | 0 (0.0%) |
| 25 to 34 Years | 0 (0.0%) | 0 (0.0%) |
| 35 to 44 Years | 0 (0.0%) | 56 (58.3%) |
| 45 to 54 Years | 0 (0.0%) | 79 (66.9%) |
| 55 to 64 Years | 0 (0.0%) | 13 (72.2%) |
| 65 to 74 Years | 45 (100.0%) | 0 (0.0%) |
| 75 Years and over | 0 (0.0%) | 0 (0.0%) |
| Total | 45 (7.6%) | 288 (48.5%) |
Disability Status by Sex by Age in El Rancho Vela
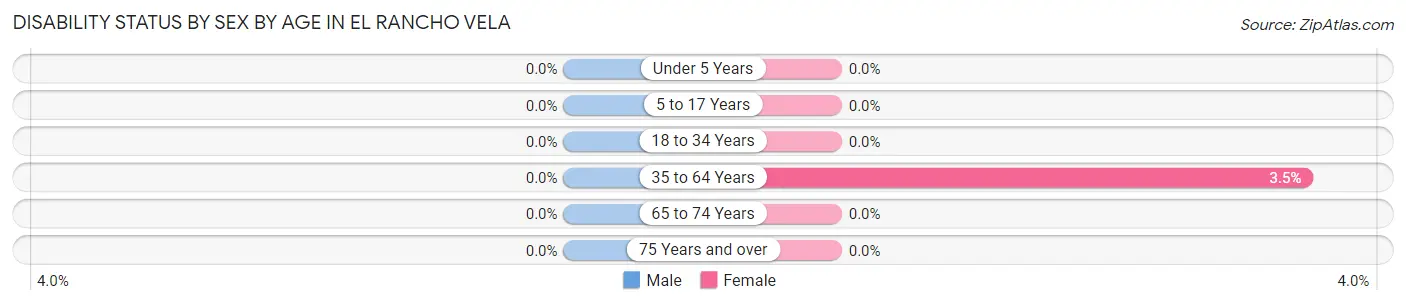
| Age Bracket | Male | Female |
| Under 5 Years | 0 (0.0%) | 0 (0.0%) |
| 5 to 17 Years | 0 (0.0%) | 0 (0.0%) |
| 18 to 34 Years | 0 (0.0%) | 0 (0.0%) |
| 35 to 64 Years | 0 (0.0%) | 5 (3.5%) |
| 65 to 74 Years | 0 (0.0%) | 0 (0.0%) |
| 75 Years and over | 0 (0.0%) | 0 (0.0%) |
Disability Class by Sex by Age in El Rancho Vela
Disability Class: Hearing Difficulty
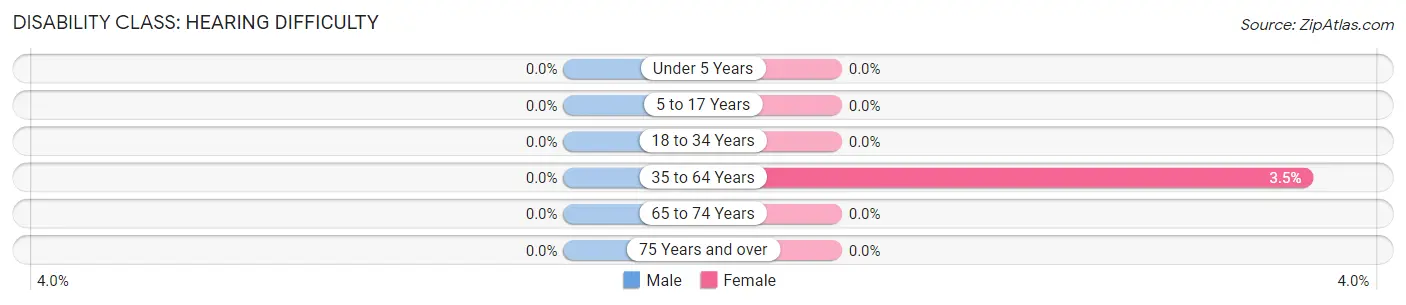
| Age Bracket | Male | Female |
| Under 5 Years | 0 (0.0%) | 0 (0.0%) |
| 5 to 17 Years | 0 (0.0%) | 0 (0.0%) |
| 18 to 34 Years | 0 (0.0%) | 0 (0.0%) |
| 35 to 64 Years | 0 (0.0%) | 5 (3.5%) |
| 65 to 74 Years | 0 (0.0%) | 0 (0.0%) |
| 75 Years and over | 0 (0.0%) | 0 (0.0%) |
Disability Class: Vision Difficulty
| Age Bracket | Male | Female |
| Under 5 Years | 0 (0.0%) | 0 (0.0%) |
| 5 to 17 Years | 0 (0.0%) | 0 (0.0%) |
| 18 to 34 Years | 0 (0.0%) | 0 (0.0%) |
| 35 to 64 Years | 0 (0.0%) | 0 (0.0%) |
| 65 to 74 Years | 0 (0.0%) | 0 (0.0%) |
| 75 Years and over | 0 (0.0%) | 0 (0.0%) |
Disability Class: Cognitive Difficulty
| Age Bracket | Male | Female |
| 5 to 17 Years | 0 (0.0%) | 0 (0.0%) |
| 18 to 34 Years | 0 (0.0%) | 0 (0.0%) |
| 35 to 64 Years | 0 (0.0%) | 0 (0.0%) |
| 65 to 74 Years | 0 (0.0%) | 0 (0.0%) |
| 75 Years and over | 0 (0.0%) | 0 (0.0%) |
Disability Class: Ambulatory Difficulty
| Age Bracket | Male | Female |
| 5 to 17 Years | 0 (0.0%) | 0 (0.0%) |
| 18 to 34 Years | 0 (0.0%) | 0 (0.0%) |
| 35 to 64 Years | 0 (0.0%) | 0 (0.0%) |
| 65 to 74 Years | 0 (0.0%) | 0 (0.0%) |
| 75 Years and over | 0 (0.0%) | 0 (0.0%) |
Disability Class: Self-Care Difficulty
| Age Bracket | Male | Female |
| 5 to 17 Years | 0 (0.0%) | 0 (0.0%) |
| 18 to 34 Years | 0 (0.0%) | 0 (0.0%) |
| 35 to 64 Years | 0 (0.0%) | 0 (0.0%) |
| 65 to 74 Years | 0 (0.0%) | 0 (0.0%) |
| 75 Years and over | 0 (0.0%) | 0 (0.0%) |
Technology Access in El Rancho Vela
Computing Device Access in El Rancho Vela
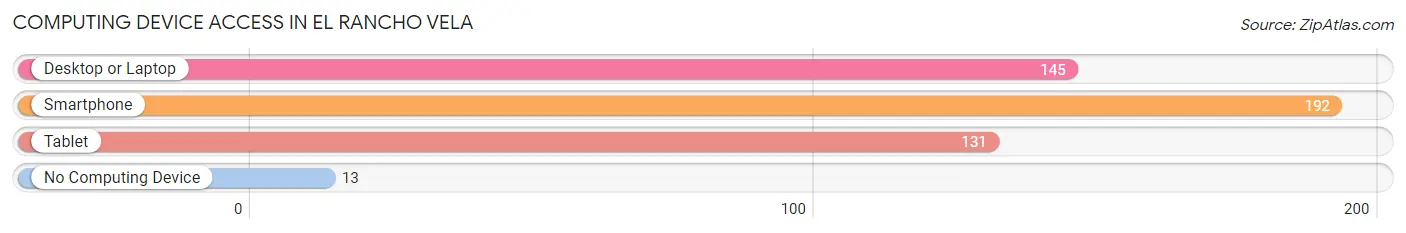
| Device Type | # Households | % Households |
| Desktop or Laptop | 145 | 70.7% |
| Smartphone | 192 | 93.7% |
| Tablet | 131 | 63.9% |
| No Computing Device | 13 | 6.3% |
| Total | 205 | 100.0% |
Internet Access in El Rancho Vela
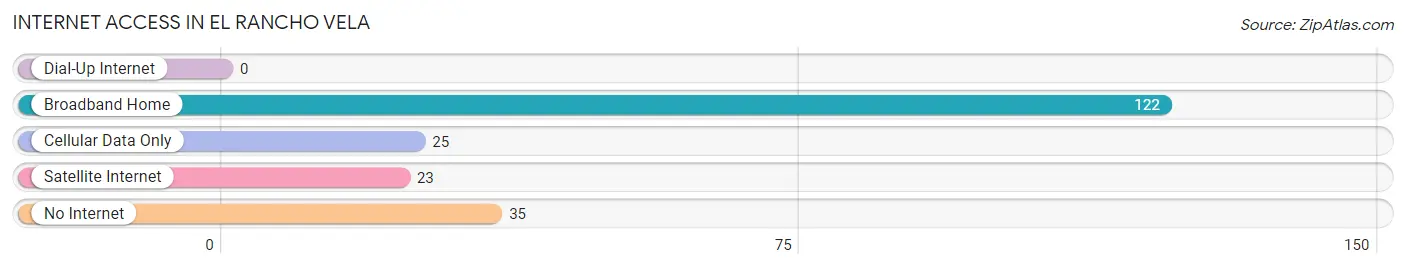
| Internet Type | # Households | % Households |
| Dial-Up Internet | 0 | 0.0% |
| Broadband Home | 122 | 59.5% |
| Cellular Data Only | 25 | 12.2% |
| Satellite Internet | 23 | 11.2% |
| No Internet | 35 | 17.1% |
| Total | 205 | 100.0% |
El Rancho Vela Summary
Rancho Vela, Texas is a small unincorporated community located in the southeastern corner of Hidalgo County, Texas. It is situated on the banks of the Rio Grande, just south of the city of McAllen. The community is home to a diverse population of Mexican-American, African-American, and Anglo-American residents.
History
Rancho Vela was founded in the late 19th century by a group of Mexican-American settlers. The settlers were attracted to the area due to its fertile soil and abundant water supply. The community was named after the nearby Vela Ranch, which was owned by the prominent Mexican-American family of the same name.
The community grew steadily throughout the early 20th century, and by the 1950s, it had become a thriving agricultural center. The area was known for its production of cotton, corn, and other crops. In addition, the community was home to several small businesses, including a general store, a barber shop, and a post office.
Geography
Rancho Vela is located in the southeastern corner of Hidalgo County, Texas. It is situated on the banks of the Rio Grande, just south of the city of McAllen. The community is surrounded by agricultural fields and is bordered by the cities of Donna and Pharr.
The climate in Rancho Vela is subtropical, with hot summers and mild winters. The average annual temperature is around 75 degrees Fahrenheit. The average annual precipitation is around 24 inches.
Economy
Rancho Vela is primarily an agricultural community. The area is known for its production of cotton, corn, and other crops. In addition, the community is home to several small businesses, including a general store, a barber shop, and a post office.
The community is also home to a number of manufacturing and industrial businesses. These businesses include a plastics factory, a metal fabrication plant, and a food processing plant.
Demographics
As of the 2010 census, the population of Rancho Vela was 1,845. The racial makeup of the community was 79.3% Hispanic or Latino, 16.2% African American, and 4.5% White. The median household income was $25,972.
Conclusion
Rancho Vela, Texas is a small unincorporated community located in the southeastern corner of Hidalgo County, Texas. It is situated on the banks of the Rio Grande, just south of the city of McAllen. The community is home to a diverse population of Mexican-American, African-American, and Anglo-American residents. The area is known for its production of cotton, corn, and other crops, as well as its small businesses. The median household income in the community is $25,972.
Common Questions
What is Per Capita Income in El Rancho Vela?
Per Capita income in El Rancho Vela is $22,867.
What is the Median Household income in El Rancho Vela?
Median Household Income in El Rancho Vela is $46,989.
What is Inequality or Gini Index in El Rancho Vela?
Inequality or Gini Index in El Rancho Vela is 0.29.
What is the Total Population of El Rancho Vela?
Total Population of El Rancho Vela is 594.
What is the Total Male Population of El Rancho Vela?
Total Male Population of El Rancho Vela is 268.
What is the Total Female Population of El Rancho Vela?
Total Female Population of El Rancho Vela is 326.
What is the Ratio of Males per 100 Females in El Rancho Vela?
There are 82.21 Males per 100 Females in El Rancho Vela.
What is the Ratio of Females per 100 Males in El Rancho Vela?
There are 121.64 Females per 100 Males in El Rancho Vela.
What is the Median Population Age in El Rancho Vela?
Median Population Age in El Rancho Vela is 29.8 Years.
What is the Average Family Size in El Rancho Vela
Average Family Size in El Rancho Vela is 2.5 People.
What is the Average Household Size in El Rancho Vela
Average Household Size in El Rancho Vela is 2.9 People.
How Large is the Labor Force in El Rancho Vela?
There are 326 People in the Labor Forcein in El Rancho Vela.
What is the Percentage of People in the Labor Force in El Rancho Vela?
57.5% of People are in the Labor Force in El Rancho Vela.