Bixby, TX Map & Demographics
Bixby Map
Bixby Overview
$17,157
PER CAPITA INCOME
$80,833
AVG FAMILY INCOME
0.35
INEQUALITY / GINI INDEX
427
TOTAL POPULATION
173
MALE POPULATION
254
FEMALE POPULATION
68.11
MALES / 100 FEMALES
146.82
FEMALES / 100 MALES
32.3
MEDIAN AGE
4.6
AVG FAMILY SIZE
4.2
AVG HOUSEHOLD SIZE
133
LABOR FORCE [ PEOPLE ]
44.6%
PERCENT IN LABOR FORCE
Income in Bixby
Income Overview in Bixby
| Characteristic | Number | Measure |
| Per Capita Income | 427 | $17,157 |
| Median Family Income | 86 | $80,833 |
| Mean Family Income | 86 | $75,214 |
| Median Household Income | 102 | $0 |
| Mean Household Income | 102 | $70,852 |
| Income Deficit | 86 | $0 |
| Wage / Income Gap (%) | 427 | 0.00% |
| Wage / Income Gap ($) | 427 | 100.00¢ per $1 |
| Gini / Inequality Index | 427 | 0.35 |
Earnings by Sex in Bixby
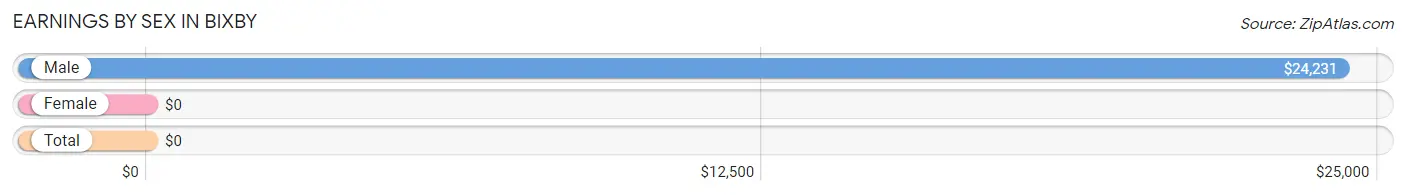
| Sex | Number | Average Earnings |
| Male | 102 (48.3%) | $24,231 |
| Female | 109 (51.7%) | $0 |
| Total | 211 (100.0%) | $0 |
Earnings by Sex by Income Bracket in Bixby
The most common earnings brackets in Bixby are $22,500 to $24,999 for men (39 | 38.2%) and $2,499 or less for women (39 | 35.8%).
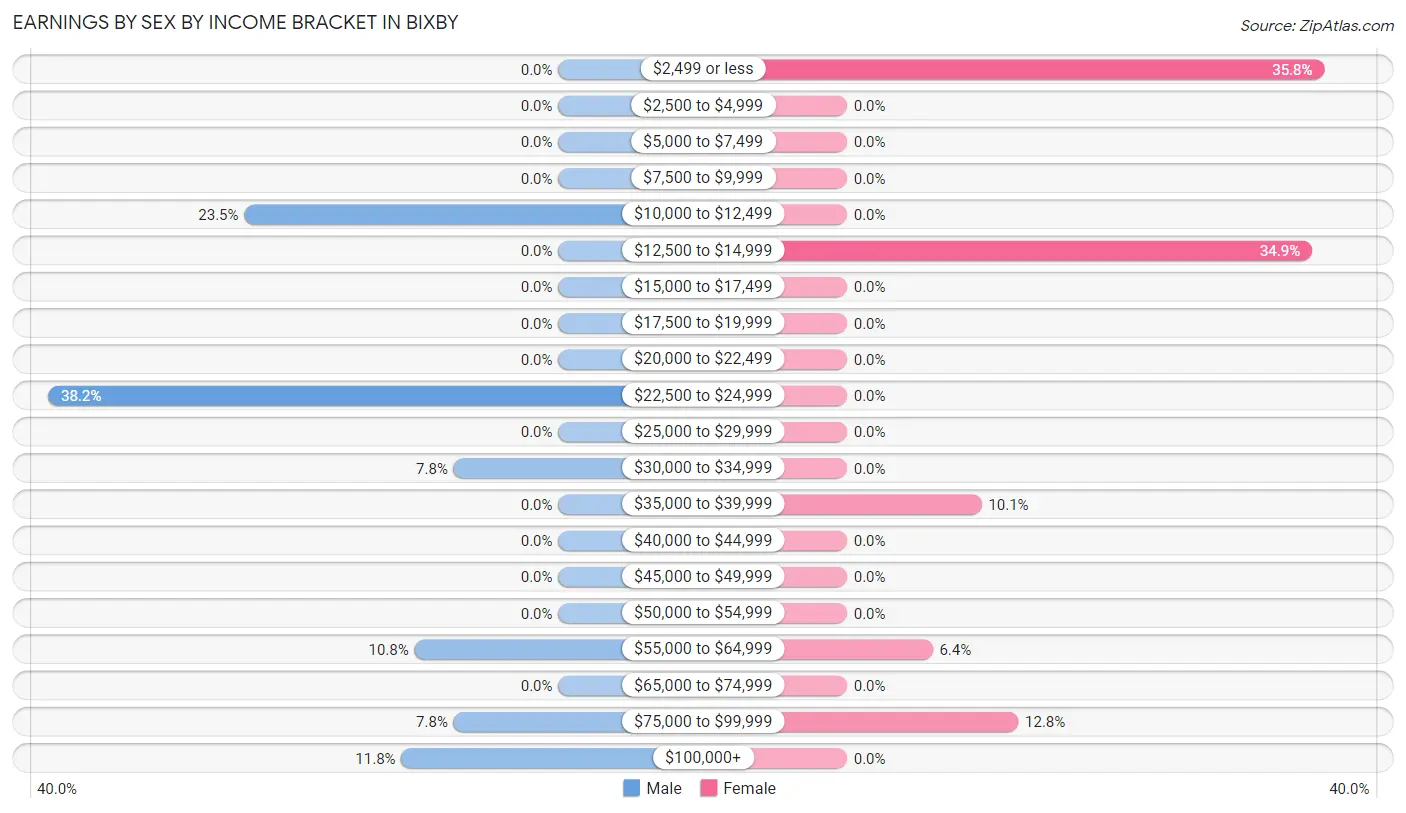
| Income | Male | Female |
| $2,499 or less | 0 (0.0%) | 39 (35.8%) |
| $2,500 to $4,999 | 0 (0.0%) | 0 (0.0%) |
| $5,000 to $7,499 | 0 (0.0%) | 0 (0.0%) |
| $7,500 to $9,999 | 0 (0.0%) | 0 (0.0%) |
| $10,000 to $12,499 | 24 (23.5%) | 0 (0.0%) |
| $12,500 to $14,999 | 0 (0.0%) | 38 (34.9%) |
| $15,000 to $17,499 | 0 (0.0%) | 0 (0.0%) |
| $17,500 to $19,999 | 0 (0.0%) | 0 (0.0%) |
| $20,000 to $22,499 | 0 (0.0%) | 0 (0.0%) |
| $22,500 to $24,999 | 39 (38.2%) | 0 (0.0%) |
| $25,000 to $29,999 | 0 (0.0%) | 0 (0.0%) |
| $30,000 to $34,999 | 8 (7.8%) | 0 (0.0%) |
| $35,000 to $39,999 | 0 (0.0%) | 11 (10.1%) |
| $40,000 to $44,999 | 0 (0.0%) | 0 (0.0%) |
| $45,000 to $49,999 | 0 (0.0%) | 0 (0.0%) |
| $50,000 to $54,999 | 0 (0.0%) | 0 (0.0%) |
| $55,000 to $64,999 | 11 (10.8%) | 7 (6.4%) |
| $65,000 to $74,999 | 0 (0.0%) | 0 (0.0%) |
| $75,000 to $99,999 | 8 (7.8%) | 14 (12.8%) |
| $100,000+ | 12 (11.8%) | 0 (0.0%) |
| Total | 102 (100.0%) | 109 (100.0%) |
Earnings by Sex by Educational Attainment in Bixby
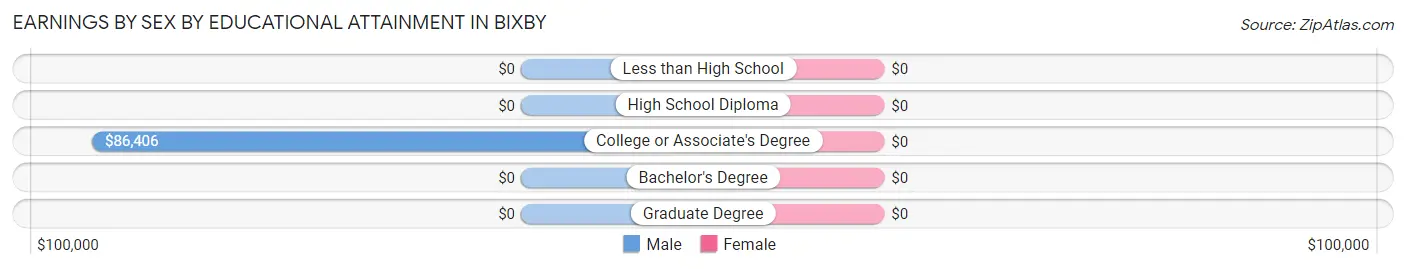
| Educational Attainment | Male Income | Female Income |
| Less than High School | - | - |
| High School Diploma | - | - |
| College or Associate's Degree | $86,406 | $0 |
| Bachelor's Degree | - | - |
| Graduate Degree | - | - |
| Total | - | - |
Family Income in Bixby
Family Income Brackets in Bixby
According to the Bixby family income data, there are 29 families falling into the $50,000 to $74,999 income range, which is the most common income bracket and makes up 33.7% of all families.
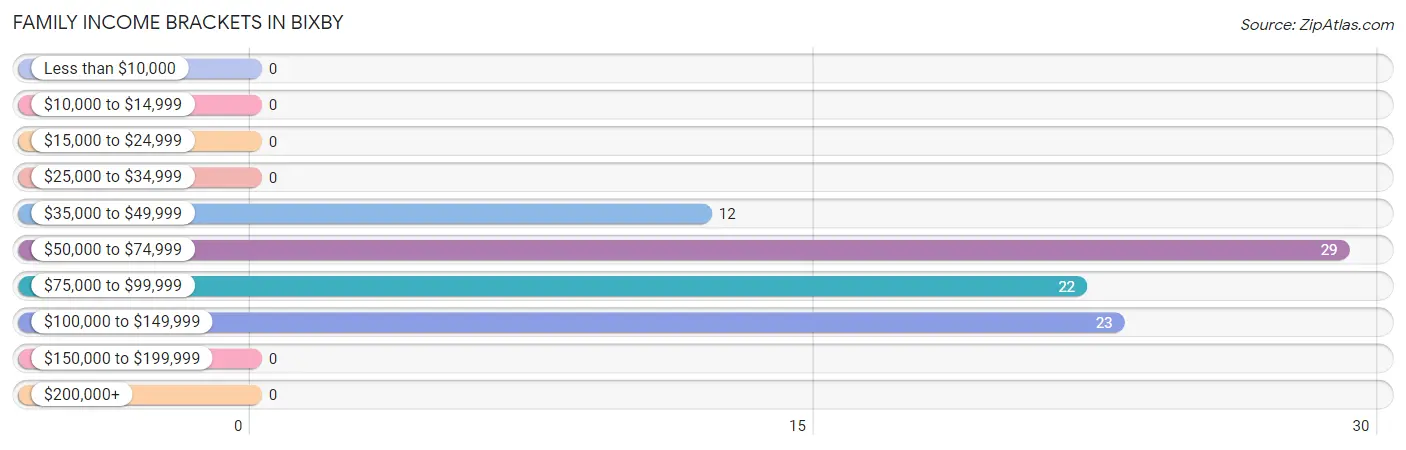
| Income Bracket | # Families | % Families |
| Less than $10,000 | 0 | 0.0% |
| $10,000 to $14,999 | 0 | 0.0% |
| $15,000 to $24,999 | 0 | 0.0% |
| $25,000 to $34,999 | 0 | 0.0% |
| $35,000 to $49,999 | 12 | 14.0% |
| $50,000 to $74,999 | 29 | 33.7% |
| $75,000 to $99,999 | 22 | 25.6% |
| $100,000 to $149,999 | 23 | 26.7% |
| $150,000 to $199,999 | 0 | 0.0% |
| $200,000+ | 0 | 0.0% |
Family Income by Famaliy Size in Bixby
2-person families (39 | 45.4%) account for the highest median family income in Bixby with $97,344 per family, while 2-person families (39 | 45.4%) have the highest median income of $48,672 per family member.
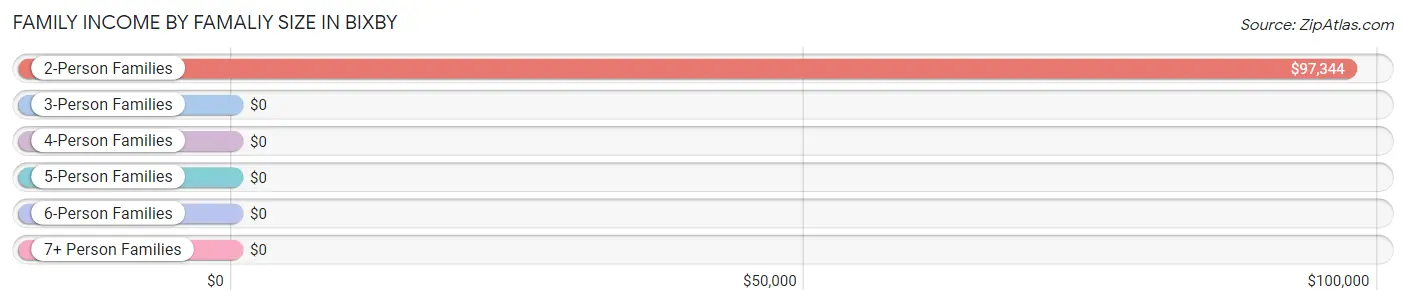
| Income Bracket | # Families | Median Income |
| 2-Person Families | 39 (45.4%) | $97,344 |
| 3-Person Families | 0 (0.0%) | $0 |
| 4-Person Families | 12 (14.0%) | $0 |
| 5-Person Families | 6 (7.0%) | $0 |
| 6-Person Families | 0 (0.0%) | $0 |
| 7+ Person Families | 29 (33.7%) | $0 |
| Total | 86 (100.0%) | $80,833 |
Family Income by Number of Earners in Bixby
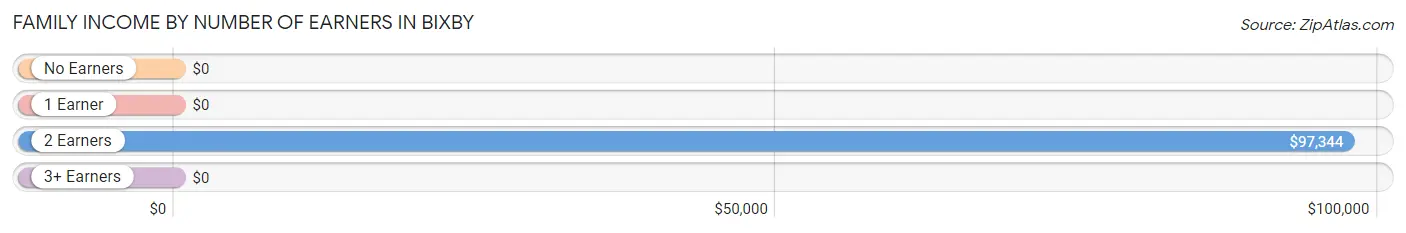
| Number of Earners | # Families | Median Income |
| No Earners | 0 (0.0%) | $0 |
| 1 Earner | 18 (20.9%) | $0 |
| 2 Earners | 39 (45.4%) | $97,344 |
| 3+ Earners | 29 (33.7%) | $0 |
| Total | 86 (100.0%) | $80,833 |
Household Income in Bixby
Household Income Brackets in Bixby
With 29 households falling in the category, the $50,000 to $74,999 income range is the most frequent in Bixby, accounting for 28.4% of all households.
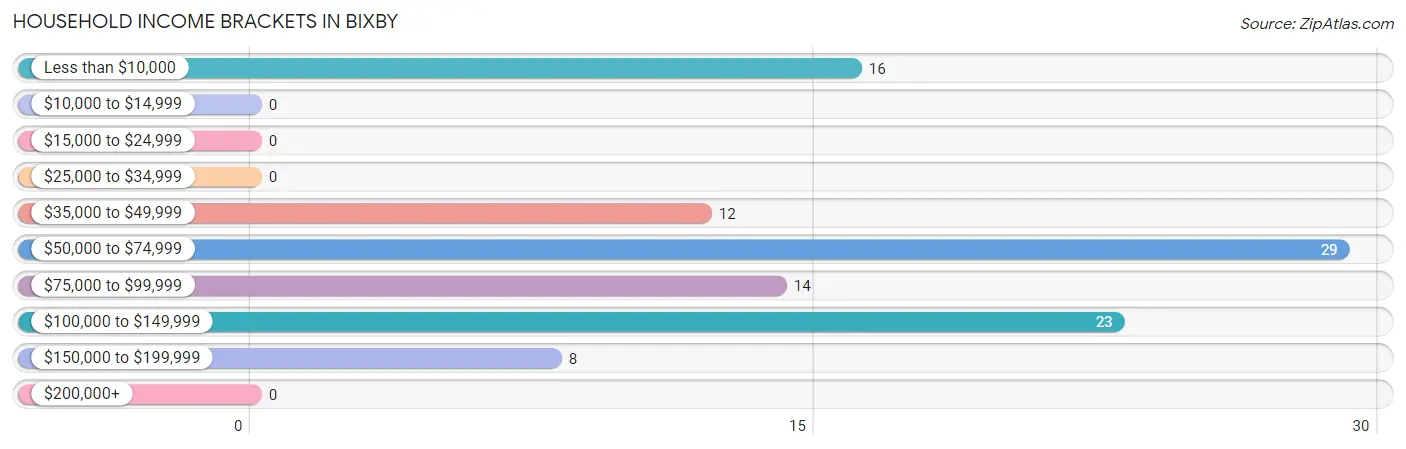
| Income Bracket | # Households | % Households |
| Less than $10,000 | 16 | 15.7% |
| $10,000 to $14,999 | 0 | 0.0% |
| $15,000 to $24,999 | 0 | 0.0% |
| $25,000 to $34,999 | 0 | 0.0% |
| $35,000 to $49,999 | 12 | 11.8% |
| $50,000 to $74,999 | 29 | 28.4% |
| $75,000 to $99,999 | 14 | 13.7% |
| $100,000 to $149,999 | 23 | 22.5% |
| $150,000 to $199,999 | 8 | 7.8% |
| $200,000+ | 0 | 0.0% |
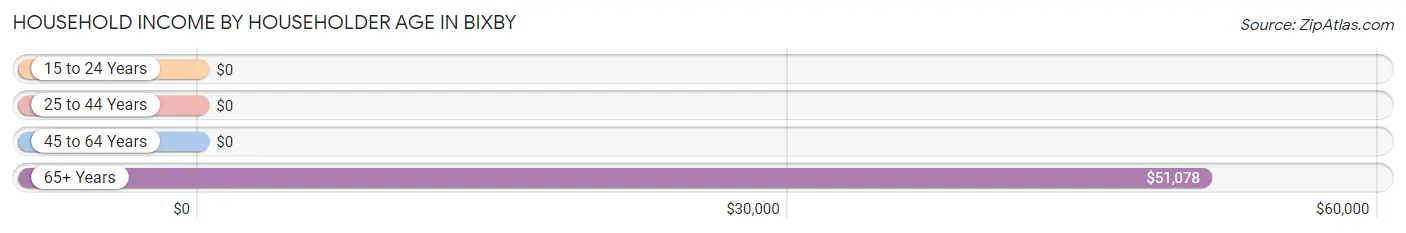
Household Income by Householder Age in Bixby
The median household income in Bixby is $0, with the highest median household income of $51,078 found in the 65+ years age bracket for the primary householder. A total of 49 households (48.0%) fall into this category.
| Income Bracket | # Households | Median Income |
| 15 to 24 Years | 0 (0.0%) | $0 |
| 25 to 44 Years | 17 (16.7%) | $0 |
| 45 to 64 Years | 36 (35.3%) | $0 |
| 65+ Years | 49 (48.0%) | $51,078 |
| Total | 102 (100.0%) | $0 |
Poverty in Bixby
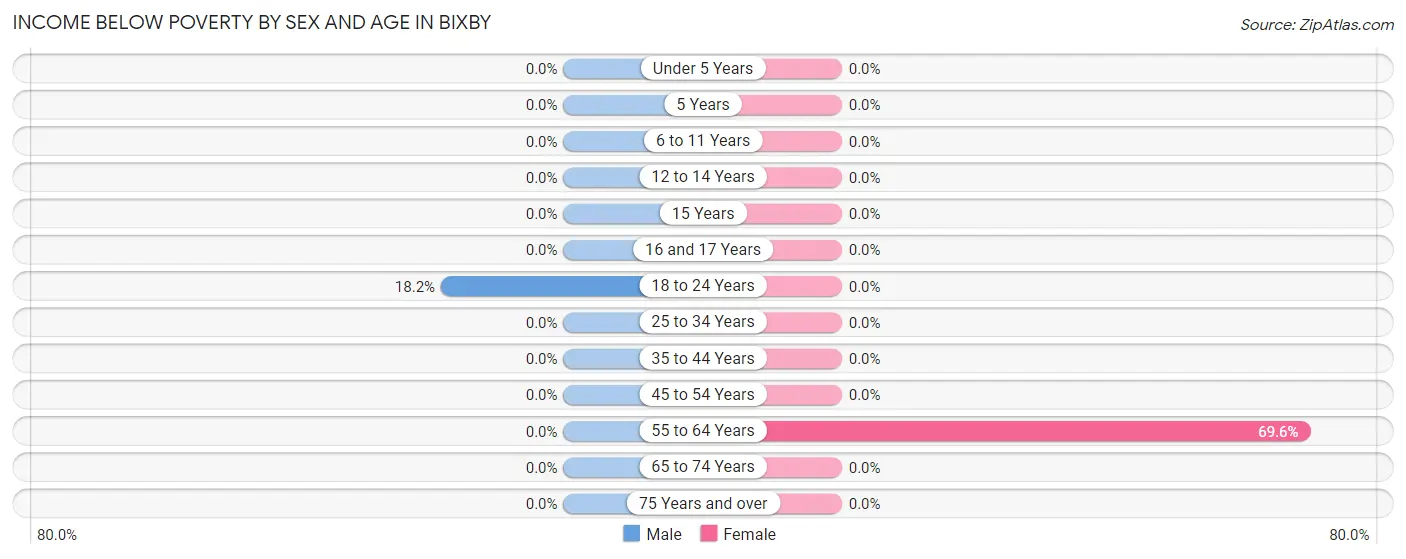
Income Below Poverty by Sex and Age in Bixby
With 4.6% poverty level for males and 6.3% for females among the residents of Bixby, 18 to 24 year old males and 55 to 64 year old females are the most vulnerable to poverty, with 8 males (18.2%) and 16 females (69.6%) in their respective age groups living below the poverty level.
| Age Bracket | Male | Female |
| Under 5 Years | 0 (0.0%) | 0 (0.0%) |
| 5 Years | 0 (0.0%) | 0 (0.0%) |
| 6 to 11 Years | 0 (0.0%) | 0 (0.0%) |
| 12 to 14 Years | 0 (0.0%) | 0 (0.0%) |
| 15 Years | 0 (0.0%) | 0 (0.0%) |
| 16 and 17 Years | 0 (0.0%) | 0 (0.0%) |
| 18 to 24 Years | 8 (18.2%) | 0 (0.0%) |
| 25 to 34 Years | 0 (0.0%) | 0 (0.0%) |
| 35 to 44 Years | 0 (0.0%) | 0 (0.0%) |
| 45 to 54 Years | 0 (0.0%) | 0 (0.0%) |
| 55 to 64 Years | 0 (0.0%) | 16 (69.6%) |
| 65 to 74 Years | 0 (0.0%) | 0 (0.0%) |
| 75 Years and over | 0 (0.0%) | 0 (0.0%) |
| Total | 8 (4.6%) | 16 (6.3%) |
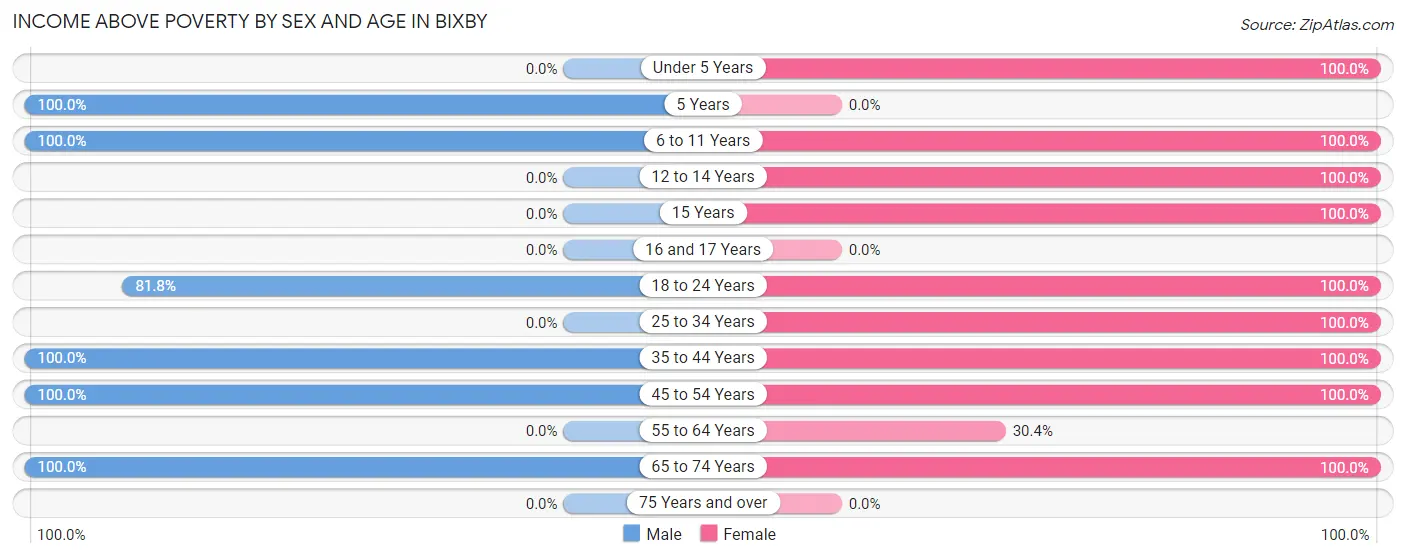
Income Above Poverty by Sex and Age in Bixby
According to the poverty statistics in Bixby, males aged 5 years and females aged under 5 years are the age groups that are most secure financially, with 100.0% of males and 100.0% of females in these age groups living above the poverty line.
| Age Bracket | Male | Female |
| Under 5 Years | 0 (0.0%) | 6 (100.0%) |
| 5 Years | 6 (100.0%) | 0 (0.0%) |
| 6 to 11 Years | 33 (100.0%) | 36 (100.0%) |
| 12 to 14 Years | 0 (0.0%) | 42 (100.0%) |
| 15 Years | 0 (0.0%) | 6 (100.0%) |
| 16 and 17 Years | 0 (0.0%) | 0 (0.0%) |
| 18 to 24 Years | 36 (81.8%) | 39 (100.0%) |
| 25 to 34 Years | 0 (0.0%) | 17 (100.0%) |
| 35 to 44 Years | 50 (100.0%) | 31 (100.0%) |
| 45 to 54 Years | 20 (100.0%) | 18 (100.0%) |
| 55 to 64 Years | 0 (0.0%) | 7 (30.4%) |
| 65 to 74 Years | 20 (100.0%) | 36 (100.0%) |
| 75 Years and over | 0 (0.0%) | 0 (0.0%) |
| Total | 165 (95.4%) | 238 (93.7%) |
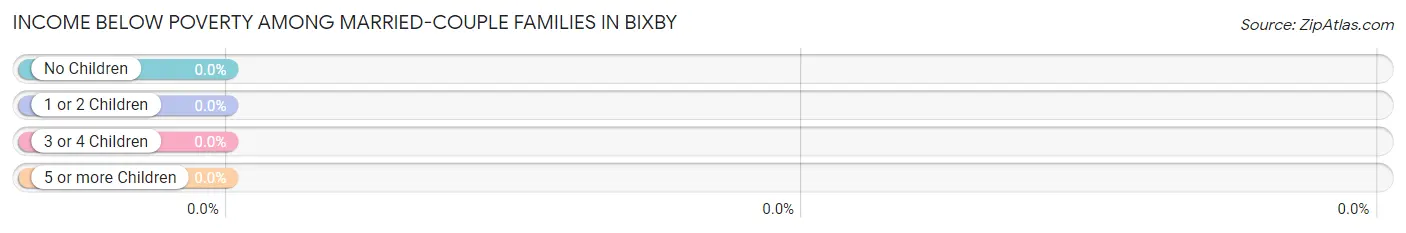
Income Below Poverty Among Married-Couple Families in Bixby
| Children | Above Poverty | Below Poverty |
| No Children | 43 (100.0%) | 0 (0.0%) |
| 1 or 2 Children | 0 (0.0%) | 0 (0.0%) |
| 3 or 4 Children | 0 (0.0%) | 0 (0.0%) |
| 5 or more Children | 0 (0.0%) | 0 (0.0%) |
| Total | 43 (100.0%) | 0 (0.0%) |
Income Below Poverty Among Single-Parent Households in Bixby
| Children | Single Father | Single Mother |
| No Children | 0 (0.0%) | 0 (0.0%) |
| 1 or 2 Children | 0 (0.0%) | 0 (0.0%) |
| 3 or 4 Children | 0 (0.0%) | 0 (0.0%) |
| 5 or more Children | 0 (0.0%) | 0 (0.0%) |
| Total | 0 (0.0%) | 0 (0.0%) |
Income Below Poverty Among Married-Couple vs Single-Parent Households in Bixby
| Children | Married-Couple Families | Single-Parent Households |
| No Children | 0 (0.0%) | 0 (0.0%) |
| 1 or 2 Children | 0 (0.0%) | 0 (0.0%) |
| 3 or 4 Children | 0 (0.0%) | 0 (0.0%) |
| 5 or more Children | 0 (0.0%) | 0 (0.0%) |
| Total | 0 (0.0%) | 0 (0.0%) |
Race in Bixby
The most populous races in Bixby are Hispanic or Latino (408 | 95.6%), White / Caucasian (350 | 82.0%), and Two or more Races (58 | 13.6%).
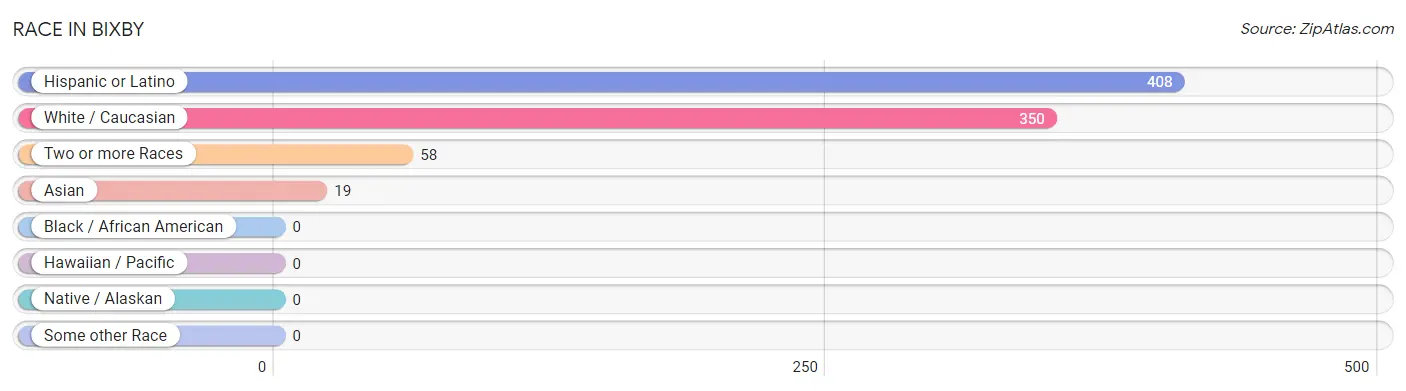
| Race | # Population | % Population |
| Asian | 19 | 4.4% |
| Black / African American | 0 | 0.0% |
| Hawaiian / Pacific | 0 | 0.0% |
| Hispanic or Latino | 408 | 95.6% |
| Native / Alaskan | 0 | 0.0% |
| White / Caucasian | 350 | 82.0% |
| Two or more Races | 58 | 13.6% |
| Some other Race | 0 | 0.0% |
| Total | 427 | 100.0% |
Ancestry in Bixby
The most populous ancestries reported in Bixby are Mexican (367 | 86.0%), American (46 | 10.8%), Korean (19 | 4.4%), Pueblo (16 | 3.7%), and French (11 | 2.6%), together accounting for 107.5% of all Bixby residents.
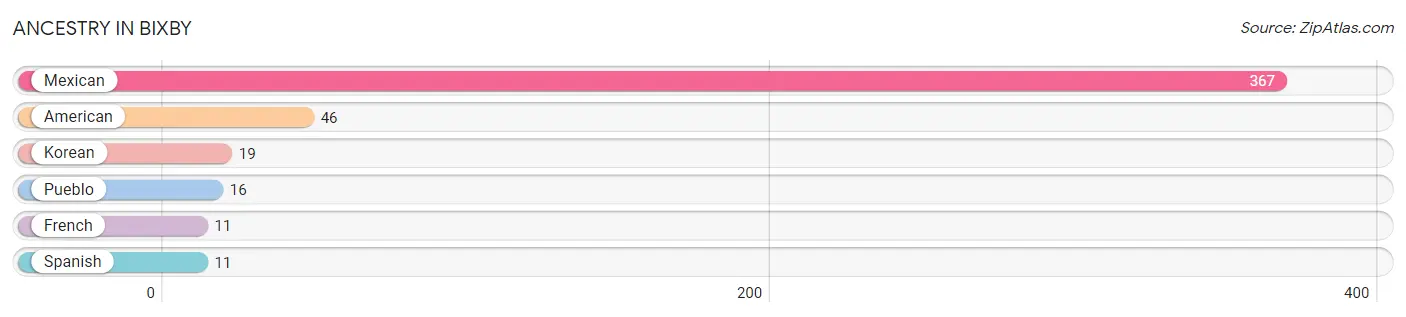
| Ancestry | # Population | % Population |
| American | 46 | 10.8% |
| French | 11 | 2.6% |
| Korean | 19 | 4.4% |
| Mexican | 367 | 86.0% |
| Pueblo | 16 | 3.7% |
| Spanish | 11 | 2.6% | View All 6 Rows |
Immigrants in Bixby
The most numerous immigrant groups reported in Bixby came from Asia (19 | 4.4%), Philippines (19 | 4.4%), and South Eastern Asia (19 | 4.4%), together accounting for 13.4% of all Bixby residents.
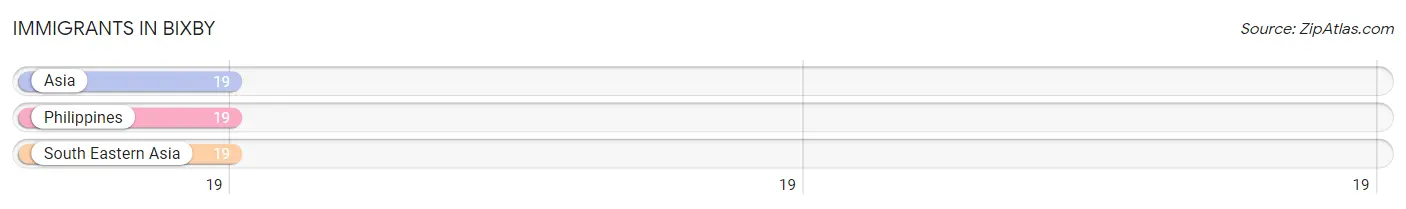
| Immigration Origin | # Population | % Population |
| Asia | 19 | 4.4% |
| Philippines | 19 | 4.4% |
| South Eastern Asia | 19 | 4.4% | View All 3 Rows |
Sex and Age in Bixby
Sex and Age in Bixby
The most populous age groups in Bixby are 35 to 39 Years (50 | 28.9%) for men and 10 to 14 Years (78 | 30.7%) for women.
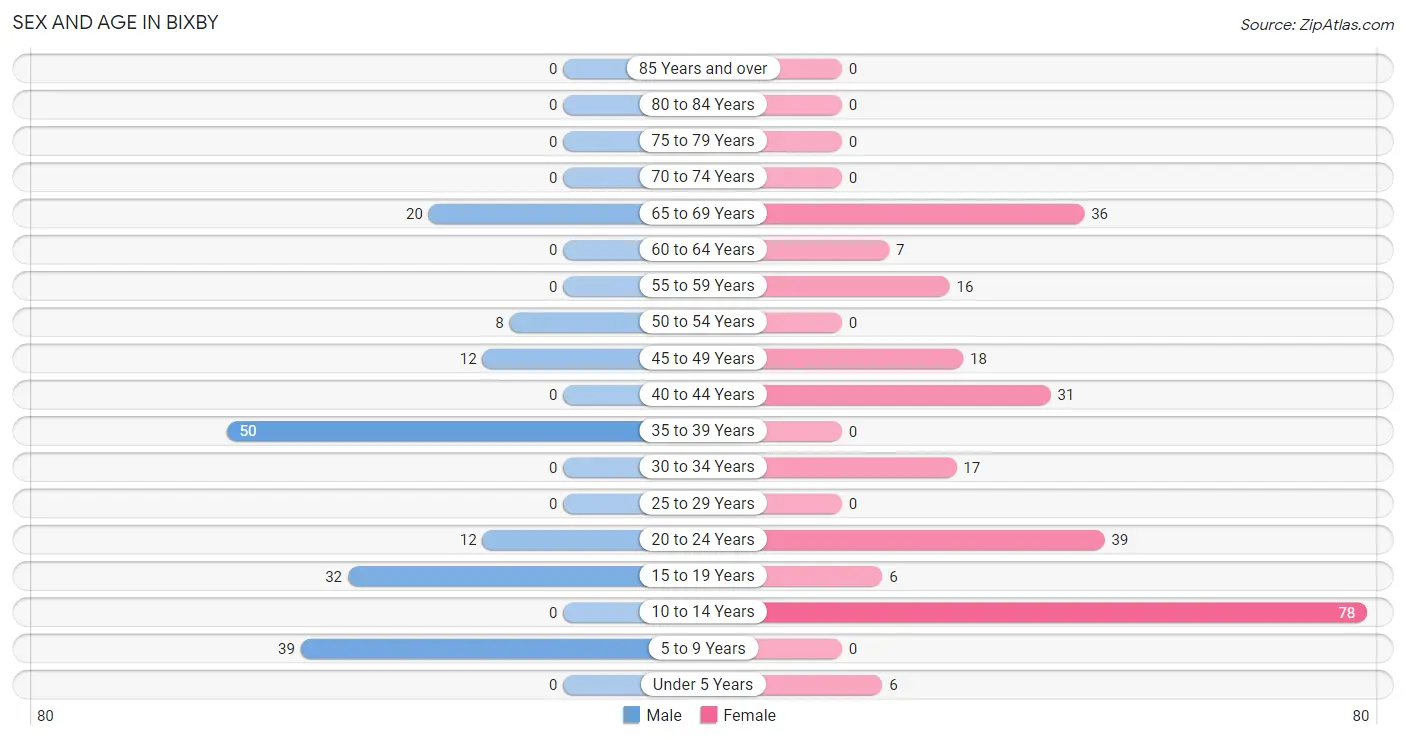
| Age Bracket | Male | Female |
| Under 5 Years | 0 (0.0%) | 6 (2.4%) |
| 5 to 9 Years | 39 (22.5%) | 0 (0.0%) |
| 10 to 14 Years | 0 (0.0%) | 78 (30.7%) |
| 15 to 19 Years | 32 (18.5%) | 6 (2.4%) |
| 20 to 24 Years | 12 (6.9%) | 39 (15.3%) |
| 25 to 29 Years | 0 (0.0%) | 0 (0.0%) |
| 30 to 34 Years | 0 (0.0%) | 17 (6.7%) |
| 35 to 39 Years | 50 (28.9%) | 0 (0.0%) |
| 40 to 44 Years | 0 (0.0%) | 31 (12.2%) |
| 45 to 49 Years | 12 (6.9%) | 18 (7.1%) |
| 50 to 54 Years | 8 (4.6%) | 0 (0.0%) |
| 55 to 59 Years | 0 (0.0%) | 16 (6.3%) |
| 60 to 64 Years | 0 (0.0%) | 7 (2.8%) |
| 65 to 69 Years | 20 (11.6%) | 36 (14.2%) |
| 70 to 74 Years | 0 (0.0%) | 0 (0.0%) |
| 75 to 79 Years | 0 (0.0%) | 0 (0.0%) |
| 80 to 84 Years | 0 (0.0%) | 0 (0.0%) |
| 85 Years and over | 0 (0.0%) | 0 (0.0%) |
| Total | 173 (100.0%) | 254 (100.0%) |
Families and Households in Bixby
Median Family Size in Bixby
The median family size in Bixby is 4.59 persons per family, with single female/mother families (35 | 40.7%) accounting for the largest median family size of 7.8 persons per family. On the other hand, married-couple families (43 | 50.0%) represent the smallest median family size with 2.37 persons per family.
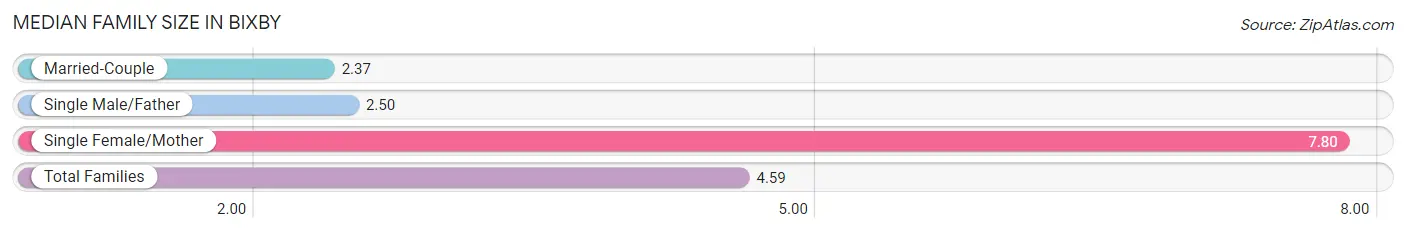
| Family Type | # Families | Family Size |
| Married-Couple | 43 (50.0%) | 2.37 |
| Single Male/Father | 8 (9.3%) | 2.50 |
| Single Female/Mother | 35 (40.7%) | 7.80 |
| Total Families | 86 (100.0%) | 4.59 |
Median Household Size in Bixby
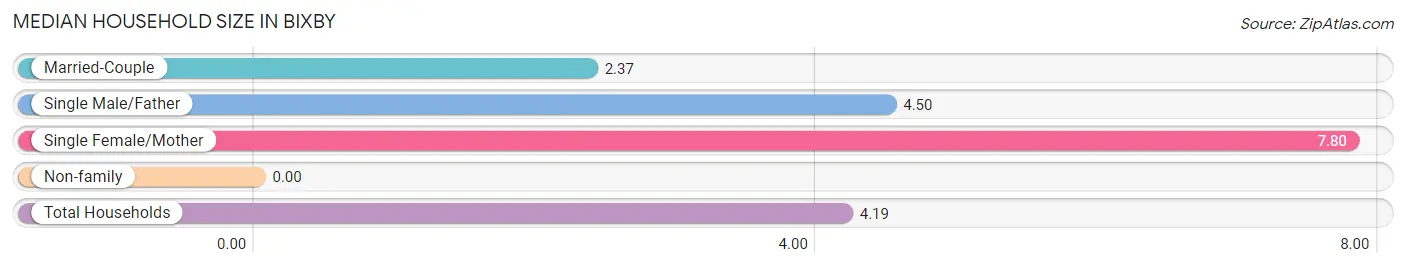
| Household Type | # Households | Household Size |
| Married-Couple | 43 (42.2%) | 2.37 |
| Single Male/Father | 8 (7.8%) | 4.50 |
| Single Female/Mother | 35 (34.3%) | 7.80 |
| Non-family | 16 (15.7%) | - |
| Total Households | 102 (100.0%) | 4.19 |
Household Size by Marriage Status in Bixby
Out of a total of 102 households in Bixby, 86 (84.3%) are family households, while 16 (15.7%) are nonfamily households. The most numerous type of family households are 2-person households, comprising 31, and the most common type of nonfamily households are 1-person households, comprising 16.
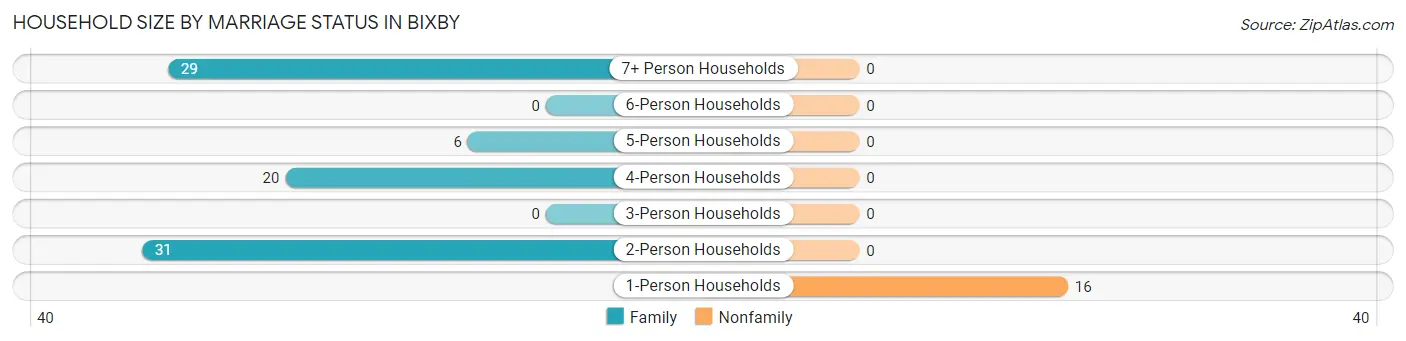
| Household Size | Family Households | Nonfamily Households |
| 1-Person Households | - | 16 (15.7%) |
| 2-Person Households | 31 (30.4%) | 0 (0.0%) |
| 3-Person Households | 0 (0.0%) | 0 (0.0%) |
| 4-Person Households | 20 (19.6%) | 0 (0.0%) |
| 5-Person Households | 6 (5.9%) | 0 (0.0%) |
| 6-Person Households | 0 (0.0%) | 0 (0.0%) |
| 7+ Person Households | 29 (28.4%) | 0 (0.0%) |
| Total | 86 (84.3%) | 16 (15.7%) |
Female Fertility in Bixby
Fertility by Age in Bixby
Average fertility rate in Bixby is 405.0 births per 1,000 women. Women in the age bracket of 20 to 34 years have the highest fertility rate with 804.0 births per 1,000 women. Women in the age bracket of 20 to 34 years acount for 100.0% of all women with births.
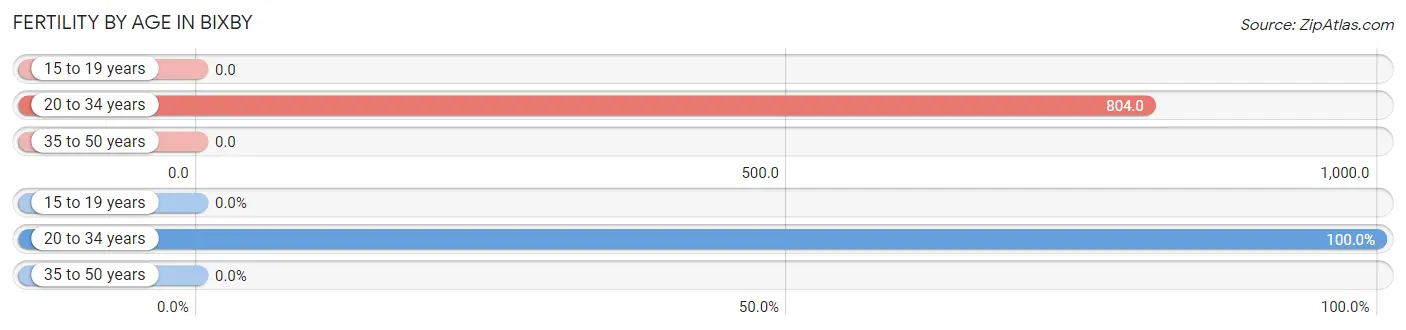
| Age Bracket | Women with Births | Births / 1,000 Women |
| 15 to 19 years | 0 (0.0%) | 0.0 |
| 20 to 34 years | 45 (100.0%) | 804.0 |
| 35 to 50 years | 0 (0.0%) | 0.0 |
| Total | 45 (100.0%) | 405.0 |
Fertility by Age by Marriage Status in Bixby
13.3% of women with births (45) in Bixby are married. The highest percentage of unmarried women with births falls into 20 to 34 years age bracket with 86.7% of them unmarried at the time of birth, while the lowest percentage of unmarried women with births belong to 20 to 34 years age bracket with 86.7% of them unmarried.
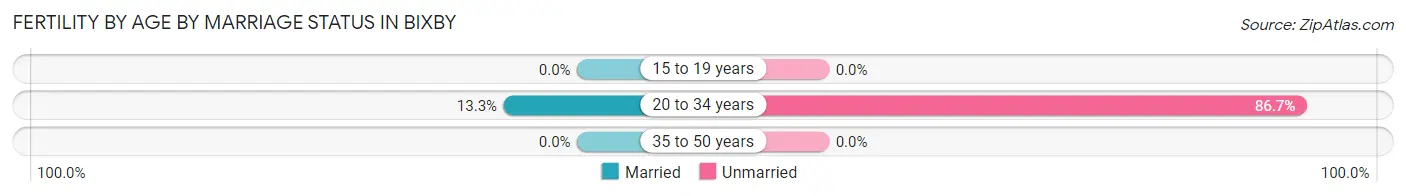
| Age Bracket | Married | Unmarried |
| 15 to 19 years | 0 (0.0%) | 0 (0.0%) |
| 20 to 34 years | 6 (13.3%) | 39 (86.7%) |
| 35 to 50 years | 0 (0.0%) | 0 (0.0%) |
| Total | 6 (13.3%) | 39 (86.7%) |
Fertility by Education in Bixby
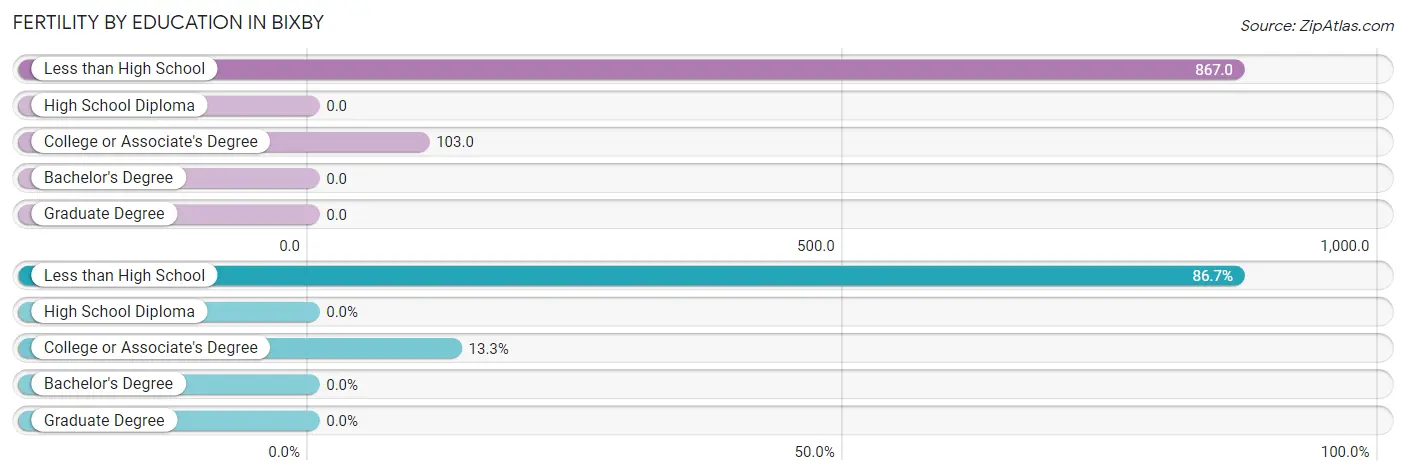
| Educational Attainment | Women with Births | Births / 1,000 Women |
| Less than High School | 39 (86.7%) | 867.0 |
| High School Diploma | 0 (0.0%) | 0.0 |
| College or Associate's Degree | 6 (13.3%) | 103.0 |
| Bachelor's Degree | 0 (0.0%) | 0.0 |
| Graduate Degree | 0 (0.0%) | 0.0 |
| Total | 45 (100.0%) | 405.0 |
Fertility by Education by Marriage Status in Bixby
86.7% of women with births in Bixby are unmarried. Women with the educational attainment of college or associate's degree are most likely to be married with 100.0% of them married at childbirth, while women with the educational attainment of less than high school are least likely to be married with 100.0% of them unmarried at childbirth.
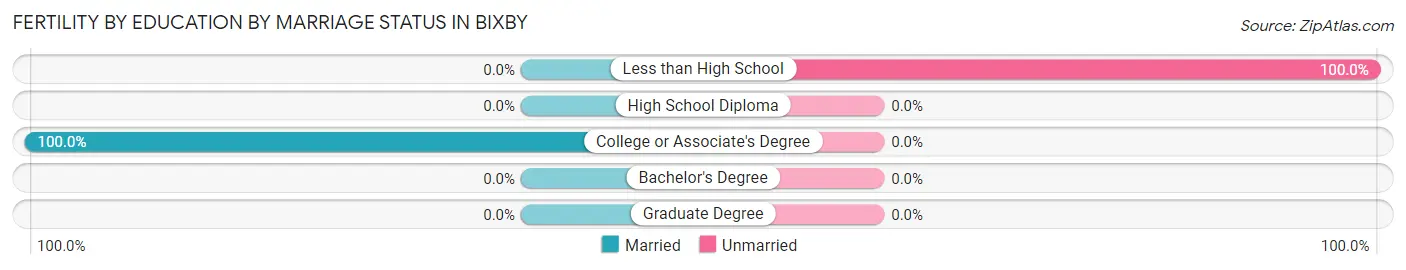
| Educational Attainment | Married | Unmarried |
| Less than High School | 0 (0.0%) | 39 (100.0%) |
| High School Diploma | 0 (0.0%) | 0 (0.0%) |
| College or Associate's Degree | 6 (100.0%) | 0 (0.0%) |
| Bachelor's Degree | 0 (0.0%) | 0 (0.0%) |
| Graduate Degree | 0 (0.0%) | 0 (0.0%) |
| Total | 6 (13.3%) | 39 (86.7%) |
Employment Characteristics in Bixby
Employment by Class of Employer in Bixby
Among the 133 employed individuals in Bixby, private company employees (72 | 54.1%), local government employees (20 | 15.0%), and federal government employees (20 | 15.0%) make up the most common classes of employment.
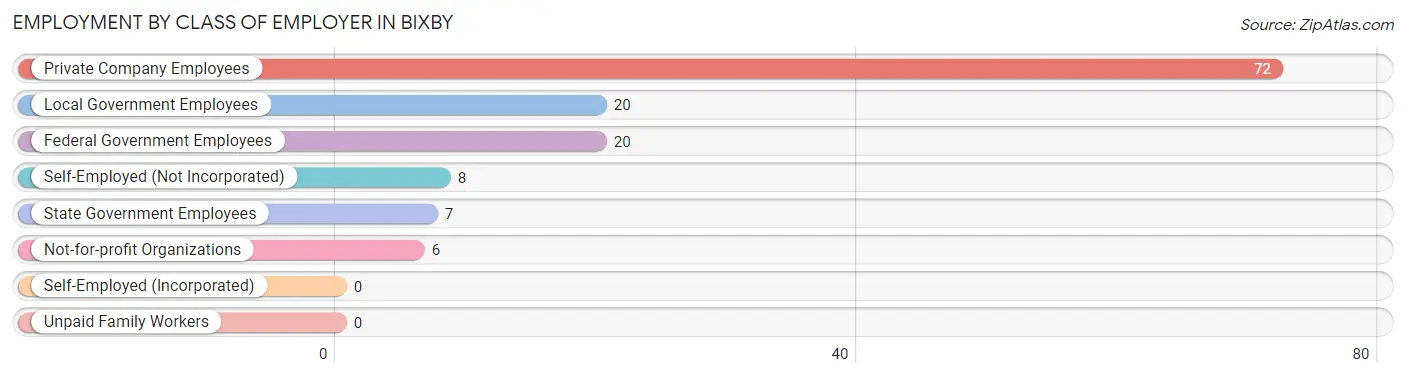
| Employer Class | # Employees | % Employees |
| Private Company Employees | 72 | 54.1% |
| Self-Employed (Incorporated) | 0 | 0.0% |
| Self-Employed (Not Incorporated) | 8 | 6.0% |
| Not-for-profit Organizations | 6 | 4.5% |
| Local Government Employees | 20 | 15.0% |
| State Government Employees | 7 | 5.3% |
| Federal Government Employees | 20 | 15.0% |
| Unpaid Family Workers | 0 | 0.0% |
| Total | 133 | 100.0% |
Employment Status by Age in Bixby
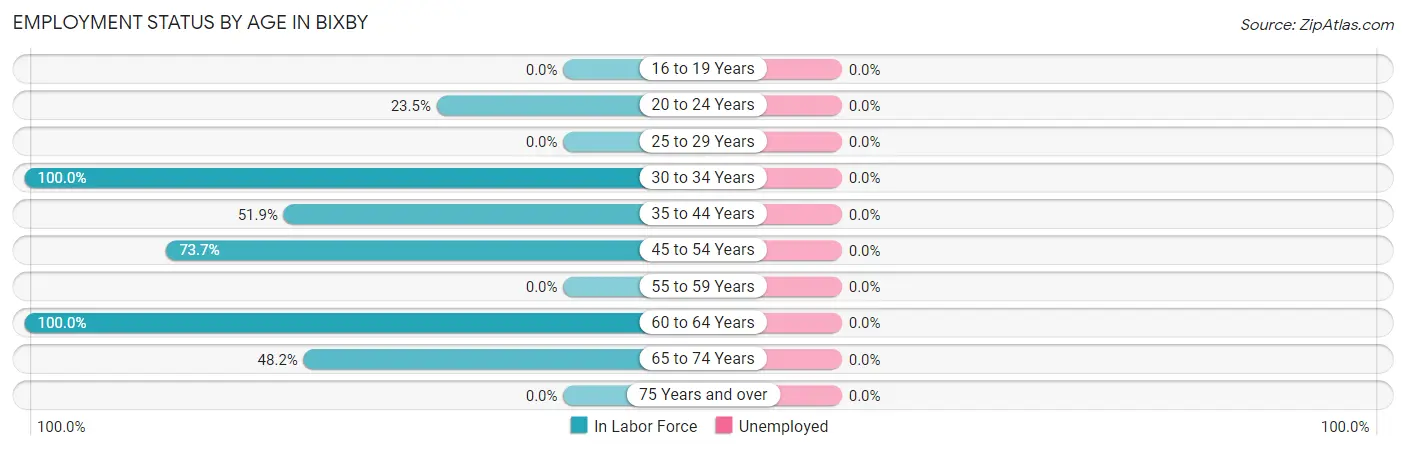
| Age Bracket | In Labor Force | Unemployed |
| 16 to 19 Years | 0 (0.0%) | 0 (0.0%) |
| 20 to 24 Years | 12 (23.5%) | 0 (0.0%) |
| 25 to 29 Years | 0 (0.0%) | 0 (0.0%) |
| 30 to 34 Years | 17 (100.0%) | 0 (0.0%) |
| 35 to 44 Years | 42 (51.9%) | 0 (0.0%) |
| 45 to 54 Years | 28 (73.7%) | 0 (0.0%) |
| 55 to 59 Years | 0 (0.0%) | 0 (0.0%) |
| 60 to 64 Years | 7 (100.0%) | 0 (0.0%) |
| 65 to 74 Years | 27 (48.2%) | 0 (0.0%) |
| 75 Years and over | 0 (0.0%) | 0 (0.0%) |
| Total | 133 (44.6%) | 0 (0.0%) |
Employment Status by Educational Attainment in Bixby
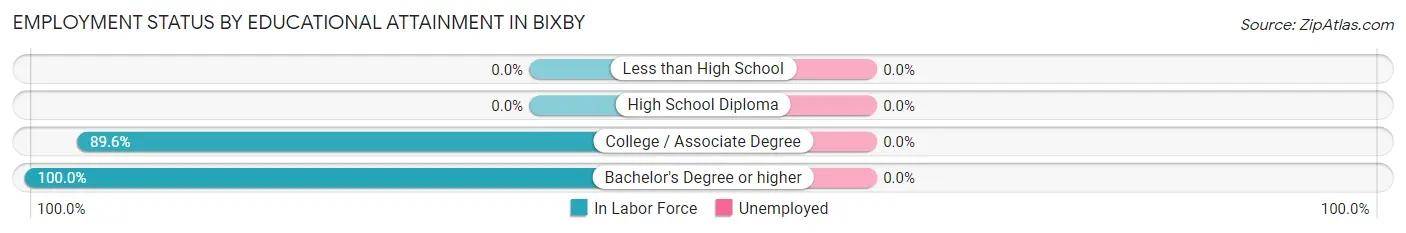
| Educational Attainment | In Labor Force | Unemployed |
| Less than High School | 0 (0.0%) | 0 (0.0%) |
| High School Diploma | 0 (0.0%) | 0 (0.0%) |
| College / Associate Degree | 86 (89.6%) | 0 (0.0%) |
| Bachelor's Degree or higher | 8 (100.0%) | 0 (0.0%) |
| Total | 94 (59.1%) | 0 (0.0%) |
Employment Occupations by Sex in Bixby
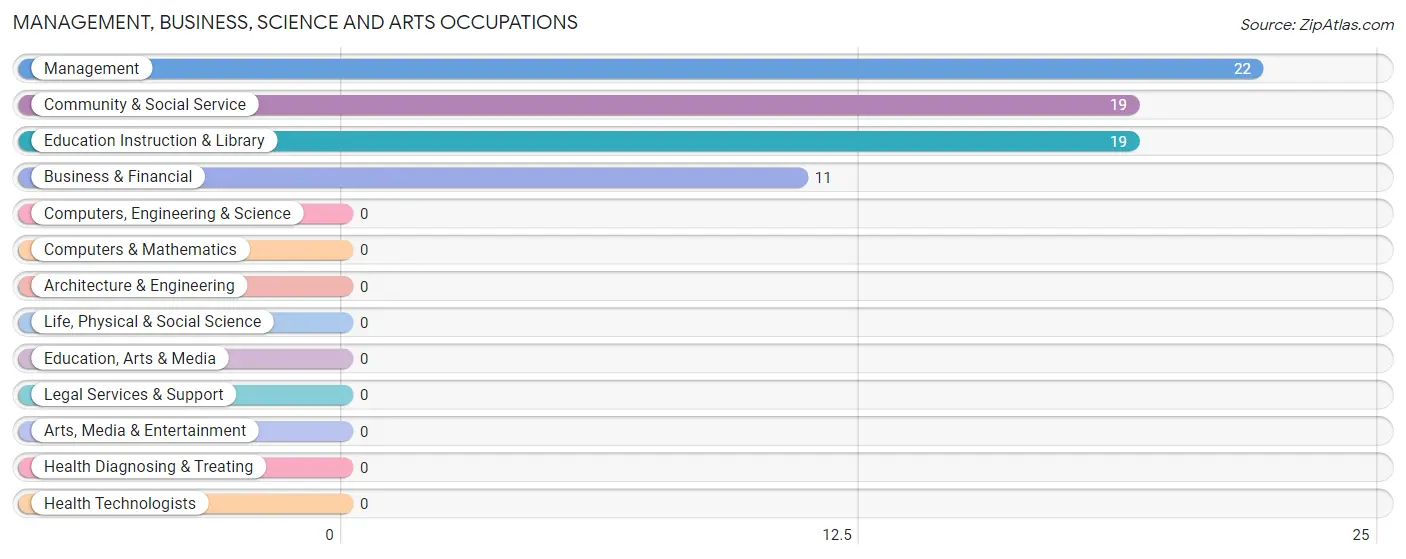
Management, Business, Science and Arts Occupations
The most common Management, Business, Science and Arts occupations in Bixby are Management (22 | 16.5%), Community & Social Service (19 | 14.3%), Education Instruction & Library (19 | 14.3%), and Business & Financial (11 | 8.3%).
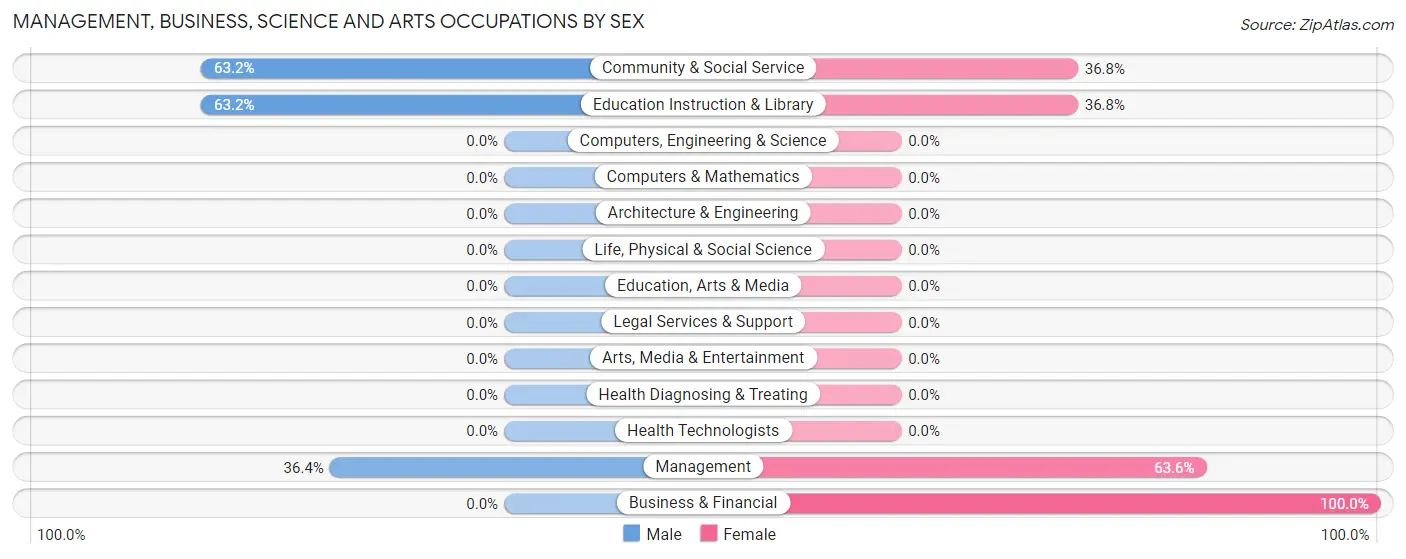
Management, Business, Science and Arts Occupations by Sex
Within the Management, Business, Science and Arts occupations in Bixby, the most male-oriented occupations are Community & Social Service (63.2%), Education Instruction & Library (63.2%), and Management (36.4%), while the most female-oriented occupations are Business & Financial (100.0%), Management (63.6%), and Community & Social Service (36.8%).
| Occupation | Male | Female |
| Management | 8 (36.4%) | 14 (63.6%) |
| Business & Financial | 0 (0.0%) | 11 (100.0%) |
| Computers, Engineering & Science | 0 (0.0%) | 0 (0.0%) |
| Computers & Mathematics | 0 (0.0%) | 0 (0.0%) |
| Architecture & Engineering | 0 (0.0%) | 0 (0.0%) |
| Life, Physical & Social Science | 0 (0.0%) | 0 (0.0%) |
| Community & Social Service | 12 (63.2%) | 7 (36.8%) |
| Education, Arts & Media | 0 (0.0%) | 0 (0.0%) |
| Legal Services & Support | 0 (0.0%) | 0 (0.0%) |
| Education Instruction & Library | 12 (63.2%) | 7 (36.8%) |
| Arts, Media & Entertainment | 0 (0.0%) | 0 (0.0%) |
| Health Diagnosing & Treating | 0 (0.0%) | 0 (0.0%) |
| Health Technologists | 0 (0.0%) | 0 (0.0%) |
| Total (Category) | 20 (38.5%) | 32 (61.5%) |
| Total (Overall) | 63 (47.4%) | 70 (52.6%) |
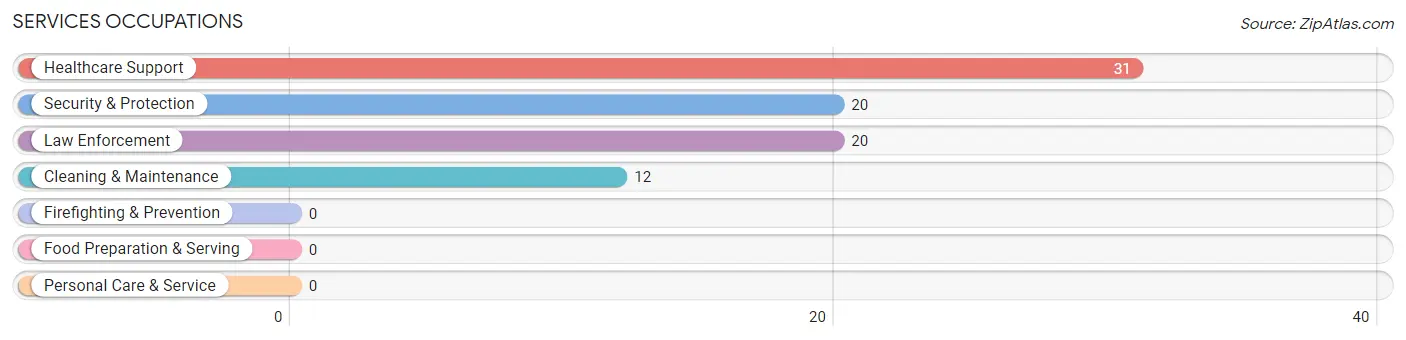
Services Occupations
The most common Services occupations in Bixby are Healthcare Support (31 | 23.3%), Security & Protection (20 | 15.0%), Law Enforcement (20 | 15.0%), and Cleaning & Maintenance (12 | 9.0%).
Services Occupations by Sex
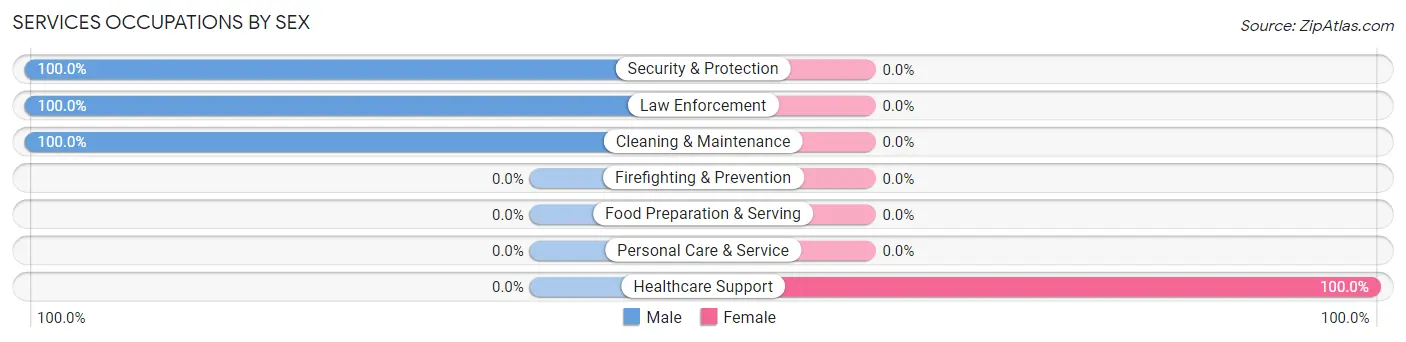
| Occupation | Male | Female |
| Healthcare Support | 0 (0.0%) | 31 (100.0%) |
| Security & Protection | 20 (100.0%) | 0 (0.0%) |
| Firefighting & Prevention | 0 (0.0%) | 0 (0.0%) |
| Law Enforcement | 20 (100.0%) | 0 (0.0%) |
| Food Preparation & Serving | 0 (0.0%) | 0 (0.0%) |
| Cleaning & Maintenance | 12 (100.0%) | 0 (0.0%) |
| Personal Care & Service | 0 (0.0%) | 0 (0.0%) |
| Total (Category) | 32 (50.8%) | 31 (49.2%) |
| Total (Overall) | 63 (47.4%) | 70 (52.6%) |
Sales and Office Occupations

Sales and Office Occupations by Sex
| Occupation | Male | Female |
| Sales & Related | 0 (0.0%) | 0 (0.0%) |
| Office & Administration | 0 (0.0%) | 0 (0.0%) |
| Total (Category) | 0 (0.0%) | 0 (0.0%) |
| Total (Overall) | 63 (47.4%) | 70 (52.6%) |
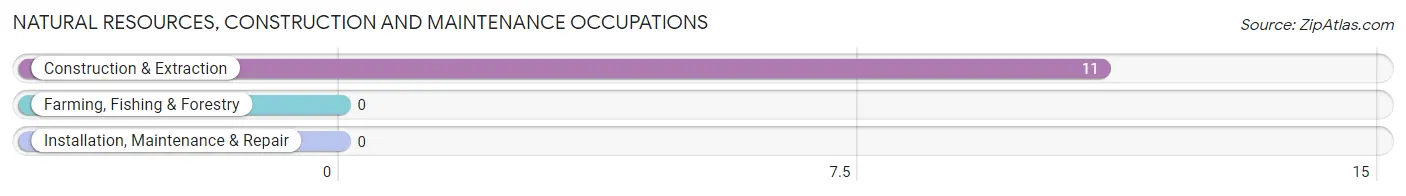
Natural Resources, Construction and Maintenance Occupations
The most common Natural Resources, Construction and Maintenance occupations in Bixby are , and Construction & Extraction (11 | 8.3%).
Natural Resources, Construction and Maintenance Occupations by Sex
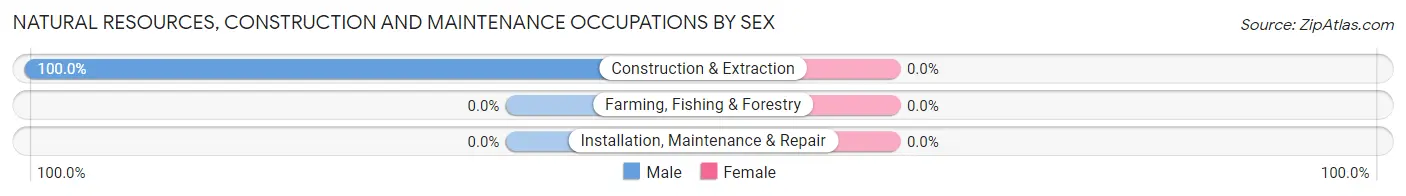
| Occupation | Male | Female |
| Farming, Fishing & Forestry | 0 (0.0%) | 0 (0.0%) |
| Construction & Extraction | 11 (100.0%) | 0 (0.0%) |
| Installation, Maintenance & Repair | 0 (0.0%) | 0 (0.0%) |
| Total (Category) | 11 (100.0%) | 0 (0.0%) |
| Total (Overall) | 63 (47.4%) | 70 (52.6%) |
Production, Transportation and Moving Occupations
The most common Production, Transportation and Moving occupations in Bixby are , and Material Moving (7 | 5.3%).
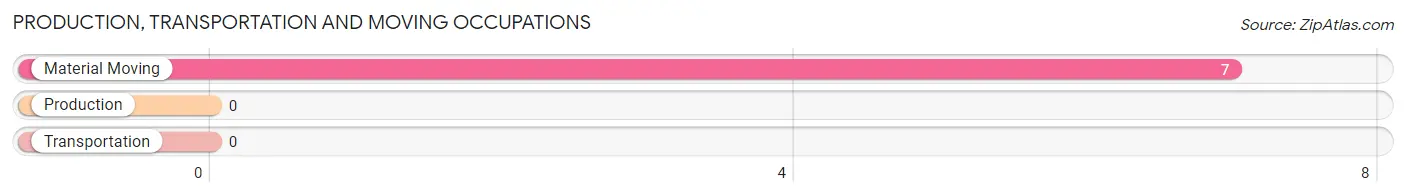
Production, Transportation and Moving Occupations by Sex
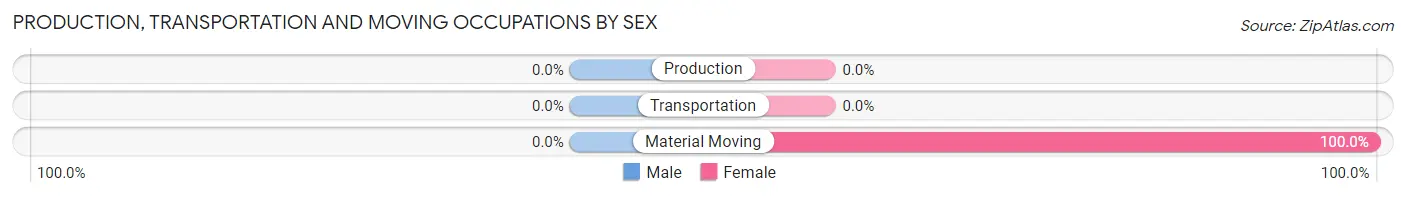
| Occupation | Male | Female |
| Production | 0 (0.0%) | 0 (0.0%) |
| Transportation | 0 (0.0%) | 0 (0.0%) |
| Material Moving | 0 (0.0%) | 7 (100.0%) |
| Total (Category) | 0 (0.0%) | 7 (100.0%) |
| Total (Overall) | 63 (47.4%) | 70 (52.6%) |
Employment Industries by Sex in Bixby
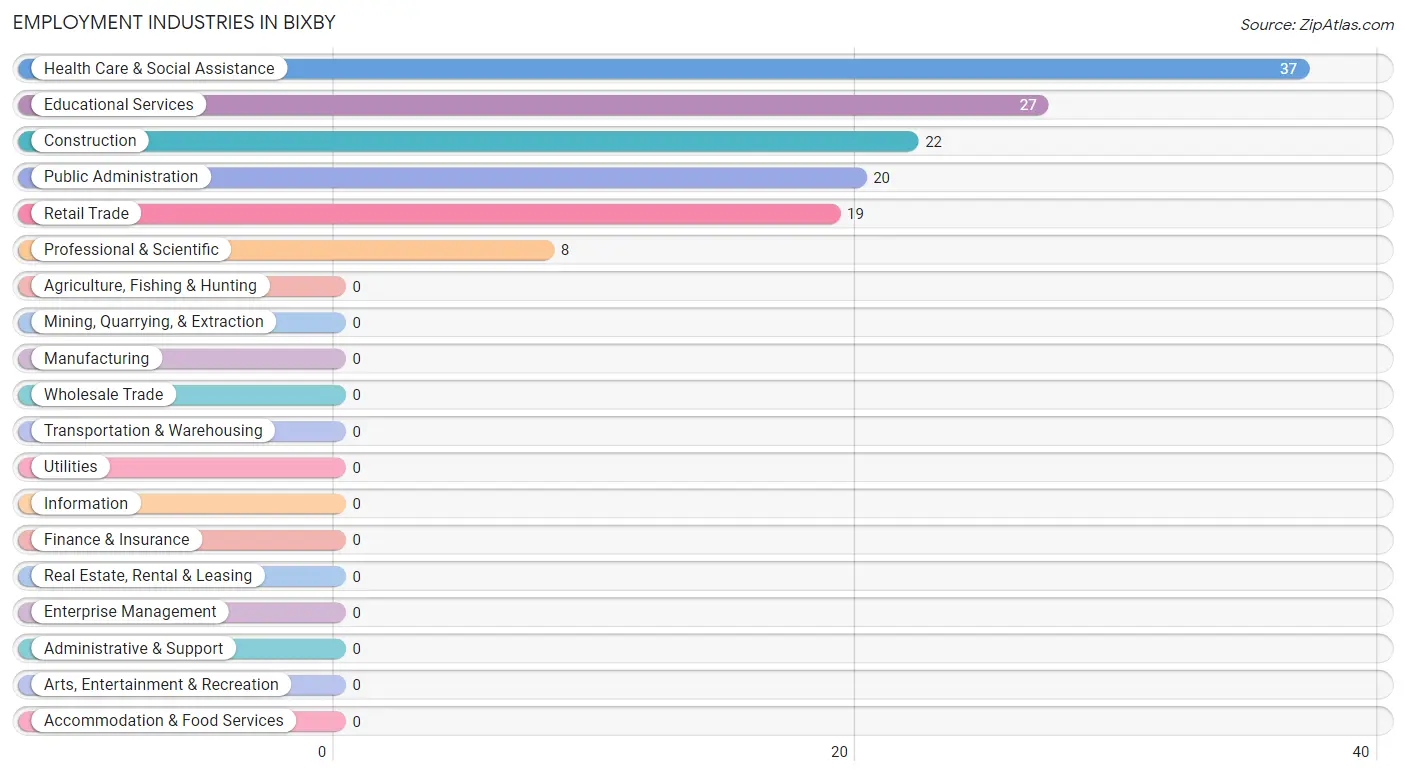
Employment Industries in Bixby
The major employment industries in Bixby include Health Care & Social Assistance (37 | 27.8%), Educational Services (27 | 20.3%), Construction (22 | 16.5%), Public Administration (20 | 15.0%), and Retail Trade (19 | 14.3%).
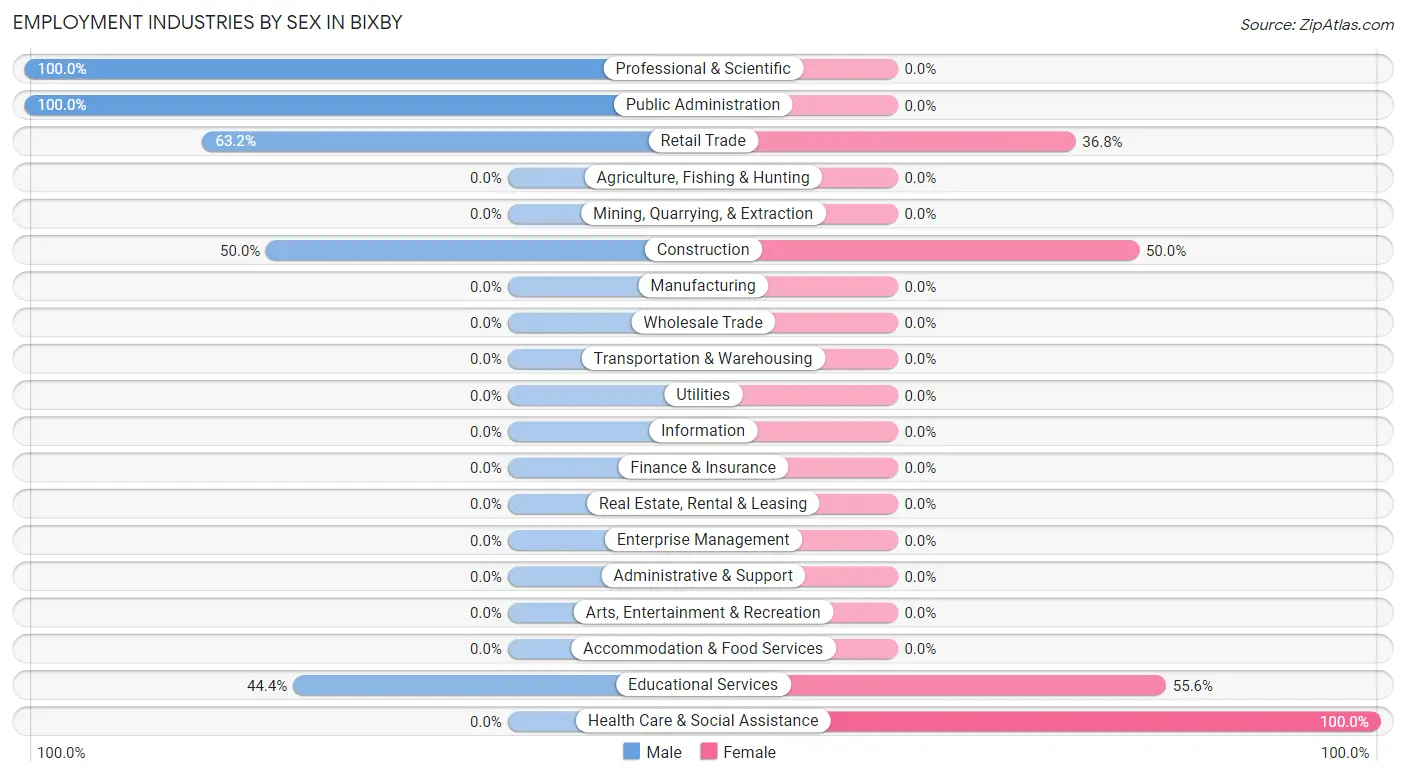
Employment Industries by Sex in Bixby
The Bixby industries that see more men than women are Professional & Scientific (100.0%), Public Administration (100.0%), and Retail Trade (63.2%), whereas the industries that tend to have a higher number of women are Health Care & Social Assistance (100.0%), Educational Services (55.6%), and Construction (50.0%).
| Industry | Male | Female |
| Agriculture, Fishing & Hunting | 0 (0.0%) | 0 (0.0%) |
| Mining, Quarrying, & Extraction | 0 (0.0%) | 0 (0.0%) |
| Construction | 11 (50.0%) | 11 (50.0%) |
| Manufacturing | 0 (0.0%) | 0 (0.0%) |
| Wholesale Trade | 0 (0.0%) | 0 (0.0%) |
| Retail Trade | 12 (63.2%) | 7 (36.8%) |
| Transportation & Warehousing | 0 (0.0%) | 0 (0.0%) |
| Utilities | 0 (0.0%) | 0 (0.0%) |
| Information | 0 (0.0%) | 0 (0.0%) |
| Finance & Insurance | 0 (0.0%) | 0 (0.0%) |
| Real Estate, Rental & Leasing | 0 (0.0%) | 0 (0.0%) |
| Professional & Scientific | 8 (100.0%) | 0 (0.0%) |
| Enterprise Management | 0 (0.0%) | 0 (0.0%) |
| Administrative & Support | 0 (0.0%) | 0 (0.0%) |
| Educational Services | 12 (44.4%) | 15 (55.6%) |
| Health Care & Social Assistance | 0 (0.0%) | 37 (100.0%) |
| Arts, Entertainment & Recreation | 0 (0.0%) | 0 (0.0%) |
| Accommodation & Food Services | 0 (0.0%) | 0 (0.0%) |
| Public Administration | 20 (100.0%) | 0 (0.0%) |
| Total | 63 (47.4%) | 70 (52.6%) |
Education in Bixby
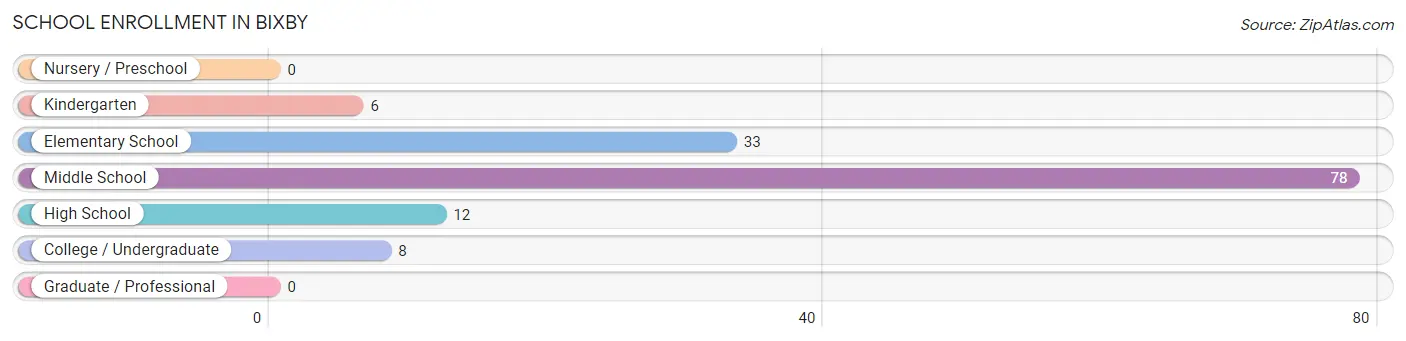
School Enrollment in Bixby
The most common levels of schooling among the 137 students in Bixby are middle school (78 | 56.9%), elementary school (33 | 24.1%), and high school (12 | 8.8%).
| School Level | # Students | % Students |
| Nursery / Preschool | 0 | 0.0% |
| Kindergarten | 6 | 4.4% |
| Elementary School | 33 | 24.1% |
| Middle School | 78 | 56.9% |
| High School | 12 | 8.8% |
| College / Undergraduate | 8 | 5.8% |
| Graduate / Professional | 0 | 0.0% |
| Total | 137 | 100.0% |
School Enrollment by Age by Funding Source in Bixby
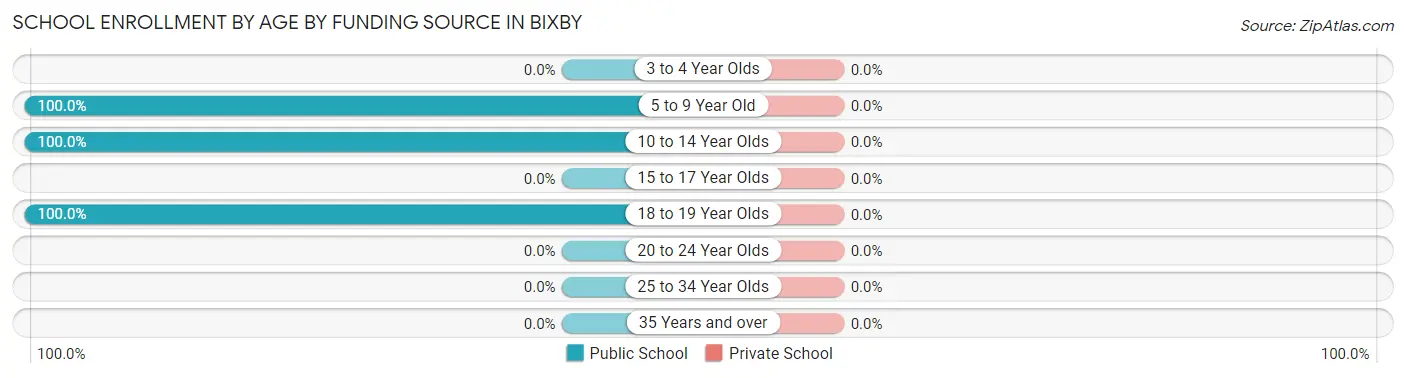
| Age Bracket | Public School | Private School |
| 3 to 4 Year Olds | 0 (0.0%) | 0 (0.0%) |
| 5 to 9 Year Old | 39 (100.0%) | 0 (0.0%) |
| 10 to 14 Year Olds | 78 (100.0%) | 0 (0.0%) |
| 15 to 17 Year Olds | 0 (0.0%) | 0 (0.0%) |
| 18 to 19 Year Olds | 20 (100.0%) | 0 (0.0%) |
| 20 to 24 Year Olds | 0 (0.0%) | 0 (0.0%) |
| 25 to 34 Year Olds | 0 (0.0%) | 0 (0.0%) |
| 35 Years and over | 0 (0.0%) | 0 (0.0%) |
| Total | 137 (100.0%) | 0 (0.0%) |
Educational Attainment by Field of Study in Bixby
Education (15 | 39.5%), bio, nature & agricultural (8 | 21.0%), physical & health sciences (8 | 21.0%), and business (7 | 18.4%) are the most common fields of study among 38 individuals in Bixby who have obtained a bachelor's degree or higher.
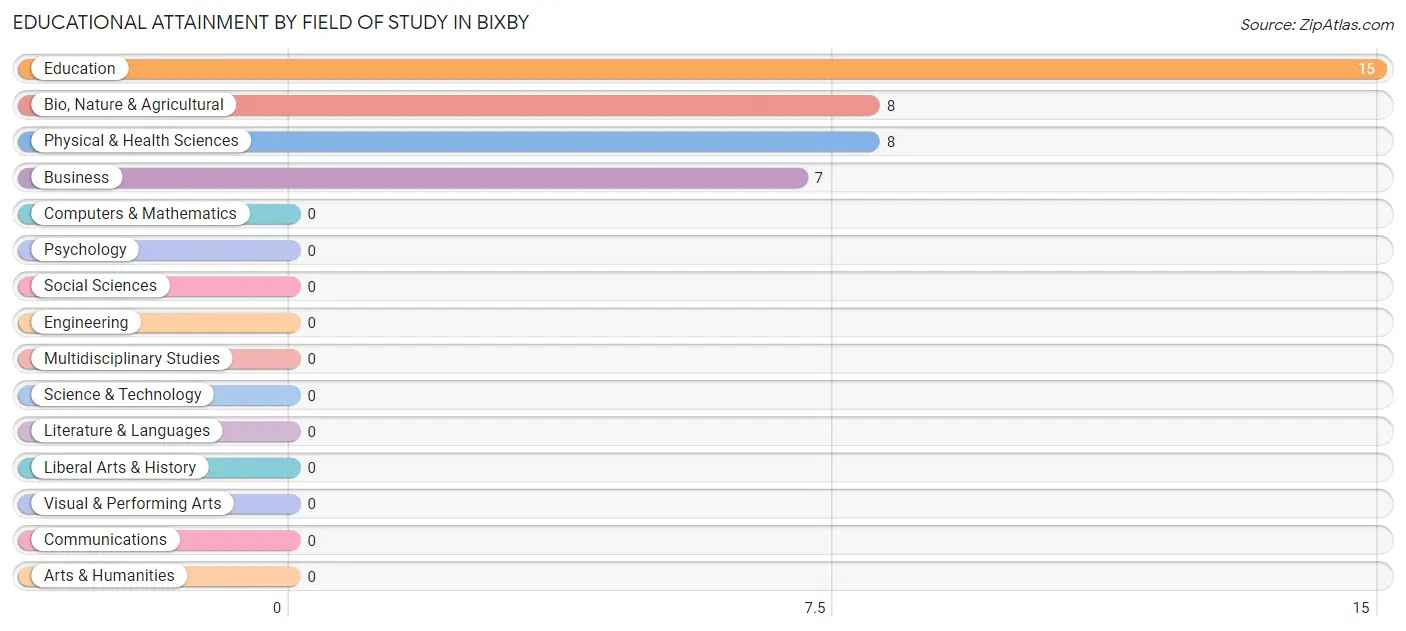
| Field of Study | # Graduates | % Graduates |
| Computers & Mathematics | 0 | 0.0% |
| Bio, Nature & Agricultural | 8 | 21.0% |
| Physical & Health Sciences | 8 | 21.0% |
| Psychology | 0 | 0.0% |
| Social Sciences | 0 | 0.0% |
| Engineering | 0 | 0.0% |
| Multidisciplinary Studies | 0 | 0.0% |
| Science & Technology | 0 | 0.0% |
| Business | 7 | 18.4% |
| Education | 15 | 39.5% |
| Literature & Languages | 0 | 0.0% |
| Liberal Arts & History | 0 | 0.0% |
| Visual & Performing Arts | 0 | 0.0% |
| Communications | 0 | 0.0% |
| Arts & Humanities | 0 | 0.0% |
| Total | 38 | 100.0% |
Transportation & Commute in Bixby
Vehicle Availability by Sex in Bixby
The most prevalent vehicle ownership categories in Bixby are males with 3 vehicles (39, accounting for 61.9%) and females with 3 vehicles (57, making up 55.7%).
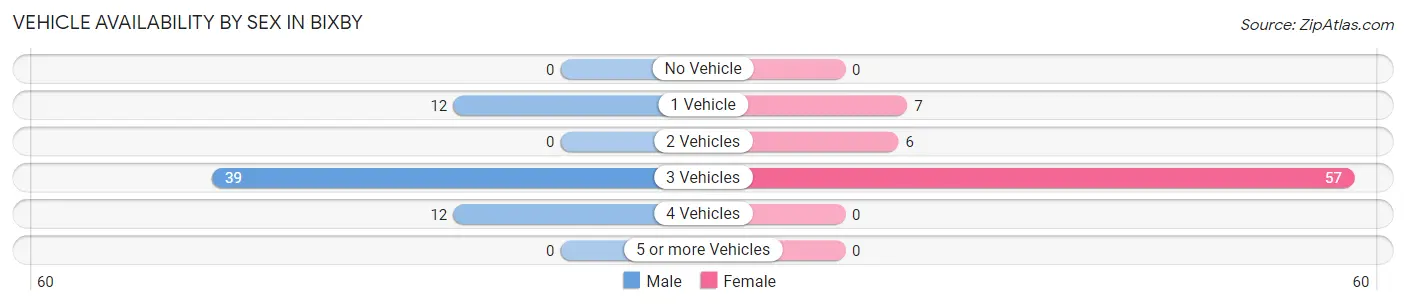
| Vehicles Available | Male | Female |
| No Vehicle | 0 (0.0%) | 0 (0.0%) |
| 1 Vehicle | 12 (19.1%) | 7 (10.0%) |
| 2 Vehicles | 0 (0.0%) | 6 (8.6%) |
| 3 Vehicles | 39 (61.9%) | 57 (81.4%) |
| 4 Vehicles | 12 (19.1%) | 0 (0.0%) |
| 5 or more Vehicles | 0 (0.0%) | 0 (0.0%) |
| Total | 63 (100.0%) | 70 (100.0%) |
Commute Time in Bixby
The most frequently occuring commute durations in Bixby are 5 to 9 minutes (51 commuters, 41.8%), 35 to 39 minutes (20 commuters, 16.4%), and 25 to 29 minutes (19 commuters, 15.6%).
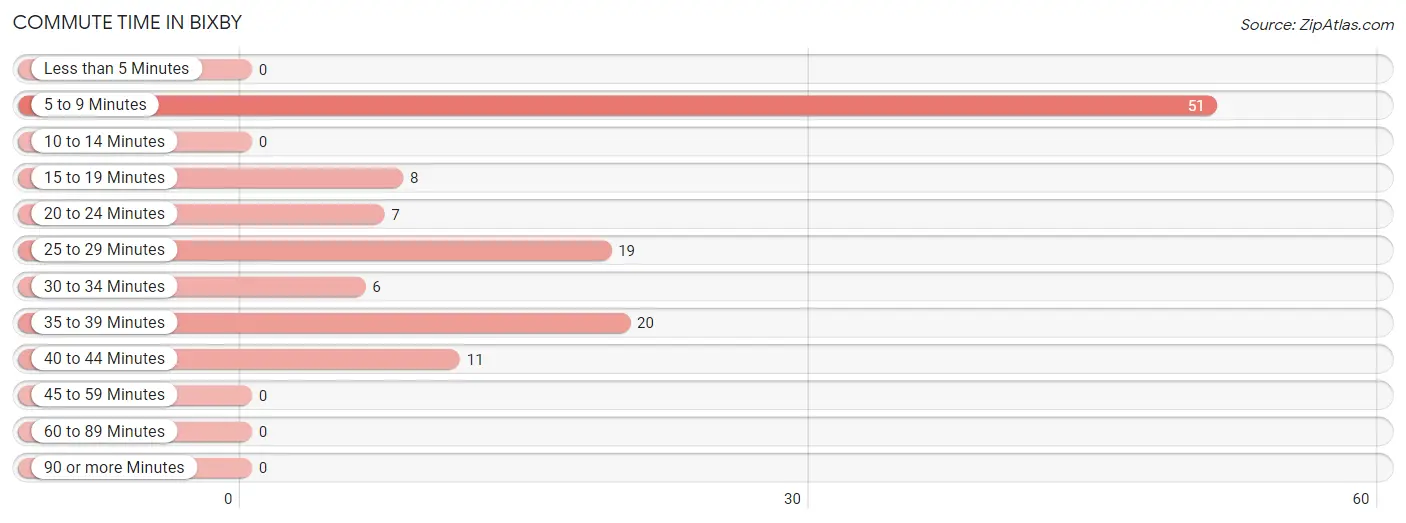
| Commute Time | # Commuters | % Commuters |
| Less than 5 Minutes | 0 | 0.0% |
| 5 to 9 Minutes | 51 | 41.8% |
| 10 to 14 Minutes | 0 | 0.0% |
| 15 to 19 Minutes | 8 | 6.6% |
| 20 to 24 Minutes | 7 | 5.7% |
| 25 to 29 Minutes | 19 | 15.6% |
| 30 to 34 Minutes | 6 | 4.9% |
| 35 to 39 Minutes | 20 | 16.4% |
| 40 to 44 Minutes | 11 | 9.0% |
| 45 to 59 Minutes | 0 | 0.0% |
| 60 to 89 Minutes | 0 | 0.0% |
| 90 or more Minutes | 0 | 0.0% |
Commute Time by Sex in Bixby
The most common commute times in Bixby are 35 to 39 minutes (20 commuters, 38.5%) for males and 5 to 9 minutes (39 commuters, 55.7%) for females.
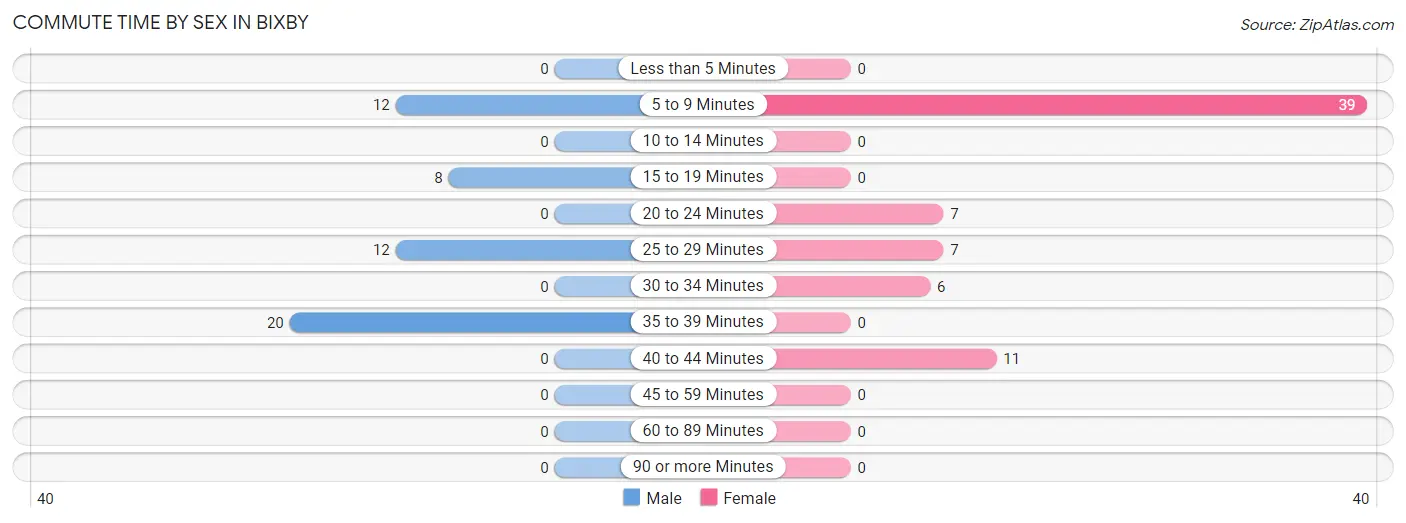
| Commute Time | Male | Female |
| Less than 5 Minutes | 0 (0.0%) | 0 (0.0%) |
| 5 to 9 Minutes | 12 (23.1%) | 39 (55.7%) |
| 10 to 14 Minutes | 0 (0.0%) | 0 (0.0%) |
| 15 to 19 Minutes | 8 (15.4%) | 0 (0.0%) |
| 20 to 24 Minutes | 0 (0.0%) | 7 (10.0%) |
| 25 to 29 Minutes | 12 (23.1%) | 7 (10.0%) |
| 30 to 34 Minutes | 0 (0.0%) | 6 (8.6%) |
| 35 to 39 Minutes | 20 (38.5%) | 0 (0.0%) |
| 40 to 44 Minutes | 0 (0.0%) | 11 (15.7%) |
| 45 to 59 Minutes | 0 (0.0%) | 0 (0.0%) |
| 60 to 89 Minutes | 0 (0.0%) | 0 (0.0%) |
| 90 or more Minutes | 0 (0.0%) | 0 (0.0%) |
Time of Departure to Work by Sex in Bixby
The most frequent times of departure to work in Bixby are 7:00 AM to 7:29 AM (20, 38.5%) for males and 7:00 AM to 7:29 AM (38, 54.3%) for females.
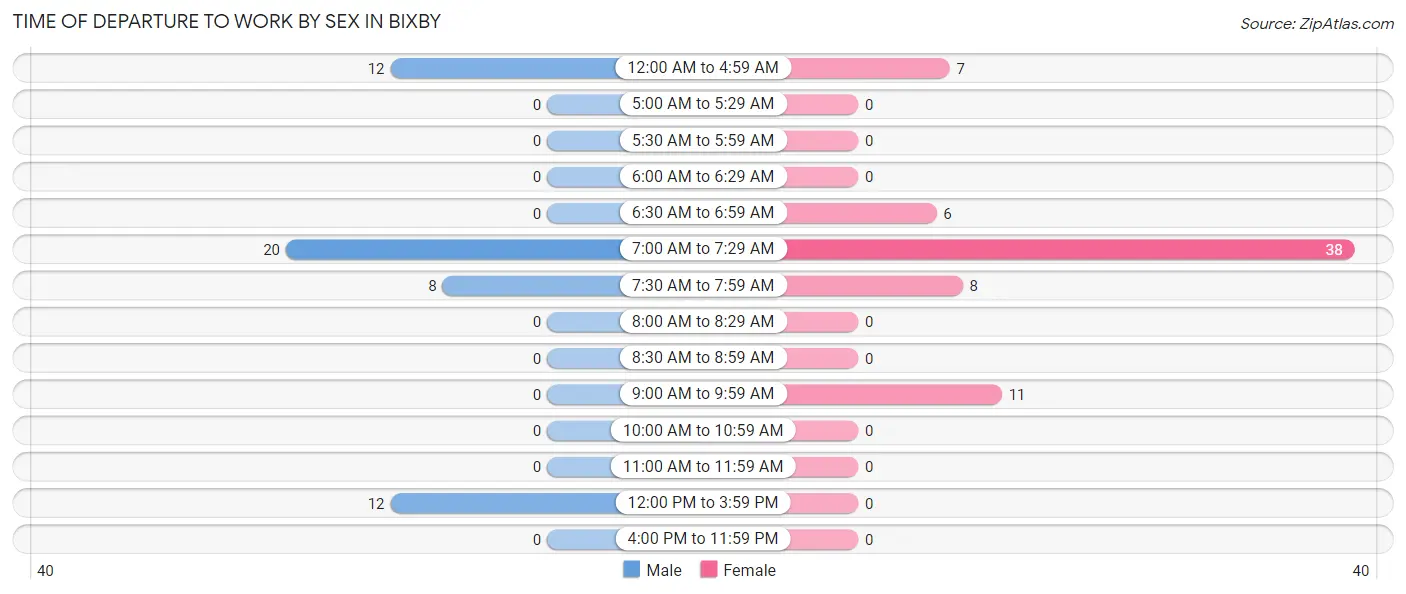
| Time of Departure | Male | Female |
| 12:00 AM to 4:59 AM | 12 (23.1%) | 7 (10.0%) |
| 5:00 AM to 5:29 AM | 0 (0.0%) | 0 (0.0%) |
| 5:30 AM to 5:59 AM | 0 (0.0%) | 0 (0.0%) |
| 6:00 AM to 6:29 AM | 0 (0.0%) | 0 (0.0%) |
| 6:30 AM to 6:59 AM | 0 (0.0%) | 6 (8.6%) |
| 7:00 AM to 7:29 AM | 20 (38.5%) | 38 (54.3%) |
| 7:30 AM to 7:59 AM | 8 (15.4%) | 8 (11.4%) |
| 8:00 AM to 8:29 AM | 0 (0.0%) | 0 (0.0%) |
| 8:30 AM to 8:59 AM | 0 (0.0%) | 0 (0.0%) |
| 9:00 AM to 9:59 AM | 0 (0.0%) | 11 (15.7%) |
| 10:00 AM to 10:59 AM | 0 (0.0%) | 0 (0.0%) |
| 11:00 AM to 11:59 AM | 0 (0.0%) | 0 (0.0%) |
| 12:00 PM to 3:59 PM | 12 (23.1%) | 0 (0.0%) |
| 4:00 PM to 11:59 PM | 0 (0.0%) | 0 (0.0%) |
| Total | 52 (100.0%) | 70 (100.0%) |
Housing Occupancy in Bixby
Occupancy by Ownership in Bixby
Of the total 102 dwellings in Bixby, owner-occupied units account for 86 (84.3%), while renter-occupied units make up 16 (15.7%).
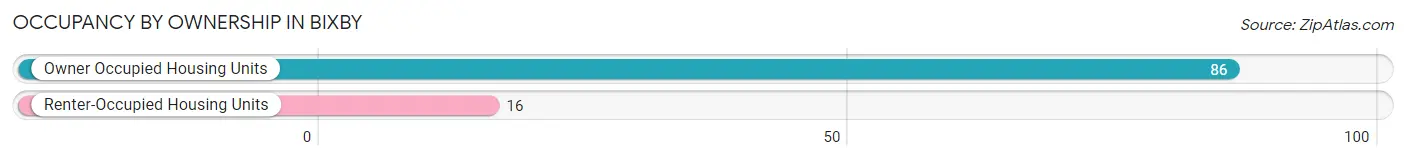
| Occupancy | # Housing Units | % Housing Units |
| Owner Occupied Housing Units | 86 | 84.3% |
| Renter-Occupied Housing Units | 16 | 15.7% |
| Total Occupied Housing Units | 102 | 100.0% |
Occupancy by Household Size in Bixby
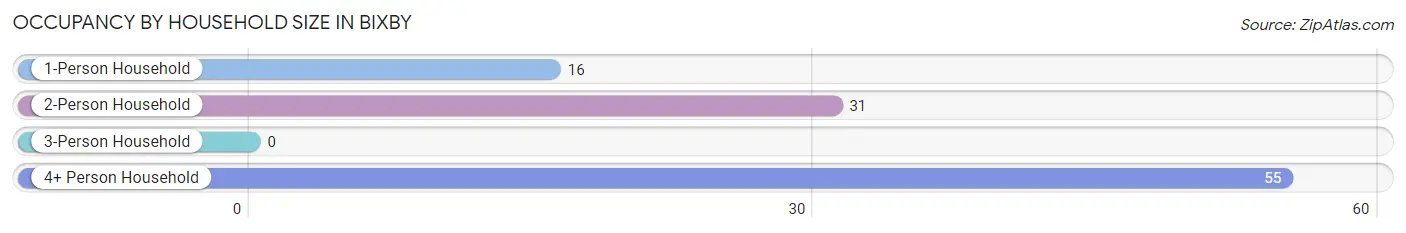
| Household Size | # Housing Units | % Housing Units |
| 1-Person Household | 16 | 15.7% |
| 2-Person Household | 31 | 30.4% |
| 3-Person Household | 0 | 0.0% |
| 4+ Person Household | 55 | 53.9% |
| Total Housing Units | 102 | 100.0% |
Occupancy by Ownership by Household Size in Bixby
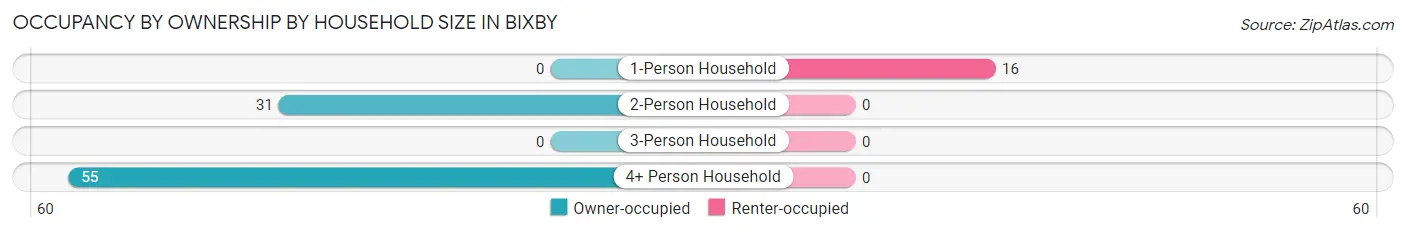
| Household Size | Owner-occupied | Renter-occupied |
| 1-Person Household | 0 (0.0%) | 16 (100.0%) |
| 2-Person Household | 31 (100.0%) | 0 (0.0%) |
| 3-Person Household | 0 (0.0%) | 0 (0.0%) |
| 4+ Person Household | 55 (100.0%) | 0 (0.0%) |
| Total Housing Units | 86 (84.3%) | 16 (15.7%) |
Occupancy by Educational Attainment in Bixby
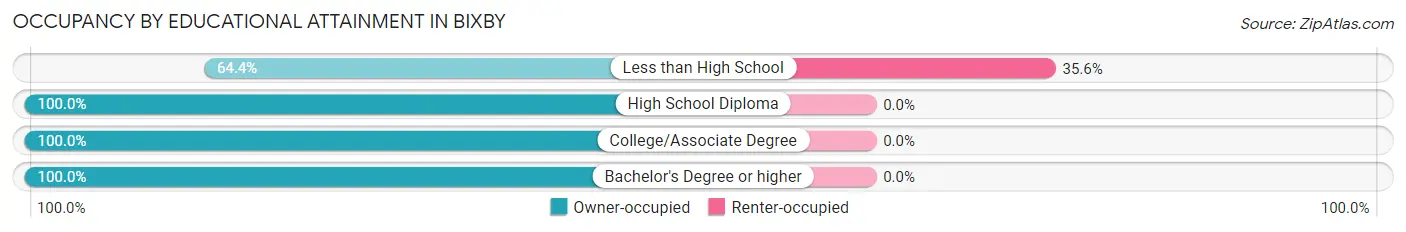
| Household Size | Owner-occupied | Renter-occupied |
| Less than High School | 29 (64.4%) | 16 (35.6%) |
| High School Diploma | 12 (100.0%) | 0 (0.0%) |
| College/Associate Degree | 37 (100.0%) | 0 (0.0%) |
| Bachelor's Degree or higher | 8 (100.0%) | 0 (0.0%) |
Occupancy by Age of Householder in Bixby
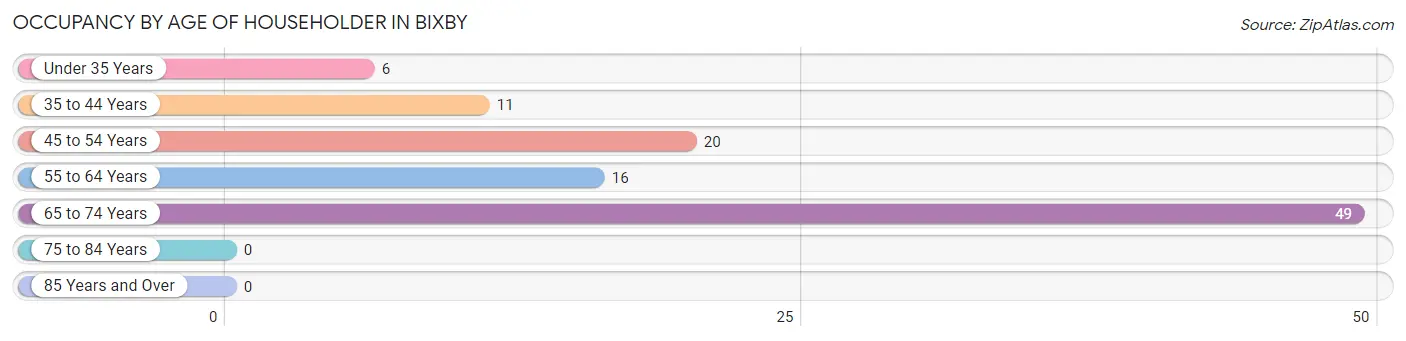
| Age Bracket | # Households | % Households |
| Under 35 Years | 6 | 5.9% |
| 35 to 44 Years | 11 | 10.8% |
| 45 to 54 Years | 20 | 19.6% |
| 55 to 64 Years | 16 | 15.7% |
| 65 to 74 Years | 49 | 48.0% |
| 75 to 84 Years | 0 | 0.0% |
| 85 Years and Over | 0 | 0.0% |
| Total | 102 | 100.0% |
Housing Finances in Bixby
Median Income by Occupancy in Bixby
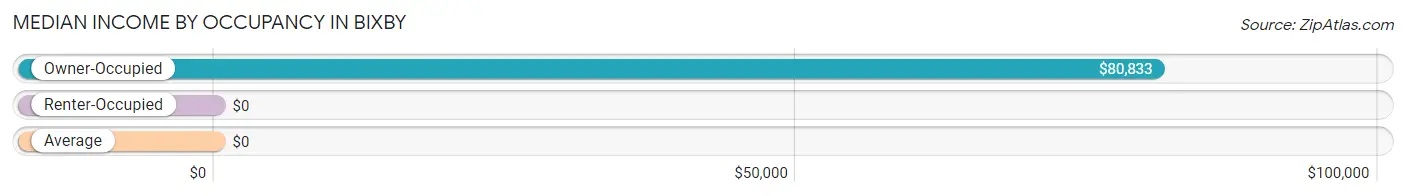
| Occupancy Type | # Households | Median Income |
| Owner-Occupied | 86 (84.3%) | $80,833 |
| Renter-Occupied | 16 (15.7%) | $0 |
| Average | 102 (100.0%) | $0 |
Occupancy by Householder Income Bracket in Bixby
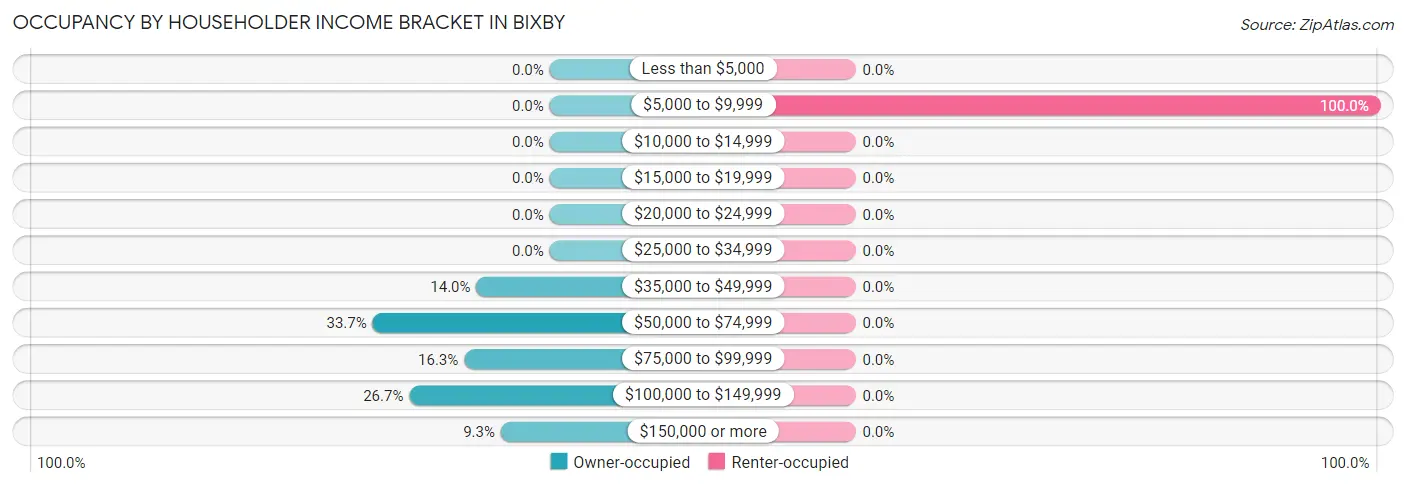
| Income Bracket | Owner-occupied | Renter-occupied |
| Less than $5,000 | 0 (0.0%) | 0 (0.0%) |
| $5,000 to $9,999 | 0 (0.0%) | 16 (100.0%) |
| $10,000 to $14,999 | 0 (0.0%) | 0 (0.0%) |
| $15,000 to $19,999 | 0 (0.0%) | 0 (0.0%) |
| $20,000 to $24,999 | 0 (0.0%) | 0 (0.0%) |
| $25,000 to $34,999 | 0 (0.0%) | 0 (0.0%) |
| $35,000 to $49,999 | 12 (14.0%) | 0 (0.0%) |
| $50,000 to $74,999 | 29 (33.7%) | 0 (0.0%) |
| $75,000 to $99,999 | 14 (16.3%) | 0 (0.0%) |
| $100,000 to $149,999 | 23 (26.7%) | 0 (0.0%) |
| $150,000 or more | 8 (9.3%) | 0 (0.0%) |
| Total | 86 (100.0%) | 16 (100.0%) |
Monthly Housing Cost Tiers in Bixby
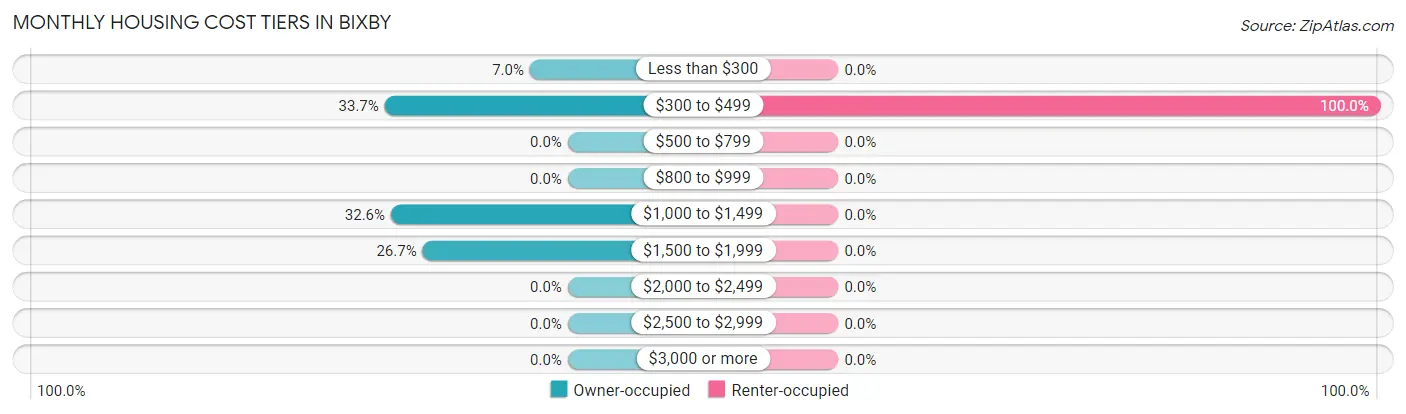
| Monthly Cost | Owner-occupied | Renter-occupied |
| Less than $300 | 6 (7.0%) | 0 (0.0%) |
| $300 to $499 | 29 (33.7%) | 16 (100.0%) |
| $500 to $799 | 0 (0.0%) | 0 (0.0%) |
| $800 to $999 | 0 (0.0%) | 0 (0.0%) |
| $1,000 to $1,499 | 28 (32.6%) | 0 (0.0%) |
| $1,500 to $1,999 | 23 (26.7%) | 0 (0.0%) |
| $2,000 to $2,499 | 0 (0.0%) | 0 (0.0%) |
| $2,500 to $2,999 | 0 (0.0%) | 0 (0.0%) |
| $3,000 or more | 0 (0.0%) | 0 (0.0%) |
| Total | 86 (100.0%) | 16 (100.0%) |
Physical Housing Characteristics in Bixby
Housing Structures in Bixby
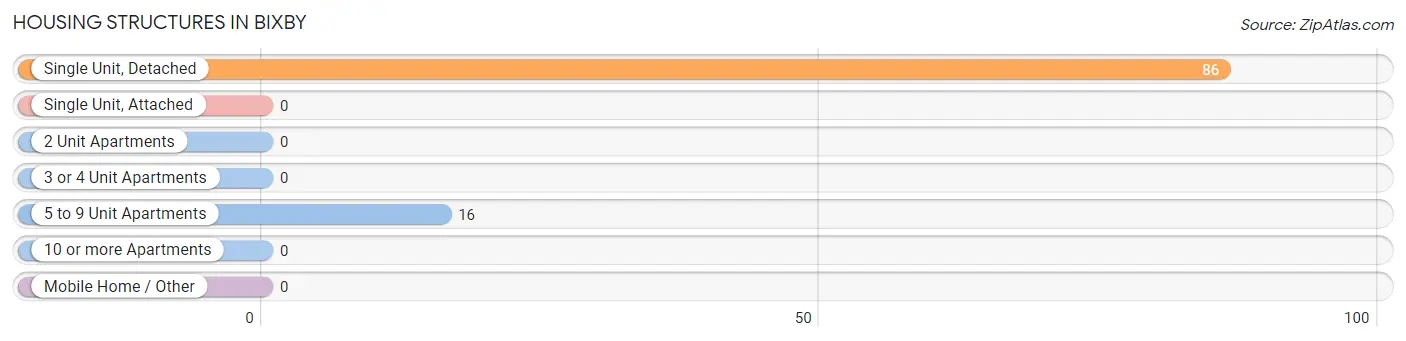
| Structure Type | # Housing Units | % Housing Units |
| Single Unit, Detached | 86 | 84.3% |
| Single Unit, Attached | 0 | 0.0% |
| 2 Unit Apartments | 0 | 0.0% |
| 3 or 4 Unit Apartments | 0 | 0.0% |
| 5 to 9 Unit Apartments | 16 | 15.7% |
| 10 or more Apartments | 0 | 0.0% |
| Mobile Home / Other | 0 | 0.0% |
| Total | 102 | 100.0% |
Housing Structures by Occupancy in Bixby
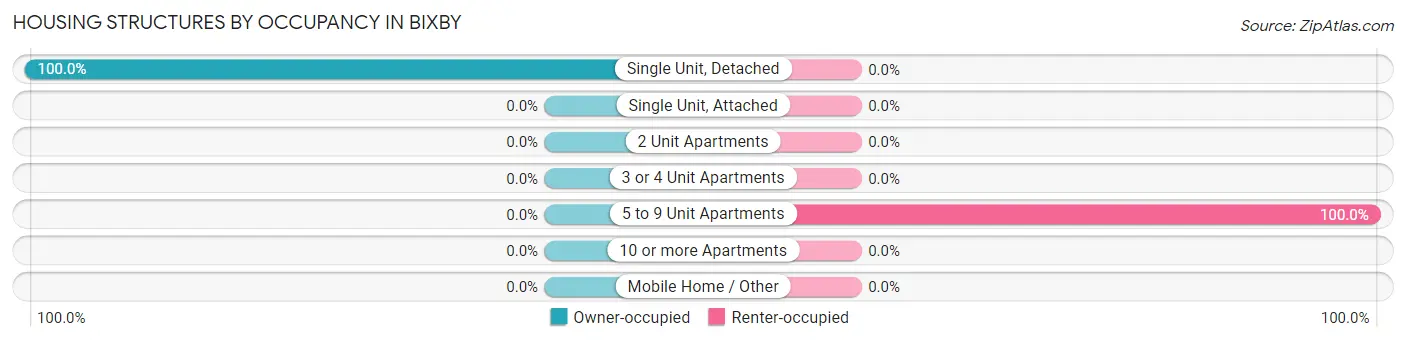
| Structure Type | Owner-occupied | Renter-occupied |
| Single Unit, Detached | 86 (100.0%) | 0 (0.0%) |
| Single Unit, Attached | 0 (0.0%) | 0 (0.0%) |
| 2 Unit Apartments | 0 (0.0%) | 0 (0.0%) |
| 3 or 4 Unit Apartments | 0 (0.0%) | 0 (0.0%) |
| 5 to 9 Unit Apartments | 0 (0.0%) | 16 (100.0%) |
| 10 or more Apartments | 0 (0.0%) | 0 (0.0%) |
| Mobile Home / Other | 0 (0.0%) | 0 (0.0%) |
| Total | 86 (84.3%) | 16 (15.7%) |
Housing Structures by Number of Rooms in Bixby
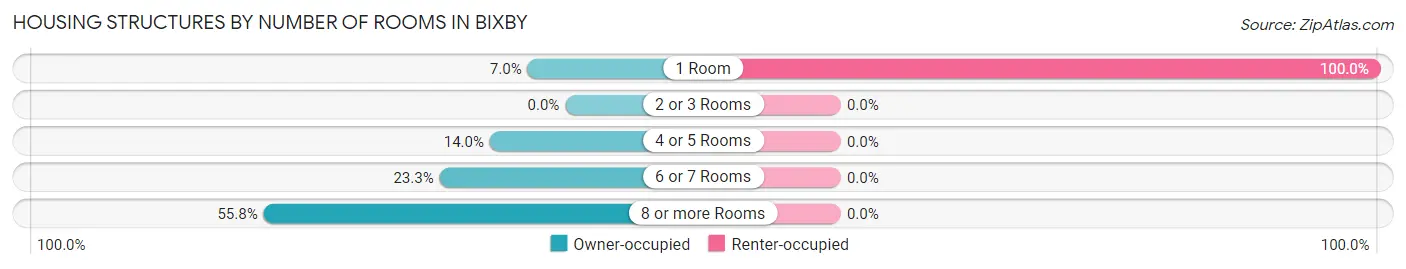
| Number of Rooms | Owner-occupied | Renter-occupied |
| 1 Room | 6 (7.0%) | 16 (100.0%) |
| 2 or 3 Rooms | 0 (0.0%) | 0 (0.0%) |
| 4 or 5 Rooms | 12 (14.0%) | 0 (0.0%) |
| 6 or 7 Rooms | 20 (23.3%) | 0 (0.0%) |
| 8 or more Rooms | 48 (55.8%) | 0 (0.0%) |
| Total | 86 (100.0%) | 16 (100.0%) |
Housing Structure by Heating Type in Bixby
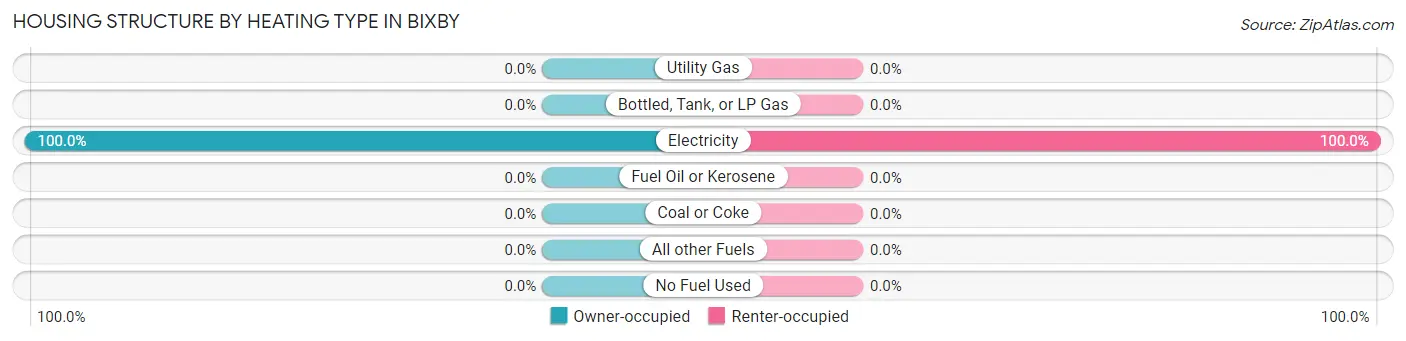
| Heating Type | Owner-occupied | Renter-occupied |
| Utility Gas | 0 (0.0%) | 0 (0.0%) |
| Bottled, Tank, or LP Gas | 0 (0.0%) | 0 (0.0%) |
| Electricity | 86 (100.0%) | 16 (100.0%) |
| Fuel Oil or Kerosene | 0 (0.0%) | 0 (0.0%) |
| Coal or Coke | 0 (0.0%) | 0 (0.0%) |
| All other Fuels | 0 (0.0%) | 0 (0.0%) |
| No Fuel Used | 0 (0.0%) | 0 (0.0%) |
| Total | 86 (100.0%) | 16 (100.0%) |
Household Vehicle Usage in Bixby
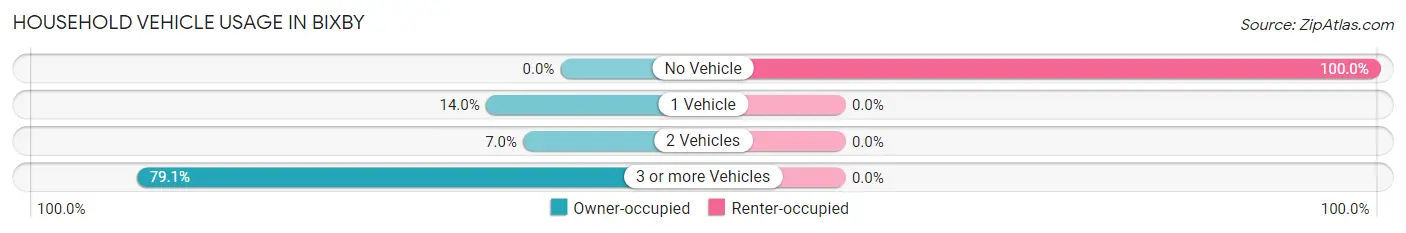
| Vehicles per Household | Owner-occupied | Renter-occupied |
| No Vehicle | 0 (0.0%) | 16 (100.0%) |
| 1 Vehicle | 12 (14.0%) | 0 (0.0%) |
| 2 Vehicles | 6 (7.0%) | 0 (0.0%) |
| 3 or more Vehicles | 68 (79.1%) | 0 (0.0%) |
| Total | 86 (100.0%) | 16 (100.0%) |
Real Estate & Mortgages in Bixby
Real Estate and Mortgage Overview in Bixby
| Characteristic | Without Mortgage | With Mortgage |
| Housing Units | 35 | 51 |
| Median Property Value | - | - |
| Median Household Income | - | - |
| Monthly Housing Costs | - | - |
| Real Estate Taxes | - | - |
Property Value by Mortgage Status in Bixby
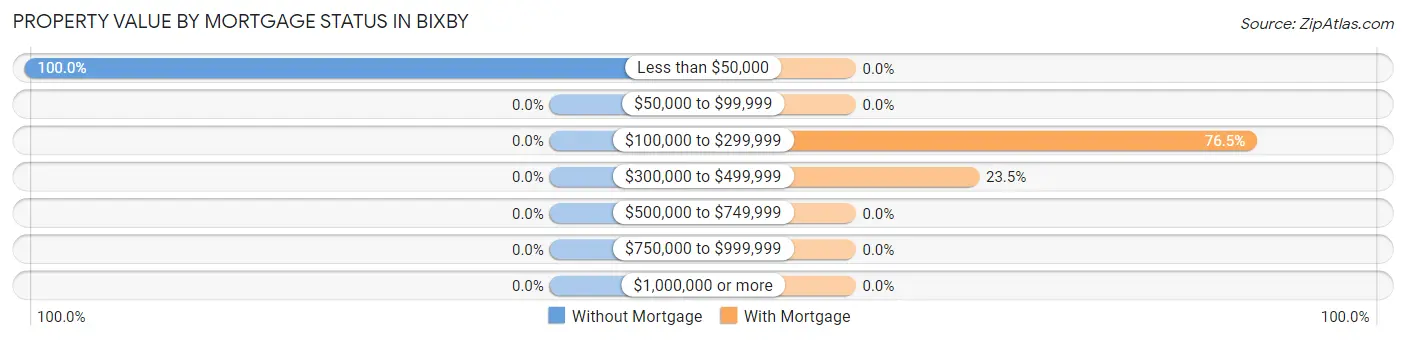
| Property Value | Without Mortgage | With Mortgage |
| Less than $50,000 | 35 (100.0%) | 0 (0.0%) |
| $50,000 to $99,999 | 0 (0.0%) | 0 (0.0%) |
| $100,000 to $299,999 | 0 (0.0%) | 39 (76.5%) |
| $300,000 to $499,999 | 0 (0.0%) | 12 (23.5%) |
| $500,000 to $749,999 | 0 (0.0%) | 0 (0.0%) |
| $750,000 to $999,999 | 0 (0.0%) | 0 (0.0%) |
| $1,000,000 or more | 0 (0.0%) | 0 (0.0%) |
| Total | 35 (100.0%) | 51 (100.0%) |
Household Income by Mortgage Status in Bixby
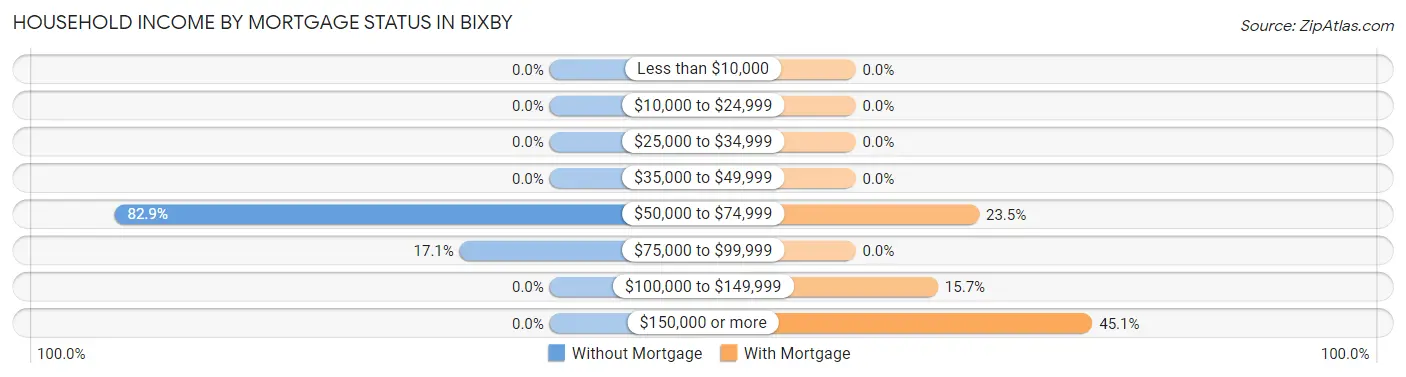
| Household Income | Without Mortgage | With Mortgage |
| Less than $10,000 | 0 (0.0%) | 0 (0.0%) |
| $10,000 to $24,999 | 0 (0.0%) | 0 (0.0%) |
| $25,000 to $34,999 | 0 (0.0%) | 0 (0.0%) |
| $35,000 to $49,999 | 0 (0.0%) | 0 (0.0%) |
| $50,000 to $74,999 | 29 (82.9%) | 12 (23.5%) |
| $75,000 to $99,999 | 6 (17.1%) | 0 (0.0%) |
| $100,000 to $149,999 | 0 (0.0%) | 8 (15.7%) |
| $150,000 or more | 0 (0.0%) | 23 (45.1%) |
| Total | 35 (100.0%) | 51 (100.0%) |
Property Value to Household Income Ratio in Bixby
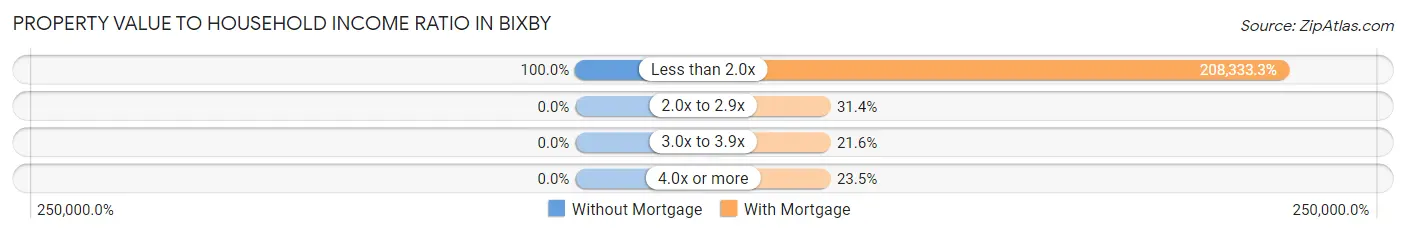
| Value-to-Income Ratio | Without Mortgage | With Mortgage |
| Less than 2.0x | 35 (100.0%) | 106,250 (208,333.3%) |
| 2.0x to 2.9x | 0 (0.0%) | 16 (31.4%) |
| 3.0x to 3.9x | 0 (0.0%) | 11 (21.6%) |
| 4.0x or more | 0 (0.0%) | 12 (23.5%) |
| Total | 35 (100.0%) | 51 (100.0%) |
Real Estate Taxes by Mortgage Status in Bixby
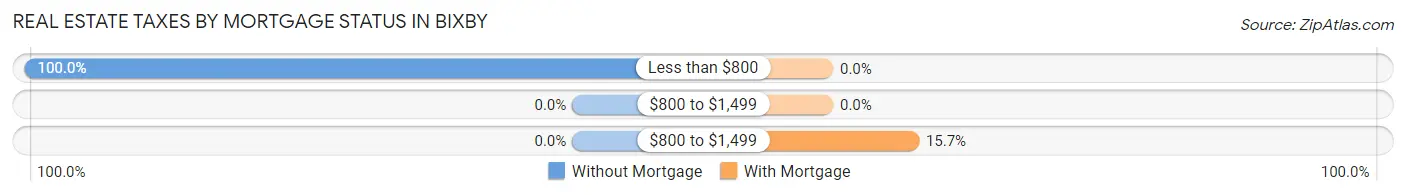
| Property Taxes | Without Mortgage | With Mortgage |
| Less than $800 | 35 (100.0%) | 0 (0.0%) |
| $800 to $1,499 | 0 (0.0%) | 0 (0.0%) |
| $800 to $1,499 | 0 (0.0%) | 8 (15.7%) |
| Total | 35 (100.0%) | 51 (100.0%) |
Health & Disability in Bixby
Health Insurance Coverage by Age in Bixby
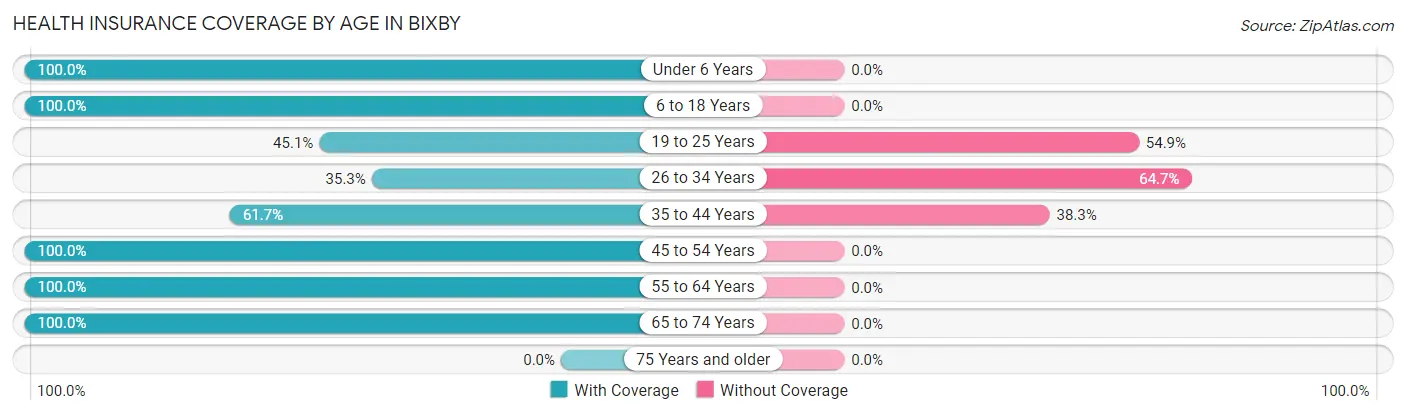
| Age Bracket | With Coverage | Without Coverage |
| Under 6 Years | 12 (100.0%) | 0 (0.0%) |
| 6 to 18 Years | 129 (100.0%) | 0 (0.0%) |
| 19 to 25 Years | 32 (45.1%) | 39 (54.9%) |
| 26 to 34 Years | 6 (35.3%) | 11 (64.7%) |
| 35 to 44 Years | 50 (61.7%) | 31 (38.3%) |
| 45 to 54 Years | 38 (100.0%) | 0 (0.0%) |
| 55 to 64 Years | 23 (100.0%) | 0 (0.0%) |
| 65 to 74 Years | 56 (100.0%) | 0 (0.0%) |
| 75 Years and older | 0 (0.0%) | 0 (0.0%) |
| Total | 346 (81.0%) | 81 (19.0%) |
Health Insurance Coverage by Citizenship Status in Bixby
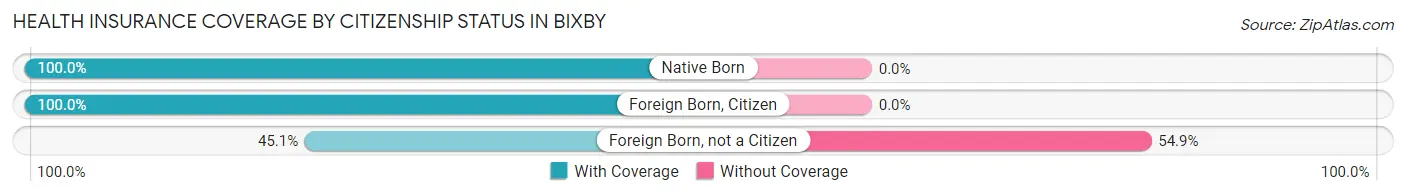
| Citizenship Status | With Coverage | Without Coverage |
| Native Born | 12 (100.0%) | 0 (0.0%) |
| Foreign Born, Citizen | 129 (100.0%) | 0 (0.0%) |
| Foreign Born, not a Citizen | 32 (45.1%) | 39 (54.9%) |
Health Insurance Coverage by Household Income in Bixby
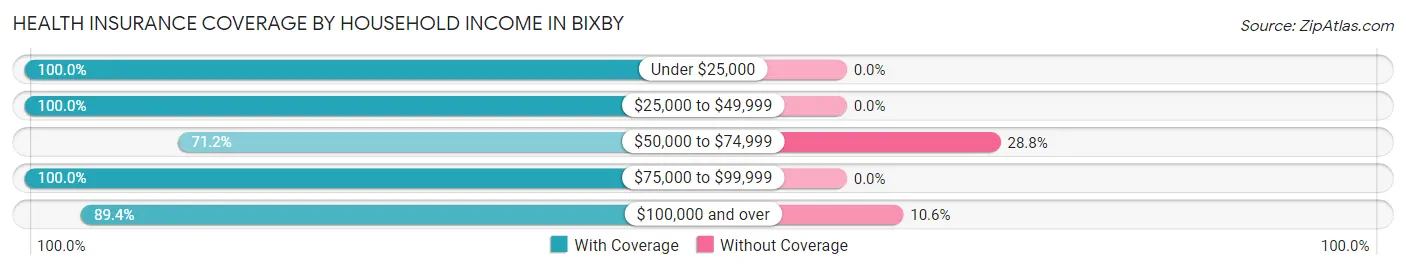
| Household Income | With Coverage | Without Coverage |
| Under $25,000 | 16 (100.0%) | 0 (0.0%) |
| $25,000 to $49,999 | 19 (100.0%) | 0 (0.0%) |
| $50,000 to $74,999 | 173 (71.2%) | 70 (28.8%) |
| $75,000 to $99,999 | 45 (100.0%) | 0 (0.0%) |
| $100,000 and over | 93 (89.4%) | 11 (10.6%) |
Public vs Private Health Insurance Coverage by Age in Bixby
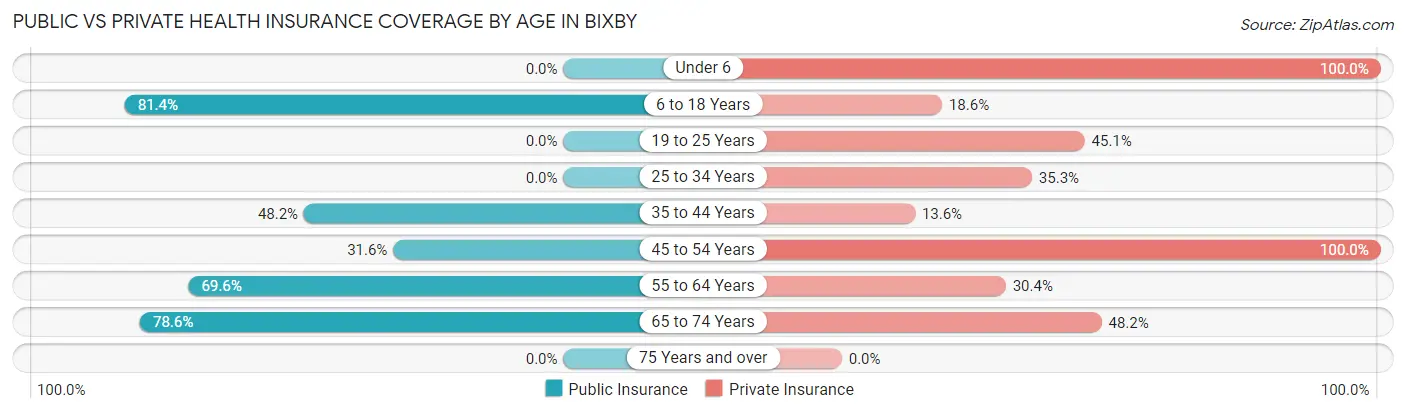
| Age Bracket | Public Insurance | Private Insurance |
| Under 6 | 0 (0.0%) | 12 (100.0%) |
| 6 to 18 Years | 105 (81.4%) | 24 (18.6%) |
| 19 to 25 Years | 0 (0.0%) | 32 (45.1%) |
| 25 to 34 Years | 0 (0.0%) | 6 (35.3%) |
| 35 to 44 Years | 39 (48.1%) | 11 (13.6%) |
| 45 to 54 Years | 12 (31.6%) | 38 (100.0%) |
| 55 to 64 Years | 16 (69.6%) | 7 (30.4%) |
| 65 to 74 Years | 44 (78.6%) | 27 (48.2%) |
| 75 Years and over | 0 (0.0%) | 0 (0.0%) |
| Total | 216 (50.6%) | 157 (36.8%) |
Disability Status by Sex by Age in Bixby
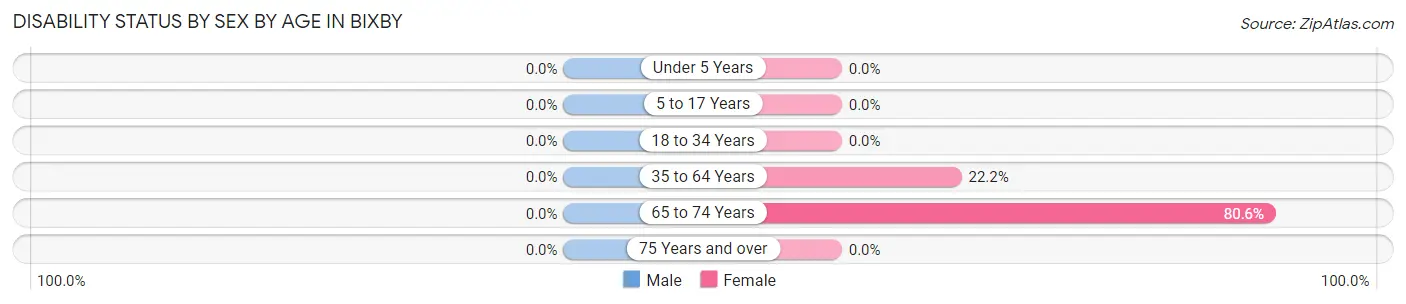
| Age Bracket | Male | Female |
| Under 5 Years | 0 (0.0%) | 0 (0.0%) |
| 5 to 17 Years | 0 (0.0%) | 0 (0.0%) |
| 18 to 34 Years | 0 (0.0%) | 0 (0.0%) |
| 35 to 64 Years | 0 (0.0%) | 16 (22.2%) |
| 65 to 74 Years | 0 (0.0%) | 29 (80.6%) |
| 75 Years and over | 0 (0.0%) | 0 (0.0%) |
Disability Class by Sex by Age in Bixby
Disability Class: Hearing Difficulty
| Age Bracket | Male | Female |
| Under 5 Years | 0 (0.0%) | 0 (0.0%) |
| 5 to 17 Years | 0 (0.0%) | 0 (0.0%) |
| 18 to 34 Years | 0 (0.0%) | 0 (0.0%) |
| 35 to 64 Years | 0 (0.0%) | 0 (0.0%) |
| 65 to 74 Years | 0 (0.0%) | 0 (0.0%) |
| 75 Years and over | 0 (0.0%) | 0 (0.0%) |
Disability Class: Vision Difficulty
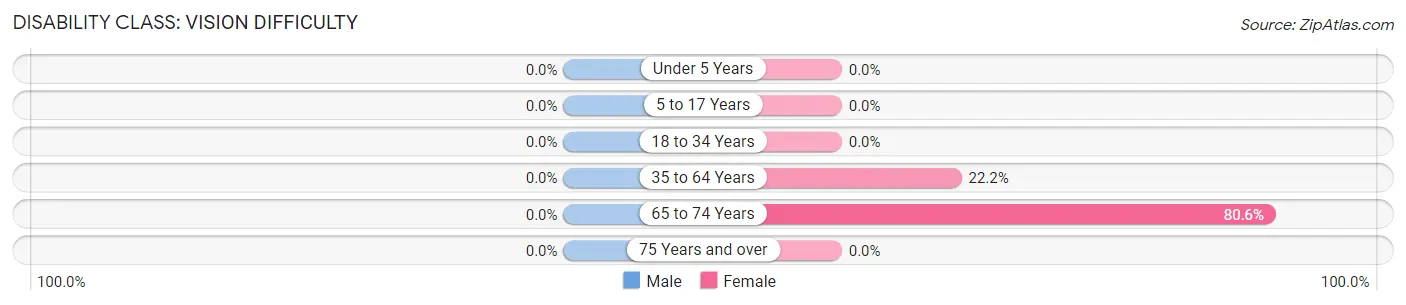
| Age Bracket | Male | Female |
| Under 5 Years | 0 (0.0%) | 0 (0.0%) |
| 5 to 17 Years | 0 (0.0%) | 0 (0.0%) |
| 18 to 34 Years | 0 (0.0%) | 0 (0.0%) |
| 35 to 64 Years | 0 (0.0%) | 16 (22.2%) |
| 65 to 74 Years | 0 (0.0%) | 29 (80.6%) |
| 75 Years and over | 0 (0.0%) | 0 (0.0%) |
Disability Class: Cognitive Difficulty
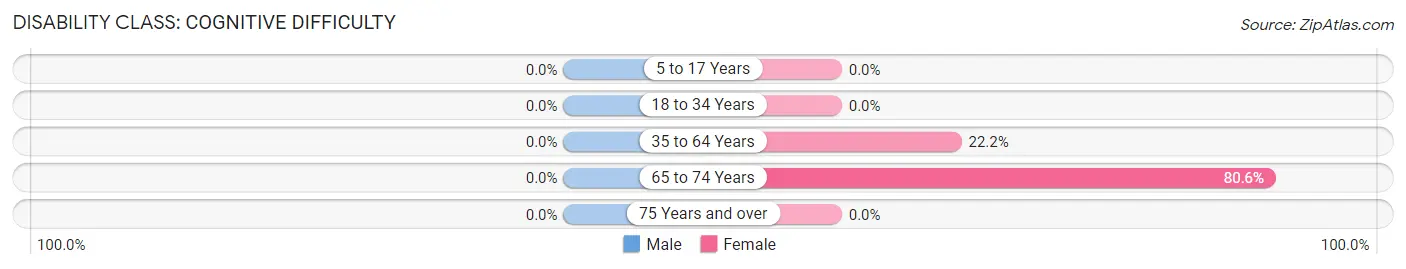
| Age Bracket | Male | Female |
| 5 to 17 Years | 0 (0.0%) | 0 (0.0%) |
| 18 to 34 Years | 0 (0.0%) | 0 (0.0%) |
| 35 to 64 Years | 0 (0.0%) | 16 (22.2%) |
| 65 to 74 Years | 0 (0.0%) | 29 (80.6%) |
| 75 Years and over | 0 (0.0%) | 0 (0.0%) |
Disability Class: Ambulatory Difficulty
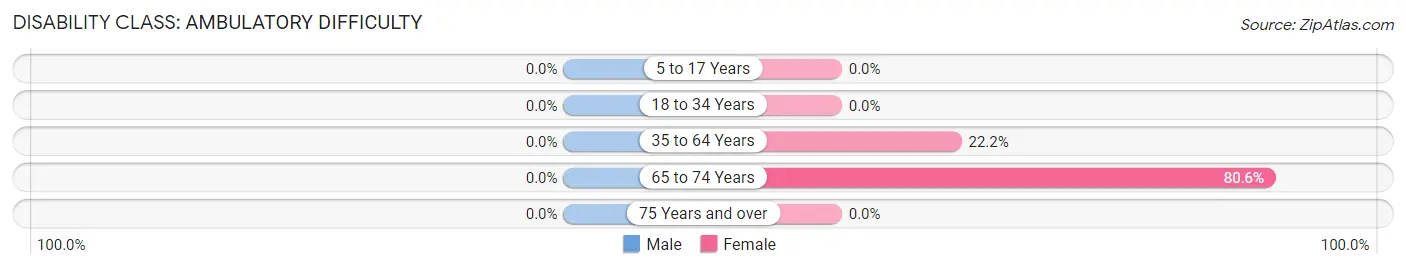
| Age Bracket | Male | Female |
| 5 to 17 Years | 0 (0.0%) | 0 (0.0%) |
| 18 to 34 Years | 0 (0.0%) | 0 (0.0%) |
| 35 to 64 Years | 0 (0.0%) | 16 (22.2%) |
| 65 to 74 Years | 0 (0.0%) | 29 (80.6%) |
| 75 Years and over | 0 (0.0%) | 0 (0.0%) |
Disability Class: Self-Care Difficulty
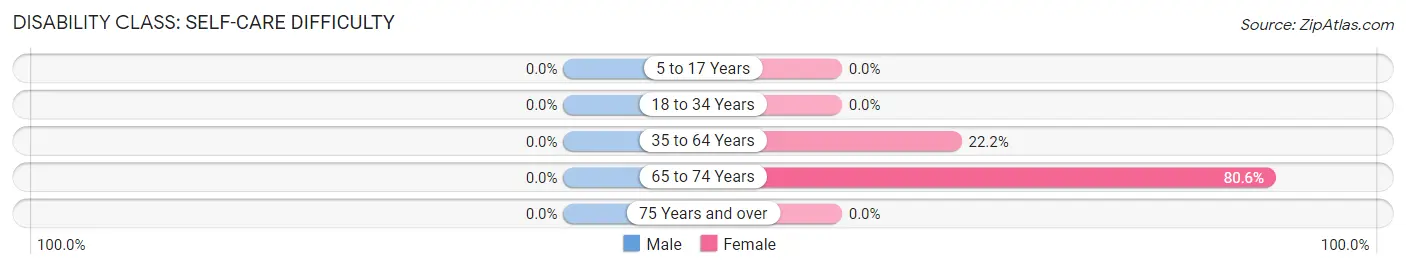
| Age Bracket | Male | Female |
| 5 to 17 Years | 0 (0.0%) | 0 (0.0%) |
| 18 to 34 Years | 0 (0.0%) | 0 (0.0%) |
| 35 to 64 Years | 0 (0.0%) | 16 (22.2%) |
| 65 to 74 Years | 0 (0.0%) | 29 (80.6%) |
| 75 Years and over | 0 (0.0%) | 0 (0.0%) |
Technology Access in Bixby
Computing Device Access in Bixby
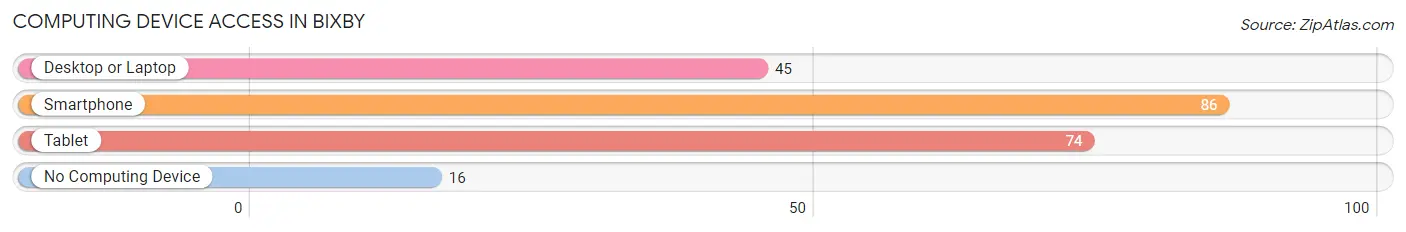
| Device Type | # Households | % Households |
| Desktop or Laptop | 45 | 44.1% |
| Smartphone | 86 | 84.3% |
| Tablet | 74 | 72.6% |
| No Computing Device | 16 | 15.7% |
| Total | 102 | 100.0% |
Internet Access in Bixby
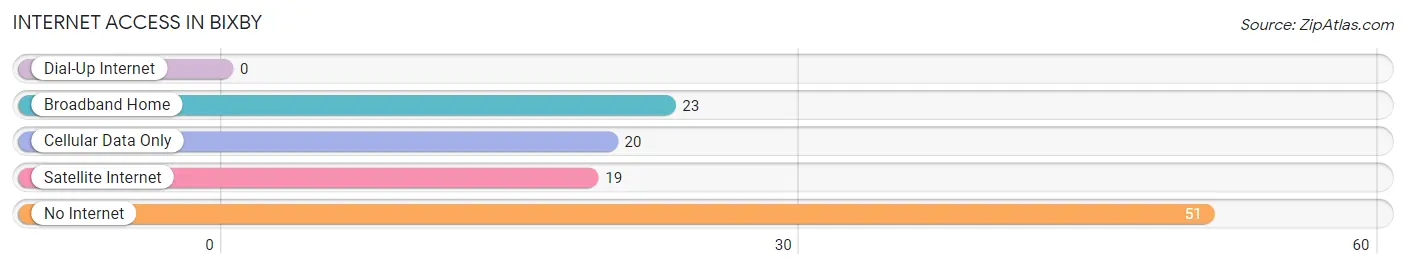
| Internet Type | # Households | % Households |
| Dial-Up Internet | 0 | 0.0% |
| Broadband Home | 23 | 22.6% |
| Cellular Data Only | 20 | 19.6% |
| Satellite Internet | 19 | 18.6% |
| No Internet | 51 | 50.0% |
| Total | 102 | 100.0% |
Bixby Summary
Bixby is a small town located in the state of Texas, in the United States. It is situated in the southeastern part of the state, in the county of Smith. The town has a population of around 1,000 people, and is located about 25 miles east of Tyler, the county seat.
History
The town of Bixby was founded in 1872 by a group of settlers from the nearby town of Tyler. The settlers were looking for a place to settle and start a new life, and they chose the area around Bixby because of its fertile soil and abundant water supply. The town was named after a local settler, William Bixby, who had been a prominent figure in the area since the early 1800s.
The town grew slowly but steadily over the years, and by the early 1900s it had become a thriving community. The town was home to several businesses, including a general store, a blacksmith shop, and a cotton gin. The town also had a school, a post office, and a church.
In the late 1940s, the town began to decline as many of its residents moved away in search of better opportunities elsewhere. By the early 2000s, the population had dropped to around 1,000 people.
Geography
Bixby is located in the southeastern part of Texas, in Smith County. The town is situated on the banks of the Sabine River, which forms the border between Texas and Louisiana. The town is surrounded by rolling hills and lush forests, and is located about 25 miles east of Tyler, the county seat.
The climate in Bixby is generally mild, with hot summers and mild winters. The average annual temperature is around 70 degrees Fahrenheit, and the average annual rainfall is around 40 inches.
Economy
The economy of Bixby is largely based on agriculture. The town is home to several farms, which produce a variety of crops, including cotton, corn, soybeans, and wheat. The town also has a few small businesses, including a general store, a blacksmith shop, and a cotton gin.
The town is also home to a few manufacturing companies, which produce a variety of products, including furniture, clothing, and electronics.
Demographics
As of the 2010 census, the population of Bixby was 1,000 people. The racial makeup of the town was 97.2% White, 0.7% African American, 0.3% Native American, 0.2% Asian, and 1.6% from other races. The median household income was $35,000, and the median age was 37 years.
Conclusion
Bixby is a small town located in the southeastern part of Texas, in Smith County. The town has a population of around 1,000 people, and is situated on the banks of the Sabine River. The economy of Bixby is largely based on agriculture, and the town is home to several farms, businesses, and manufacturing companies. The racial makeup of the town is mostly White, with a small percentage of African American, Native American, and Asian residents.
Common Questions
What is Per Capita Income in Bixby?
Per Capita income in Bixby is $17,157.
What is the Median Family Income in Bixby?
Median Family Income in Bixby is $80,833.
What is Inequality or Gini Index in Bixby?
Inequality or Gini Index in Bixby is 0.35.
What is the Total Population of Bixby?
Total Population of Bixby is 427.
What is the Total Male Population of Bixby?
Total Male Population of Bixby is 173.
What is the Total Female Population of Bixby?
Total Female Population of Bixby is 254.
What is the Ratio of Males per 100 Females in Bixby?
There are 68.11 Males per 100 Females in Bixby.
What is the Ratio of Females per 100 Males in Bixby?
There are 146.82 Females per 100 Males in Bixby.
What is the Median Population Age in Bixby?
Median Population Age in Bixby is 32.3 Years.
What is the Average Family Size in Bixby
Average Family Size in Bixby is 4.6 People.
What is the Average Household Size in Bixby
Average Household Size in Bixby is 4.2 People.
How Large is the Labor Force in Bixby?
There are 133 People in the Labor Forcein in Bixby.
What is the Percentage of People in the Labor Force in Bixby?
44.6% of People are in the Labor Force in Bixby.