Bowman, TN Map & Demographics
Bowman Map
Bowman Overview
$27,287
PER CAPITA INCOME
$73,658
AVG FAMILY INCOME
$73,382
AVG HOUSEHOLD INCOME
16.0%
WAGE / INCOME GAP [ % ]
84.0¢/ $1
WAGE / INCOME GAP [ $ ]
0.21
INEQUALITY / GINI INDEX
411
TOTAL POPULATION
242
MALE POPULATION
169
FEMALE POPULATION
143.20
MALES / 100 FEMALES
69.83
FEMALES / 100 MALES
34.6
MEDIAN AGE
2.6
AVG FAMILY SIZE
2.5
AVG HOUSEHOLD SIZE
232
LABOR FORCE [ PEOPLE ]
68.4%
PERCENT IN LABOR FORCE
Income in Bowman
Income Overview in Bowman
Per Capita Income in Bowman is $27,287, while median incomes of families and households are $73,658 and $73,382 respectively.
| Characteristic | Number | Measure |
| Per Capita Income | 411 | $27,287 |
| Median Family Income | 125 | $73,658 |
| Mean Family Income | 125 | $67,639 |
| Median Household Income | 166 | $73,382 |
| Mean Household Income | 166 | $66,723 |
| Income Deficit | 125 | $0 |
| Wage / Income Gap (%) | 411 | 16.03% |
| Wage / Income Gap ($) | 411 | 83.97¢ per $1 |
| Gini / Inequality Index | 411 | 0.21 |
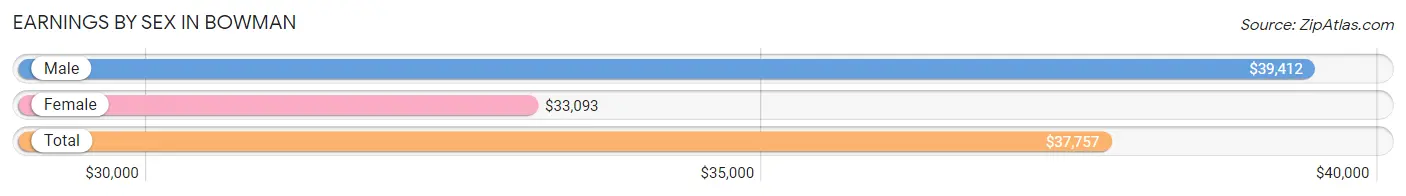
Earnings by Sex in Bowman
Average Earnings in Bowman are $37,757, $39,412 for men and $33,093 for women, a difference of 16.0%.
| Sex | Number | Average Earnings |
| Male | 128 (55.2%) | $39,412 |
| Female | 104 (44.8%) | $33,093 |
| Total | 232 (100.0%) | $37,757 |
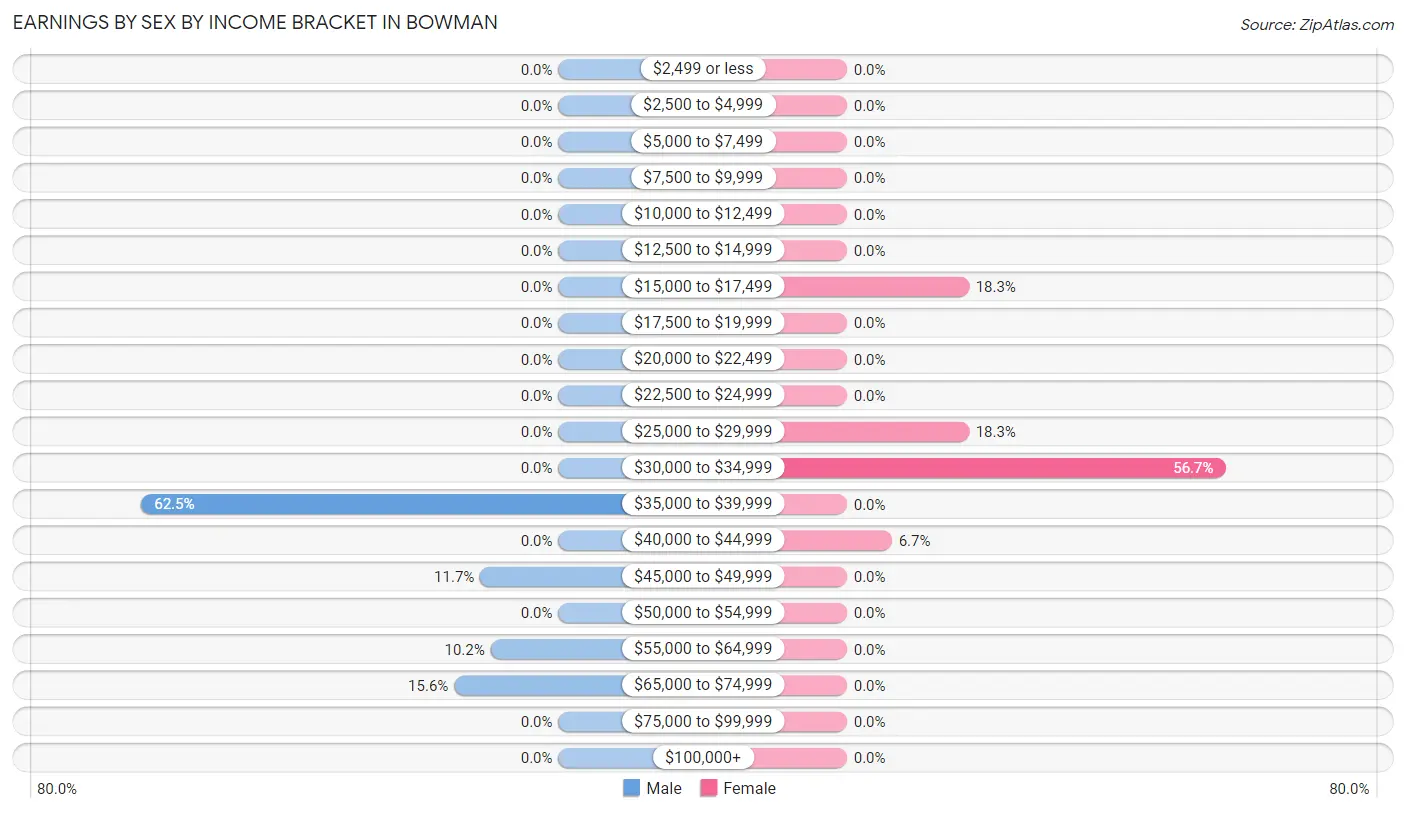
Earnings by Sex by Income Bracket in Bowman
The most common earnings brackets in Bowman are $35,000 to $39,999 for men (80 | 62.5%) and $30,000 to $34,999 for women (59 | 56.7%).
| Income | Male | Female |
| $2,499 or less | 0 (0.0%) | 0 (0.0%) |
| $2,500 to $4,999 | 0 (0.0%) | 0 (0.0%) |
| $5,000 to $7,499 | 0 (0.0%) | 0 (0.0%) |
| $7,500 to $9,999 | 0 (0.0%) | 0 (0.0%) |
| $10,000 to $12,499 | 0 (0.0%) | 0 (0.0%) |
| $12,500 to $14,999 | 0 (0.0%) | 0 (0.0%) |
| $15,000 to $17,499 | 0 (0.0%) | 19 (18.3%) |
| $17,500 to $19,999 | 0 (0.0%) | 0 (0.0%) |
| $20,000 to $22,499 | 0 (0.0%) | 0 (0.0%) |
| $22,500 to $24,999 | 0 (0.0%) | 0 (0.0%) |
| $25,000 to $29,999 | 0 (0.0%) | 19 (18.3%) |
| $30,000 to $34,999 | 0 (0.0%) | 59 (56.7%) |
| $35,000 to $39,999 | 80 (62.5%) | 0 (0.0%) |
| $40,000 to $44,999 | 0 (0.0%) | 7 (6.7%) |
| $45,000 to $49,999 | 15 (11.7%) | 0 (0.0%) |
| $50,000 to $54,999 | 0 (0.0%) | 0 (0.0%) |
| $55,000 to $64,999 | 13 (10.2%) | 0 (0.0%) |
| $65,000 to $74,999 | 20 (15.6%) | 0 (0.0%) |
| $75,000 to $99,999 | 0 (0.0%) | 0 (0.0%) |
| $100,000+ | 0 (0.0%) | 0 (0.0%) |
| Total | 128 (100.0%) | 104 (100.0%) |
Earnings by Sex by Educational Attainment in Bowman
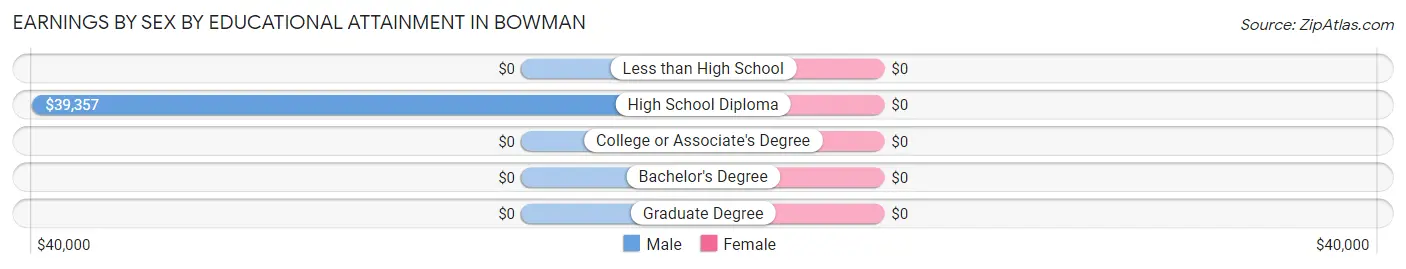
| Educational Attainment | Male Income | Female Income |
| Less than High School | - | - |
| High School Diploma | $39,357 | $0 |
| College or Associate's Degree | - | - |
| Bachelor's Degree | - | - |
| Graduate Degree | - | - |
| Total | $39,412 | $33,496 |
Family Income in Bowman
Family Income Brackets in Bowman
According to the Bowman family income data, there are 68 families falling into the $50,000 to $74,999 income range, which is the most common income bracket and makes up 54.4% of all families.
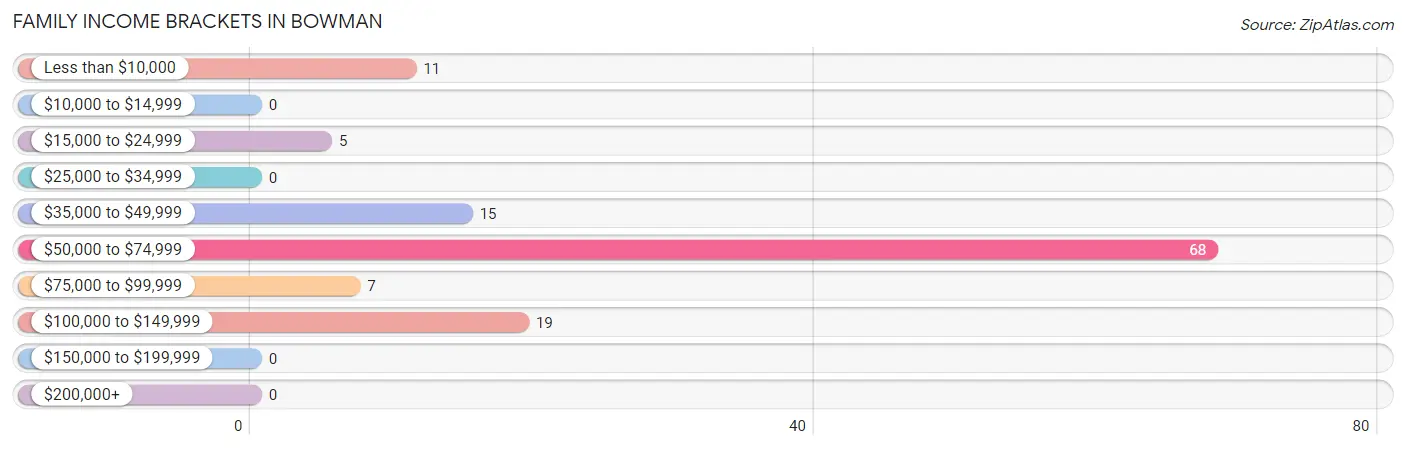
| Income Bracket | # Families | % Families |
| Less than $10,000 | 11 | 8.8% |
| $10,000 to $14,999 | 0 | 0.0% |
| $15,000 to $24,999 | 5 | 4.0% |
| $25,000 to $34,999 | 0 | 0.0% |
| $35,000 to $49,999 | 15 | 12.0% |
| $50,000 to $74,999 | 68 | 54.4% |
| $75,000 to $99,999 | 7 | 5.6% |
| $100,000 to $149,999 | 19 | 15.2% |
| $150,000 to $199,999 | 0 | 0.0% |
| $200,000+ | 0 | 0.0% |
Family Income by Famaliy Size in Bowman
3-person families (94 | 75.2%) account for the highest median family income in Bowman with $74,228 per family, while 3-person families (94 | 75.2%) have the highest median income of $24,743 per family member.
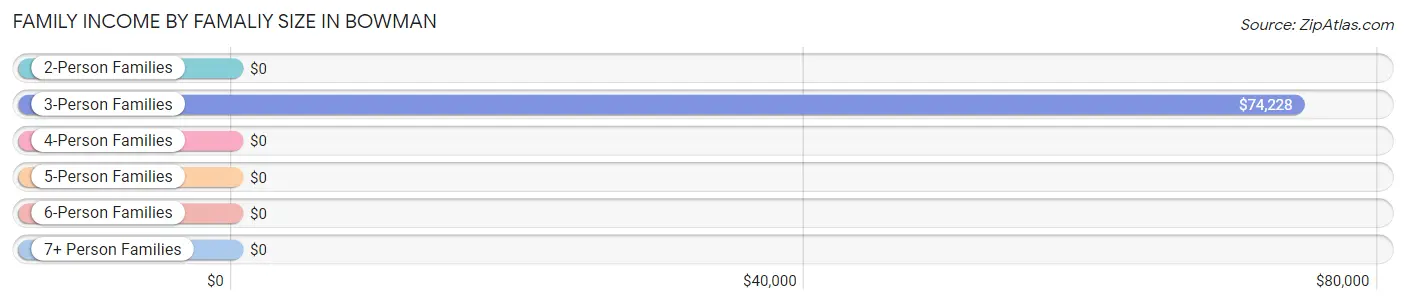
| Income Bracket | # Families | Median Income |
| 2-Person Families | 31 (24.8%) | $0 |
| 3-Person Families | 94 (75.2%) | $74,228 |
| 4-Person Families | 0 (0.0%) | $0 |
| 5-Person Families | 0 (0.0%) | $0 |
| 6-Person Families | 0 (0.0%) | $0 |
| 7+ Person Families | 0 (0.0%) | $0 |
| Total | 125 (100.0%) | $73,658 |
Family Income by Number of Earners in Bowman
| Number of Earners | # Families | Median Income |
| No Earners | 31 (24.8%) | $0 |
| 1 Earner | 0 (0.0%) | $0 |
| 2 Earners | 75 (60.0%) | $0 |
| 3+ Earners | 19 (15.2%) | $0 |
| Total | 125 (100.0%) | $73,658 |
Household Income in Bowman
Household Income Brackets in Bowman
With 96 households falling in the category, the $50,000 to $74,999 income range is the most frequent in Bowman, accounting for 57.8% of all households.
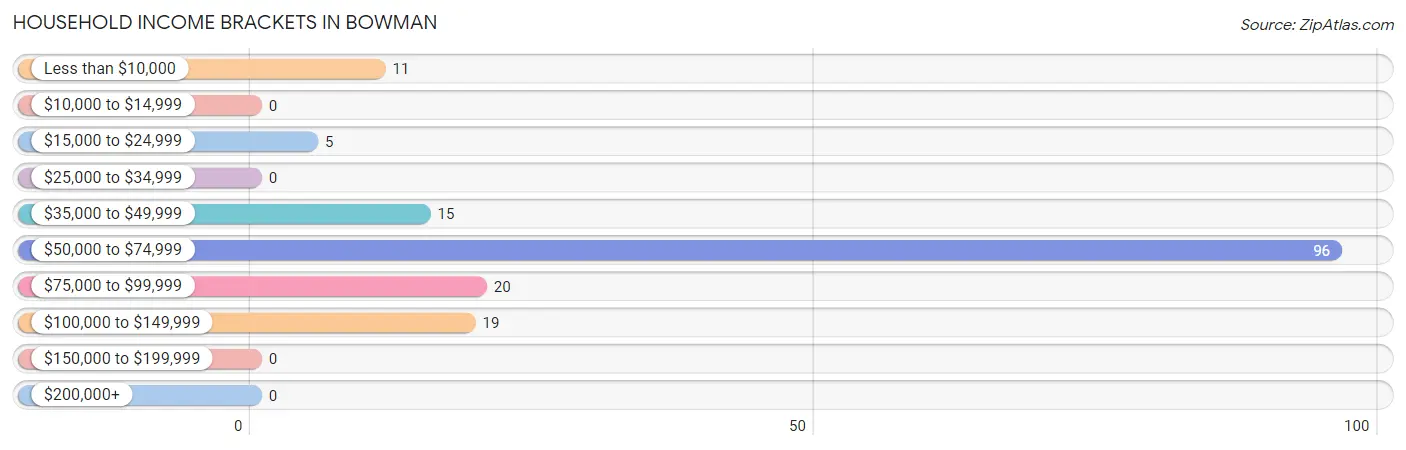
| Income Bracket | # Households | % Households |
| Less than $10,000 | 11 | 6.6% |
| $10,000 to $14,999 | 0 | 0.0% |
| $15,000 to $24,999 | 5 | 3.0% |
| $25,000 to $34,999 | 0 | 0.0% |
| $35,000 to $49,999 | 15 | 9.0% |
| $50,000 to $74,999 | 96 | 57.8% |
| $75,000 to $99,999 | 20 | 12.0% |
| $100,000 to $149,999 | 19 | 11.4% |
| $150,000 to $199,999 | 0 | 0.0% |
| $200,000+ | 0 | 0.0% |
Household Income by Householder Age in Bowman
The median household income in Bowman is $73,382, with the highest median household income of $79,519 found in the 45 to 64 years age bracket for the primary householder. A total of 43 households (25.9%) fall into this category.
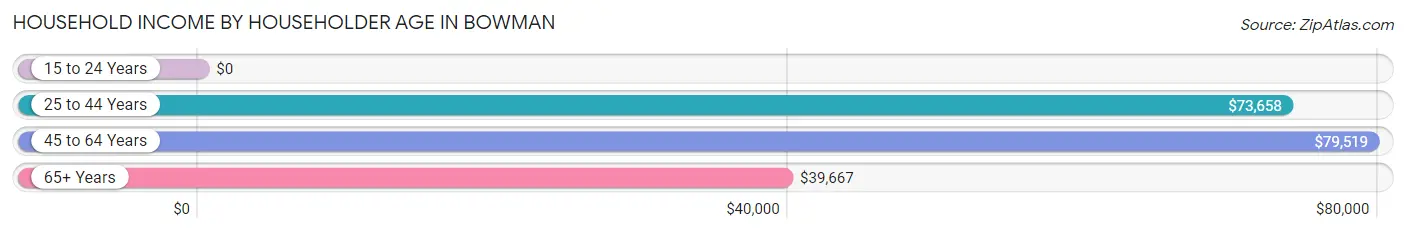
| Income Bracket | # Households | Median Income |
| 15 to 24 Years | 0 (0.0%) | $0 |
| 25 to 44 Years | 87 (52.4%) | $73,658 |
| 45 to 64 Years | 43 (25.9%) | $79,519 |
| 65+ Years | 36 (21.7%) | $39,667 |
| Total | 166 (100.0%) | $73,382 |
Poverty in Bowman
Income Below Poverty by Sex and Age in Bowman
With 11.0% poverty level for males and 7.7% for females among the residents of Bowman, 55 to 64 year old males and 55 to 64 year old females are the most vulnerable to poverty, with 11 males (25.0%) and 13 females (100.0%) in their respective age groups living below the poverty level.
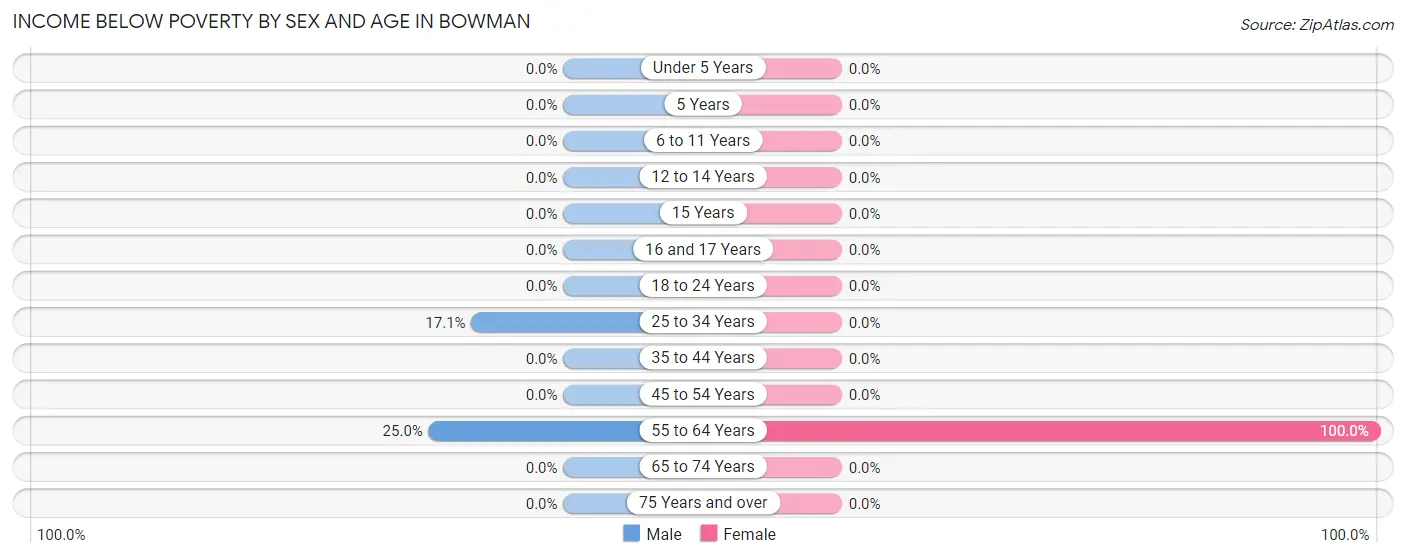
| Age Bracket | Male | Female |
| Under 5 Years | 0 (0.0%) | 0 (0.0%) |
| 5 Years | 0 (0.0%) | 0 (0.0%) |
| 6 to 11 Years | 0 (0.0%) | 0 (0.0%) |
| 12 to 14 Years | 0 (0.0%) | 0 (0.0%) |
| 15 Years | 0 (0.0%) | 0 (0.0%) |
| 16 and 17 Years | 0 (0.0%) | 0 (0.0%) |
| 18 to 24 Years | 0 (0.0%) | 0 (0.0%) |
| 25 to 34 Years | 14 (17.1%) | 0 (0.0%) |
| 35 to 44 Years | 0 (0.0%) | 0 (0.0%) |
| 45 to 54 Years | 0 (0.0%) | 0 (0.0%) |
| 55 to 64 Years | 11 (25.0%) | 13 (100.0%) |
| 65 to 74 Years | 0 (0.0%) | 0 (0.0%) |
| 75 Years and over | 0 (0.0%) | 0 (0.0%) |
| Total | 25 (11.0%) | 13 (7.7%) |
Income Above Poverty by Sex and Age in Bowman
According to the poverty statistics in Bowman, males aged 12 to 14 years and females aged under 5 years are the age groups that are most secure financially, with 100.0% of males and 100.0% of females in these age groups living above the poverty line.
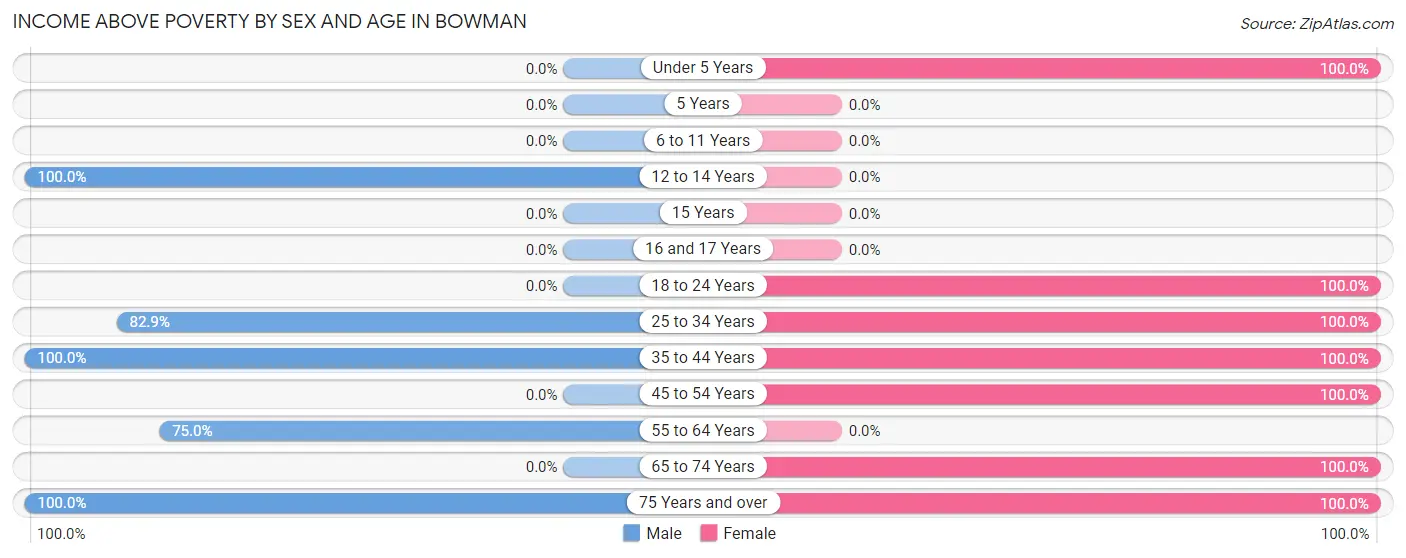
| Age Bracket | Male | Female |
| Under 5 Years | 0 (0.0%) | 3 (100.0%) |
| 5 Years | 0 (0.0%) | 0 (0.0%) |
| 6 to 11 Years | 0 (0.0%) | 0 (0.0%) |
| 12 to 14 Years | 54 (100.0%) | 0 (0.0%) |
| 15 Years | 0 (0.0%) | 0 (0.0%) |
| 16 and 17 Years | 0 (0.0%) | 0 (0.0%) |
| 18 to 24 Years | 0 (0.0%) | 19 (100.0%) |
| 25 to 34 Years | 68 (82.9%) | 59 (100.0%) |
| 35 to 44 Years | 27 (100.0%) | 19 (100.0%) |
| 45 to 54 Years | 0 (0.0%) | 19 (100.0%) |
| 55 to 64 Years | 33 (75.0%) | 0 (0.0%) |
| 65 to 74 Years | 0 (0.0%) | 21 (100.0%) |
| 75 Years and over | 20 (100.0%) | 16 (100.0%) |
| Total | 202 (89.0%) | 156 (92.3%) |
Income Below Poverty Among Married-Couple Families in Bowman
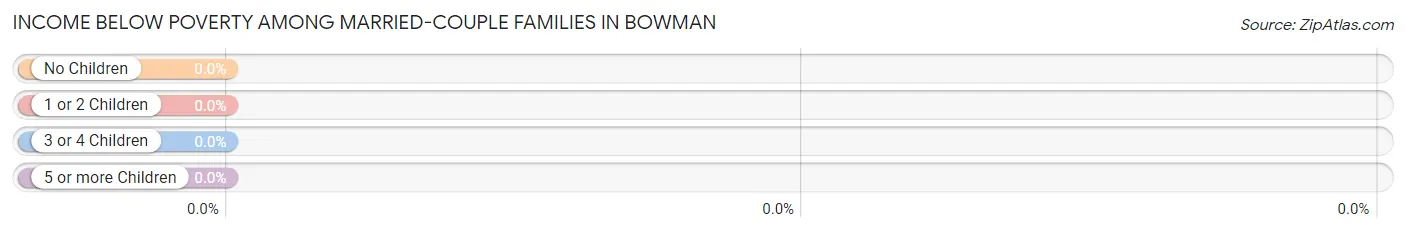
| Children | Above Poverty | Below Poverty |
| No Children | 39 (100.0%) | 0 (0.0%) |
| 1 or 2 Children | 75 (100.0%) | 0 (0.0%) |
| 3 or 4 Children | 0 (0.0%) | 0 (0.0%) |
| 5 or more Children | 0 (0.0%) | 0 (0.0%) |
| Total | 114 (100.0%) | 0 (0.0%) |
Income Below Poverty Among Single-Parent Households in Bowman
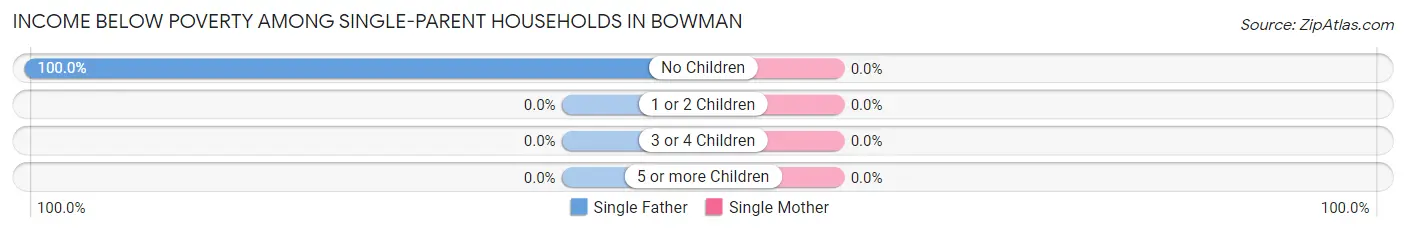
| Children | Single Father | Single Mother |
| No Children | 11 (100.0%) | 0 (0.0%) |
| 1 or 2 Children | 0 (0.0%) | 0 (0.0%) |
| 3 or 4 Children | 0 (0.0%) | 0 (0.0%) |
| 5 or more Children | 0 (0.0%) | 0 (0.0%) |
| Total | 11 (100.0%) | 0 (0.0%) |
Income Below Poverty Among Married-Couple vs Single-Parent Households in Bowman
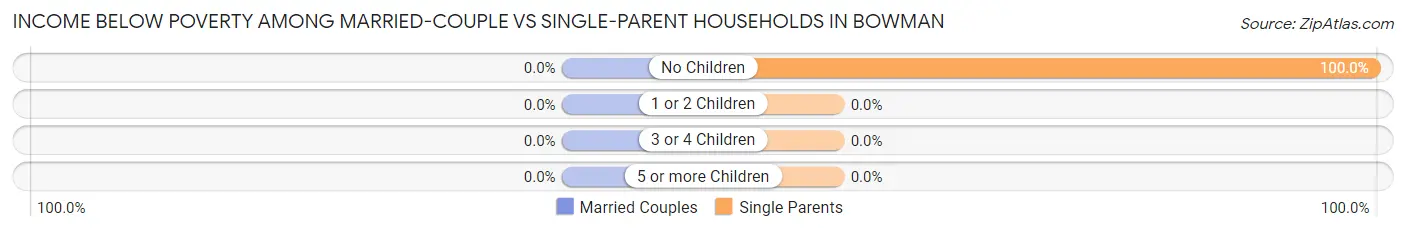
| Children | Married-Couple Families | Single-Parent Households |
| No Children | 0 (0.0%) | 11 (100.0%) |
| 1 or 2 Children | 0 (0.0%) | 0 (0.0%) |
| 3 or 4 Children | 0 (0.0%) | 0 (0.0%) |
| 5 or more Children | 0 (0.0%) | 0 (0.0%) |
| Total | 0 (0.0%) | 11 (100.0%) |
Race in Bowman
The most populous races in Bowman are , and White / Caucasian (411 | 100.0%).
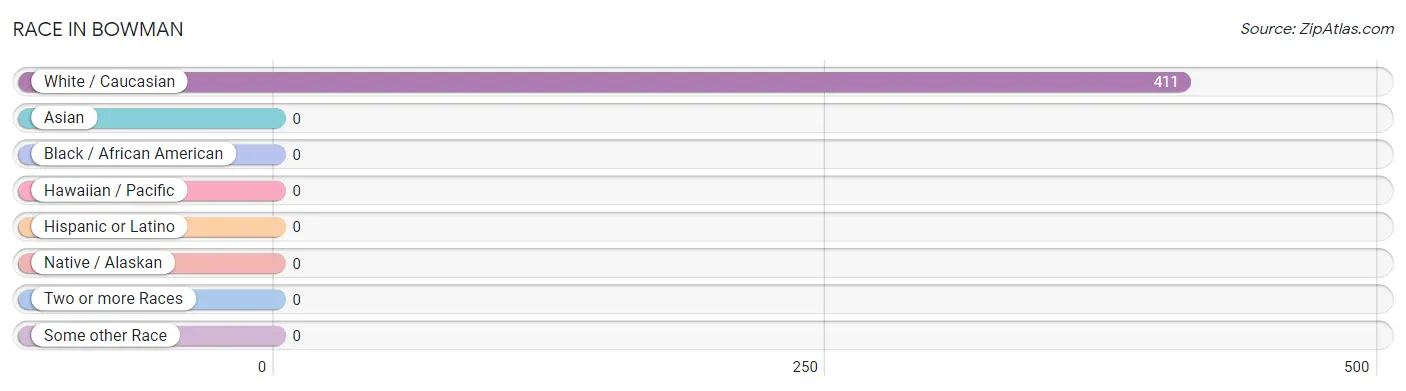
| Race | # Population | % Population |
| Asian | 0 | 0.0% |
| Black / African American | 0 | 0.0% |
| Hawaiian / Pacific | 0 | 0.0% |
| Hispanic or Latino | 0 | 0.0% |
| Native / Alaskan | 0 | 0.0% |
| White / Caucasian | 411 | 100.0% |
| Two or more Races | 0 | 0.0% |
| Some other Race | 0 | 0.0% |
| Total | 411 | 100.0% |
Ancestry in Bowman
The most populous ancestries reported in Bowman are English (27 | 6.6%), American (26 | 6.3%), German (26 | 6.3%), Irish (25 | 6.1%), and Scotch-Irish (25 | 6.1%), together accounting for 31.4% of all Bowman residents.
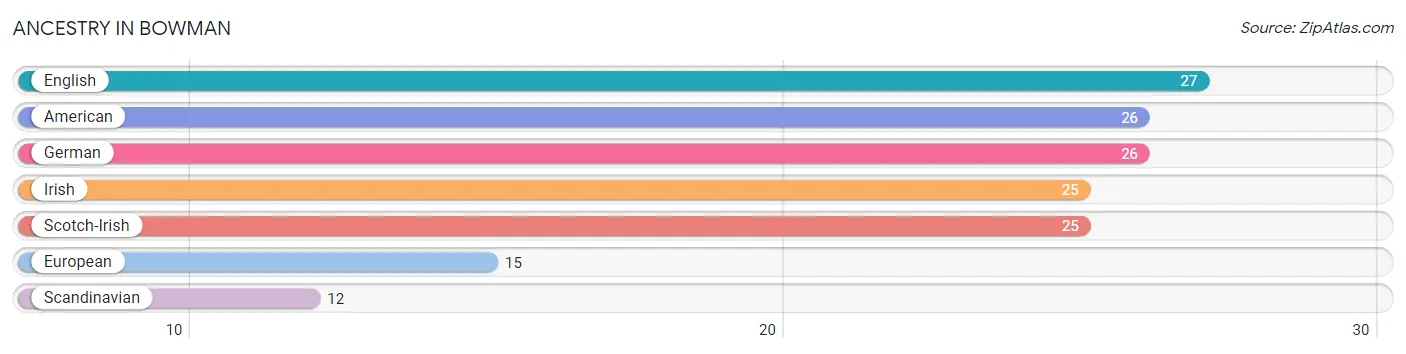
| Ancestry | # Population | % Population |
| American | 26 | 6.3% |
| English | 27 | 6.6% |
| European | 15 | 3.6% |
| German | 26 | 6.3% |
| Irish | 25 | 6.1% |
| Scandinavian | 12 | 2.9% |
| Scotch-Irish | 25 | 6.1% | View All 7 Rows |
Immigrants in Bowman

| Immigration Origin | # Population | % Population | View All 0 Rows |
Sex and Age in Bowman
Sex and Age in Bowman
The most populous age groups in Bowman are 30 to 34 Years (82 | 33.9%) for men and 30 to 34 Years (59 | 34.9%) for women.
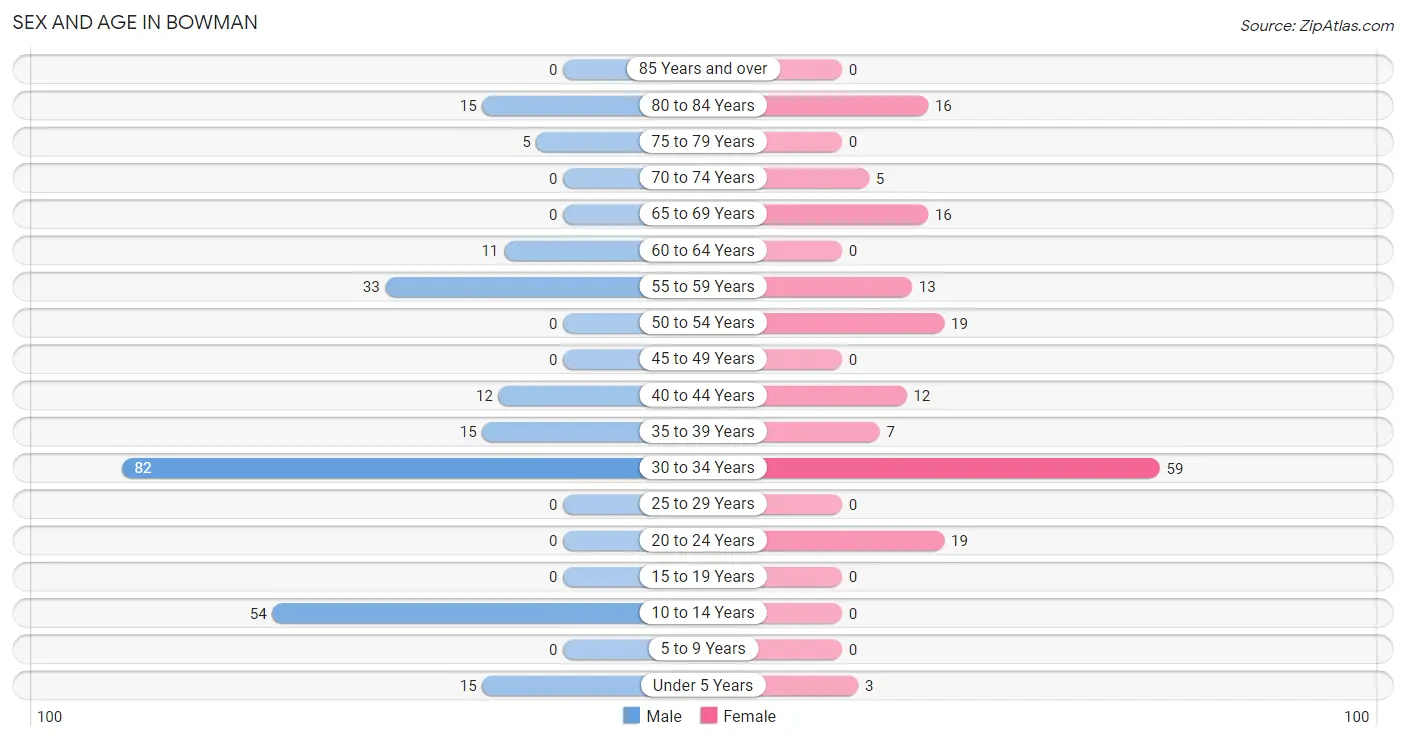
| Age Bracket | Male | Female |
| Under 5 Years | 15 (6.2%) | 3 (1.8%) |
| 5 to 9 Years | 0 (0.0%) | 0 (0.0%) |
| 10 to 14 Years | 54 (22.3%) | 0 (0.0%) |
| 15 to 19 Years | 0 (0.0%) | 0 (0.0%) |
| 20 to 24 Years | 0 (0.0%) | 19 (11.2%) |
| 25 to 29 Years | 0 (0.0%) | 0 (0.0%) |
| 30 to 34 Years | 82 (33.9%) | 59 (34.9%) |
| 35 to 39 Years | 15 (6.2%) | 7 (4.1%) |
| 40 to 44 Years | 12 (5.0%) | 12 (7.1%) |
| 45 to 49 Years | 0 (0.0%) | 0 (0.0%) |
| 50 to 54 Years | 0 (0.0%) | 19 (11.2%) |
| 55 to 59 Years | 33 (13.6%) | 13 (7.7%) |
| 60 to 64 Years | 11 (4.5%) | 0 (0.0%) |
| 65 to 69 Years | 0 (0.0%) | 16 (9.5%) |
| 70 to 74 Years | 0 (0.0%) | 5 (3.0%) |
| 75 to 79 Years | 5 (2.1%) | 0 (0.0%) |
| 80 to 84 Years | 15 (6.2%) | 16 (9.5%) |
| 85 Years and over | 0 (0.0%) | 0 (0.0%) |
| Total | 242 (100.0%) | 169 (100.0%) |
Families and Households in Bowman
Median Family Size in Bowman
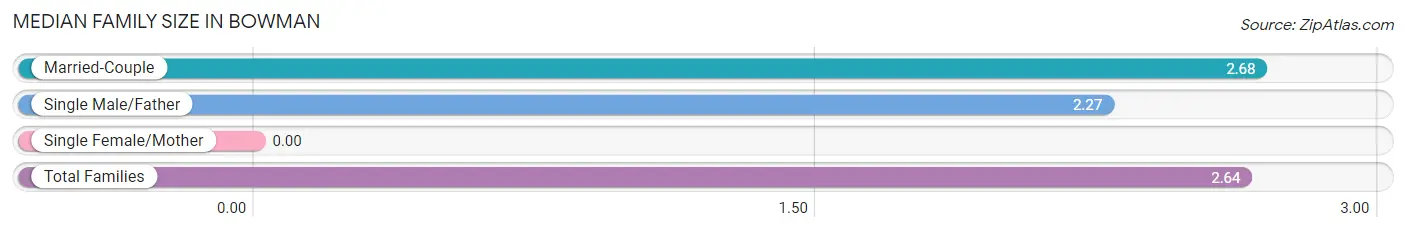
| Family Type | # Families | Family Size |
| Married-Couple | 114 (91.2%) | 2.68 |
| Single Male/Father | 11 (8.8%) | 2.27 |
| Single Female/Mother | 0 (0.0%) | - |
| Total Families | 125 (100.0%) | 2.64 |
Median Household Size in Bowman
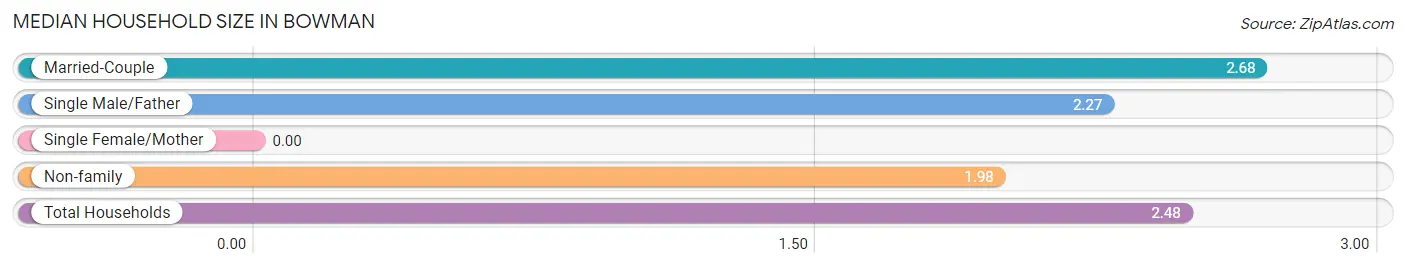
| Household Type | # Households | Household Size |
| Married-Couple | 114 (68.7%) | 2.68 |
| Single Male/Father | 11 (6.6%) | 2.27 |
| Single Female/Mother | 0 (0.0%) | - |
| Non-family | 41 (24.7%) | 1.98 |
| Total Households | 166 (100.0%) | 2.48 |
Household Size by Marriage Status in Bowman
Out of a total of 166 households in Bowman, 125 (75.3%) are family households, while 41 (24.7%) are nonfamily households. The most numerous type of family households are 3-person households, comprising 94, and the most common type of nonfamily households are 1-person households, comprising 16.
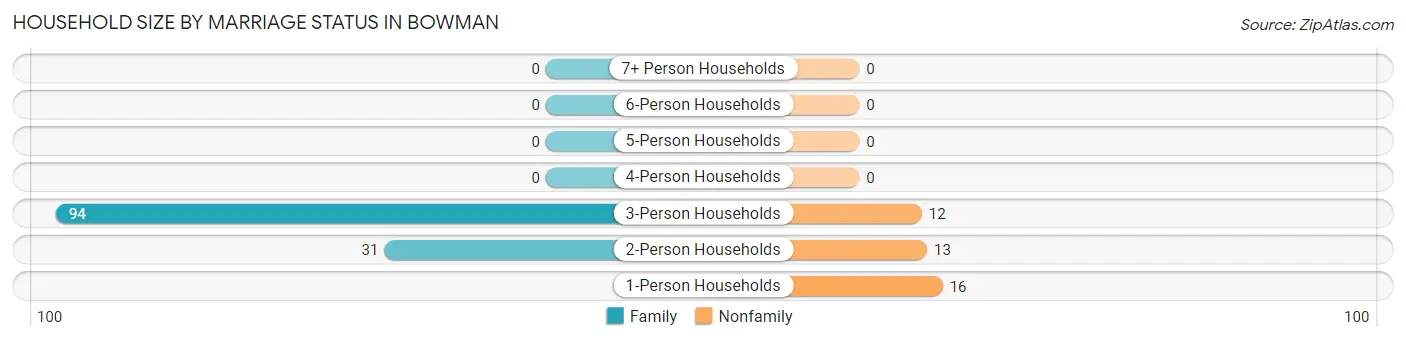
| Household Size | Family Households | Nonfamily Households |
| 1-Person Households | - | 16 (9.6%) |
| 2-Person Households | 31 (18.7%) | 13 (7.8%) |
| 3-Person Households | 94 (56.6%) | 12 (7.2%) |
| 4-Person Households | 0 (0.0%) | 0 (0.0%) |
| 5-Person Households | 0 (0.0%) | 0 (0.0%) |
| 6-Person Households | 0 (0.0%) | 0 (0.0%) |
| 7+ Person Households | 0 (0.0%) | 0 (0.0%) |
| Total | 125 (75.3%) | 41 (24.7%) |
Female Fertility in Bowman
Fertility by Age in Bowman
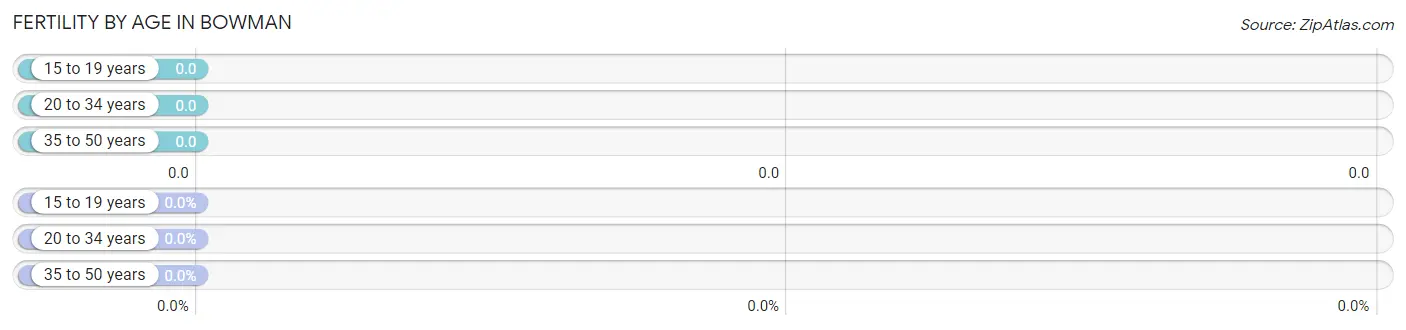
| Age Bracket | Women with Births | Births / 1,000 Women |
| 15 to 19 years | 0 (0.0%) | 0.0 |
| 20 to 34 years | 0 (0.0%) | 0.0 |
| 35 to 50 years | 0 (0.0%) | 0.0 |
| Total | 0 (0.0%) | 0.0 |
Fertility by Age by Marriage Status in Bowman
| Age Bracket | Married | Unmarried |
| 15 to 19 years | 0 (0.0%) | 0 (0.0%) |
| 20 to 34 years | 0 (0.0%) | 0 (0.0%) |
| 35 to 50 years | 0 (0.0%) | 0 (0.0%) |
| Total | 0 (0.0%) | 0 (0.0%) |
Fertility by Education in Bowman
| Educational Attainment | Women with Births | Births / 1,000 Women |
| Less than High School | 0 (0.0%) | 0.0 |
| High School Diploma | 0 (0.0%) | 0.0 |
| College or Associate's Degree | 0 (0.0%) | 0.0 |
| Bachelor's Degree | 0 (0.0%) | 0.0 |
| Graduate Degree | 0 (0.0%) | 0.0 |
| Total | 0 (0.0%) | 0.0 |
Fertility by Education by Marriage Status in Bowman
| Educational Attainment | Married | Unmarried |
| Less than High School | 0 (0.0%) | 0 (0.0%) |
| High School Diploma | 0 (0.0%) | 0 (0.0%) |
| College or Associate's Degree | 0 (0.0%) | 0 (0.0%) |
| Bachelor's Degree | 0 (0.0%) | 0 (0.0%) |
| Graduate Degree | 0 (0.0%) | 0 (0.0%) |
| Total | 0 (0.0%) | 0 (0.0%) |
Employment Characteristics in Bowman
Employment by Class of Employer in Bowman
Among the 232 employed individuals in Bowman, private company employees (126 | 54.3%), state government employees (59 | 25.4%), and self-employed (not incorporated) (15 | 6.5%) make up the most common classes of employment.
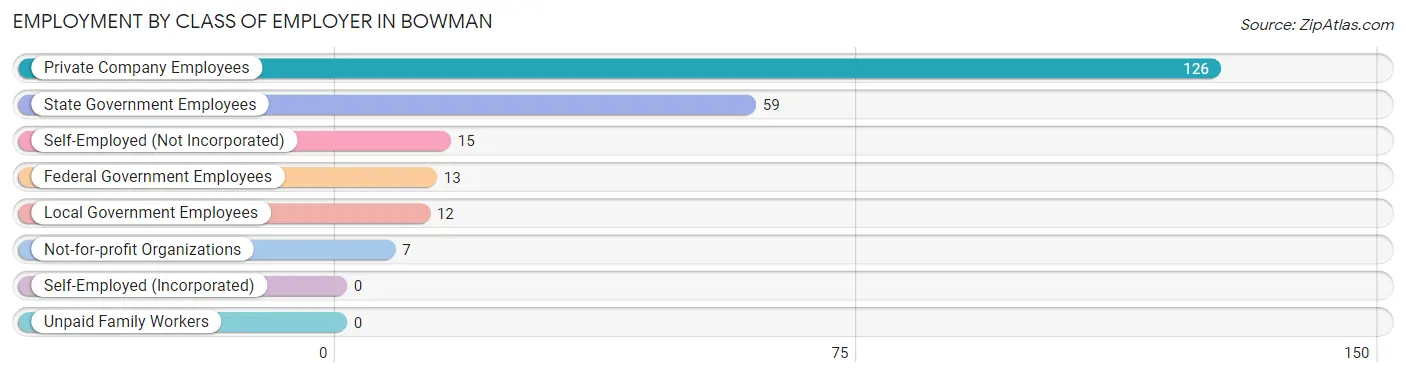
| Employer Class | # Employees | % Employees |
| Private Company Employees | 126 | 54.3% |
| Self-Employed (Incorporated) | 0 | 0.0% |
| Self-Employed (Not Incorporated) | 15 | 6.5% |
| Not-for-profit Organizations | 7 | 3.0% |
| Local Government Employees | 12 | 5.2% |
| State Government Employees | 59 | 25.4% |
| Federal Government Employees | 13 | 5.6% |
| Unpaid Family Workers | 0 | 0.0% |
| Total | 232 | 100.0% |
Employment Status by Age in Bowman
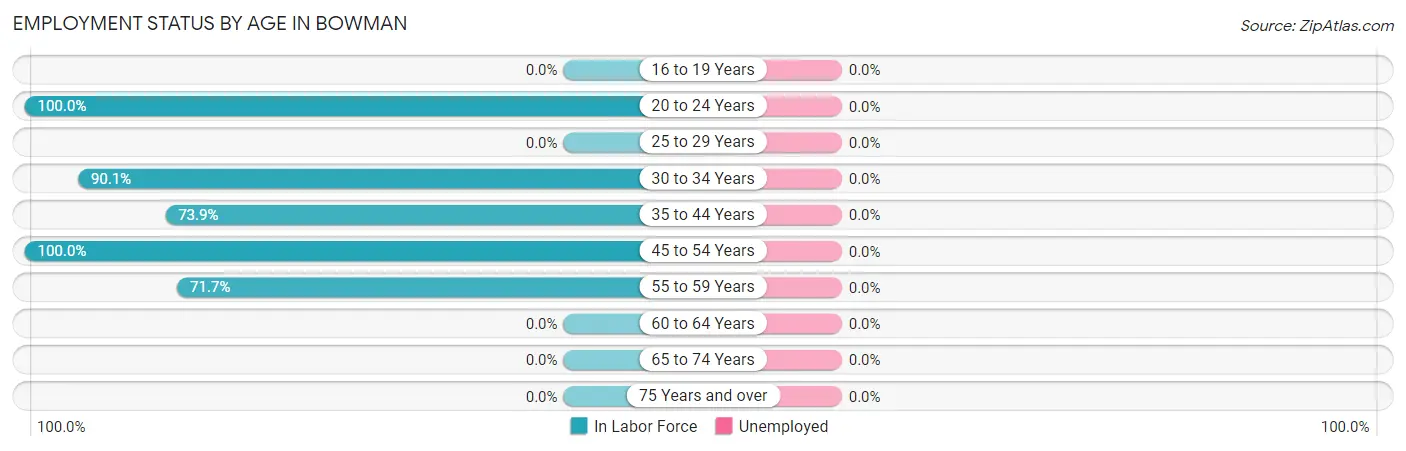
| Age Bracket | In Labor Force | Unemployed |
| 16 to 19 Years | 0 (0.0%) | 0 (0.0%) |
| 20 to 24 Years | 19 (100.0%) | 0 (0.0%) |
| 25 to 29 Years | 0 (0.0%) | 0 (0.0%) |
| 30 to 34 Years | 127 (90.1%) | 0 (0.0%) |
| 35 to 44 Years | 34 (73.9%) | 0 (0.0%) |
| 45 to 54 Years | 19 (100.0%) | 0 (0.0%) |
| 55 to 59 Years | 33 (71.7%) | 0 (0.0%) |
| 60 to 64 Years | 0 (0.0%) | 0 (0.0%) |
| 65 to 74 Years | 0 (0.0%) | 0 (0.0%) |
| 75 Years and over | 0 (0.0%) | 0 (0.0%) |
| Total | 232 (68.4%) | 0 (0.0%) |
Employment Status by Educational Attainment in Bowman
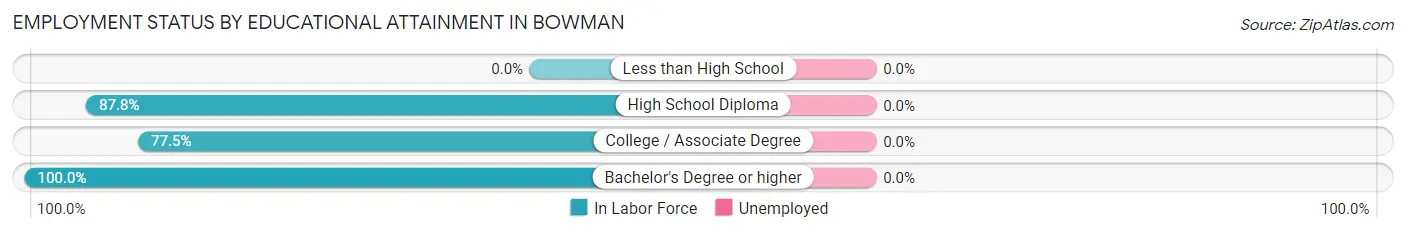
| Educational Attainment | In Labor Force | Unemployed |
| Less than High School | 0 (0.0%) | 0 (0.0%) |
| High School Diploma | 101 (87.8%) | 0 (0.0%) |
| College / Associate Degree | 86 (77.5%) | 0 (0.0%) |
| Bachelor's Degree or higher | 26 (100.0%) | 0 (0.0%) |
| Total | 213 (81.0%) | 0 (0.0%) |
Employment Occupations by Sex in Bowman
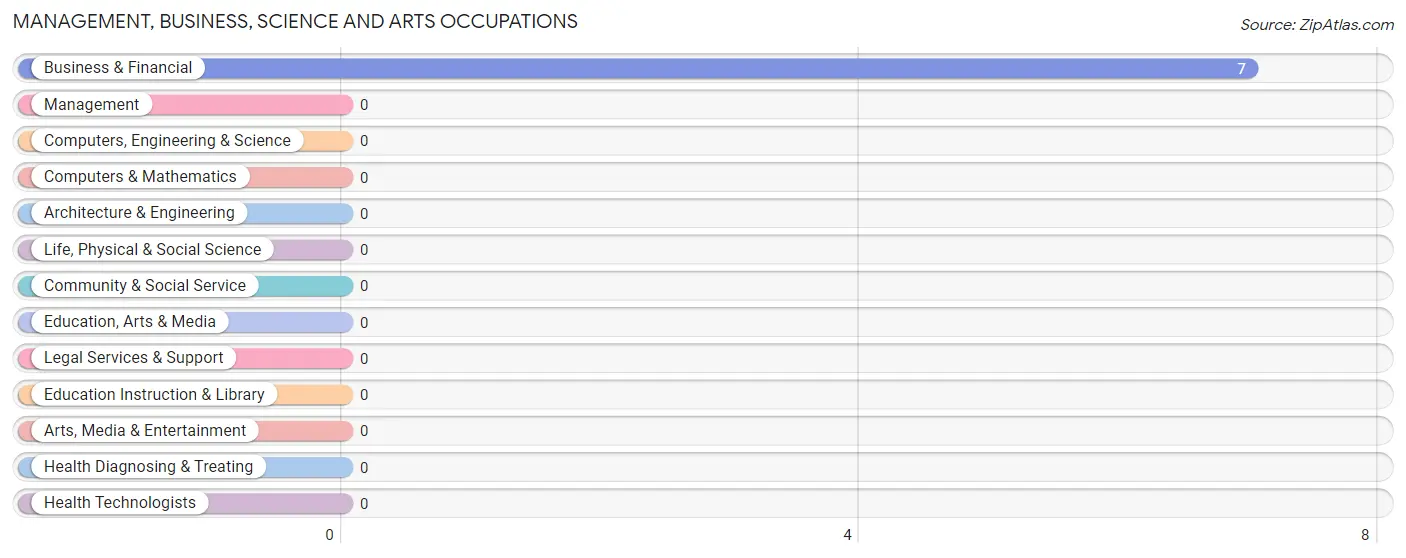
Management, Business, Science and Arts Occupations
The most common Management, Business, Science and Arts occupations in Bowman are , and Business & Financial (7 | 3.0%).
Management, Business, Science and Arts Occupations by Sex
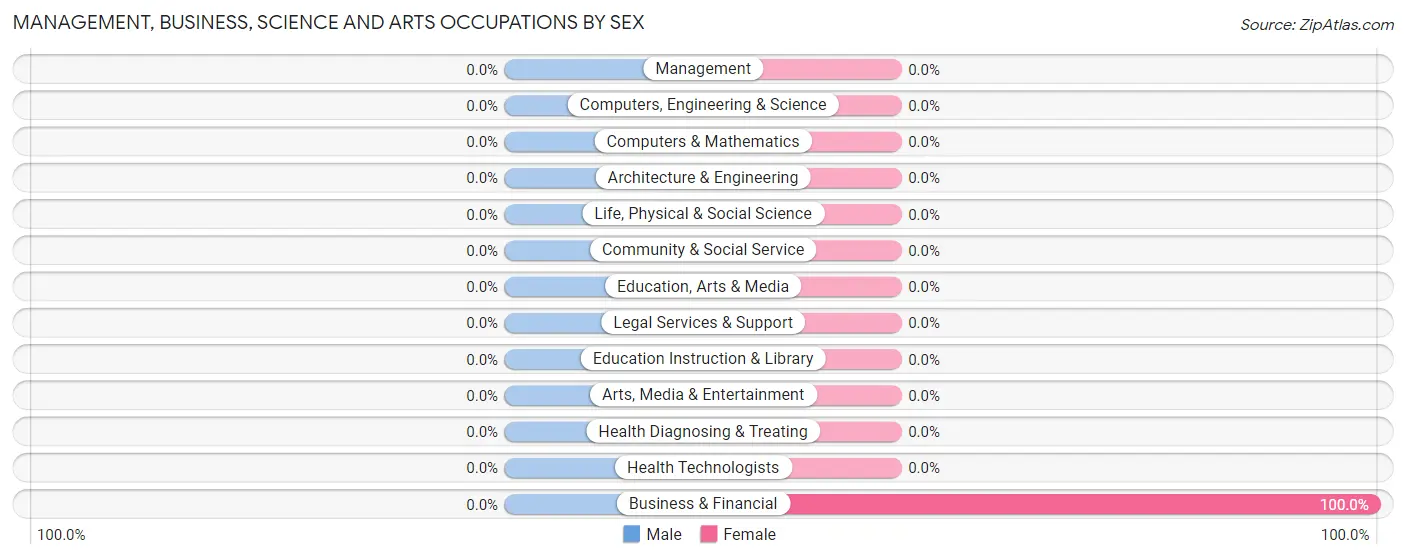
| Occupation | Male | Female |
| Management | 0 (0.0%) | 0 (0.0%) |
| Business & Financial | 0 (0.0%) | 7 (100.0%) |
| Computers, Engineering & Science | 0 (0.0%) | 0 (0.0%) |
| Computers & Mathematics | 0 (0.0%) | 0 (0.0%) |
| Architecture & Engineering | 0 (0.0%) | 0 (0.0%) |
| Life, Physical & Social Science | 0 (0.0%) | 0 (0.0%) |
| Community & Social Service | 0 (0.0%) | 0 (0.0%) |
| Education, Arts & Media | 0 (0.0%) | 0 (0.0%) |
| Legal Services & Support | 0 (0.0%) | 0 (0.0%) |
| Education Instruction & Library | 0 (0.0%) | 0 (0.0%) |
| Arts, Media & Entertainment | 0 (0.0%) | 0 (0.0%) |
| Health Diagnosing & Treating | 0 (0.0%) | 0 (0.0%) |
| Health Technologists | 0 (0.0%) | 0 (0.0%) |
| Total (Category) | 0 (0.0%) | 7 (100.0%) |
| Total (Overall) | 128 (55.2%) | 104 (44.8%) |
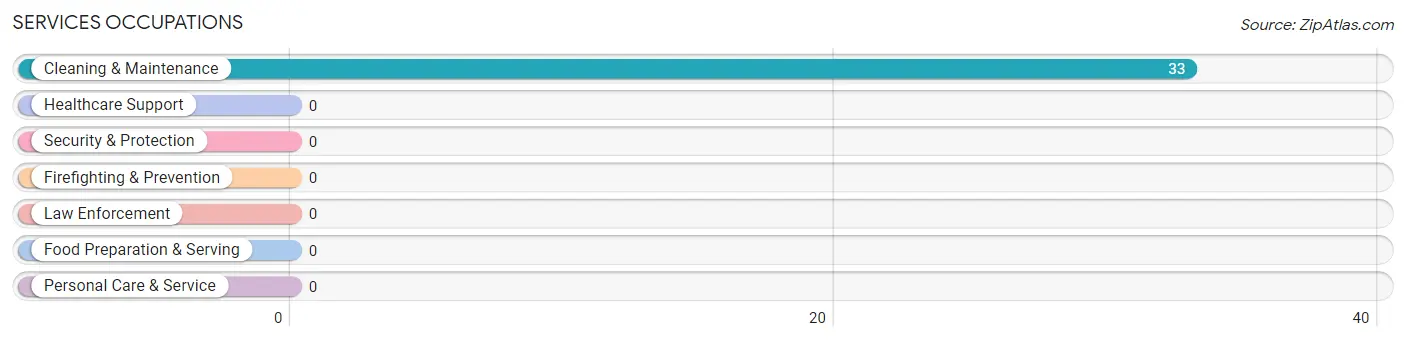
Services Occupations
The most common Services occupations in Bowman are , and Cleaning & Maintenance (33 | 14.2%).
Services Occupations by Sex
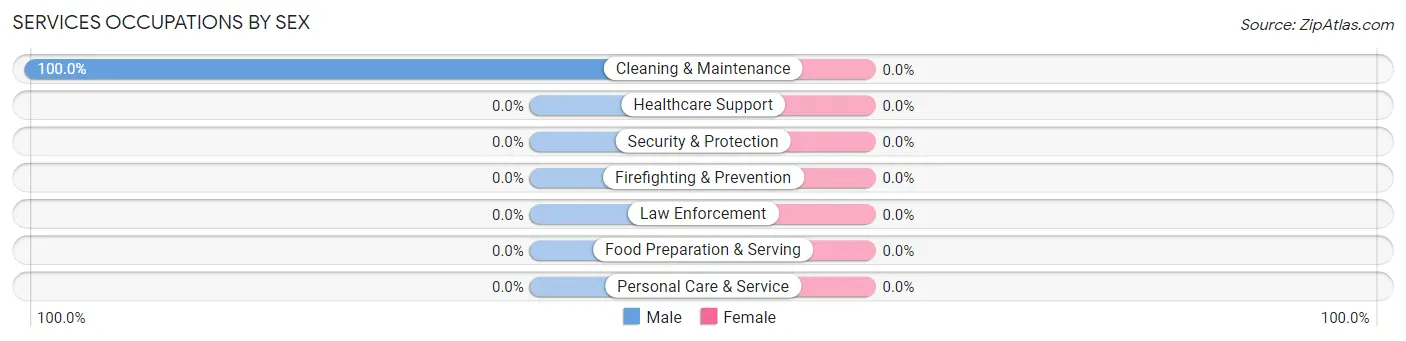
| Occupation | Male | Female |
| Healthcare Support | 0 (0.0%) | 0 (0.0%) |
| Security & Protection | 0 (0.0%) | 0 (0.0%) |
| Firefighting & Prevention | 0 (0.0%) | 0 (0.0%) |
| Law Enforcement | 0 (0.0%) | 0 (0.0%) |
| Food Preparation & Serving | 0 (0.0%) | 0 (0.0%) |
| Cleaning & Maintenance | 33 (100.0%) | 0 (0.0%) |
| Personal Care & Service | 0 (0.0%) | 0 (0.0%) |
| Total (Category) | 33 (100.0%) | 0 (0.0%) |
| Total (Overall) | 128 (55.2%) | 104 (44.8%) |
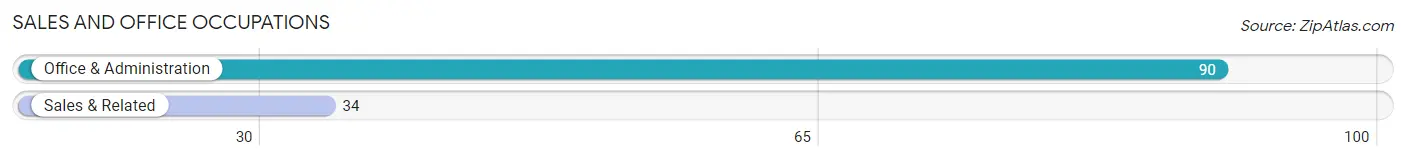
Sales and Office Occupations
The most common Sales and Office occupations in Bowman are Office & Administration (90 | 38.8%), and Sales & Related (34 | 14.7%).
Sales and Office Occupations by Sex
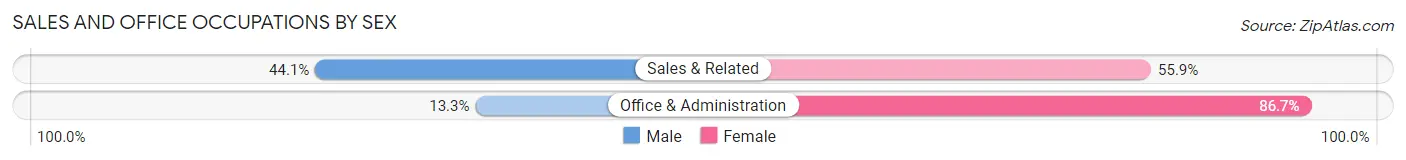
| Occupation | Male | Female |
| Sales & Related | 15 (44.1%) | 19 (55.9%) |
| Office & Administration | 12 (13.3%) | 78 (86.7%) |
| Total (Category) | 27 (21.8%) | 97 (78.2%) |
| Total (Overall) | 128 (55.2%) | 104 (44.8%) |
Natural Resources, Construction and Maintenance Occupations
Natural Resources, Construction and Maintenance Occupations by Sex
| Occupation | Male | Female |
| Farming, Fishing & Forestry | 0 (0.0%) | 0 (0.0%) |
| Construction & Extraction | 0 (0.0%) | 0 (0.0%) |
| Installation, Maintenance & Repair | 0 (0.0%) | 0 (0.0%) |
| Total (Category) | 0 (0.0%) | 0 (0.0%) |
| Total (Overall) | 128 (55.2%) | 104 (44.8%) |
Production, Transportation and Moving Occupations
The most common Production, Transportation and Moving occupations in Bowman are , and Material Moving (68 | 29.3%).
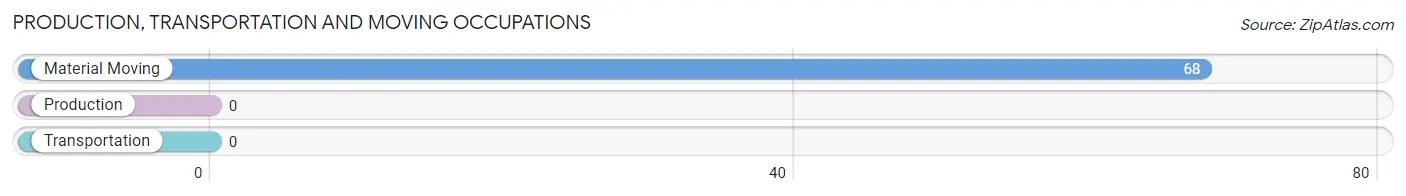
Production, Transportation and Moving Occupations by Sex
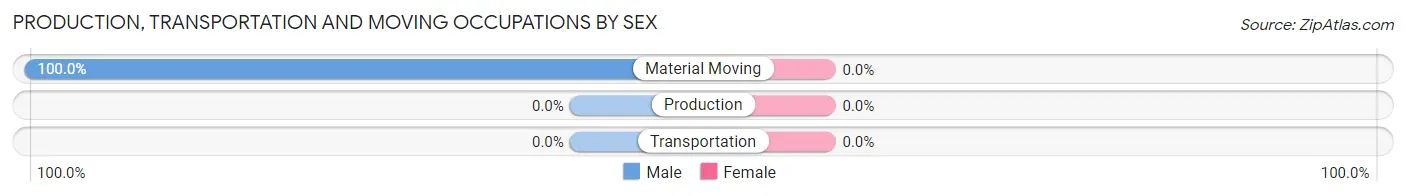
| Occupation | Male | Female |
| Production | 0 (0.0%) | 0 (0.0%) |
| Transportation | 0 (0.0%) | 0 (0.0%) |
| Material Moving | 68 (100.0%) | 0 (0.0%) |
| Total (Category) | 68 (100.0%) | 0 (0.0%) |
| Total (Overall) | 128 (55.2%) | 104 (44.8%) |
Employment Industries by Sex in Bowman
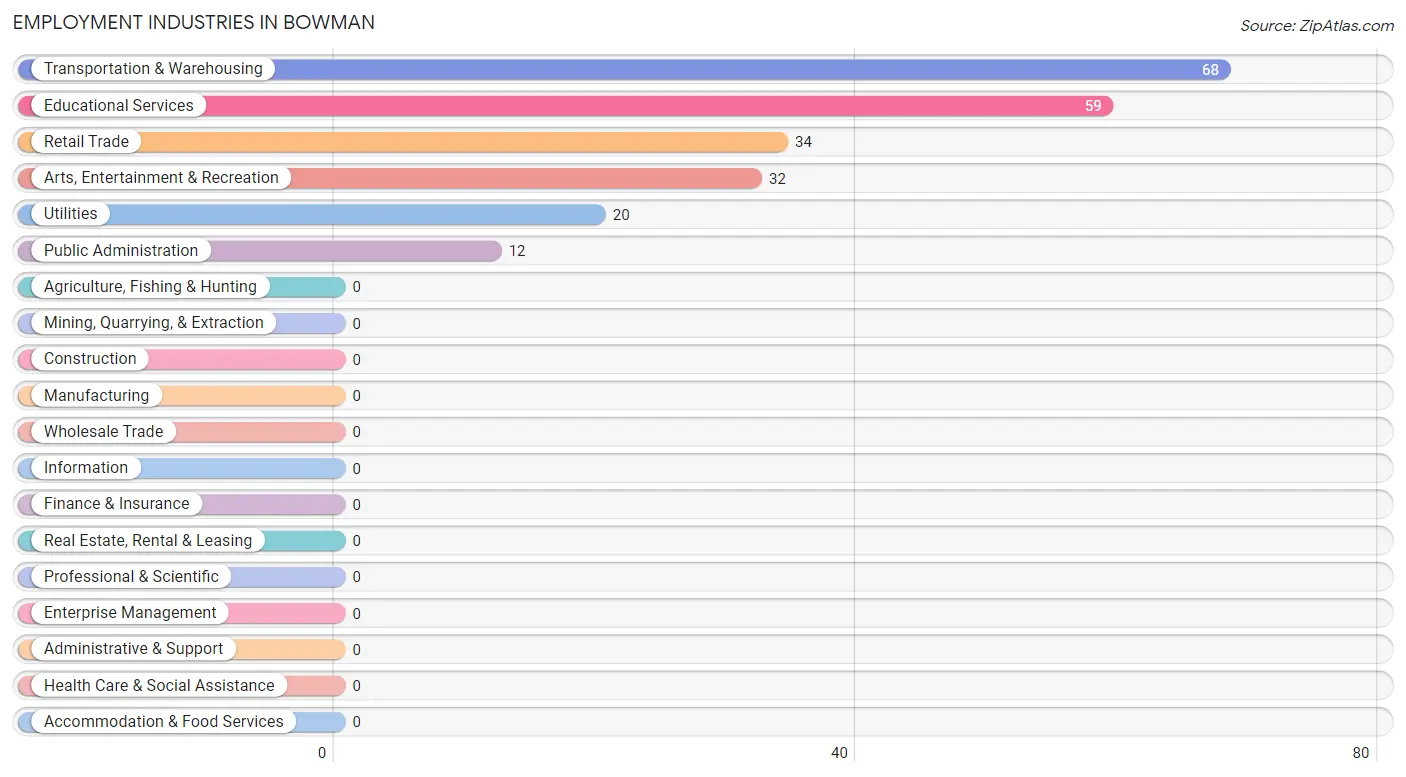
Employment Industries in Bowman
The major employment industries in Bowman include Transportation & Warehousing (68 | 29.3%), Educational Services (59 | 25.4%), Retail Trade (34 | 14.7%), Arts, Entertainment & Recreation (32 | 13.8%), and Utilities (20 | 8.6%).
Employment Industries by Sex in Bowman
The Bowman industries that see more men than women are Transportation & Warehousing (100.0%), Utilities (100.0%), and Public Administration (100.0%), whereas the industries that tend to have a higher number of women are Educational Services (100.0%), Arts, Entertainment & Recreation (59.4%), and Retail Trade (55.9%).
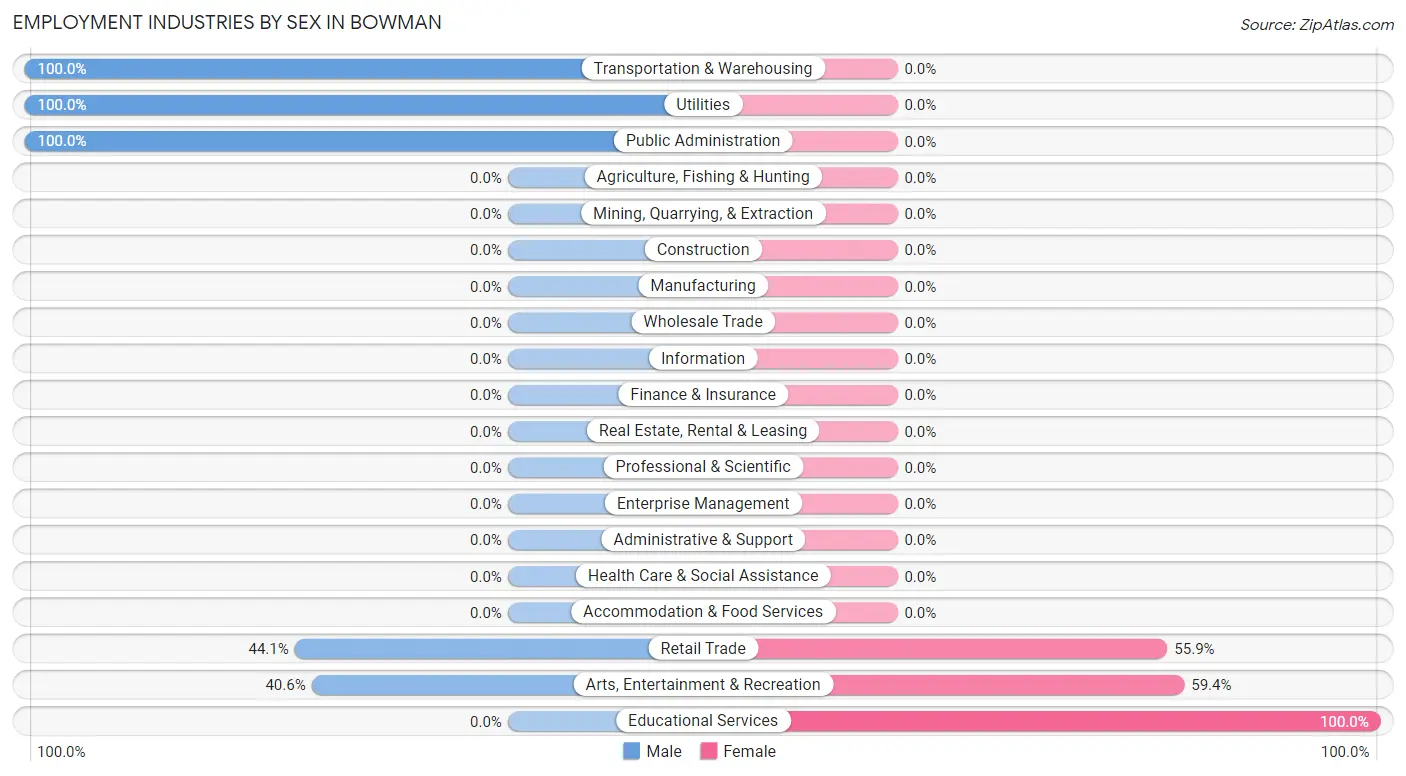
| Industry | Male | Female |
| Agriculture, Fishing & Hunting | 0 (0.0%) | 0 (0.0%) |
| Mining, Quarrying, & Extraction | 0 (0.0%) | 0 (0.0%) |
| Construction | 0 (0.0%) | 0 (0.0%) |
| Manufacturing | 0 (0.0%) | 0 (0.0%) |
| Wholesale Trade | 0 (0.0%) | 0 (0.0%) |
| Retail Trade | 15 (44.1%) | 19 (55.9%) |
| Transportation & Warehousing | 68 (100.0%) | 0 (0.0%) |
| Utilities | 20 (100.0%) | 0 (0.0%) |
| Information | 0 (0.0%) | 0 (0.0%) |
| Finance & Insurance | 0 (0.0%) | 0 (0.0%) |
| Real Estate, Rental & Leasing | 0 (0.0%) | 0 (0.0%) |
| Professional & Scientific | 0 (0.0%) | 0 (0.0%) |
| Enterprise Management | 0 (0.0%) | 0 (0.0%) |
| Administrative & Support | 0 (0.0%) | 0 (0.0%) |
| Educational Services | 0 (0.0%) | 59 (100.0%) |
| Health Care & Social Assistance | 0 (0.0%) | 0 (0.0%) |
| Arts, Entertainment & Recreation | 13 (40.6%) | 19 (59.4%) |
| Accommodation & Food Services | 0 (0.0%) | 0 (0.0%) |
| Public Administration | 12 (100.0%) | 0 (0.0%) |
| Total | 128 (55.2%) | 104 (44.8%) |
Education in Bowman
School Enrollment in Bowman
The most common levels of schooling among the 73 students in Bowman are middle school (54 | 74.0%), and college / undergraduate (19 | 26.0%).
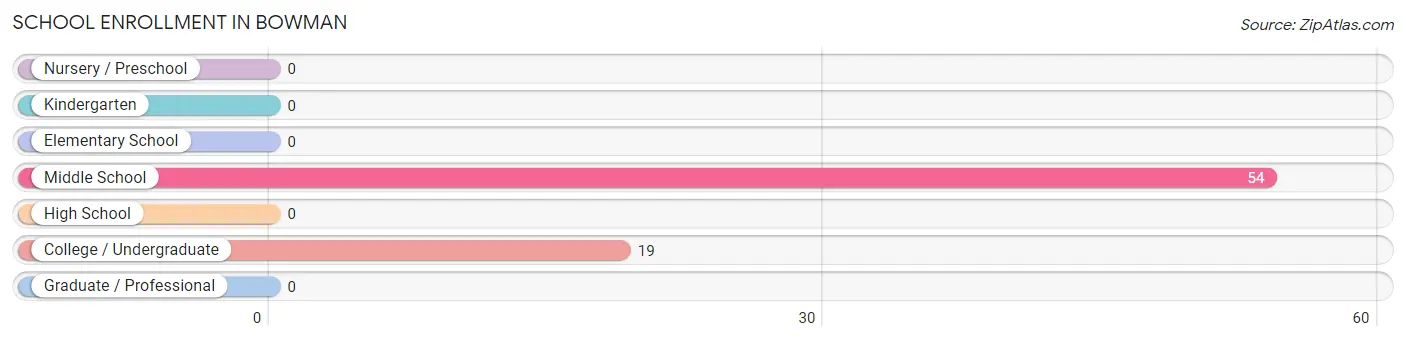
| School Level | # Students | % Students |
| Nursery / Preschool | 0 | 0.0% |
| Kindergarten | 0 | 0.0% |
| Elementary School | 0 | 0.0% |
| Middle School | 54 | 74.0% |
| High School | 0 | 0.0% |
| College / Undergraduate | 19 | 26.0% |
| Graduate / Professional | 0 | 0.0% |
| Total | 73 | 100.0% |
School Enrollment by Age by Funding Source in Bowman
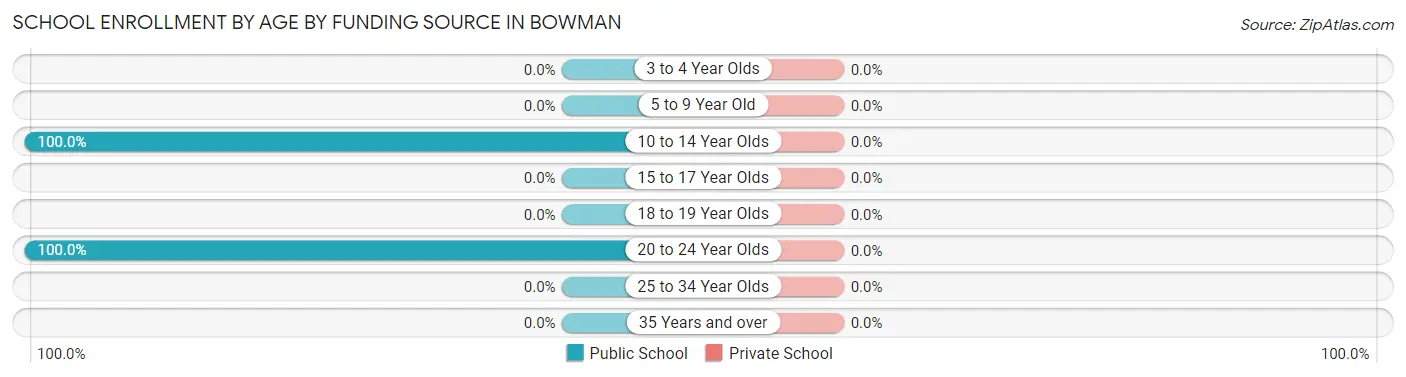
| Age Bracket | Public School | Private School |
| 3 to 4 Year Olds | 0 (0.0%) | 0 (0.0%) |
| 5 to 9 Year Old | 0 (0.0%) | 0 (0.0%) |
| 10 to 14 Year Olds | 54 (100.0%) | 0 (0.0%) |
| 15 to 17 Year Olds | 0 (0.0%) | 0 (0.0%) |
| 18 to 19 Year Olds | 0 (0.0%) | 0 (0.0%) |
| 20 to 24 Year Olds | 19 (100.0%) | 0 (0.0%) |
| 25 to 34 Year Olds | 0 (0.0%) | 0 (0.0%) |
| 35 Years and over | 0 (0.0%) | 0 (0.0%) |
| Total | 73 (100.0%) | 0 (0.0%) |
Educational Attainment by Field of Study in Bowman
Visual & performing arts (19 | 32.8%), literature & languages (16 | 27.6%), arts & humanities (16 | 27.6%), and business (7 | 12.1%) are the most common fields of study among 58 individuals in Bowman who have obtained a bachelor's degree or higher.
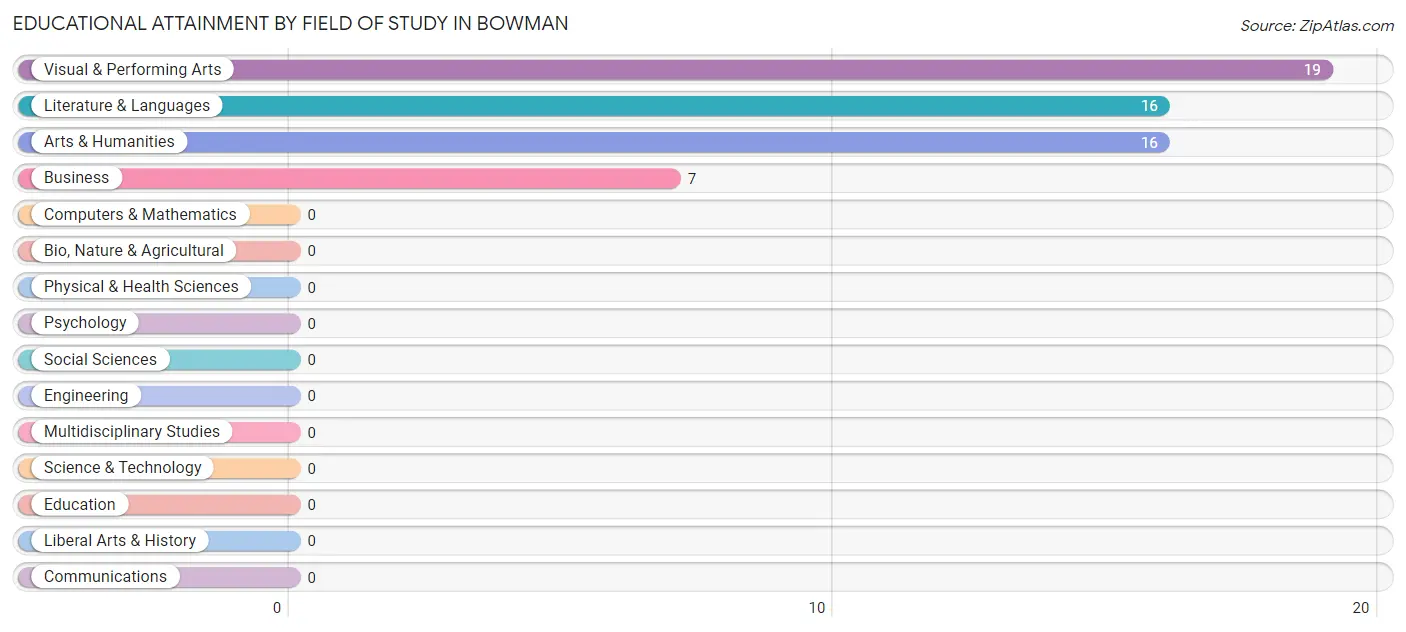
| Field of Study | # Graduates | % Graduates |
| Computers & Mathematics | 0 | 0.0% |
| Bio, Nature & Agricultural | 0 | 0.0% |
| Physical & Health Sciences | 0 | 0.0% |
| Psychology | 0 | 0.0% |
| Social Sciences | 0 | 0.0% |
| Engineering | 0 | 0.0% |
| Multidisciplinary Studies | 0 | 0.0% |
| Science & Technology | 0 | 0.0% |
| Business | 7 | 12.1% |
| Education | 0 | 0.0% |
| Literature & Languages | 16 | 27.6% |
| Liberal Arts & History | 0 | 0.0% |
| Visual & Performing Arts | 19 | 32.8% |
| Communications | 0 | 0.0% |
| Arts & Humanities | 16 | 27.6% |
| Total | 58 | 100.0% |
Transportation & Commute in Bowman
Vehicle Availability by Sex in Bowman
The most prevalent vehicle ownership categories in Bowman are males with 2 vehicles (93, accounting for 72.7%) and females with 2 vehicles (59, making up 89.4%).
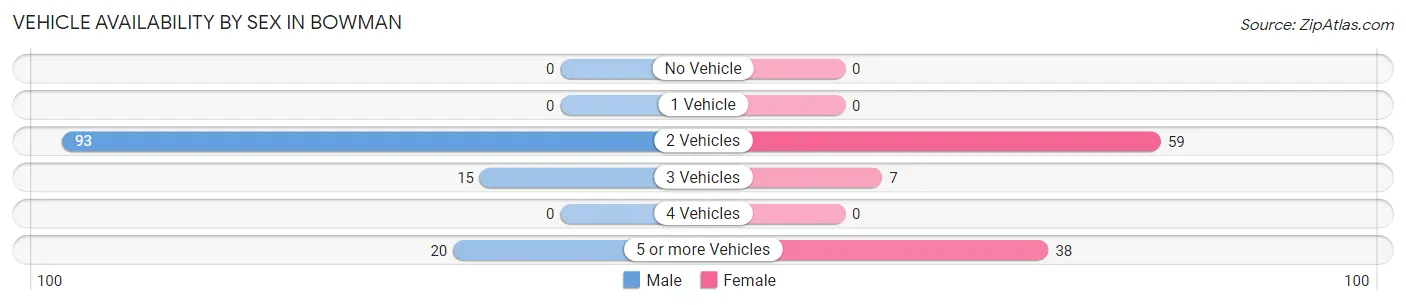
| Vehicles Available | Male | Female |
| No Vehicle | 0 (0.0%) | 0 (0.0%) |
| 1 Vehicle | 0 (0.0%) | 0 (0.0%) |
| 2 Vehicles | 93 (72.7%) | 59 (56.7%) |
| 3 Vehicles | 15 (11.7%) | 7 (6.7%) |
| 4 Vehicles | 0 (0.0%) | 0 (0.0%) |
| 5 or more Vehicles | 20 (15.6%) | 38 (36.5%) |
| Total | 128 (100.0%) | 104 (100.0%) |
Commute Time in Bowman
The most frequently occuring commute durations in Bowman are 10 to 14 minutes (127 commuters, 54.7%), 15 to 19 minutes (39 commuters, 16.8%), and 45 to 59 minutes (28 commuters, 12.1%).
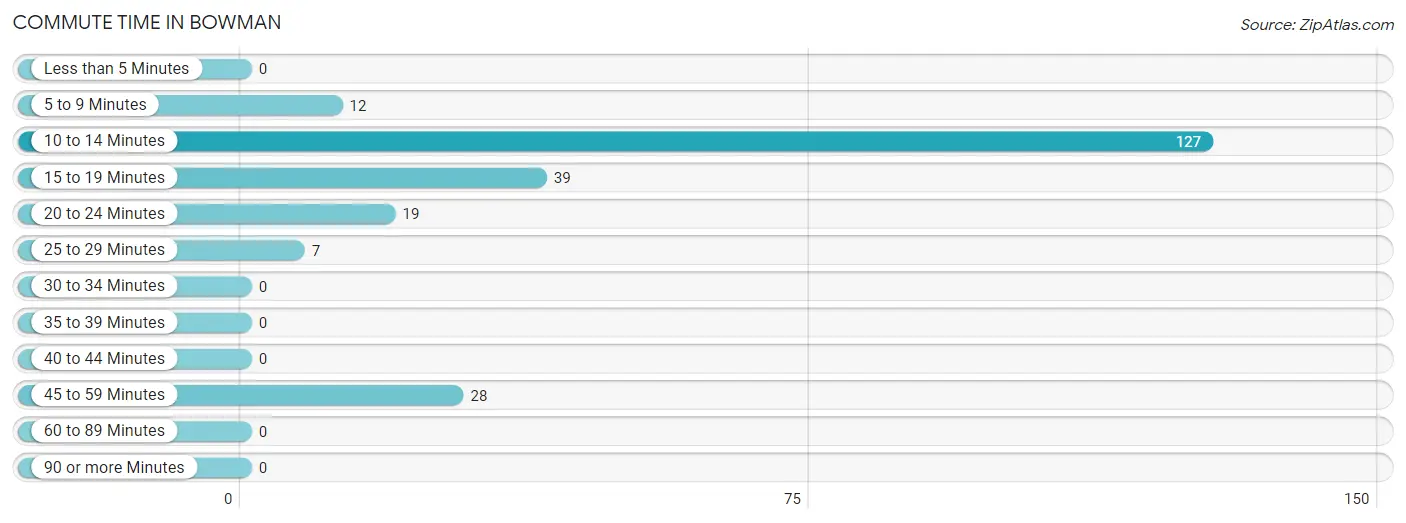
| Commute Time | # Commuters | % Commuters |
| Less than 5 Minutes | 0 | 0.0% |
| 5 to 9 Minutes | 12 | 5.2% |
| 10 to 14 Minutes | 127 | 54.7% |
| 15 to 19 Minutes | 39 | 16.8% |
| 20 to 24 Minutes | 19 | 8.2% |
| 25 to 29 Minutes | 7 | 3.0% |
| 30 to 34 Minutes | 0 | 0.0% |
| 35 to 39 Minutes | 0 | 0.0% |
| 40 to 44 Minutes | 0 | 0.0% |
| 45 to 59 Minutes | 28 | 12.1% |
| 60 to 89 Minutes | 0 | 0.0% |
| 90 or more Minutes | 0 | 0.0% |
Commute Time by Sex in Bowman
The most common commute times in Bowman are 10 to 14 minutes (68 commuters, 53.1%) for males and 10 to 14 minutes (59 commuters, 56.7%) for females.
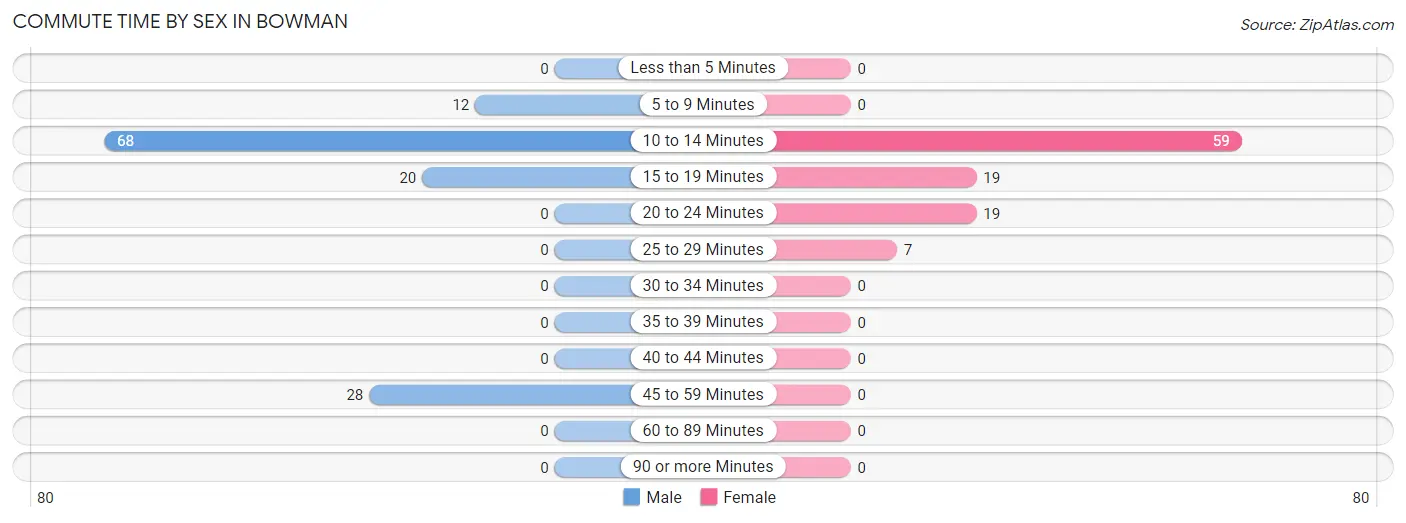
| Commute Time | Male | Female |
| Less than 5 Minutes | 0 (0.0%) | 0 (0.0%) |
| 5 to 9 Minutes | 12 (9.4%) | 0 (0.0%) |
| 10 to 14 Minutes | 68 (53.1%) | 59 (56.7%) |
| 15 to 19 Minutes | 20 (15.6%) | 19 (18.3%) |
| 20 to 24 Minutes | 0 (0.0%) | 19 (18.3%) |
| 25 to 29 Minutes | 0 (0.0%) | 7 (6.7%) |
| 30 to 34 Minutes | 0 (0.0%) | 0 (0.0%) |
| 35 to 39 Minutes | 0 (0.0%) | 0 (0.0%) |
| 40 to 44 Minutes | 0 (0.0%) | 0 (0.0%) |
| 45 to 59 Minutes | 28 (21.9%) | 0 (0.0%) |
| 60 to 89 Minutes | 0 (0.0%) | 0 (0.0%) |
| 90 or more Minutes | 0 (0.0%) | 0 (0.0%) |
Time of Departure to Work by Sex in Bowman
The most frequent times of departure to work in Bowman are 6:30 AM to 6:59 AM (68, 53.1%) for males and 7:00 AM to 7:29 AM (104, 100.0%) for females.
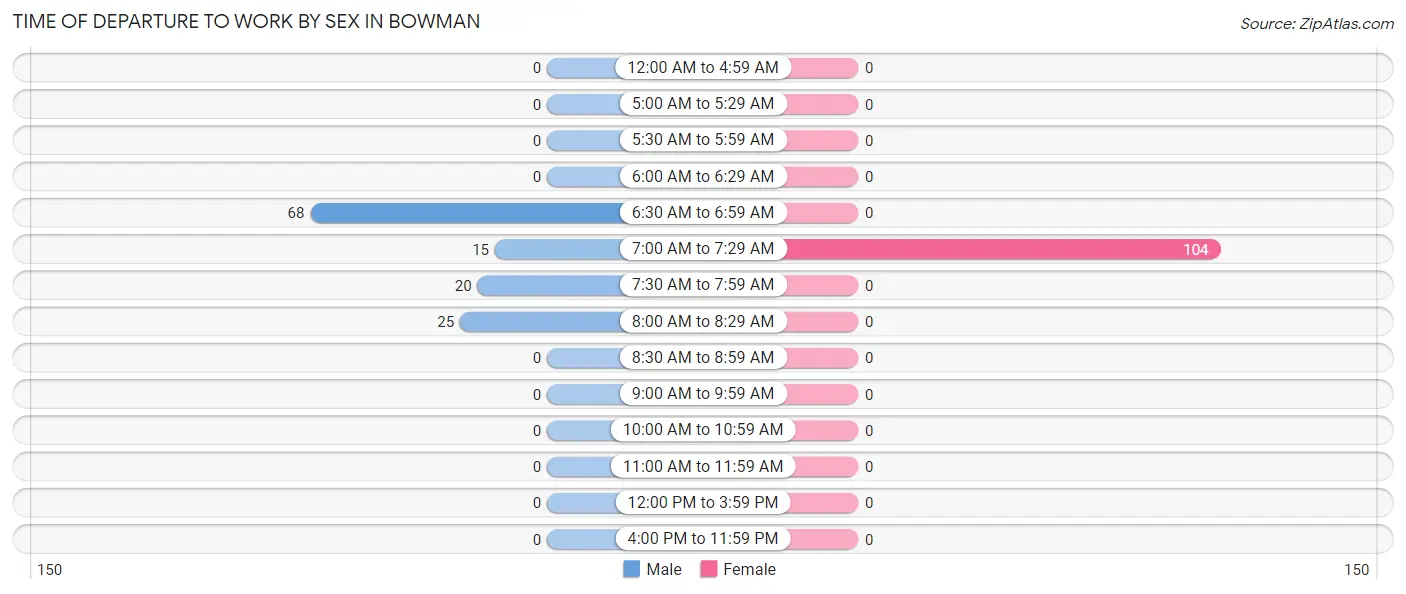
| Time of Departure | Male | Female |
| 12:00 AM to 4:59 AM | 0 (0.0%) | 0 (0.0%) |
| 5:00 AM to 5:29 AM | 0 (0.0%) | 0 (0.0%) |
| 5:30 AM to 5:59 AM | 0 (0.0%) | 0 (0.0%) |
| 6:00 AM to 6:29 AM | 0 (0.0%) | 0 (0.0%) |
| 6:30 AM to 6:59 AM | 68 (53.1%) | 0 (0.0%) |
| 7:00 AM to 7:29 AM | 15 (11.7%) | 104 (100.0%) |
| 7:30 AM to 7:59 AM | 20 (15.6%) | 0 (0.0%) |
| 8:00 AM to 8:29 AM | 25 (19.5%) | 0 (0.0%) |
| 8:30 AM to 8:59 AM | 0 (0.0%) | 0 (0.0%) |
| 9:00 AM to 9:59 AM | 0 (0.0%) | 0 (0.0%) |
| 10:00 AM to 10:59 AM | 0 (0.0%) | 0 (0.0%) |
| 11:00 AM to 11:59 AM | 0 (0.0%) | 0 (0.0%) |
| 12:00 PM to 3:59 PM | 0 (0.0%) | 0 (0.0%) |
| 4:00 PM to 11:59 PM | 0 (0.0%) | 0 (0.0%) |
| Total | 128 (100.0%) | 104 (100.0%) |
Housing Occupancy in Bowman
Occupancy by Ownership in Bowman
Of the total 166 dwellings in Bowman, owner-occupied units account for 149 (89.8%), while renter-occupied units make up 17 (10.2%).
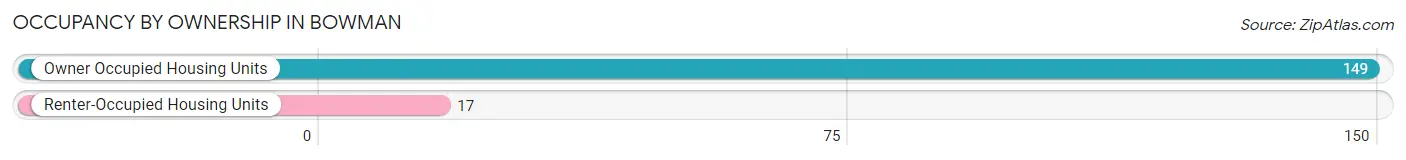
| Occupancy | # Housing Units | % Housing Units |
| Owner Occupied Housing Units | 149 | 89.8% |
| Renter-Occupied Housing Units | 17 | 10.2% |
| Total Occupied Housing Units | 166 | 100.0% |
Occupancy by Household Size in Bowman
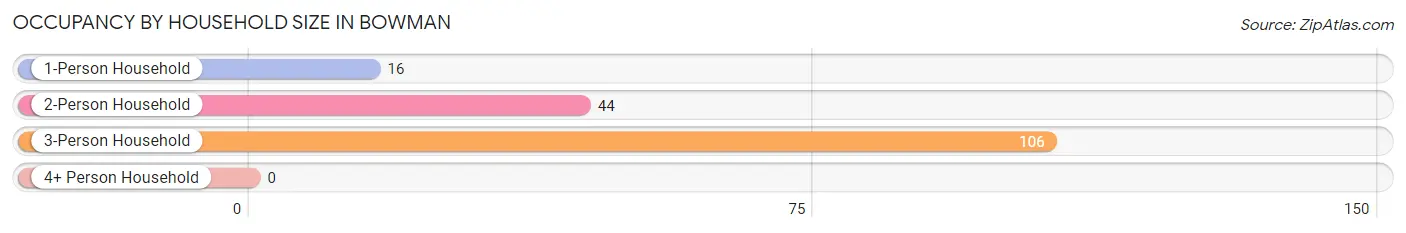
| Household Size | # Housing Units | % Housing Units |
| 1-Person Household | 16 | 9.6% |
| 2-Person Household | 44 | 26.5% |
| 3-Person Household | 106 | 63.9% |
| 4+ Person Household | 0 | 0.0% |
| Total Housing Units | 166 | 100.0% |
Occupancy by Ownership by Household Size in Bowman
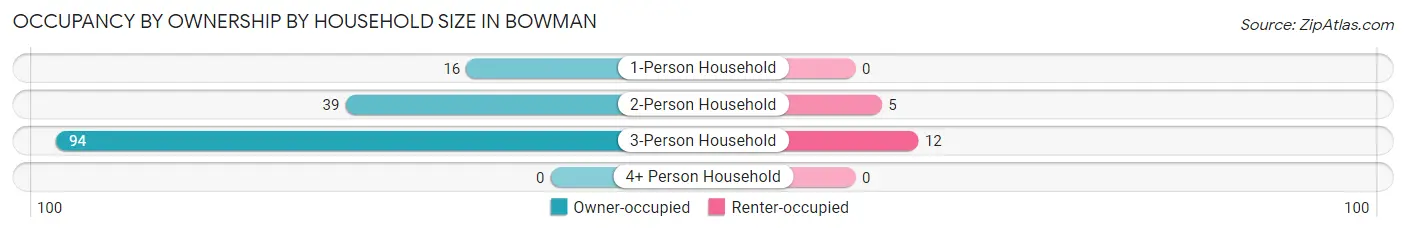
| Household Size | Owner-occupied | Renter-occupied |
| 1-Person Household | 16 (100.0%) | 0 (0.0%) |
| 2-Person Household | 39 (88.6%) | 5 (11.4%) |
| 3-Person Household | 94 (88.7%) | 12 (11.3%) |
| 4+ Person Household | 0 (0.0%) | 0 (0.0%) |
| Total Housing Units | 149 (89.8%) | 17 (10.2%) |
Occupancy by Educational Attainment in Bowman
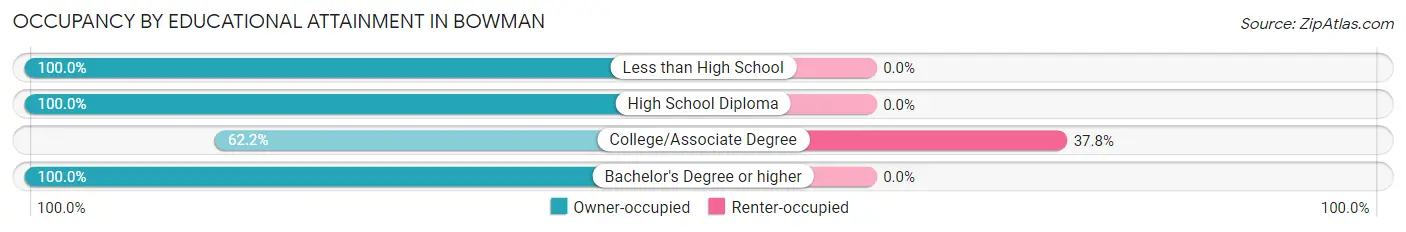
| Household Size | Owner-occupied | Renter-occupied |
| Less than High School | 11 (100.0%) | 0 (0.0%) |
| High School Diploma | 68 (100.0%) | 0 (0.0%) |
| College/Associate Degree | 28 (62.2%) | 17 (37.8%) |
| Bachelor's Degree or higher | 42 (100.0%) | 0 (0.0%) |
Occupancy by Age of Householder in Bowman
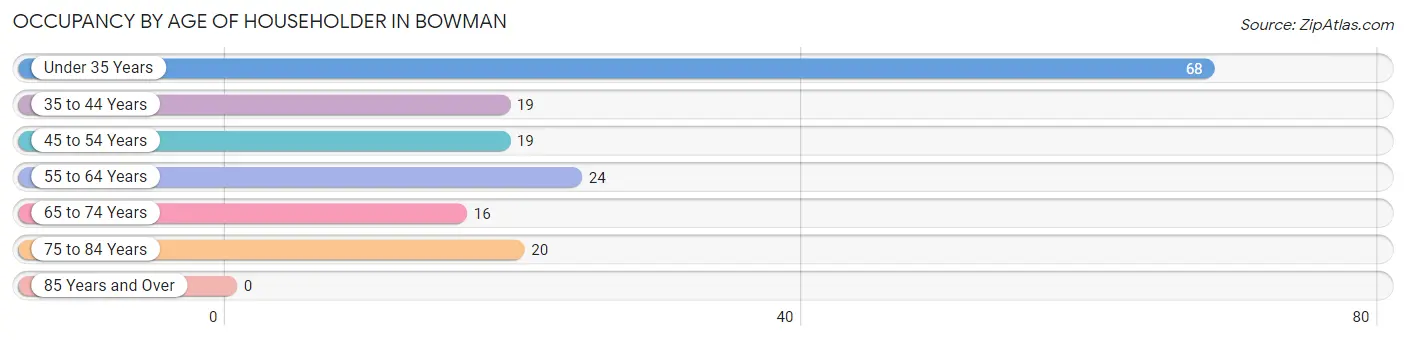
| Age Bracket | # Households | % Households |
| Under 35 Years | 68 | 41.0% |
| 35 to 44 Years | 19 | 11.5% |
| 45 to 54 Years | 19 | 11.5% |
| 55 to 64 Years | 24 | 14.5% |
| 65 to 74 Years | 16 | 9.6% |
| 75 to 84 Years | 20 | 12.0% |
| 85 Years and Over | 0 | 0.0% |
| Total | 166 | 100.0% |
Housing Finances in Bowman
Median Income by Occupancy in Bowman
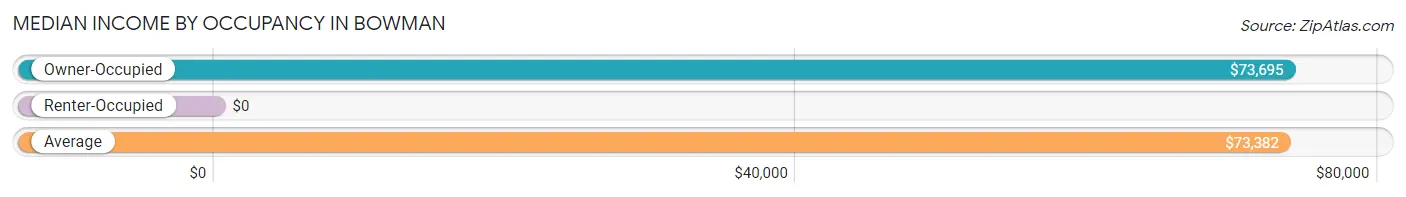
| Occupancy Type | # Households | Median Income |
| Owner-Occupied | 149 (89.8%) | $73,695 |
| Renter-Occupied | 17 (10.2%) | $0 |
| Average | 166 (100.0%) | $73,382 |
Occupancy by Householder Income Bracket in Bowman
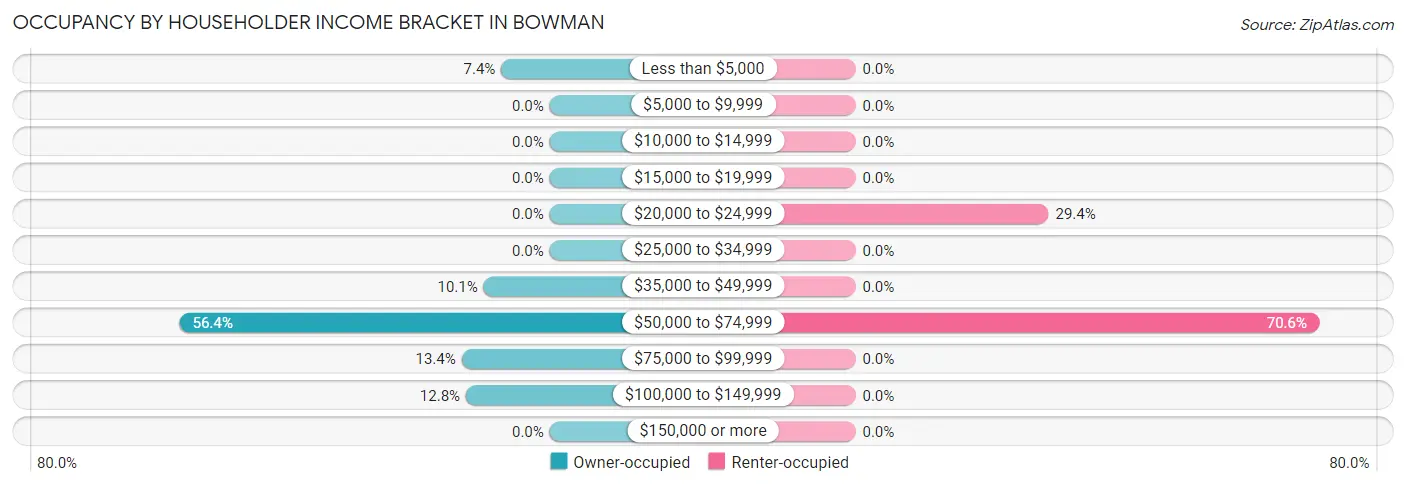
| Income Bracket | Owner-occupied | Renter-occupied |
| Less than $5,000 | 11 (7.4%) | 0 (0.0%) |
| $5,000 to $9,999 | 0 (0.0%) | 0 (0.0%) |
| $10,000 to $14,999 | 0 (0.0%) | 0 (0.0%) |
| $15,000 to $19,999 | 0 (0.0%) | 0 (0.0%) |
| $20,000 to $24,999 | 0 (0.0%) | 5 (29.4%) |
| $25,000 to $34,999 | 0 (0.0%) | 0 (0.0%) |
| $35,000 to $49,999 | 15 (10.1%) | 0 (0.0%) |
| $50,000 to $74,999 | 84 (56.4%) | 12 (70.6%) |
| $75,000 to $99,999 | 20 (13.4%) | 0 (0.0%) |
| $100,000 to $149,999 | 19 (12.8%) | 0 (0.0%) |
| $150,000 or more | 0 (0.0%) | 0 (0.0%) |
| Total | 149 (100.0%) | 17 (100.0%) |
Monthly Housing Cost Tiers in Bowman
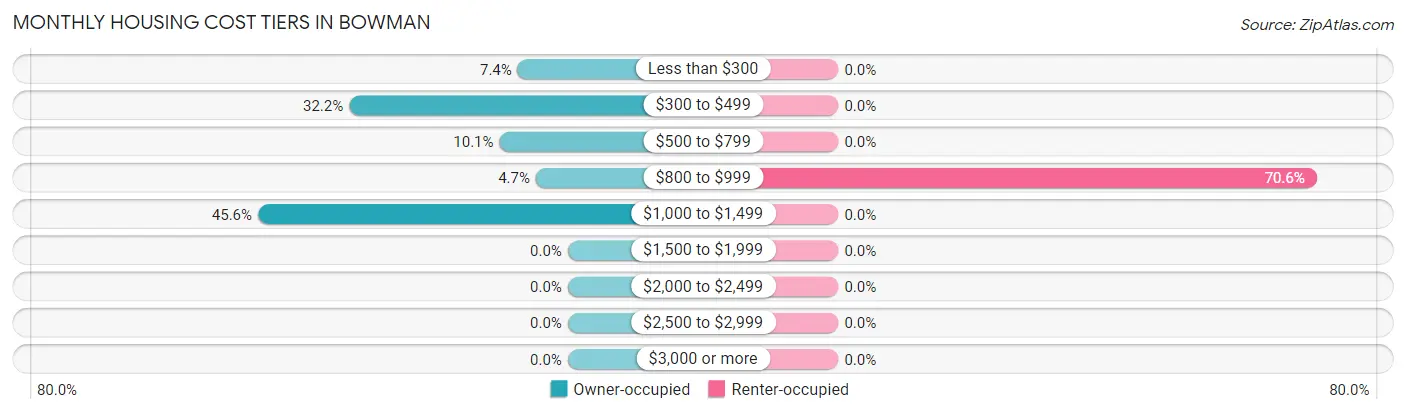
| Monthly Cost | Owner-occupied | Renter-occupied |
| Less than $300 | 11 (7.4%) | 0 (0.0%) |
| $300 to $499 | 48 (32.2%) | 0 (0.0%) |
| $500 to $799 | 15 (10.1%) | 0 (0.0%) |
| $800 to $999 | 7 (4.7%) | 12 (70.6%) |
| $1,000 to $1,499 | 68 (45.6%) | 0 (0.0%) |
| $1,500 to $1,999 | 0 (0.0%) | 0 (0.0%) |
| $2,000 to $2,499 | 0 (0.0%) | 0 (0.0%) |
| $2,500 to $2,999 | 0 (0.0%) | 0 (0.0%) |
| $3,000 or more | 0 (0.0%) | 0 (0.0%) |
| Total | 149 (100.0%) | 17 (100.0%) |
Physical Housing Characteristics in Bowman
Housing Structures in Bowman
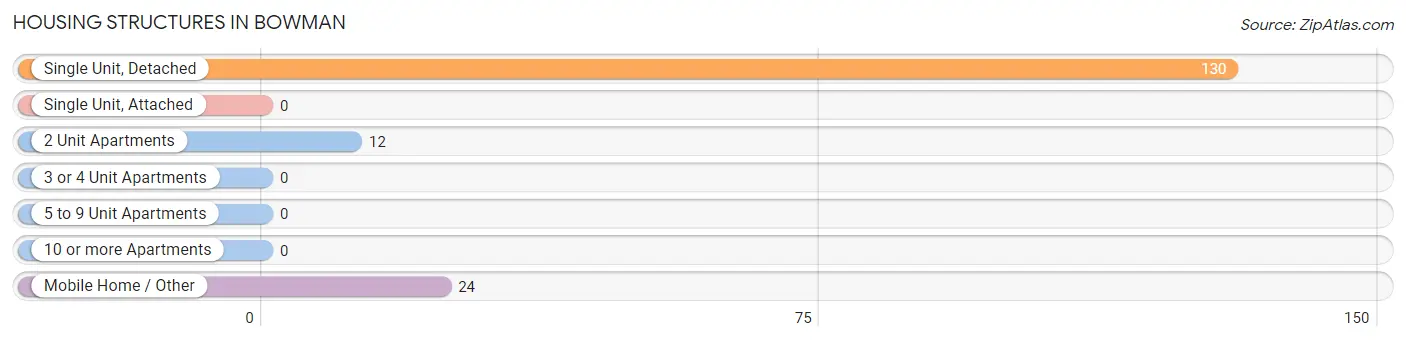
| Structure Type | # Housing Units | % Housing Units |
| Single Unit, Detached | 130 | 78.3% |
| Single Unit, Attached | 0 | 0.0% |
| 2 Unit Apartments | 12 | 7.2% |
| 3 or 4 Unit Apartments | 0 | 0.0% |
| 5 to 9 Unit Apartments | 0 | 0.0% |
| 10 or more Apartments | 0 | 0.0% |
| Mobile Home / Other | 24 | 14.5% |
| Total | 166 | 100.0% |
Housing Structures by Occupancy in Bowman
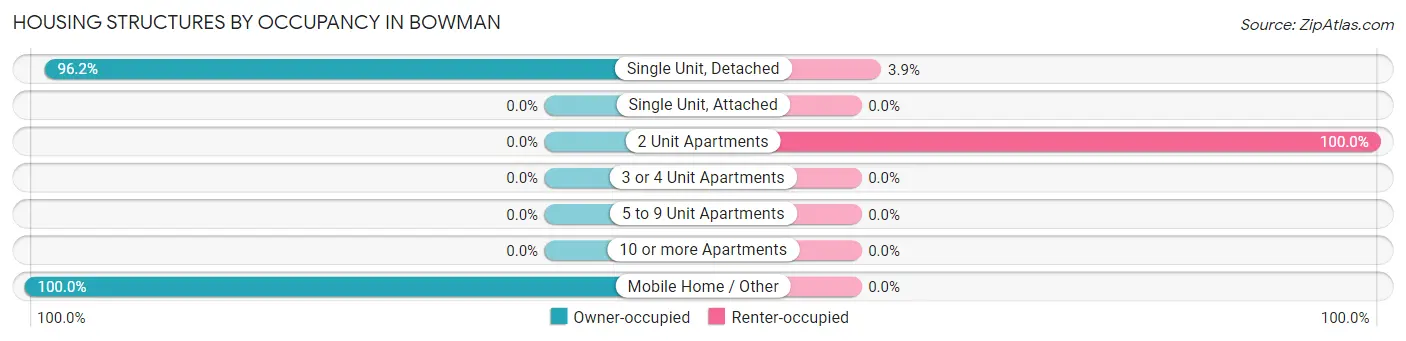
| Structure Type | Owner-occupied | Renter-occupied |
| Single Unit, Detached | 125 (96.2%) | 5 (3.8%) |
| Single Unit, Attached | 0 (0.0%) | 0 (0.0%) |
| 2 Unit Apartments | 0 (0.0%) | 12 (100.0%) |
| 3 or 4 Unit Apartments | 0 (0.0%) | 0 (0.0%) |
| 5 to 9 Unit Apartments | 0 (0.0%) | 0 (0.0%) |
| 10 or more Apartments | 0 (0.0%) | 0 (0.0%) |
| Mobile Home / Other | 24 (100.0%) | 0 (0.0%) |
| Total | 149 (89.8%) | 17 (10.2%) |
Housing Structures by Number of Rooms in Bowman
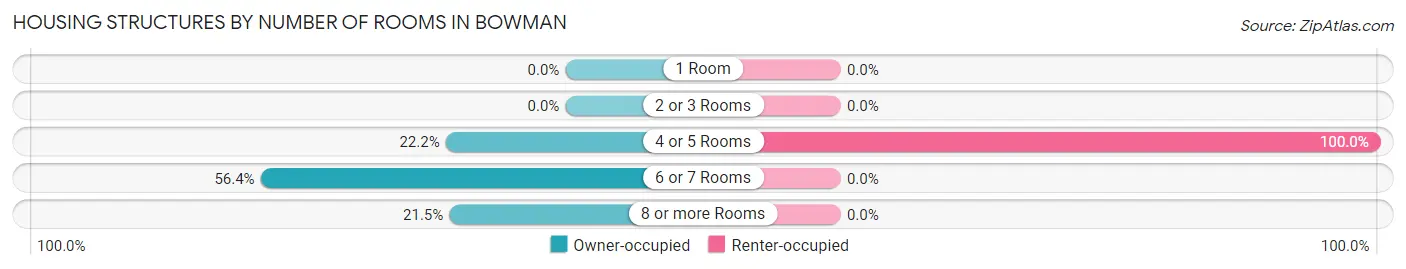
| Number of Rooms | Owner-occupied | Renter-occupied |
| 1 Room | 0 (0.0%) | 0 (0.0%) |
| 2 or 3 Rooms | 0 (0.0%) | 0 (0.0%) |
| 4 or 5 Rooms | 33 (22.2%) | 17 (100.0%) |
| 6 or 7 Rooms | 84 (56.4%) | 0 (0.0%) |
| 8 or more Rooms | 32 (21.5%) | 0 (0.0%) |
| Total | 149 (100.0%) | 17 (100.0%) |
Housing Structure by Heating Type in Bowman
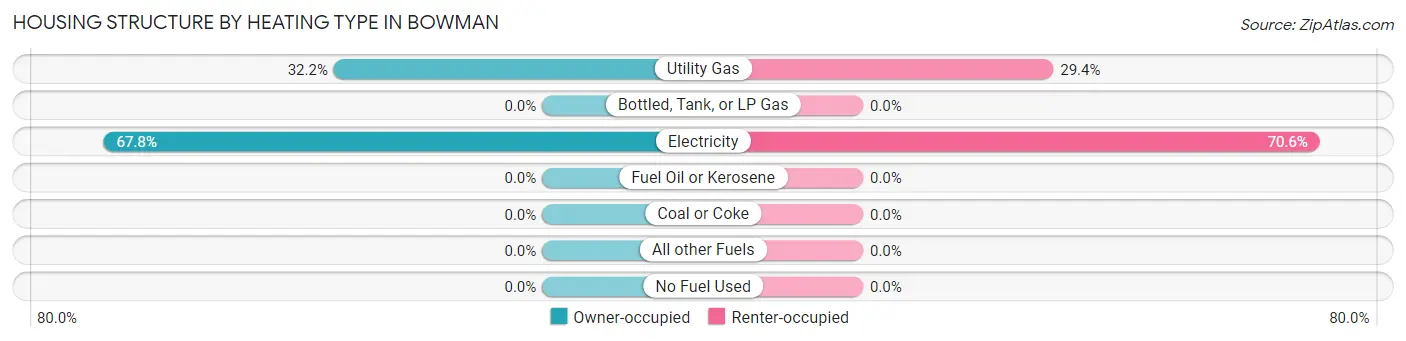
| Heating Type | Owner-occupied | Renter-occupied |
| Utility Gas | 48 (32.2%) | 5 (29.4%) |
| Bottled, Tank, or LP Gas | 0 (0.0%) | 0 (0.0%) |
| Electricity | 101 (67.8%) | 12 (70.6%) |
| Fuel Oil or Kerosene | 0 (0.0%) | 0 (0.0%) |
| Coal or Coke | 0 (0.0%) | 0 (0.0%) |
| All other Fuels | 0 (0.0%) | 0 (0.0%) |
| No Fuel Used | 0 (0.0%) | 0 (0.0%) |
| Total | 149 (100.0%) | 17 (100.0%) |
Household Vehicle Usage in Bowman
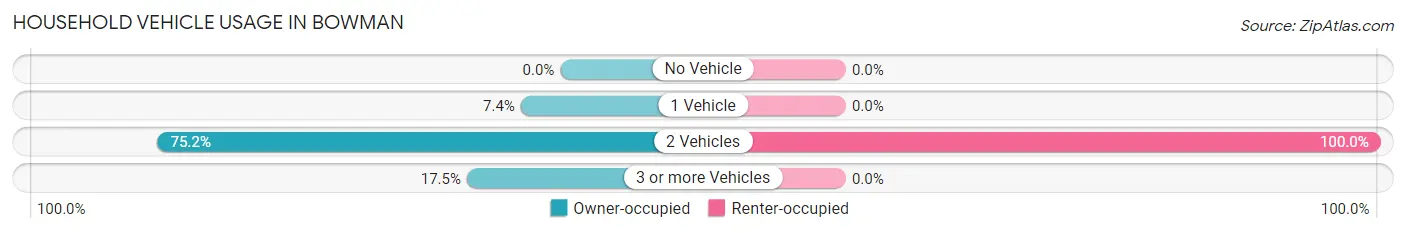
| Vehicles per Household | Owner-occupied | Renter-occupied |
| No Vehicle | 0 (0.0%) | 0 (0.0%) |
| 1 Vehicle | 11 (7.4%) | 0 (0.0%) |
| 2 Vehicles | 112 (75.2%) | 17 (100.0%) |
| 3 or more Vehicles | 26 (17.4%) | 0 (0.0%) |
| Total | 149 (100.0%) | 17 (100.0%) |
Real Estate & Mortgages in Bowman
Real Estate and Mortgage Overview in Bowman
| Characteristic | Without Mortgage | With Mortgage |
| Housing Units | 74 | 75 |
| Median Property Value | - | - |
| Median Household Income | $61,719 | $0 |
| Monthly Housing Costs | $384 | $0 |
| Real Estate Taxes | - | - |
Property Value by Mortgage Status in Bowman
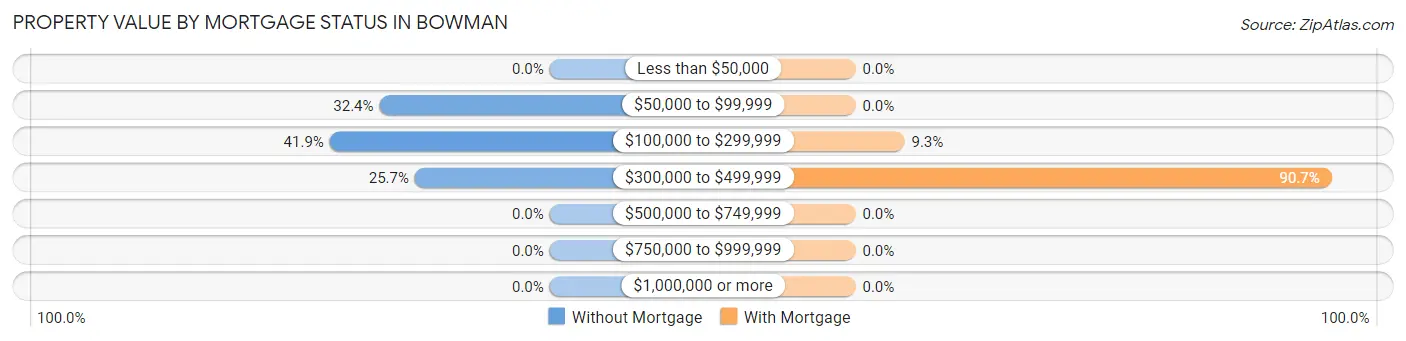
| Property Value | Without Mortgage | With Mortgage |
| Less than $50,000 | 0 (0.0%) | 0 (0.0%) |
| $50,000 to $99,999 | 24 (32.4%) | 0 (0.0%) |
| $100,000 to $299,999 | 31 (41.9%) | 7 (9.3%) |
| $300,000 to $499,999 | 19 (25.7%) | 68 (90.7%) |
| $500,000 to $749,999 | 0 (0.0%) | 0 (0.0%) |
| $750,000 to $999,999 | 0 (0.0%) | 0 (0.0%) |
| $1,000,000 or more | 0 (0.0%) | 0 (0.0%) |
| Total | 74 (100.0%) | 75 (100.0%) |
Household Income by Mortgage Status in Bowman
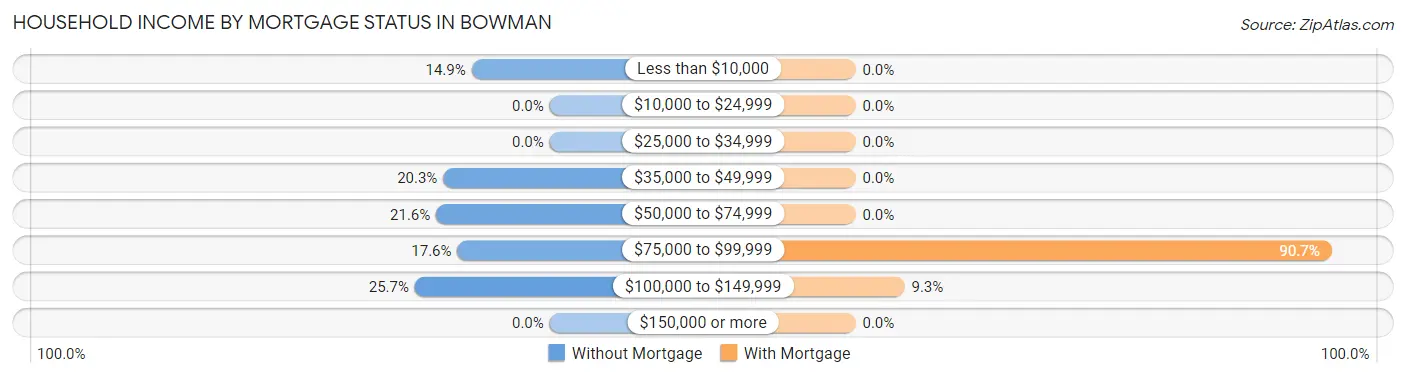
| Household Income | Without Mortgage | With Mortgage |
| Less than $10,000 | 11 (14.9%) | 0 (0.0%) |
| $10,000 to $24,999 | 0 (0.0%) | 0 (0.0%) |
| $25,000 to $34,999 | 0 (0.0%) | 0 (0.0%) |
| $35,000 to $49,999 | 15 (20.3%) | 0 (0.0%) |
| $50,000 to $74,999 | 16 (21.6%) | 0 (0.0%) |
| $75,000 to $99,999 | 13 (17.6%) | 68 (90.7%) |
| $100,000 to $149,999 | 19 (25.7%) | 7 (9.3%) |
| $150,000 or more | 0 (0.0%) | 0 (0.0%) |
| Total | 74 (100.0%) | 75 (100.0%) |
Property Value to Household Income Ratio in Bowman
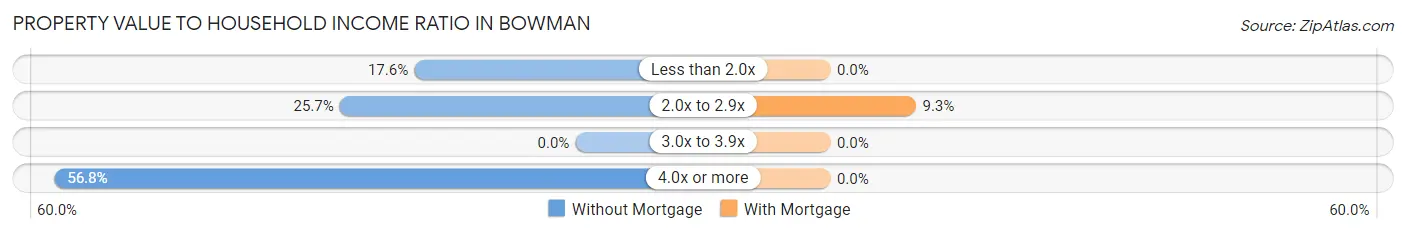
| Value-to-Income Ratio | Without Mortgage | With Mortgage |
| Less than 2.0x | 13 (17.6%) | 0 (0.0%) |
| 2.0x to 2.9x | 19 (25.7%) | 7 (9.3%) |
| 3.0x to 3.9x | 0 (0.0%) | 0 (0.0%) |
| 4.0x or more | 42 (56.8%) | 0 (0.0%) |
| Total | 74 (100.0%) | 75 (100.0%) |
Real Estate Taxes by Mortgage Status in Bowman
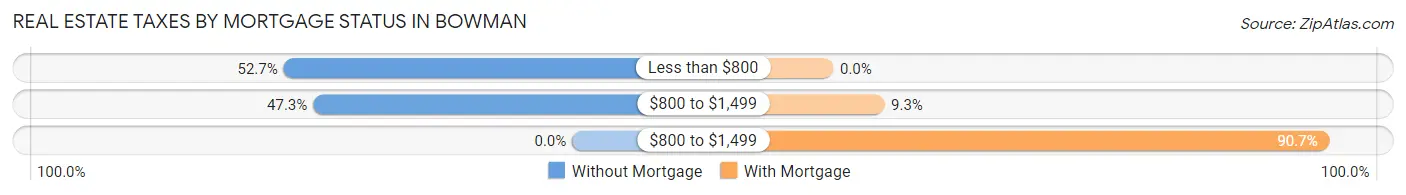
| Property Taxes | Without Mortgage | With Mortgage |
| Less than $800 | 39 (52.7%) | 0 (0.0%) |
| $800 to $1,499 | 35 (47.3%) | 7 (9.3%) |
| $800 to $1,499 | 0 (0.0%) | 68 (90.7%) |
| Total | 74 (100.0%) | 75 (100.0%) |
Health & Disability in Bowman
Health Insurance Coverage by Age in Bowman
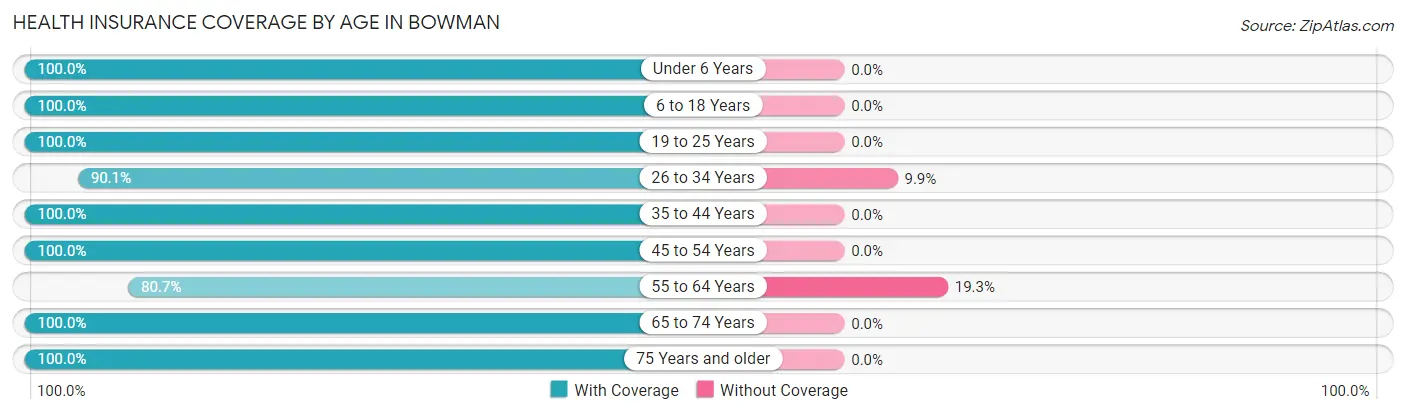
| Age Bracket | With Coverage | Without Coverage |
| Under 6 Years | 18 (100.0%) | 0 (0.0%) |
| 6 to 18 Years | 54 (100.0%) | 0 (0.0%) |
| 19 to 25 Years | 19 (100.0%) | 0 (0.0%) |
| 26 to 34 Years | 127 (90.1%) | 14 (9.9%) |
| 35 to 44 Years | 46 (100.0%) | 0 (0.0%) |
| 45 to 54 Years | 19 (100.0%) | 0 (0.0%) |
| 55 to 64 Years | 46 (80.7%) | 11 (19.3%) |
| 65 to 74 Years | 21 (100.0%) | 0 (0.0%) |
| 75 Years and older | 36 (100.0%) | 0 (0.0%) |
| Total | 386 (93.9%) | 25 (6.1%) |
Health Insurance Coverage by Citizenship Status in Bowman
| Citizenship Status | With Coverage | Without Coverage |
| Native Born | 18 (100.0%) | 0 (0.0%) |
| Foreign Born, Citizen | 54 (100.0%) | 0 (0.0%) |
| Foreign Born, not a Citizen | 19 (100.0%) | 0 (0.0%) |
Health Insurance Coverage by Household Income in Bowman
| Household Income | With Coverage | Without Coverage |
| Under $25,000 | 10 (28.6%) | 25 (71.4%) |
| $25,000 to $49,999 | 31 (100.0%) | 0 (0.0%) |
| $50,000 to $74,999 | 236 (100.0%) | 0 (0.0%) |
| $75,000 to $99,999 | 51 (100.0%) | 0 (0.0%) |
| $100,000 and over | 58 (100.0%) | 0 (0.0%) |
Public vs Private Health Insurance Coverage by Age in Bowman
| Age Bracket | Public Insurance | Private Insurance |
| Under 6 | 15 (83.3%) | 3 (16.7%) |
| 6 to 18 Years | 0 (0.0%) | 54 (100.0%) |
| 19 to 25 Years | 0 (0.0%) | 19 (100.0%) |
| 25 to 34 Years | 0 (0.0%) | 127 (90.1%) |
| 35 to 44 Years | 12 (26.1%) | 34 (73.9%) |
| 45 to 54 Years | 0 (0.0%) | 19 (100.0%) |
| 55 to 64 Years | 13 (22.8%) | 33 (57.9%) |
| 65 to 74 Years | 21 (100.0%) | 21 (100.0%) |
| 75 Years and over | 36 (100.0%) | 36 (100.0%) |
| Total | 97 (23.6%) | 346 (84.2%) |
Disability Status by Sex by Age in Bowman
| Age Bracket | Male | Female |
| Under 5 Years | 0 (0.0%) | 0 (0.0%) |
| 5 to 17 Years | 0 (0.0%) | 0 (0.0%) |
| 18 to 34 Years | 82 (100.0%) | 0 (0.0%) |
| 35 to 64 Years | 0 (0.0%) | 12 (23.5%) |
| 65 to 74 Years | 0 (0.0%) | 16 (76.2%) |
| 75 Years and over | 5 (25.0%) | 16 (100.0%) |
Disability Class by Sex by Age in Bowman
Disability Class: Hearing Difficulty
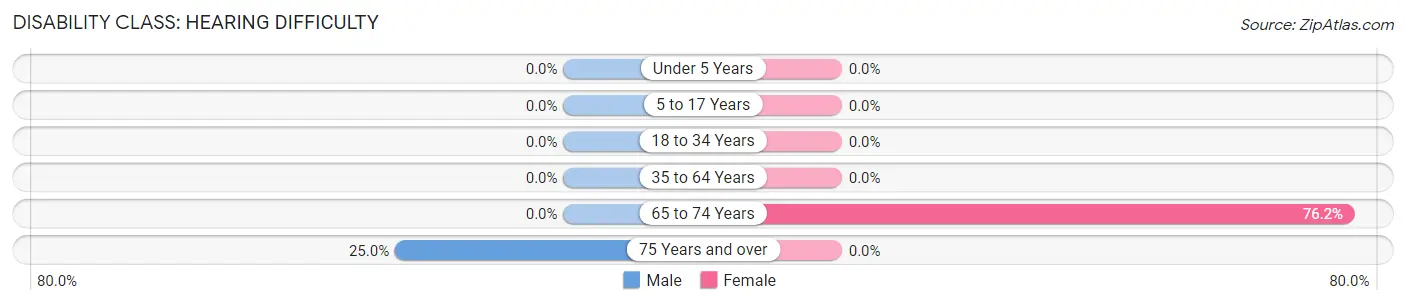
| Age Bracket | Male | Female |
| Under 5 Years | 0 (0.0%) | 0 (0.0%) |
| 5 to 17 Years | 0 (0.0%) | 0 (0.0%) |
| 18 to 34 Years | 0 (0.0%) | 0 (0.0%) |
| 35 to 64 Years | 0 (0.0%) | 0 (0.0%) |
| 65 to 74 Years | 0 (0.0%) | 16 (76.2%) |
| 75 Years and over | 5 (25.0%) | 0 (0.0%) |
Disability Class: Vision Difficulty
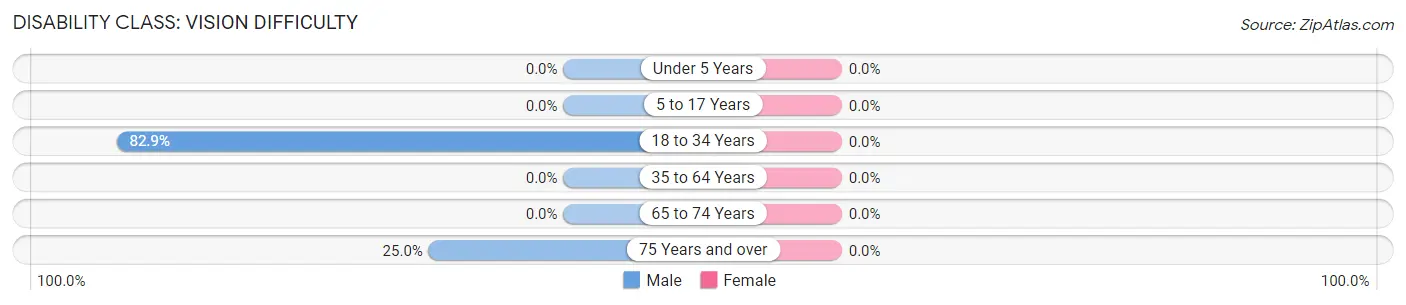
| Age Bracket | Male | Female |
| Under 5 Years | 0 (0.0%) | 0 (0.0%) |
| 5 to 17 Years | 0 (0.0%) | 0 (0.0%) |
| 18 to 34 Years | 68 (82.9%) | 0 (0.0%) |
| 35 to 64 Years | 0 (0.0%) | 0 (0.0%) |
| 65 to 74 Years | 0 (0.0%) | 0 (0.0%) |
| 75 Years and over | 5 (25.0%) | 0 (0.0%) |
Disability Class: Cognitive Difficulty
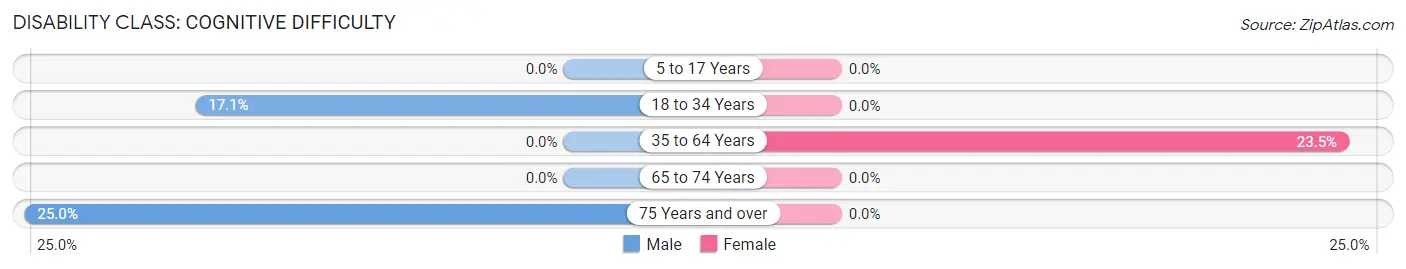
| Age Bracket | Male | Female |
| 5 to 17 Years | 0 (0.0%) | 0 (0.0%) |
| 18 to 34 Years | 14 (17.1%) | 0 (0.0%) |
| 35 to 64 Years | 0 (0.0%) | 12 (23.5%) |
| 65 to 74 Years | 0 (0.0%) | 0 (0.0%) |
| 75 Years and over | 5 (25.0%) | 0 (0.0%) |
Disability Class: Ambulatory Difficulty
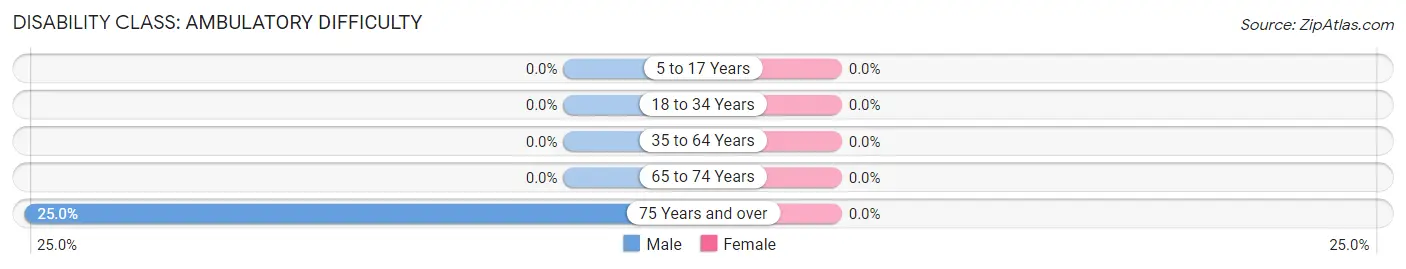
| Age Bracket | Male | Female |
| 5 to 17 Years | 0 (0.0%) | 0 (0.0%) |
| 18 to 34 Years | 0 (0.0%) | 0 (0.0%) |
| 35 to 64 Years | 0 (0.0%) | 0 (0.0%) |
| 65 to 74 Years | 0 (0.0%) | 0 (0.0%) |
| 75 Years and over | 5 (25.0%) | 0 (0.0%) |
Disability Class: Self-Care Difficulty
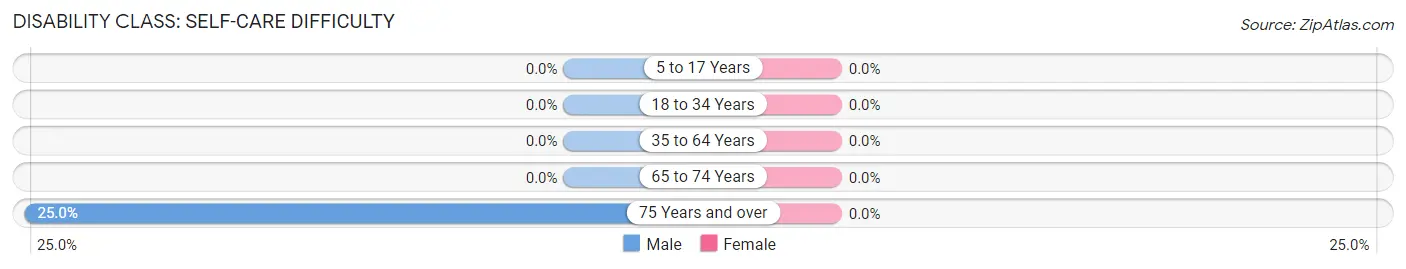
| Age Bracket | Male | Female |
| 5 to 17 Years | 0 (0.0%) | 0 (0.0%) |
| 18 to 34 Years | 0 (0.0%) | 0 (0.0%) |
| 35 to 64 Years | 0 (0.0%) | 0 (0.0%) |
| 65 to 74 Years | 0 (0.0%) | 0 (0.0%) |
| 75 Years and over | 5 (25.0%) | 0 (0.0%) |
Technology Access in Bowman
Computing Device Access in Bowman
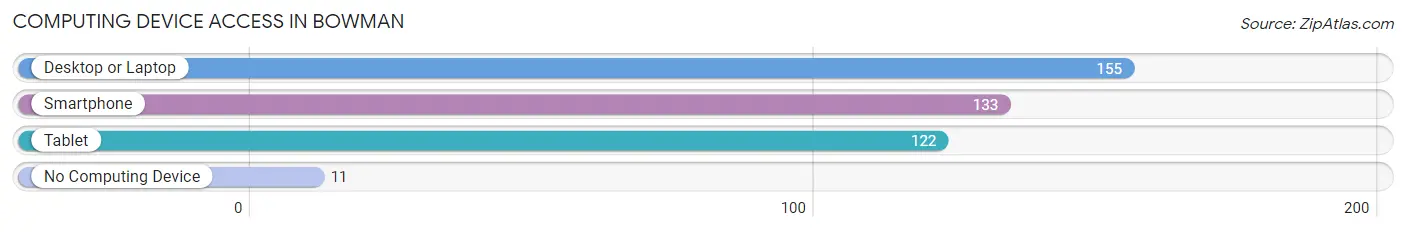
| Device Type | # Households | % Households |
| Desktop or Laptop | 155 | 93.4% |
| Smartphone | 133 | 80.1% |
| Tablet | 122 | 73.5% |
| No Computing Device | 11 | 6.6% |
| Total | 166 | 100.0% |
Internet Access in Bowman
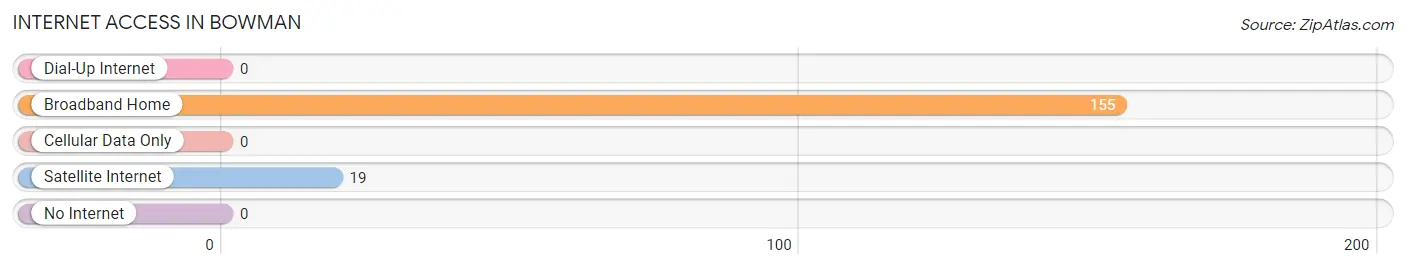
| Internet Type | # Households | % Households |
| Dial-Up Internet | 0 | 0.0% |
| Broadband Home | 155 | 93.4% |
| Cellular Data Only | 0 | 0.0% |
| Satellite Internet | 19 | 11.5% |
| No Internet | 0 | 0.0% |
| Total | 166 | 100.0% |
Bowman Summary
Bowman, Tennessee is a small town located in the eastern part of the state, in the foothills of the Appalachian Mountains. It is situated in the Sequatchie Valley, which is a narrow valley that runs through the Cumberland Plateau. The town is located in Bledsoe County, and is part of the Chattanooga, TN-GA Metropolitan Statistical Area. The population of Bowman was estimated to be 1,072 in 2019.
History
The area that is now Bowman was first settled in the early 1800s by settlers from North Carolina and Virginia. The town was originally known as “Bledsoe’s Station”, named after the local Bledsoe family. The town was officially incorporated in 1876, and the name was changed to Bowman in honor of a local doctor, Dr. John Bowman.
Geography
Bowman is located in the Sequatchie Valley, which is a narrow valley that runs through the Cumberland Plateau. The town is situated at an elevation of 1,068 feet above sea level. The town is surrounded by hills and mountains, and is located near the Sequatchie River. The climate in Bowman is humid subtropical, with hot summers and mild winters.
Economy
The economy of Bowman is largely based on agriculture and forestry. The town is home to several farms, and the surrounding area is known for its production of tobacco, corn, and hay. The town is also home to several small businesses, including a grocery store, a hardware store, and a few restaurants.
Demographics
As of the 2019 census, the population of Bowman was estimated to be 1,072. The racial makeup of the town was 97.2% White, 0.9% African American, 0.3% Native American, 0.3% Asian, and 0.3% from other races. The median household income in Bowman was $37,917, and the median age was 41.7 years.
Conclusion
Bowman, Tennessee is a small town located in the eastern part of the state, in the foothills of the Appalachian Mountains. It is situated in the Sequatchie Valley, and is part of the Chattanooga, TN-GA Metropolitan Statistical Area. The town has a long history, and its economy is largely based on agriculture and forestry. The population of Bowman was estimated to be 1,072 in 2019, and the median household income was $37,917.
Common Questions
What is Per Capita Income in Bowman?
Per Capita income in Bowman is $27,287.
What is the Median Family Income in Bowman?
Median Family Income in Bowman is $73,658.
What is the Median Household income in Bowman?
Median Household Income in Bowman is $73,382.
What is Income or Wage Gap in Bowman?
Income or Wage Gap in Bowman is 16.0%.
Women in Bowman earn 84.0 cents for every dollar earned by a man.
What is Inequality or Gini Index in Bowman?
Inequality or Gini Index in Bowman is 0.21.
What is the Total Population of Bowman?
Total Population of Bowman is 411.
What is the Total Male Population of Bowman?
Total Male Population of Bowman is 242.
What is the Total Female Population of Bowman?
Total Female Population of Bowman is 169.
What is the Ratio of Males per 100 Females in Bowman?
There are 143.20 Males per 100 Females in Bowman.
What is the Ratio of Females per 100 Males in Bowman?
There are 69.83 Females per 100 Males in Bowman.
What is the Median Population Age in Bowman?
Median Population Age in Bowman is 34.6 Years.
What is the Average Family Size in Bowman
Average Family Size in Bowman is 2.6 People.
What is the Average Household Size in Bowman
Average Household Size in Bowman is 2.5 People.
How Large is the Labor Force in Bowman?
There are 232 People in the Labor Forcein in Bowman.
What is the Percentage of People in the Labor Force in Bowman?
68.4% of People are in the Labor Force in Bowman.