Zip Codes with the Highest Percentage of Population Employed in Installation, Maintenance & Repair in Tennessee
RELATED REPORTS & OPTIONS
Installation, Maintenance & Repair
Tennessee
Compare Zip Codes
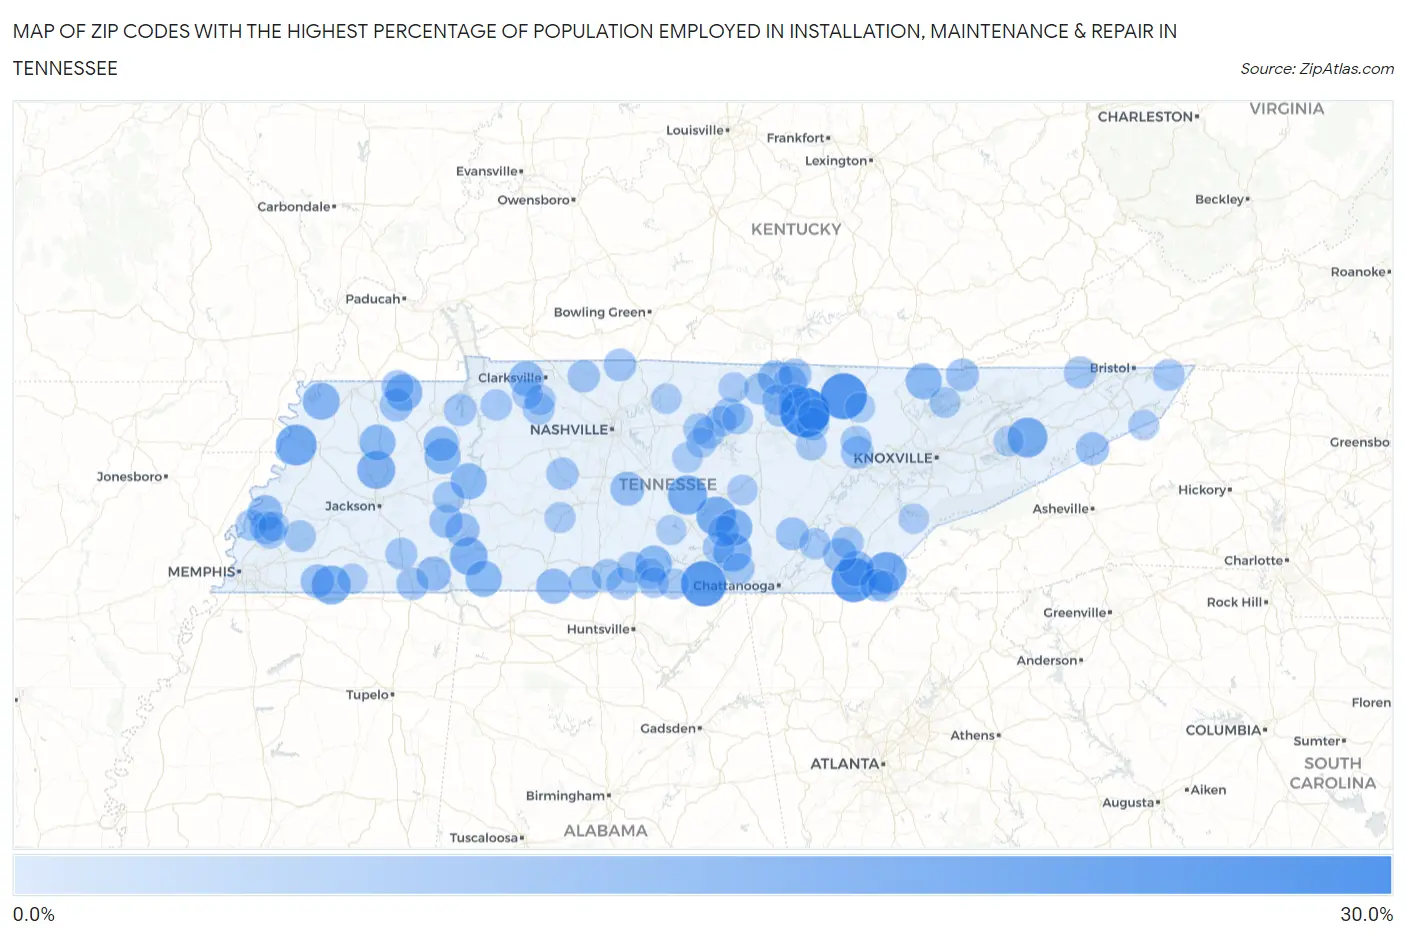
Map of Zip Codes with the Highest Percentage of Population Employed in Installation, Maintenance & Repair in Tennessee
0.0%
30.0%
Zip Codes with the Highest Percentage of Population Employed in Installation, Maintenance & Repair in Tennessee
| Zip Code | % Employed | vs State | vs National | |
| 1. | 38589 | 28.8% | 3.3%(+25.5)#1 | 3.1%(+25.7)#187 |
| 2. | 38504 | 25.0% | 3.3%(+21.7)#2 | 3.1%(+21.9)#242 |
| 3. | 37376 | 23.9% | 3.3%(+20.6)#3 | 3.1%(+20.8)#266 |
| 4. | 37361 | 22.8% | 3.3%(+19.5)#4 | 3.1%(+19.7)#302 |
| 5. | 37333 | 19.2% | 3.3%(+15.9)#5 | 3.1%(+16.1)#434 |
| 6. | 38047 | 18.8% | 3.3%(+15.5)#6 | 3.1%(+15.8)#450 |
| 7. | 37713 | 17.7% | 3.3%(+14.3)#7 | 3.1%(+14.6)#540 |
| 8. | 37394 | 17.4% | 3.3%(+14.1)#8 | 3.1%(+14.3)#563 |
| 9. | 37026 | 17.2% | 3.3%(+13.9)#9 | 3.1%(+14.1)#572 |
| 10. | 38046 | 16.7% | 3.3%(+13.4)#10 | 3.1%(+13.6)#621 |
| 11. | 37387 | 16.0% | 3.3%(+12.7)#11 | 3.1%(+12.9)#681 |
| 12. | 38338 | 15.6% | 3.3%(+12.3)#12 | 3.1%(+12.6)#723 |
| 13. | 38475 | 15.3% | 3.3%(+12.0)#13 | 3.1%(+12.2)#757 |
| 14. | 37305 | 14.8% | 3.3%(+11.5)#14 | 3.1%(+11.7)#804 |
| 15. | 38241 | 14.7% | 3.3%(+11.4)#15 | 3.1%(+11.6)#817 |
| 16. | 38232 | 14.6% | 3.3%(+11.3)#16 | 3.1%(+11.5)#837 |
| 17. | 37359 | 13.8% | 3.3%(+10.5)#17 | 3.1%(+10.8)#954 |
| 18. | 38471 | 13.8% | 3.3%(+10.4)#18 | 3.1%(+10.7)#968 |
| 19. | 38380 | 13.7% | 3.3%(+10.4)#19 | 3.1%(+10.7)#969 |
| 20. | 37729 | 13.6% | 3.3%(+10.3)#20 | 3.1%(+10.6)#989 |
| 21. | 38316 | 13.5% | 3.3%(+10.2)#21 | 3.1%(+10.5)#1,007 |
| 22. | 38318 | 13.4% | 3.3%(+10.1)#22 | 3.1%(+10.4)#1,016 |
| 23. | 37307 | 13.1% | 3.3%(+9.76)#23 | 3.1%(+10.0)#1,085 |
| 24. | 38317 | 12.5% | 3.3%(+9.23)#24 | 3.1%(+9.48)#1,189 |
| 25. | 38457 | 12.5% | 3.3%(+9.15)#25 | 3.1%(+9.39)#1,215 |
| 26. | 37191 | 12.4% | 3.3%(+9.07)#26 | 3.1%(+9.31)#1,229 |
| 27. | 38015 | 12.1% | 3.3%(+8.82)#27 | 3.1%(+9.06)#1,286 |
| 28. | 38376 | 11.8% | 3.3%(+8.45)#28 | 3.1%(+8.70)#1,383 |
| 29. | 38541 | 11.6% | 3.3%(+8.27)#29 | 3.1%(+8.51)#1,435 |
| 30. | 37060 | 11.3% | 3.3%(+8.01)#30 | 3.1%(+8.25)#1,513 |
| 31. | 37310 | 11.2% | 3.3%(+7.93)#31 | 3.1%(+8.17)#1,542 |
| 32. | 38311 | 11.1% | 3.3%(+7.80)#32 | 3.1%(+8.04)#1,582 |
| 33. | 38573 | 11.1% | 3.3%(+7.76)#33 | 3.1%(+8.00)#1,604 |
| 34. | 38057 | 10.9% | 3.3%(+7.59)#34 | 3.1%(+7.83)#1,655 |
| 35. | 38374 | 10.7% | 3.3%(+7.34)#35 | 3.1%(+7.58)#1,735 |
| 36. | 37657 | 10.4% | 3.3%(+7.12)#36 | 3.1%(+7.36)#1,833 |
| 37. | 38553 | 10.3% | 3.3%(+7.01)#37 | 3.1%(+7.25)#1,878 |
| 38. | 38225 | 10.1% | 3.3%(+6.83)#38 | 3.1%(+7.07)#1,961 |
| 39. | 38549 | 10.1% | 3.3%(+6.79)#39 | 3.1%(+7.03)#1,971 |
| 40. | 37724 | 10.1% | 3.3%(+6.77)#40 | 3.1%(+7.02)#1,976 |
| 41. | 37829 | 10.0% | 3.3%(+6.73)#41 | 3.1%(+6.97)#1,995 |
| 42. | 37338 | 10.0% | 3.3%(+6.73)#42 | 3.1%(+6.97)#1,999 |
| 43. | 38058 | 9.9% | 3.3%(+6.58)#43 | 3.1%(+6.82)#2,075 |
| 44. | 38477 | 9.8% | 3.3%(+6.52)#44 | 3.1%(+6.76)#2,103 |
| 45. | 37141 | 9.8% | 3.3%(+6.44)#45 | 3.1%(+6.68)#2,141 |
| 46. | 38339 | 9.6% | 3.3%(+6.29)#46 | 3.1%(+6.54)#2,199 |
| 47. | 37032 | 9.6% | 3.3%(+6.26)#47 | 3.1%(+6.50)#2,220 |
| 48. | 37317 | 9.5% | 3.3%(+6.17)#48 | 3.1%(+6.41)#2,279 |
| 49. | 38256 | 9.5% | 3.3%(+6.14)#49 | 3.1%(+6.39)#2,293 |
| 50. | 38476 | 9.4% | 3.3%(+6.13)#50 | 3.1%(+6.38)#2,299 |
| 51. | 37645 | 9.4% | 3.3%(+6.13)#51 | 3.1%(+6.37)#2,300 |
| 52. | 38226 | 9.4% | 3.3%(+6.12)#52 | 3.1%(+6.37)#2,304 |
| 53. | 38004 | 9.2% | 3.3%(+5.89)#53 | 3.1%(+6.13)#2,438 |
| 54. | 38488 | 9.2% | 3.3%(+5.88)#54 | 3.1%(+6.12)#2,444 |
| 55. | 38315 | 9.2% | 3.3%(+5.86)#55 | 3.1%(+6.11)#2,452 |
| 56. | 37370 | 9.2% | 3.3%(+5.85)#56 | 3.1%(+6.09)#2,459 |
| 57. | 37366 | 9.1% | 3.3%(+5.84)#57 | 3.1%(+6.08)#2,465 |
| 58. | 38543 | 9.1% | 3.3%(+5.82)#58 | 3.1%(+6.06)#2,472 |
| 59. | 38565 | 9.0% | 3.3%(+5.71)#59 | 3.1%(+5.95)#2,544 |
| 60. | 37051 | 9.0% | 3.3%(+5.66)#60 | 3.1%(+5.90)#2,579 |
| 61. | 38567 | 8.9% | 3.3%(+5.64)#61 | 3.1%(+5.88)#2,592 |
| 62. | 38049 | 8.9% | 3.3%(+5.60)#62 | 3.1%(+5.85)#2,616 |
| 63. | 38328 | 8.9% | 3.3%(+5.60)#63 | 3.1%(+5.85)#2,617 |
| 64. | 38453 | 8.9% | 3.3%(+5.59)#64 | 3.1%(+5.84)#2,625 |
| 65. | 38568 | 8.8% | 3.3%(+5.52)#65 | 3.1%(+5.76)#2,670 |
| 66. | 38564 | 8.8% | 3.3%(+5.49)#66 | 3.1%(+5.74)#2,690 |
| 67. | 37301 | 8.8% | 3.3%(+5.47)#67 | 3.1%(+5.71)#2,710 |
| 68. | 37374 | 8.7% | 3.3%(+5.37)#68 | 3.1%(+5.61)#2,769 |
| 69. | 37688 | 8.7% | 3.3%(+5.34)#69 | 3.1%(+5.59)#2,791 |
| 70. | 38023 | 8.6% | 3.3%(+5.31)#70 | 3.1%(+5.55)#2,815 |
| 71. | 37334 | 8.5% | 3.3%(+5.19)#71 | 3.1%(+5.44)#2,880 |
| 72. | 37178 | 8.4% | 3.3%(+5.14)#72 | 3.1%(+5.38)#2,922 |
| 73. | 37326 | 8.3% | 3.3%(+5.02)#73 | 3.1%(+5.27)#3,005 |
| 74. | 37308 | 8.3% | 3.3%(+4.96)#74 | 3.1%(+5.20)#3,058 |
| 75. | 38580 | 8.1% | 3.3%(+4.74)#75 | 3.1%(+4.99)#3,263 |
| 76. | 38552 | 8.0% | 3.3%(+4.74)#76 | 3.1%(+4.98)#3,271 |
| 77. | 38547 | 8.0% | 3.3%(+4.72)#77 | 3.1%(+4.97)#3,282 |
| 78. | 37887 | 8.0% | 3.3%(+4.70)#78 | 3.1%(+4.95)#3,299 |
| 79. | 37052 | 8.0% | 3.3%(+4.67)#79 | 3.1%(+4.92)#3,331 |
| 80. | 37345 | 8.0% | 3.3%(+4.66)#80 | 3.1%(+4.90)#3,352 |
| 81. | 38545 | 8.0% | 3.3%(+4.65)#81 | 3.1%(+4.89)#3,357 |
| 82. | 38474 | 8.0% | 3.3%(+4.64)#82 | 3.1%(+4.88)#3,362 |
| 83. | 37866 | 7.9% | 3.3%(+4.62)#83 | 3.1%(+4.86)#3,389 |
| 84. | 37348 | 7.9% | 3.3%(+4.61)#84 | 3.1%(+4.85)#3,394 |
| 85. | 38570 | 7.9% | 3.3%(+4.61)#85 | 3.1%(+4.85)#3,396 |
| 86. | 38571 | 7.8% | 3.3%(+4.53)#86 | 3.1%(+4.77)#3,473 |
| 87. | 37335 | 7.8% | 3.3%(+4.51)#87 | 3.1%(+4.75)#3,492 |
| 88. | 37142 | 7.8% | 3.3%(+4.46)#88 | 3.1%(+4.70)#3,559 |
| 89. | 37016 | 7.7% | 3.3%(+4.40)#89 | 3.1%(+4.64)#3,613 |
| 90. | 37687 | 7.6% | 3.3%(+4.32)#90 | 3.1%(+4.57)#3,692 |
| 91. | 37012 | 7.5% | 3.3%(+4.21)#91 | 3.1%(+4.46)#3,793 |
| 92. | 38581 | 7.5% | 3.3%(+4.19)#92 | 3.1%(+4.43)#3,821 |
| 93. | 38588 | 7.5% | 3.3%(+4.15)#93 | 3.1%(+4.40)#3,858 |
| 94. | 37031 | 7.4% | 3.3%(+4.10)#94 | 3.1%(+4.34)#3,927 |
| 95. | 37852 | 7.4% | 3.3%(+4.05)#95 | 3.1%(+4.30)#3,973 |
| 96. | 38011 | 7.4% | 3.3%(+4.05)#96 | 3.1%(+4.29)#3,975 |
| 97. | 38067 | 7.3% | 3.3%(+4.01)#97 | 3.1%(+4.25)#4,023 |
| 98. | 37885 | 7.2% | 3.3%(+3.94)#98 | 3.1%(+4.18)#4,114 |
| 99. | 37890 | 7.2% | 3.3%(+3.92)#99 | 3.1%(+4.16)#4,132 |
| 100. | 37360 | 7.2% | 3.3%(+3.85)#100 | 3.1%(+4.09)#4,217 |
Common Questions
What are the Top 10 Zip Codes with the Highest Percentage of Population Employed in Installation, Maintenance & Repair in Tennessee?
Top 10 Zip Codes with the Highest Percentage of Population Employed in Installation, Maintenance & Repair in Tennessee are:
What zip code has the Highest Percentage of Population Employed in Installation, Maintenance & Repair in Tennessee?
38589 has the Highest Percentage of Population Employed in Installation, Maintenance & Repair in Tennessee with 28.8%.
What is the Percentage of Population Employed in Installation, Maintenance & Repair in the State of Tennessee?
Percentage of Population Employed in Installation, Maintenance & Repair in Tennessee is 3.3%.
What is the Percentage of Population Employed in Installation, Maintenance & Repair in the United States?
Percentage of Population Employed in Installation, Maintenance & Repair in the United States is 3.1%.