Zip Codes with the Highest Percentage of Population Employed in Installation, Maintenance & Repair in Greeneville, TN
RELATED REPORTS & OPTIONS
Installation, Maintenance & Repair
Greeneville
Compare Zip Codes
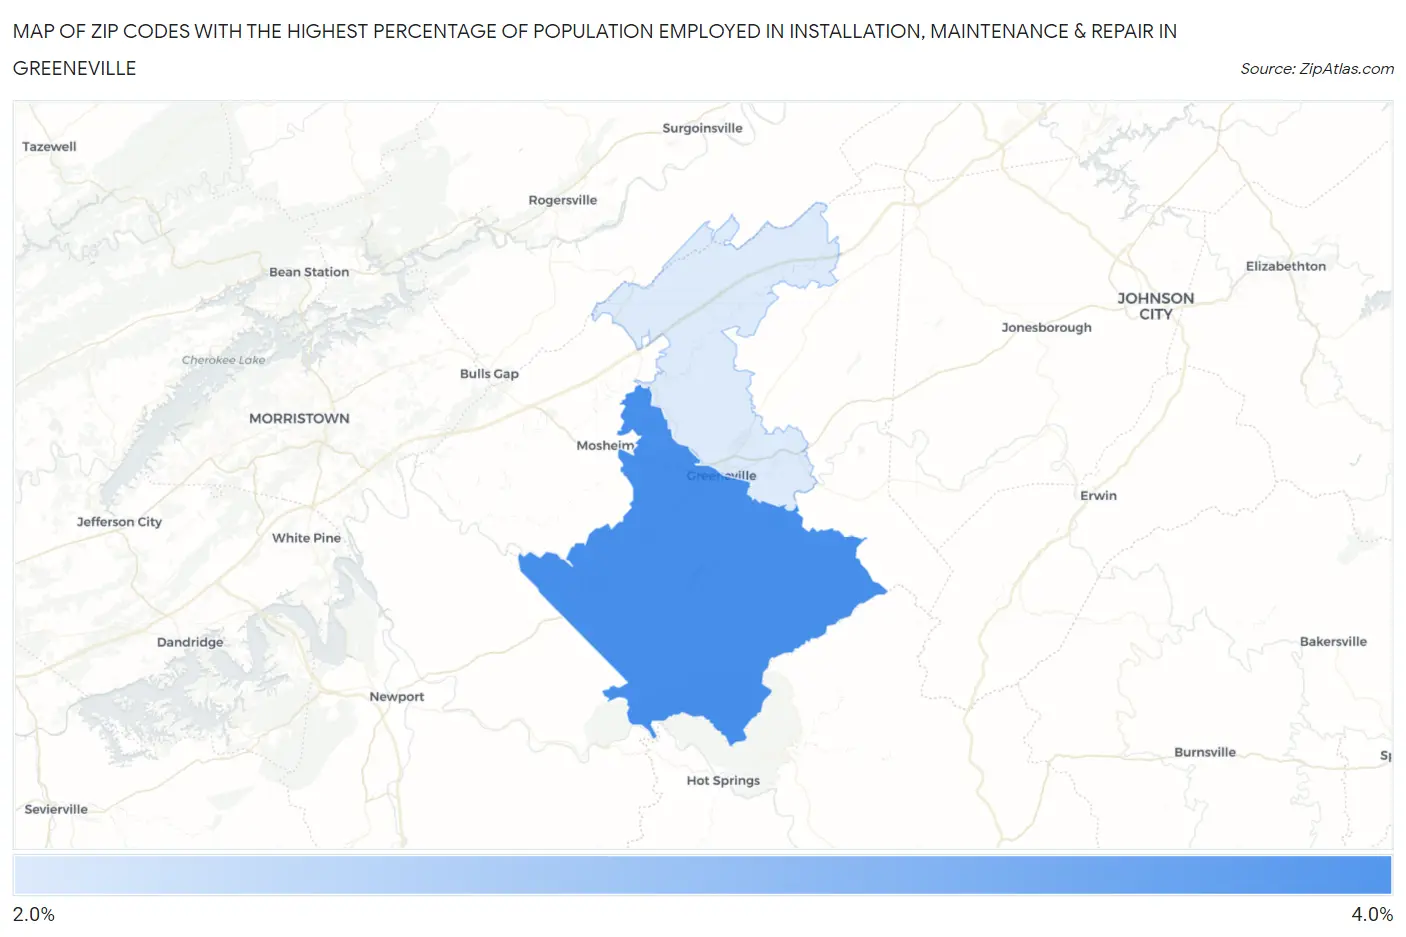
Map of Zip Codes with the Highest Percentage of Population Employed in Installation, Maintenance & Repair in Greeneville
2.9%
3.5%
Zip Codes with the Highest Percentage of Population Employed in Installation, Maintenance & Repair in Greeneville, TN
| Zip Code | % Employed | vs State | vs National | |
| 1. | 37743 | 3.5% | 3.3%(+0.206)#332 | 3.1%(+0.450)#14,552 |
| 2. | 37745 | 2.9% | 3.3%(-0.376)#379 | 3.1%(-0.132)#17,323 |
1
Common Questions
What are the Top Zip Codes with the Highest Percentage of Population Employed in Installation, Maintenance & Repair in Greeneville, TN?
Top Zip Codes with the Highest Percentage of Population Employed in Installation, Maintenance & Repair in Greeneville, TN are:
What zip code has the Highest Percentage of Population Employed in Installation, Maintenance & Repair in Greeneville, TN?
37743 has the Highest Percentage of Population Employed in Installation, Maintenance & Repair in Greeneville, TN with 3.5%.
What is the Percentage of Population Employed in Installation, Maintenance & Repair in Greeneville, TN?
Percentage of Population Employed in Installation, Maintenance & Repair in Greeneville is 1.8%.
What is the Percentage of Population Employed in Installation, Maintenance & Repair in Tennessee?
Percentage of Population Employed in Installation, Maintenance & Repair in Tennessee is 3.3%.
What is the Percentage of Population Employed in Installation, Maintenance & Repair in the United States?
Percentage of Population Employed in Installation, Maintenance & Repair in the United States is 3.1%.