Zip Codes with the Highest Percentage of Population Employed in Installation, Maintenance & Repair in Clarksville, TN
RELATED REPORTS & OPTIONS
Installation, Maintenance & Repair
Clarksville
Compare Zip Codes
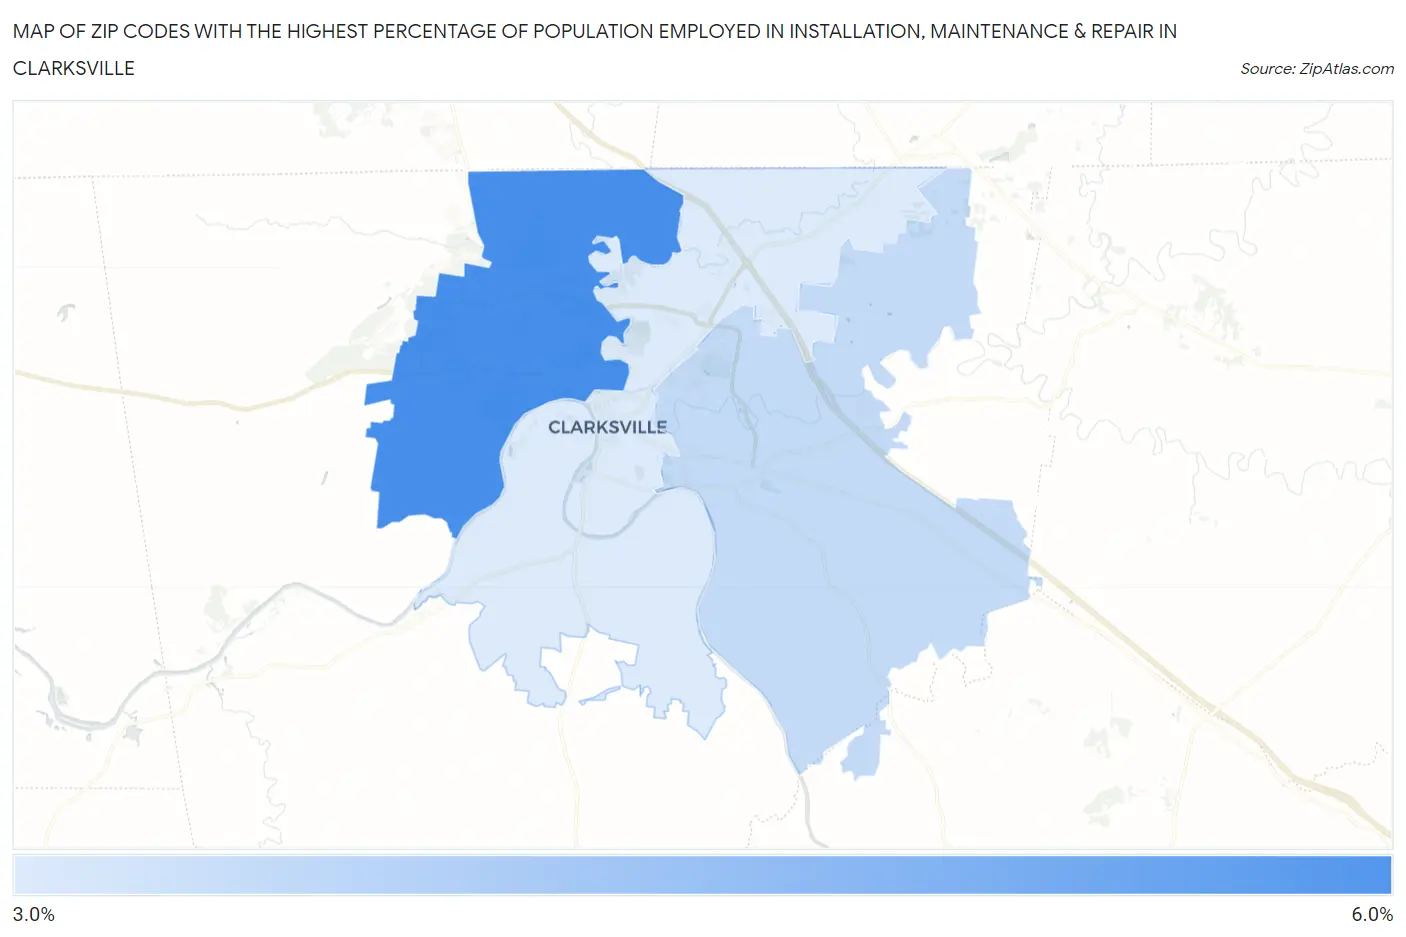
Map of Zip Codes with the Highest Percentage of Population Employed in Installation, Maintenance & Repair in Clarksville
3.6%
5.4%
Zip Codes with the Highest Percentage of Population Employed in Installation, Maintenance & Repair in Clarksville, TN
| Zip Code | % Employed | vs State | vs National | |
| 1. | 37042 | 5.4% | 3.3%(+2.12)#184 | 3.1%(+2.36)#7,462 |
| 2. | 37043 | 3.9% | 3.3%(+0.608)#293 | 3.1%(+0.851)#12,717 |
| 3. | 37040 | 3.6% | 3.3%(+0.319)#320 | 3.1%(+0.562)#14,030 |
1
Common Questions
What are the Top Zip Codes with the Highest Percentage of Population Employed in Installation, Maintenance & Repair in Clarksville, TN?
Top Zip Codes with the Highest Percentage of Population Employed in Installation, Maintenance & Repair in Clarksville, TN are:
What zip code has the Highest Percentage of Population Employed in Installation, Maintenance & Repair in Clarksville, TN?
37042 has the Highest Percentage of Population Employed in Installation, Maintenance & Repair in Clarksville, TN with 5.4%.
What is the Percentage of Population Employed in Installation, Maintenance & Repair in Clarksville, TN?
Percentage of Population Employed in Installation, Maintenance & Repair in Clarksville is 4.5%.
What is the Percentage of Population Employed in Installation, Maintenance & Repair in Tennessee?
Percentage of Population Employed in Installation, Maintenance & Repair in Tennessee is 3.3%.
What is the Percentage of Population Employed in Installation, Maintenance & Repair in the United States?
Percentage of Population Employed in Installation, Maintenance & Repair in the United States is 3.1%.