Zip Codes with the Highest Percentage of Population Employed in Installation, Maintenance & Repair in Memphis, TN
RELATED REPORTS & OPTIONS
Installation, Maintenance & Repair
Memphis
Compare Zip Codes
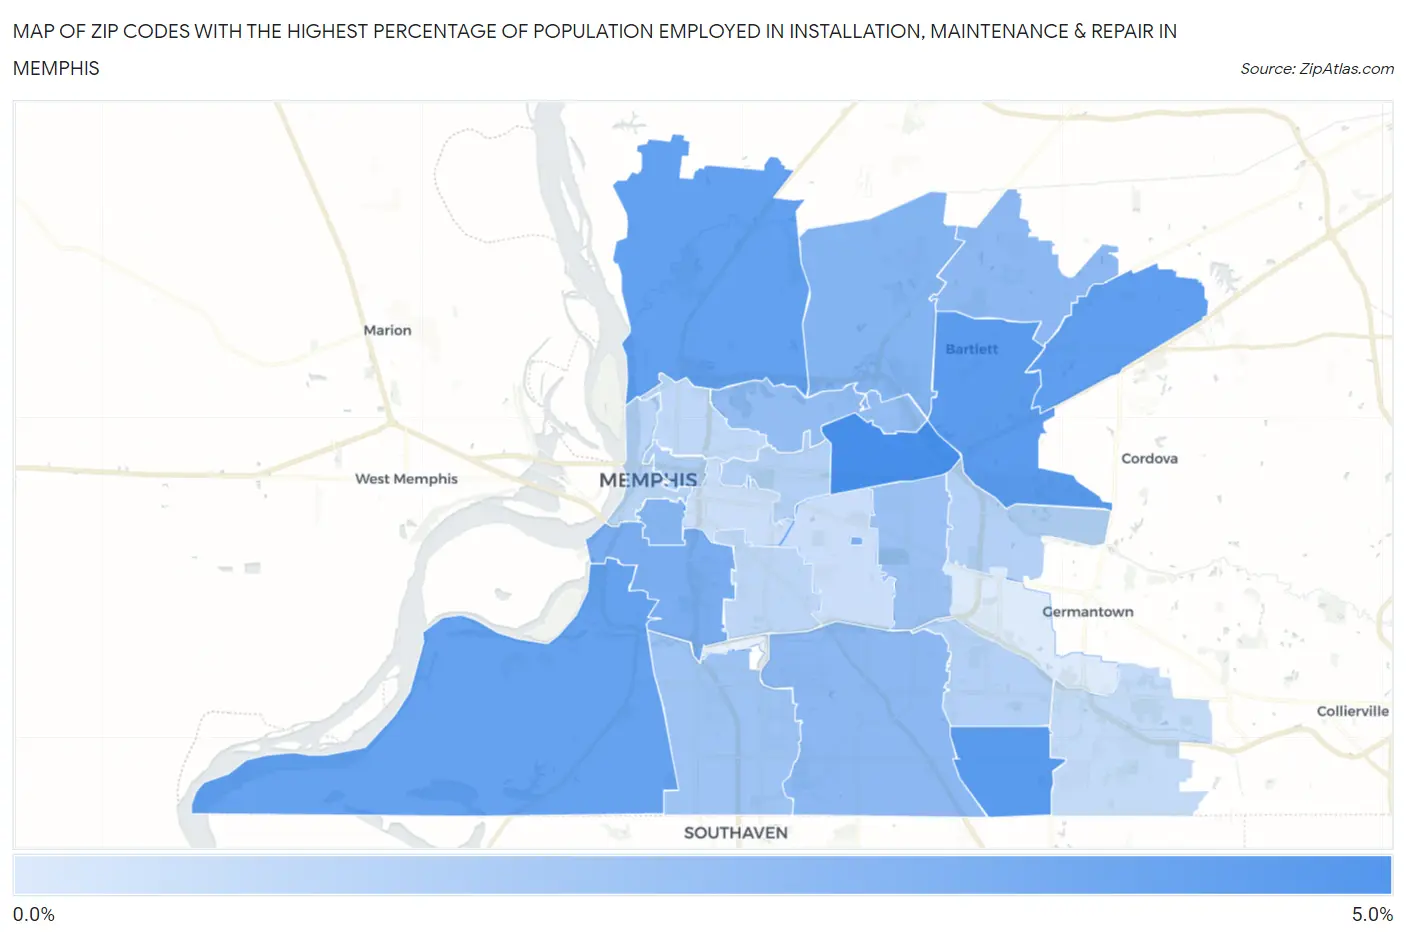
Map of Zip Codes with the Highest Percentage of Population Employed in Installation, Maintenance & Repair in Memphis
0.31%
4.6%
Zip Codes with the Highest Percentage of Population Employed in Installation, Maintenance & Repair in Memphis, TN
| Zip Code | % Employed | vs State | vs National | |
| 1. | 38122 | 4.6% | 3.3%(+1.28)#240 | 3.1%(+1.52)#10,078 |
| 2. | 38141 | 4.1% | 3.3%(+0.786)#273 | 3.1%(+1.03)#11,934 |
| 3. | 38134 | 4.0% | 3.3%(+0.702)#284 | 3.1%(+0.945)#12,299 |
| 4. | 38133 | 3.9% | 3.3%(+0.555)#296 | 3.1%(+0.798)#12,961 |
| 5. | 38127 | 3.8% | 3.3%(+0.478)#309 | 3.1%(+0.721)#13,278 |
| 6. | 38109 | 3.7% | 3.3%(+0.379)#313 | 3.1%(+0.622)#13,733 |
| 7. | 38152 | 3.1% | 3.3%(-0.174)#361 | 3.1%(+0.070)#16,340 |
| 8. | 38106 | 3.1% | 3.3%(-0.194)#362 | 3.1%(+0.049)#16,442 |
| 9. | 38128 | 2.8% | 3.3%(-0.480)#390 | 3.1%(-0.237)#17,839 |
| 10. | 38126 | 2.8% | 3.3%(-0.523)#395 | 3.1%(-0.280)#18,072 |
| 11. | 38118 | 2.6% | 3.3%(-0.688)#405 | 3.1%(-0.444)#18,960 |
| 12. | 38135 | 2.6% | 3.3%(-0.725)#408 | 3.1%(-0.482)#19,139 |
| 13. | 38108 | 2.4% | 3.3%(-0.926)#425 | 3.1%(-0.683)#20,136 |
| 14. | 38117 | 2.2% | 3.3%(-1.10)#437 | 3.1%(-0.855)#21,018 |
| 15. | 38116 | 2.1% | 3.3%(-1.23)#453 | 3.1%(-0.987)#21,639 |
| 16. | 38105 | 1.6% | 3.3%(-1.69)#487 | 3.1%(-1.44)#23,660 |
| 17. | 38112 | 1.5% | 3.3%(-1.82)#495 | 3.1%(-1.57)#24,189 |
| 18. | 38120 | 1.5% | 3.3%(-1.85)#496 | 3.1%(-1.61)#24,308 |
| 19. | 38115 | 1.4% | 3.3%(-1.86)#498 | 3.1%(-1.62)#24,375 |
| 20. | 38103 | 1.3% | 3.3%(-2.03)#509 | 3.1%(-1.78)#24,944 |
| 21. | 38114 | 1.2% | 3.3%(-2.10)#510 | 3.1%(-1.86)#25,230 |
| 22. | 38107 | 1.1% | 3.3%(-2.17)#512 | 3.1%(-1.93)#25,470 |
| 23. | 38125 | 1.1% | 3.3%(-2.26)#519 | 3.1%(-2.02)#25,763 |
| 24. | 38104 | 0.80% | 3.3%(-2.51)#530 | 3.1%(-2.26)#26,488 |
| 25. | 38111 | 0.79% | 3.3%(-2.52)#531 | 3.1%(-2.27)#26,515 |
| 26. | 38119 | 0.31% | 3.3%(-3.00)#549 | 3.1%(-2.76)#27,546 |
1
Common Questions
What are the Top 10 Zip Codes with the Highest Percentage of Population Employed in Installation, Maintenance & Repair in Memphis, TN?
Top 10 Zip Codes with the Highest Percentage of Population Employed in Installation, Maintenance & Repair in Memphis, TN are:
What zip code has the Highest Percentage of Population Employed in Installation, Maintenance & Repair in Memphis, TN?
38122 has the Highest Percentage of Population Employed in Installation, Maintenance & Repair in Memphis, TN with 4.6%.
What is the Percentage of Population Employed in Installation, Maintenance & Repair in Memphis, TN?
Percentage of Population Employed in Installation, Maintenance & Repair in Memphis is 2.3%.
What is the Percentage of Population Employed in Installation, Maintenance & Repair in Tennessee?
Percentage of Population Employed in Installation, Maintenance & Repair in Tennessee is 3.3%.
What is the Percentage of Population Employed in Installation, Maintenance & Repair in the United States?
Percentage of Population Employed in Installation, Maintenance & Repair in the United States is 3.1%.