Zip Codes with the Highest Percentage of Population Employed in Installation, Maintenance & Repair in Sevierville, TN
RELATED REPORTS & OPTIONS
Installation, Maintenance & Repair
Sevierville
Compare Zip Codes
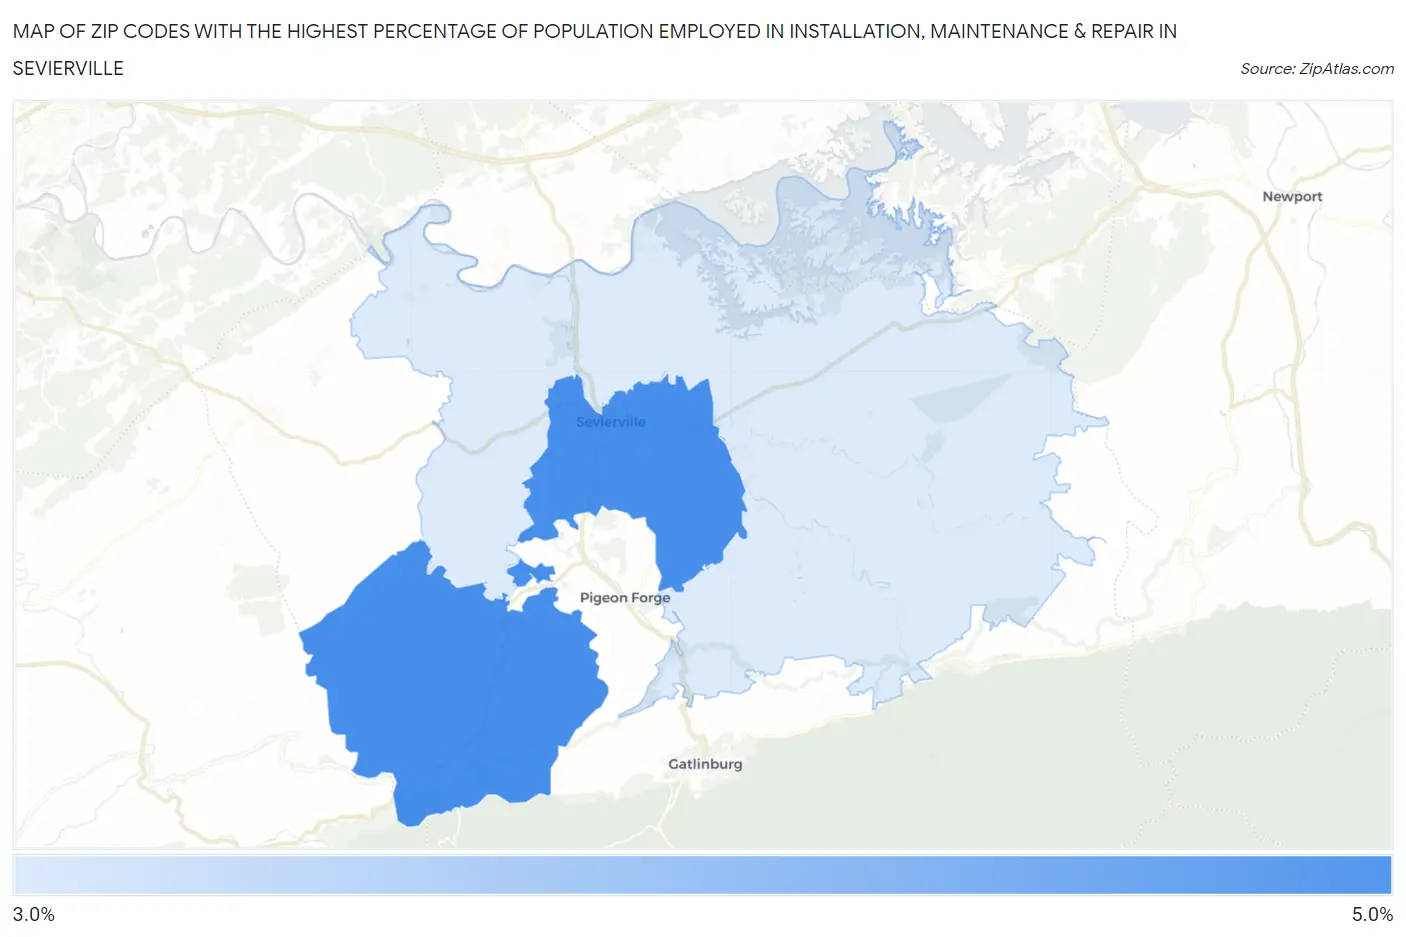
Map of Zip Codes with the Highest Percentage of Population Employed in Installation, Maintenance & Repair in Sevierville
3.4%
4.3%
Zip Codes with the Highest Percentage of Population Employed in Installation, Maintenance & Repair in Sevierville, TN
| Zip Code | % Employed | vs State | vs National | |
| 1. | 37862 | 4.3% | 3.3%(+0.945)#260 | 3.1%(+1.19)#11,304 |
| 2. | 37876 | 3.4% | 3.3%(+0.049)#346 | 3.1%(+0.292)#15,289 |
1
Common Questions
What are the Top Zip Codes with the Highest Percentage of Population Employed in Installation, Maintenance & Repair in Sevierville, TN?
Top Zip Codes with the Highest Percentage of Population Employed in Installation, Maintenance & Repair in Sevierville, TN are:
What zip code has the Highest Percentage of Population Employed in Installation, Maintenance & Repair in Sevierville, TN?
37862 has the Highest Percentage of Population Employed in Installation, Maintenance & Repair in Sevierville, TN with 4.3%.
What is the Percentage of Population Employed in Installation, Maintenance & Repair in Sevierville, TN?
Percentage of Population Employed in Installation, Maintenance & Repair in Sevierville is 3.4%.
What is the Percentage of Population Employed in Installation, Maintenance & Repair in Tennessee?
Percentage of Population Employed in Installation, Maintenance & Repair in Tennessee is 3.3%.
What is the Percentage of Population Employed in Installation, Maintenance & Repair in the United States?
Percentage of Population Employed in Installation, Maintenance & Repair in the United States is 3.1%.