New Underwood, SD Map & Demographics
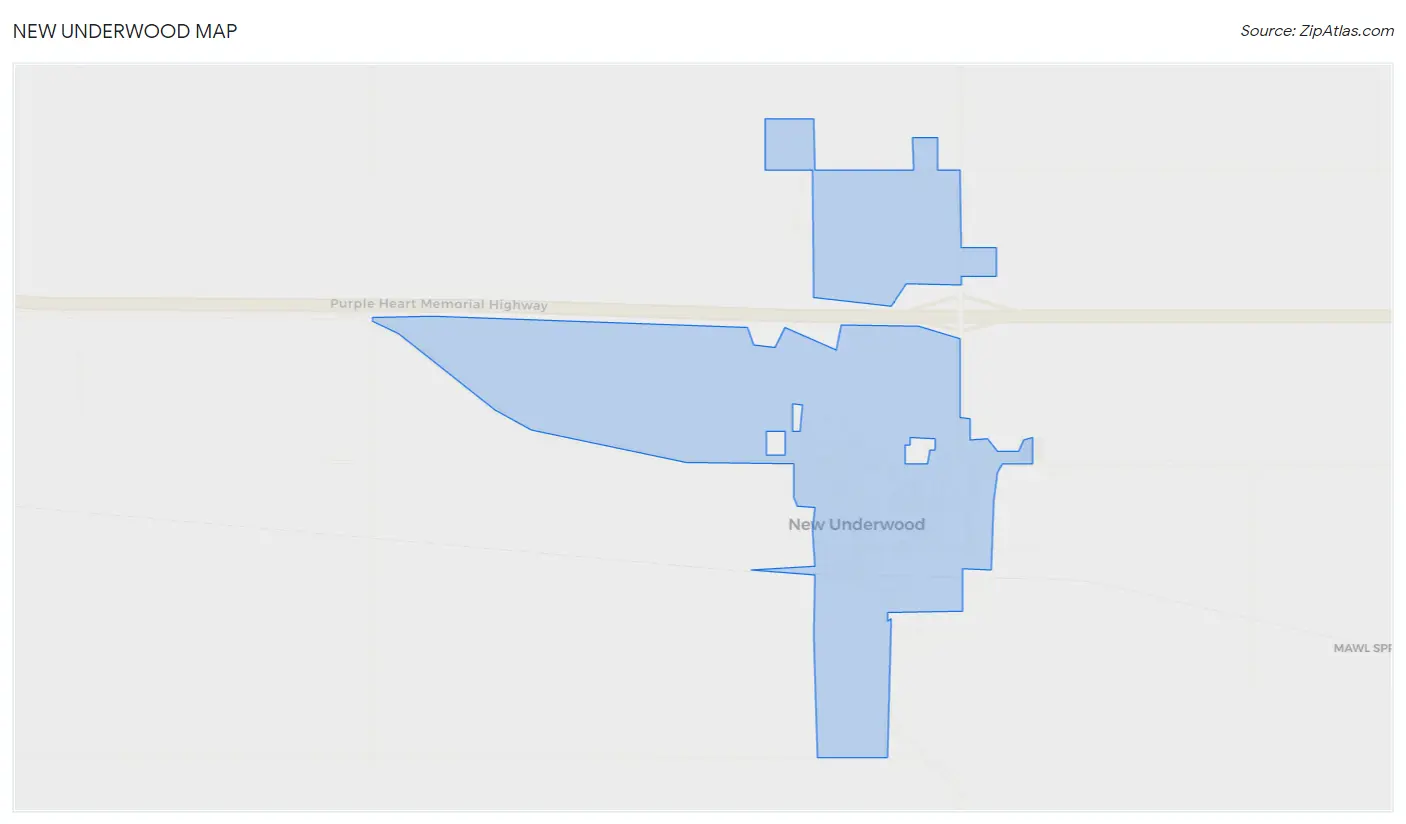
New Underwood Map
New Underwood Overview
$20,481
PER CAPITA INCOME
$52,500
AVG FAMILY INCOME
$49,485
AVG HOUSEHOLD INCOME
39.3%
WAGE / INCOME GAP [ % ]
60.7¢/ $1
WAGE / INCOME GAP [ $ ]
0.40
INEQUALITY / GINI INDEX
574
TOTAL POPULATION
273
MALE POPULATION
301
FEMALE POPULATION
90.70
MALES / 100 FEMALES
110.26
FEMALES / 100 MALES
39.9
MEDIAN AGE
3.5
AVG FAMILY SIZE
3.1
AVG HOUSEHOLD SIZE
246
LABOR FORCE [ PEOPLE ]
56.6%
PERCENT IN LABOR FORCE
6.6%
UNEMPLOYMENT RATE
New Underwood Zip Codes
New Underwood Area Codes
Income in New Underwood
Income Overview in New Underwood
Per Capita Income in New Underwood is $20,481, while median incomes of families and households are $52,500 and $49,485 respectively.
| Characteristic | Number | Measure |
| Per Capita Income | 574 | $20,481 |
| Median Family Income | 104 | $52,500 |
| Mean Family Income | 104 | $61,884 |
| Median Household Income | 171 | $49,485 |
| Mean Household Income | 171 | $57,078 |
| Income Deficit | 104 | $0 |
| Wage / Income Gap (%) | 574 | 39.30% |
| Wage / Income Gap ($) | 574 | 60.70¢ per $1 |
| Gini / Inequality Index | 574 | 0.40 |
Earnings by Sex in New Underwood
Average Earnings in New Underwood are $35,096, $45,536 for men and $27,639 for women, a difference of 39.3%.
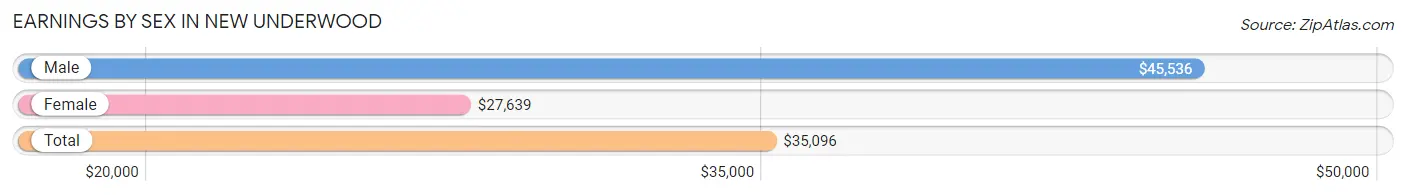
| Sex | Number | Average Earnings |
| Male | 128 (50.2%) | $45,536 |
| Female | 127 (49.8%) | $27,639 |
| Total | 255 (100.0%) | $35,096 |
Earnings by Sex by Income Bracket in New Underwood
The most common earnings brackets in New Underwood are $45,000 to $49,999 for men (31 | 24.2%) and $2,500 to $4,999 for women (19 | 15.0%).
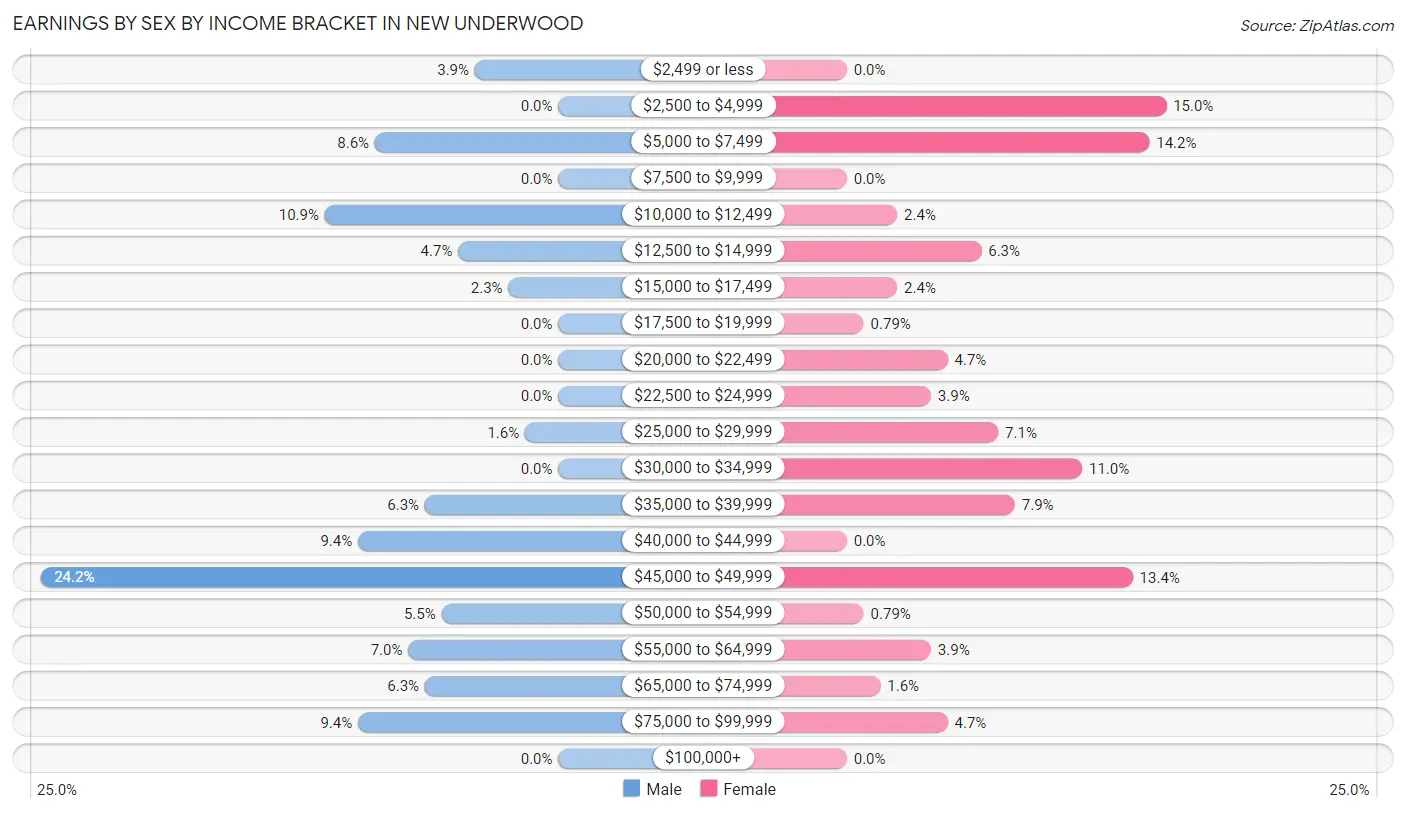
| Income | Male | Female |
| $2,499 or less | 5 (3.9%) | 0 (0.0%) |
| $2,500 to $4,999 | 0 (0.0%) | 19 (15.0%) |
| $5,000 to $7,499 | 11 (8.6%) | 18 (14.2%) |
| $7,500 to $9,999 | 0 (0.0%) | 0 (0.0%) |
| $10,000 to $12,499 | 14 (10.9%) | 3 (2.4%) |
| $12,500 to $14,999 | 6 (4.7%) | 8 (6.3%) |
| $15,000 to $17,499 | 3 (2.3%) | 3 (2.4%) |
| $17,500 to $19,999 | 0 (0.0%) | 1 (0.8%) |
| $20,000 to $22,499 | 0 (0.0%) | 6 (4.7%) |
| $22,500 to $24,999 | 0 (0.0%) | 5 (3.9%) |
| $25,000 to $29,999 | 2 (1.6%) | 9 (7.1%) |
| $30,000 to $34,999 | 0 (0.0%) | 14 (11.0%) |
| $35,000 to $39,999 | 8 (6.2%) | 10 (7.9%) |
| $40,000 to $44,999 | 12 (9.4%) | 0 (0.0%) |
| $45,000 to $49,999 | 31 (24.2%) | 17 (13.4%) |
| $50,000 to $54,999 | 7 (5.5%) | 1 (0.8%) |
| $55,000 to $64,999 | 9 (7.0%) | 5 (3.9%) |
| $65,000 to $74,999 | 8 (6.2%) | 2 (1.6%) |
| $75,000 to $99,999 | 12 (9.4%) | 6 (4.7%) |
| $100,000+ | 0 (0.0%) | 0 (0.0%) |
| Total | 128 (100.0%) | 127 (100.0%) |
Earnings by Sex by Educational Attainment in New Underwood
Average earnings in New Underwood are $44,531 for men and $33,571 for women, a difference of 24.6%. Men with an educational attainment of college or associate's degree enjoy the highest average annual earnings of $46,607, while those with less than high school education earn the least with $44,643. Women with an educational attainment of bachelor's degree earn the most with the average annual earnings of $47,500, while those with college or associate's degree education have the smallest earnings of $31,250.
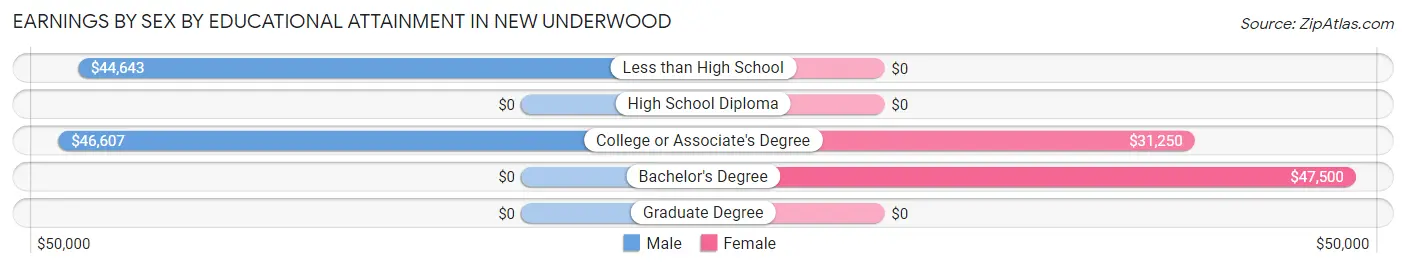
| Educational Attainment | Male Income | Female Income |
| Less than High School | $44,643 | $0 |
| High School Diploma | - | - |
| College or Associate's Degree | $46,607 | $31,250 |
| Bachelor's Degree | - | - |
| Graduate Degree | - | - |
| Total | $44,531 | $33,571 |
Family Income in New Underwood
Family Income Brackets in New Underwood
According to the New Underwood family income data, there are 35 families falling into the $35,000 to $49,999 income range, which is the most common income bracket and makes up 33.7% of all families.
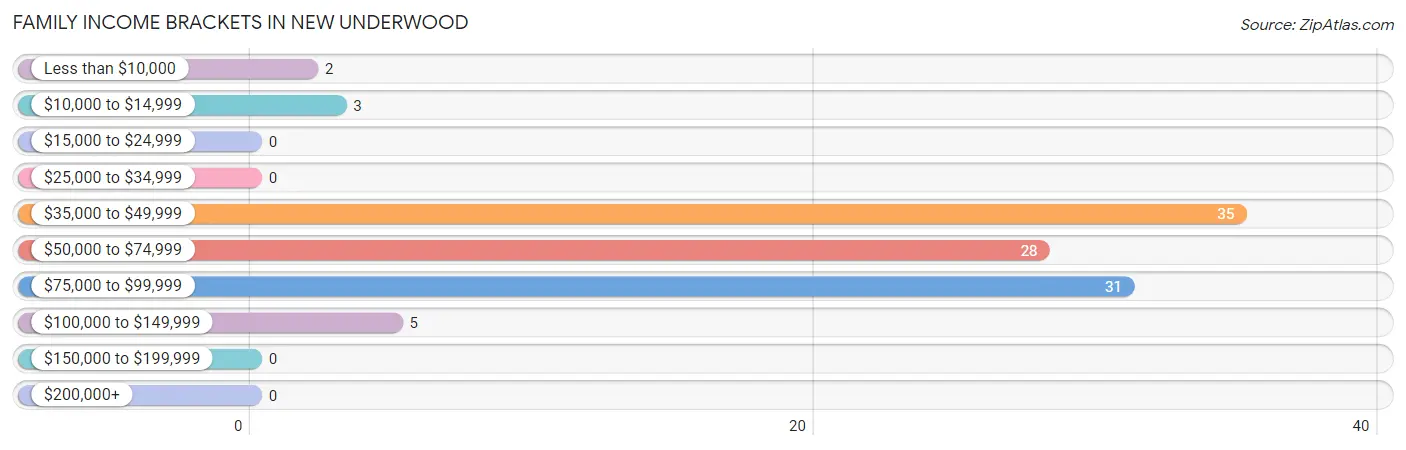
| Income Bracket | # Families | % Families |
| Less than $10,000 | 2 | 1.9% |
| $10,000 to $14,999 | 3 | 2.9% |
| $15,000 to $24,999 | 0 | 0.0% |
| $25,000 to $34,999 | 0 | 0.0% |
| $35,000 to $49,999 | 35 | 33.7% |
| $50,000 to $74,999 | 28 | 26.9% |
| $75,000 to $99,999 | 31 | 29.8% |
| $100,000 to $149,999 | 5 | 4.8% |
| $150,000 to $199,999 | 0 | 0.0% |
| $200,000+ | 0 | 0.0% |
Family Income by Famaliy Size in New Underwood
4-person families (25 | 24.0%) account for the highest median family income in New Underwood with $67,083 per family, while 2-person families (34 | 32.7%) have the highest median income of $27,084 per family member.
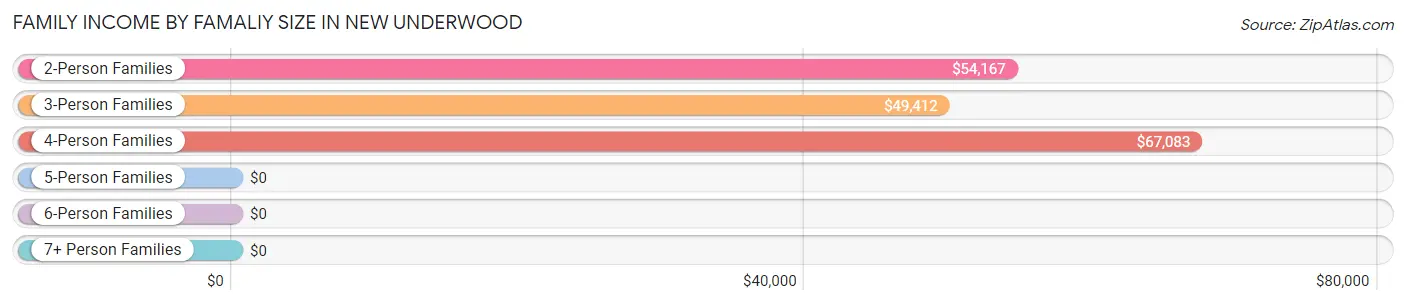
| Income Bracket | # Families | Median Income |
| 2-Person Families | 34 (32.7%) | $54,167 |
| 3-Person Families | 30 (28.8%) | $49,412 |
| 4-Person Families | 25 (24.0%) | $67,083 |
| 5-Person Families | 6 (5.8%) | $0 |
| 6-Person Families | 8 (7.7%) | $0 |
| 7+ Person Families | 1 (1.0%) | $0 |
| Total | 104 (100.0%) | $52,500 |
Family Income by Number of Earners in New Underwood
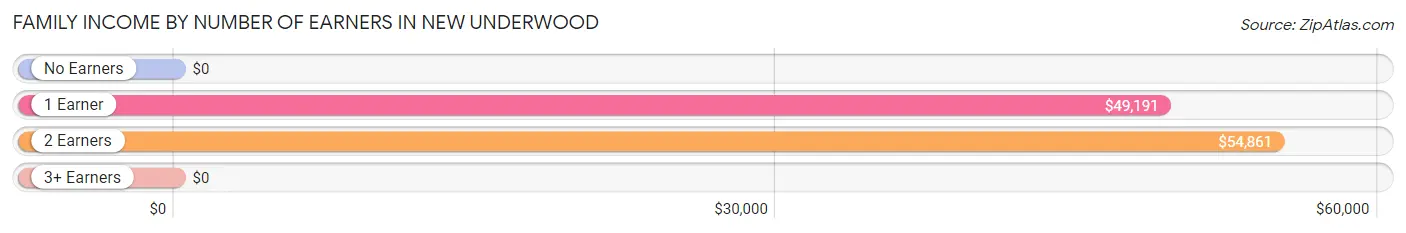
| Number of Earners | # Families | Median Income |
| No Earners | 4 (3.8%) | $0 |
| 1 Earner | 29 (27.9%) | $49,191 |
| 2 Earners | 69 (66.3%) | $54,861 |
| 3+ Earners | 2 (1.9%) | $0 |
| Total | 104 (100.0%) | $52,500 |
Household Income in New Underwood
Household Income Brackets in New Underwood
With 39 households falling in the category, the $75,000 to $99,999 income range is the most frequent in New Underwood, accounting for 22.8% of all households.
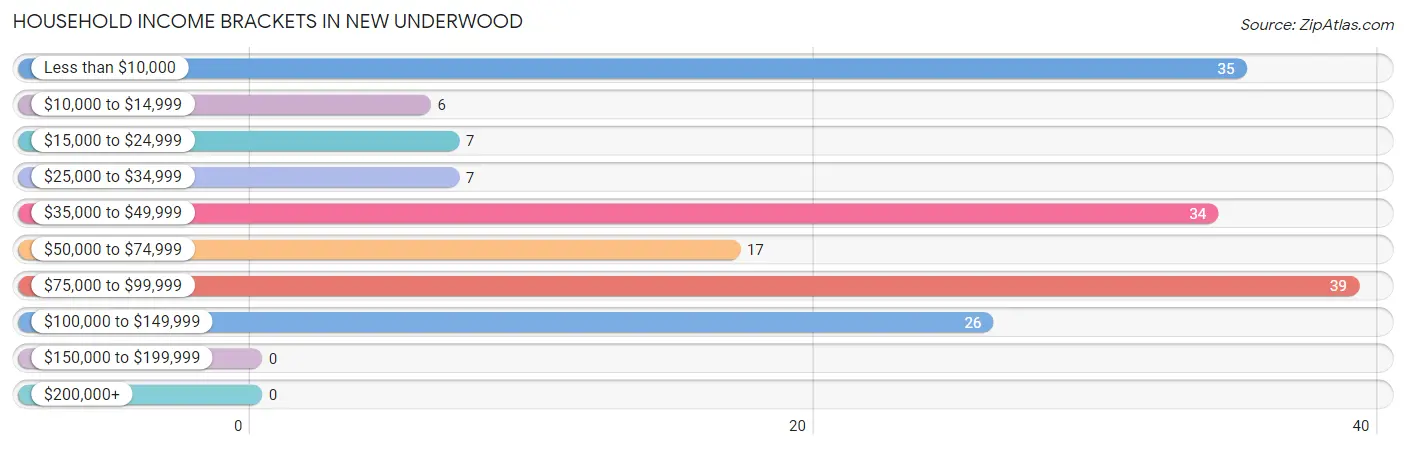
| Income Bracket | # Households | % Households |
| Less than $10,000 | 35 | 20.5% |
| $10,000 to $14,999 | 6 | 3.5% |
| $15,000 to $24,999 | 7 | 4.1% |
| $25,000 to $34,999 | 7 | 4.1% |
| $35,000 to $49,999 | 34 | 19.9% |
| $50,000 to $74,999 | 17 | 9.9% |
| $75,000 to $99,999 | 39 | 22.8% |
| $100,000 to $149,999 | 26 | 15.2% |
| $150,000 to $199,999 | 0 | 0.0% |
| $200,000+ | 0 | 0.0% |
Household Income by Householder Age in New Underwood
The median household income in New Underwood is $49,485, with the highest median household income of $79,107 found in the 25 to 44 years age bracket for the primary householder. A total of 45 households (26.3%) fall into this category. Meanwhile, the 45 to 64 years age bracket for the primary householder has the lowest median household income of $0, with 65 households (38.0%) in this group.
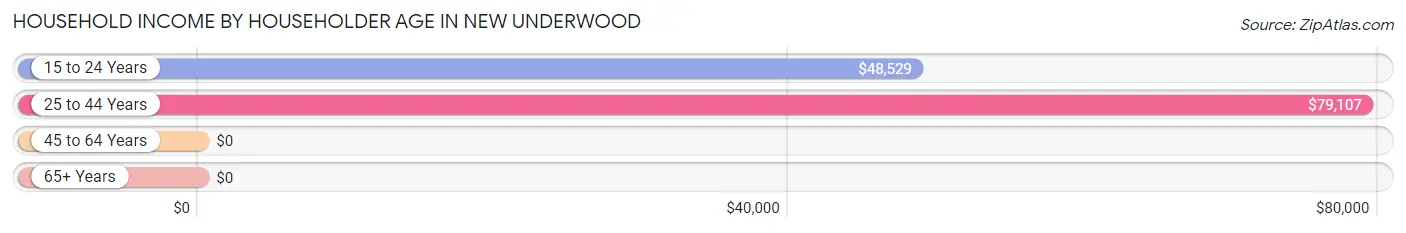
| Income Bracket | # Households | Median Income |
| 15 to 24 Years | 22 (12.9%) | $48,529 |
| 25 to 44 Years | 45 (26.3%) | $79,107 |
| 45 to 64 Years | 65 (38.0%) | $0 |
| 65+ Years | 39 (22.8%) | $0 |
| Total | 171 (100.0%) | $49,485 |
Poverty in New Underwood
Income Below Poverty by Sex and Age in New Underwood
With 28.9% poverty level for males and 15.4% for females among the residents of New Underwood, 25 to 34 year old males and 45 to 54 year old females are the most vulnerable to poverty, with 14 males (100.0%) and 24 females (70.6%) in their respective age groups living below the poverty level.
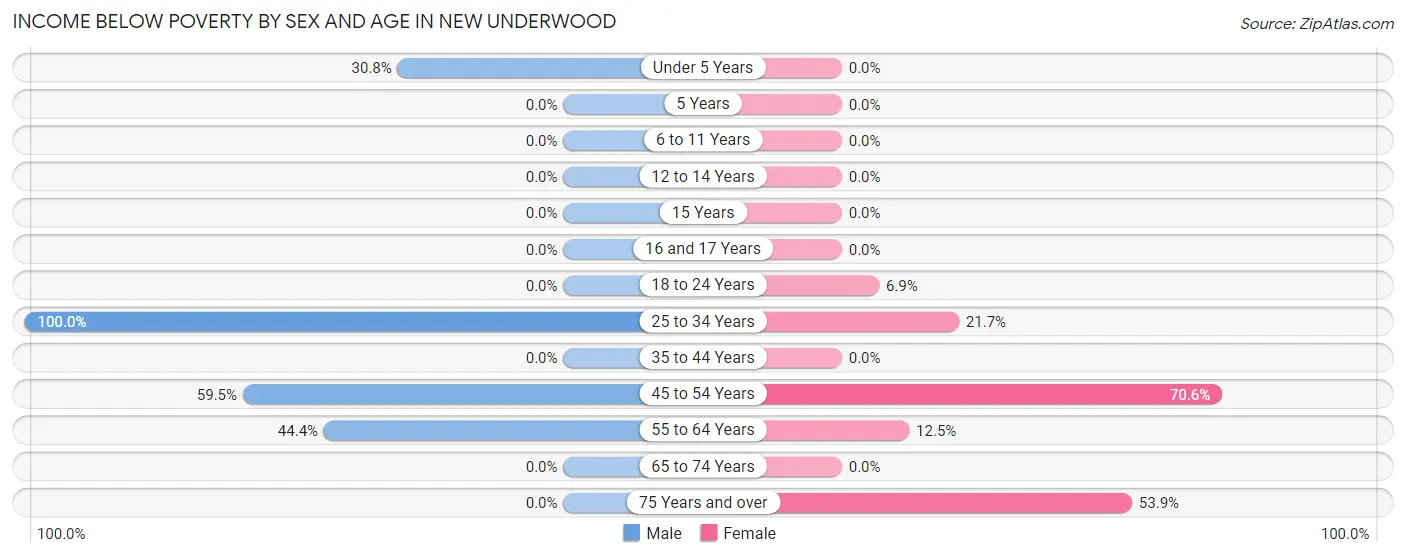
| Age Bracket | Male | Female |
| Under 5 Years | 8 (30.8%) | 0 (0.0%) |
| 5 Years | 0 (0.0%) | 0 (0.0%) |
| 6 to 11 Years | 0 (0.0%) | 0 (0.0%) |
| 12 to 14 Years | 0 (0.0%) | 0 (0.0%) |
| 15 Years | 0 (0.0%) | 0 (0.0%) |
| 16 and 17 Years | 0 (0.0%) | 0 (0.0%) |
| 18 to 24 Years | 0 (0.0%) | 2 (6.9%) |
| 25 to 34 Years | 14 (100.0%) | 5 (21.7%) |
| 35 to 44 Years | 0 (0.0%) | 0 (0.0%) |
| 45 to 54 Years | 47 (59.5%) | 24 (70.6%) |
| 55 to 64 Years | 8 (44.4%) | 2 (12.5%) |
| 65 to 74 Years | 0 (0.0%) | 0 (0.0%) |
| 75 Years and over | 0 (0.0%) | 7 (53.8%) |
| Total | 77 (28.9%) | 40 (15.4%) |
Income Above Poverty by Sex and Age in New Underwood
According to the poverty statistics in New Underwood, males aged 5 years and females aged under 5 years are the age groups that are most secure financially, with 100.0% of males and 100.0% of females in these age groups living above the poverty line.
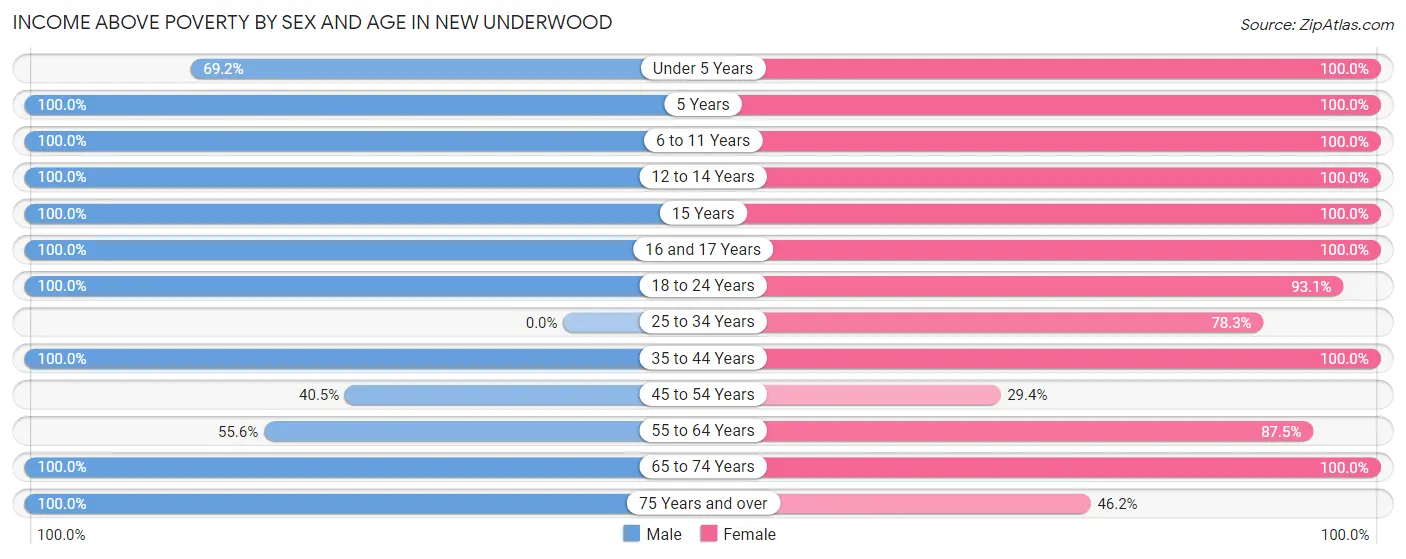
| Age Bracket | Male | Female |
| Under 5 Years | 18 (69.2%) | 12 (100.0%) |
| 5 Years | 5 (100.0%) | 9 (100.0%) |
| 6 to 11 Years | 11 (100.0%) | 10 (100.0%) |
| 12 to 14 Years | 23 (100.0%) | 29 (100.0%) |
| 15 Years | 1 (100.0%) | 13 (100.0%) |
| 16 and 17 Years | 7 (100.0%) | 14 (100.0%) |
| 18 to 24 Years | 20 (100.0%) | 27 (93.1%) |
| 25 to 34 Years | 0 (0.0%) | 18 (78.3%) |
| 35 to 44 Years | 40 (100.0%) | 32 (100.0%) |
| 45 to 54 Years | 32 (40.5%) | 10 (29.4%) |
| 55 to 64 Years | 10 (55.6%) | 14 (87.5%) |
| 65 to 74 Years | 19 (100.0%) | 26 (100.0%) |
| 75 Years and over | 3 (100.0%) | 6 (46.2%) |
| Total | 189 (71.1%) | 220 (84.6%) |
Income Below Poverty Among Married-Couple Families in New Underwood
| Children | Above Poverty | Below Poverty |
| No Children | 23 (100.0%) | 0 (0.0%) |
| 1 or 2 Children | 31 (100.0%) | 0 (0.0%) |
| 3 or 4 Children | 14 (100.0%) | 0 (0.0%) |
| 5 or more Children | 1 (100.0%) | 0 (0.0%) |
| Total | 69 (100.0%) | 0 (0.0%) |
Income Below Poverty Among Single-Parent Households in New Underwood
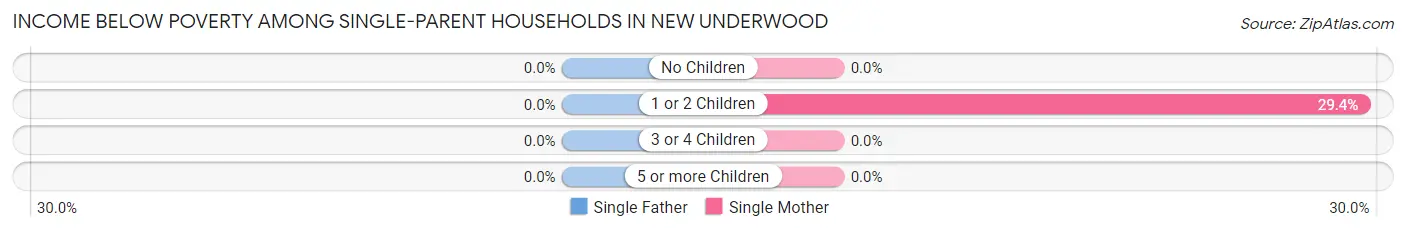
| Children | Single Father | Single Mother |
| No Children | 0 (0.0%) | 0 (0.0%) |
| 1 or 2 Children | 0 (0.0%) | 5 (29.4%) |
| 3 or 4 Children | 0 (0.0%) | 0 (0.0%) |
| 5 or more Children | 0 (0.0%) | 0 (0.0%) |
| Total | 0 (0.0%) | 5 (18.5%) |
Income Below Poverty Among Married-Couple vs Single-Parent Households in New Underwood
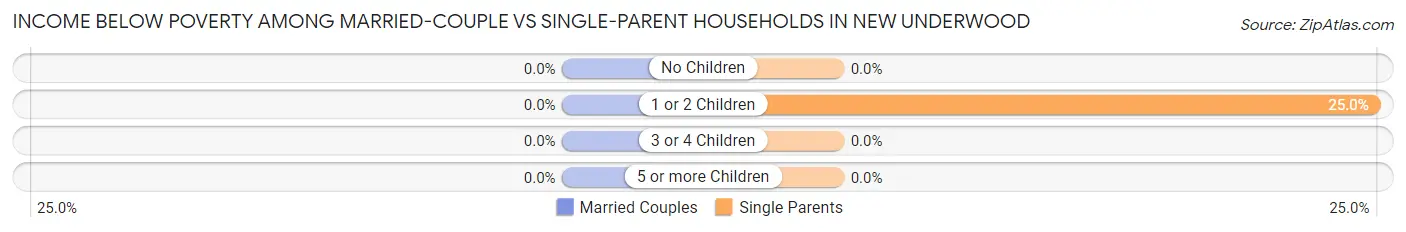
| Children | Married-Couple Families | Single-Parent Households |
| No Children | 0 (0.0%) | 0 (0.0%) |
| 1 or 2 Children | 0 (0.0%) | 5 (25.0%) |
| 3 or 4 Children | 0 (0.0%) | 0 (0.0%) |
| 5 or more Children | 0 (0.0%) | 0 (0.0%) |
| Total | 0 (0.0%) | 5 (14.3%) |
Race in New Underwood
The most populous races in New Underwood are White / Caucasian (479 | 83.5%), Two or more Races (53 | 9.2%), and Hispanic or Latino (33 | 5.8%).
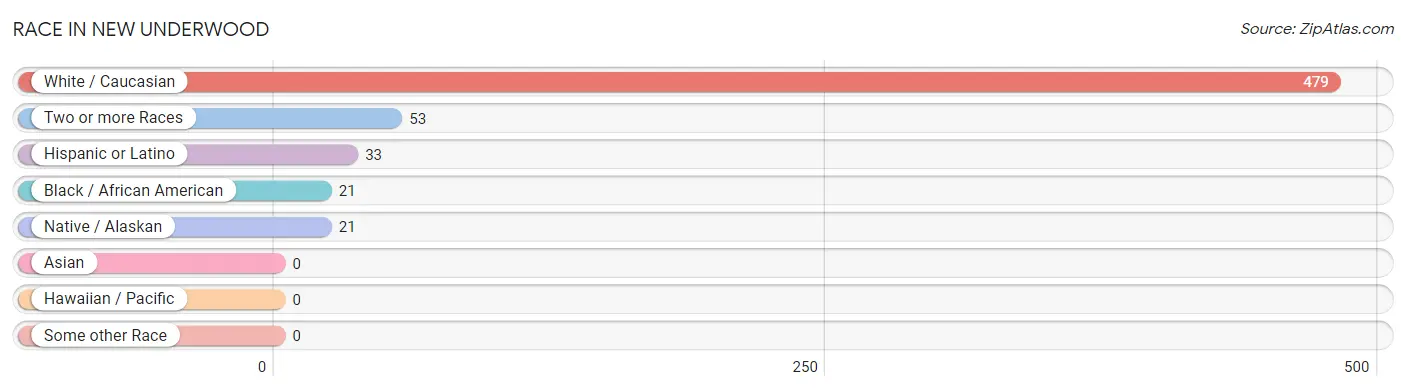
| Race | # Population | % Population |
| Asian | 0 | 0.0% |
| Black / African American | 21 | 3.7% |
| Hawaiian / Pacific | 0 | 0.0% |
| Hispanic or Latino | 33 | 5.8% |
| Native / Alaskan | 21 | 3.7% |
| White / Caucasian | 479 | 83.5% |
| Two or more Races | 53 | 9.2% |
| Some other Race | 0 | 0.0% |
| Total | 574 | 100.0% |
Ancestry in New Underwood
The most populous ancestries reported in New Underwood are German (127 | 22.1%), Italian (64 | 11.2%), European (52 | 9.1%), Korean (38 | 6.6%), and Irish (34 | 5.9%), together accounting for 54.9% of all New Underwood residents.
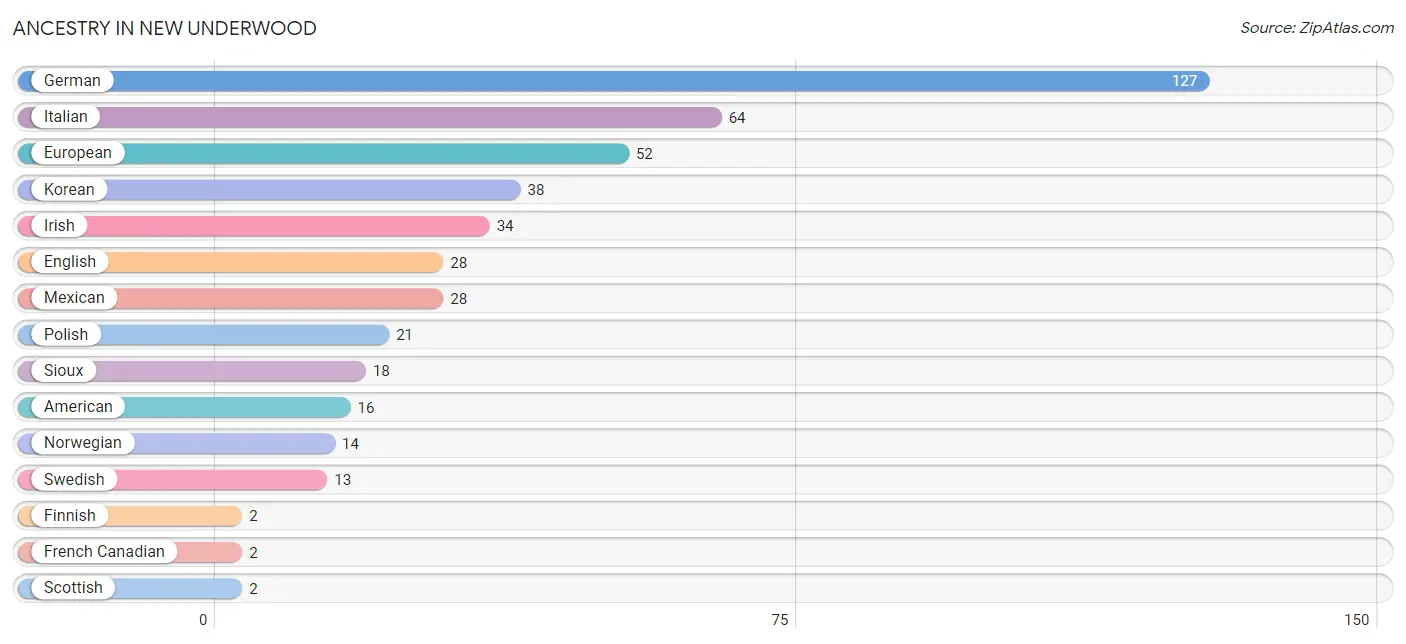
| Ancestry | # Population | % Population |
| American | 16 | 2.8% |
| Bhutanese | 1 | 0.2% |
| English | 28 | 4.9% |
| European | 52 | 9.1% |
| Finnish | 2 | 0.4% |
| French Canadian | 2 | 0.4% |
| German | 127 | 22.1% |
| Irish | 34 | 5.9% |
| Italian | 64 | 11.2% |
| Korean | 38 | 6.6% |
| Mexican | 28 | 4.9% |
| Norwegian | 14 | 2.4% |
| Polish | 21 | 3.7% |
| Scottish | 2 | 0.4% |
| Sioux | 18 | 3.1% |
| Swedish | 13 | 2.3% | View All 16 Rows |
Immigrants in New Underwood
The most numerous immigrant groups reported in New Underwood came from Asia (12 | 2.1%), Philippines (12 | 2.1%), and South Eastern Asia (12 | 2.1%), together accounting for 6.3% of all New Underwood residents.
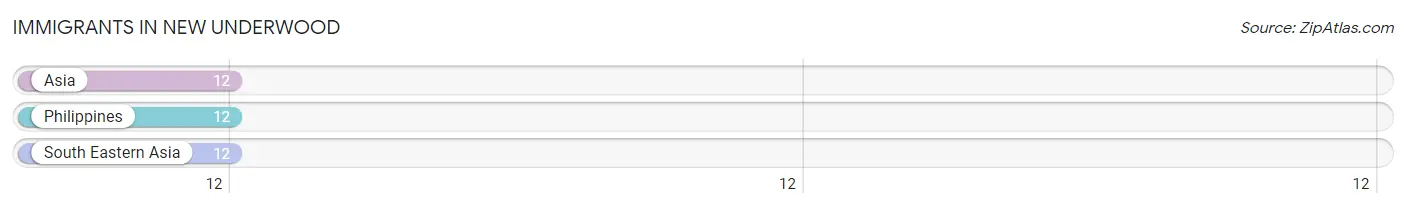
| Immigration Origin | # Population | % Population |
| Asia | 12 | 2.1% |
| Philippines | 12 | 2.1% |
| South Eastern Asia | 12 | 2.1% | View All 3 Rows |
Sex and Age in New Underwood
Sex and Age in New Underwood
The most populous age groups in New Underwood are 50 to 54 Years (73 | 26.7%) for men and 15 to 19 Years (34 | 11.3%) for women.
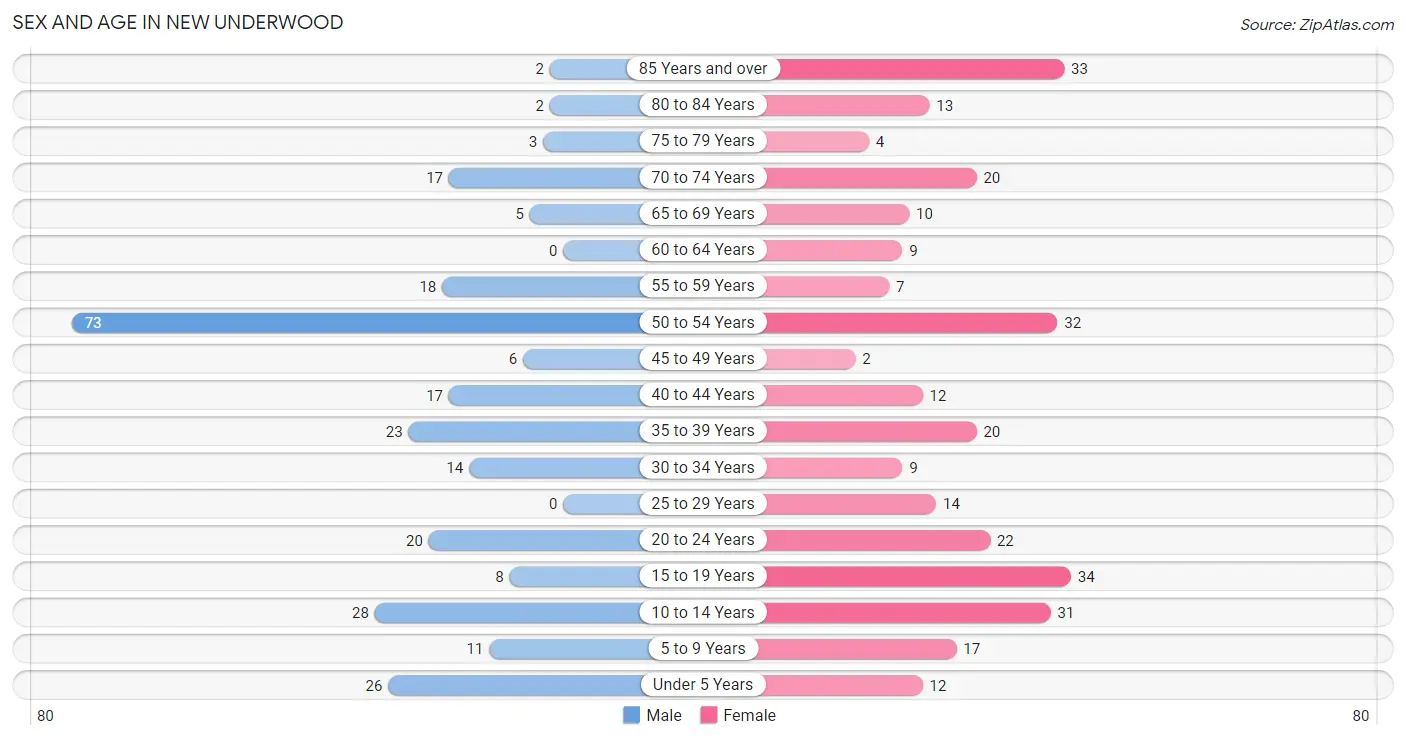
| Age Bracket | Male | Female |
| Under 5 Years | 26 (9.5%) | 12 (4.0%) |
| 5 to 9 Years | 11 (4.0%) | 17 (5.7%) |
| 10 to 14 Years | 28 (10.3%) | 31 (10.3%) |
| 15 to 19 Years | 8 (2.9%) | 34 (11.3%) |
| 20 to 24 Years | 20 (7.3%) | 22 (7.3%) |
| 25 to 29 Years | 0 (0.0%) | 14 (4.6%) |
| 30 to 34 Years | 14 (5.1%) | 9 (3.0%) |
| 35 to 39 Years | 23 (8.4%) | 20 (6.6%) |
| 40 to 44 Years | 17 (6.2%) | 12 (4.0%) |
| 45 to 49 Years | 6 (2.2%) | 2 (0.7%) |
| 50 to 54 Years | 73 (26.7%) | 32 (10.6%) |
| 55 to 59 Years | 18 (6.6%) | 7 (2.3%) |
| 60 to 64 Years | 0 (0.0%) | 9 (3.0%) |
| 65 to 69 Years | 5 (1.8%) | 10 (3.3%) |
| 70 to 74 Years | 17 (6.2%) | 20 (6.6%) |
| 75 to 79 Years | 3 (1.1%) | 4 (1.3%) |
| 80 to 84 Years | 2 (0.7%) | 13 (4.3%) |
| 85 Years and over | 2 (0.7%) | 33 (11.0%) |
| Total | 273 (100.0%) | 301 (100.0%) |
Families and Households in New Underwood
Median Family Size in New Underwood
The median family size in New Underwood is 3.45 persons per family, with married-couple families (69 | 66.3%) accounting for the largest median family size of 3.64 persons per family. On the other hand, single female/mother families (27 | 26.0%) represent the smallest median family size with 3.04 persons per family.
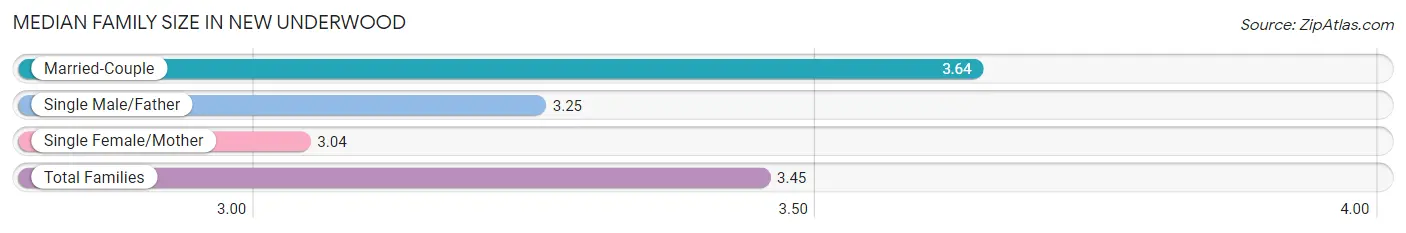
| Family Type | # Families | Family Size |
| Married-Couple | 69 (66.3%) | 3.64 |
| Single Male/Father | 8 (7.7%) | 3.25 |
| Single Female/Mother | 27 (26.0%) | 3.04 |
| Total Families | 104 (100.0%) | 3.45 |
Median Household Size in New Underwood
The median household size in New Underwood is 3.08 persons per household, with married-couple households (69 | 40.4%) accounting for the largest median household size of 3.87 persons per household. non-family households (67 | 39.2%) represent the smallest median household size with 2.01 persons per household.
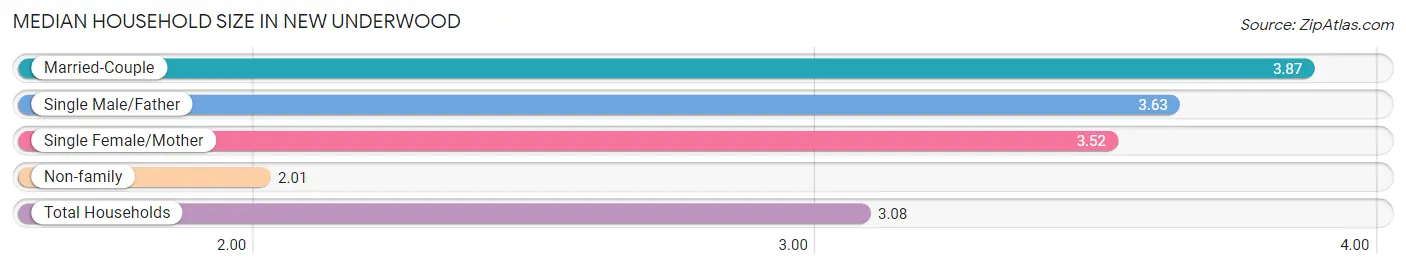
| Household Type | # Households | Household Size |
| Married-Couple | 69 (40.4%) | 3.87 |
| Single Male/Father | 8 (4.7%) | 3.63 |
| Single Female/Mother | 27 (15.8%) | 3.52 |
| Non-family | 67 (39.2%) | 2.01 |
| Total Households | 171 (100.0%) | 3.08 |
Household Size by Marriage Status in New Underwood
Out of a total of 171 households in New Underwood, 104 (60.8%) are family households, while 67 (39.2%) are nonfamily households. The most numerous type of family households are 2-person households, comprising 32, and the most common type of nonfamily households are 2-person households, comprising 36.
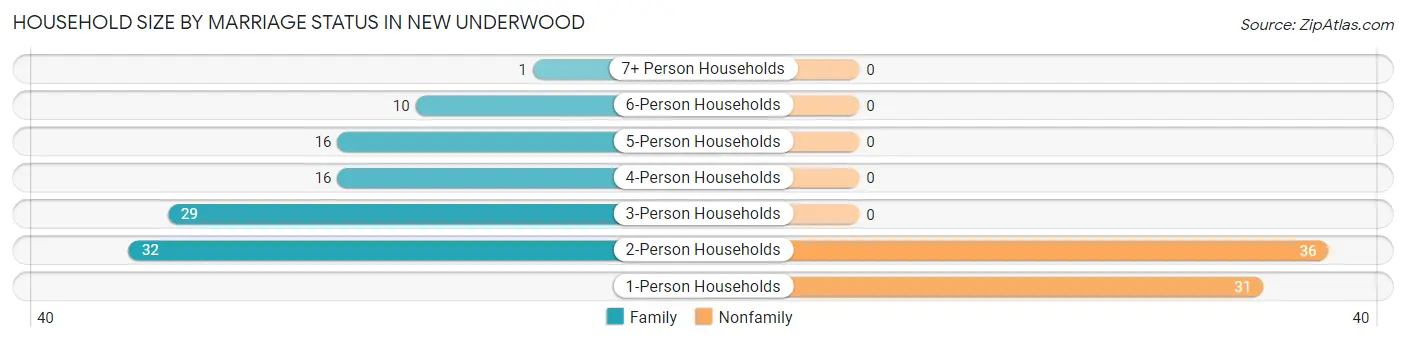
| Household Size | Family Households | Nonfamily Households |
| 1-Person Households | - | 31 (18.1%) |
| 2-Person Households | 32 (18.7%) | 36 (21.0%) |
| 3-Person Households | 29 (17.0%) | 0 (0.0%) |
| 4-Person Households | 16 (9.4%) | 0 (0.0%) |
| 5-Person Households | 16 (9.4%) | 0 (0.0%) |
| 6-Person Households | 10 (5.9%) | 0 (0.0%) |
| 7+ Person Households | 1 (0.6%) | 0 (0.0%) |
| Total | 104 (60.8%) | 67 (39.2%) |
Female Fertility in New Underwood
Fertility by Age in New Underwood
Average fertility rate in New Underwood is 133.0 births per 1,000 women. Women in the age bracket of 20 to 34 years have the highest fertility rate with 333.0 births per 1,000 women. Women in the age bracket of 20 to 34 years acount for 100.0% of all women with births.
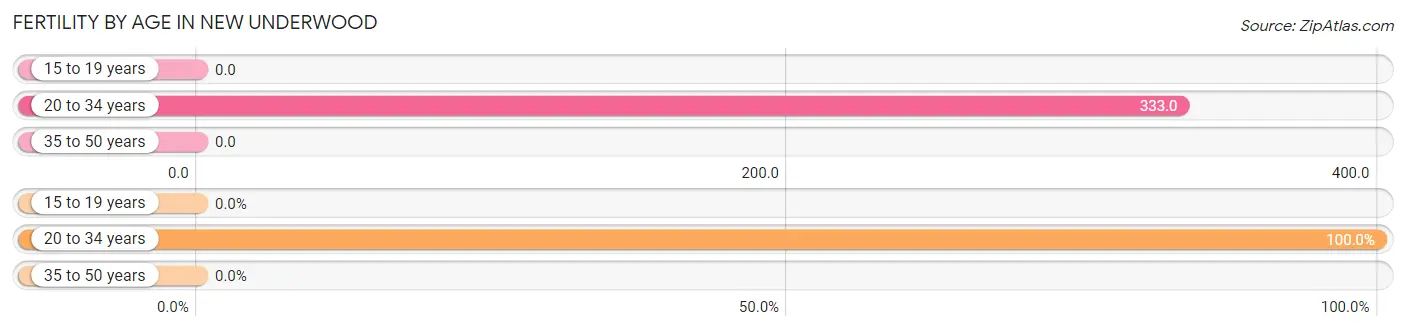
| Age Bracket | Women with Births | Births / 1,000 Women |
| 15 to 19 years | 0 (0.0%) | 0.0 |
| 20 to 34 years | 15 (100.0%) | 333.0 |
| 35 to 50 years | 0 (0.0%) | 0.0 |
| Total | 15 (100.0%) | 133.0 |
Fertility by Age by Marriage Status in New Underwood
86.7% of women with births (15) in New Underwood are married. The highest percentage of unmarried women with births falls into 20 to 34 years age bracket with 13.3% of them unmarried at the time of birth, while the lowest percentage of unmarried women with births belong to 20 to 34 years age bracket with 13.3% of them unmarried.
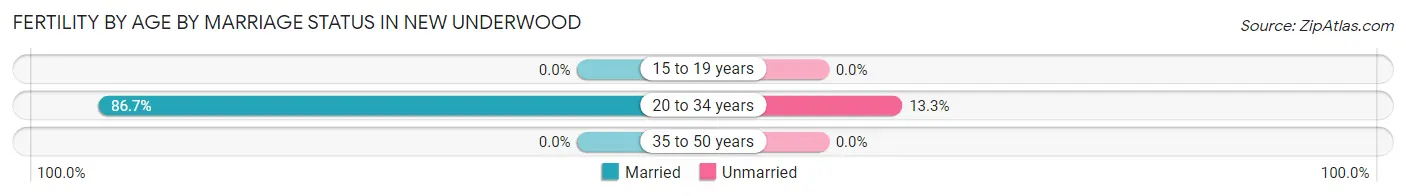
| Age Bracket | Married | Unmarried |
| 15 to 19 years | 0 (0.0%) | 0 (0.0%) |
| 20 to 34 years | 13 (86.7%) | 2 (13.3%) |
| 35 to 50 years | 0 (0.0%) | 0 (0.0%) |
| Total | 13 (86.7%) | 2 (13.3%) |
Fertility by Education in New Underwood
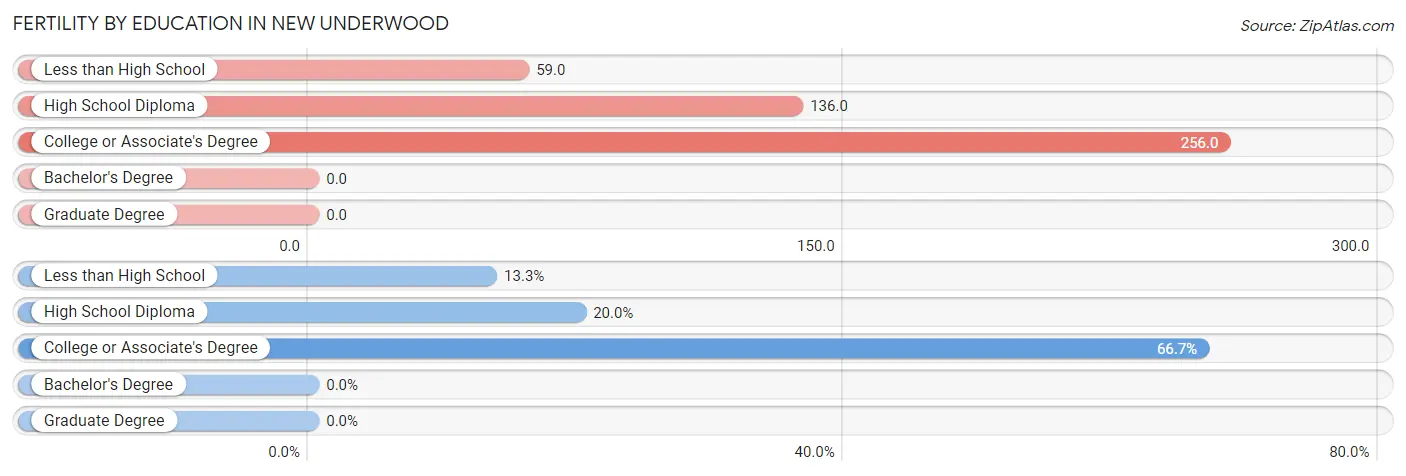
| Educational Attainment | Women with Births | Births / 1,000 Women |
| Less than High School | 2 (13.3%) | 59.0 |
| High School Diploma | 3 (20.0%) | 136.0 |
| College or Associate's Degree | 10 (66.7%) | 256.0 |
| Bachelor's Degree | 0 (0.0%) | 0.0 |
| Graduate Degree | 0 (0.0%) | 0.0 |
| Total | 15 (100.0%) | 133.0 |
Fertility by Education by Marriage Status in New Underwood
13.3% of women with births in New Underwood are unmarried. Women with the educational attainment of high school diploma are most likely to be married with 100.0% of them married at childbirth, while women with the educational attainment of less than high school are least likely to be married with 100.0% of them unmarried at childbirth.
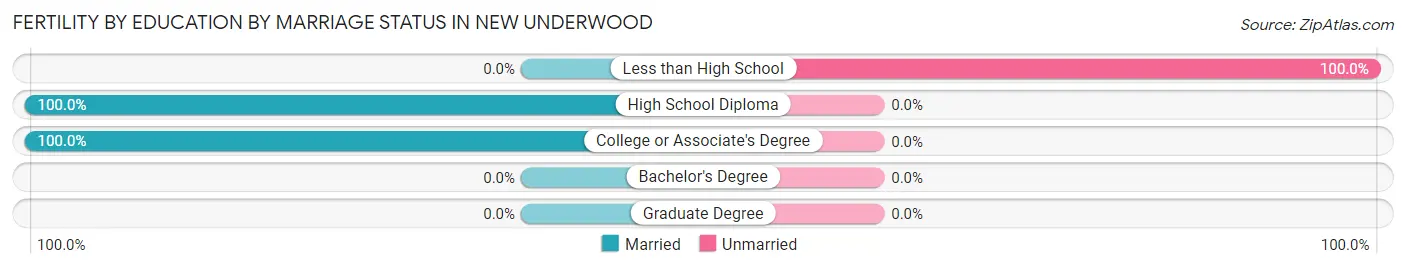
| Educational Attainment | Married | Unmarried |
| Less than High School | 0 (0.0%) | 2 (100.0%) |
| High School Diploma | 3 (100.0%) | 0 (0.0%) |
| College or Associate's Degree | 10 (100.0%) | 0 (0.0%) |
| Bachelor's Degree | 0 (0.0%) | 0 (0.0%) |
| Graduate Degree | 0 (0.0%) | 0 (0.0%) |
| Total | 13 (86.7%) | 2 (13.3%) |
Employment Characteristics in New Underwood
Employment by Class of Employer in New Underwood
Among the 228 employed individuals in New Underwood, private company employees (115 | 50.4%), self-employed (not incorporated) (36 | 15.8%), and federal government employees (30 | 13.2%) make up the most common classes of employment.
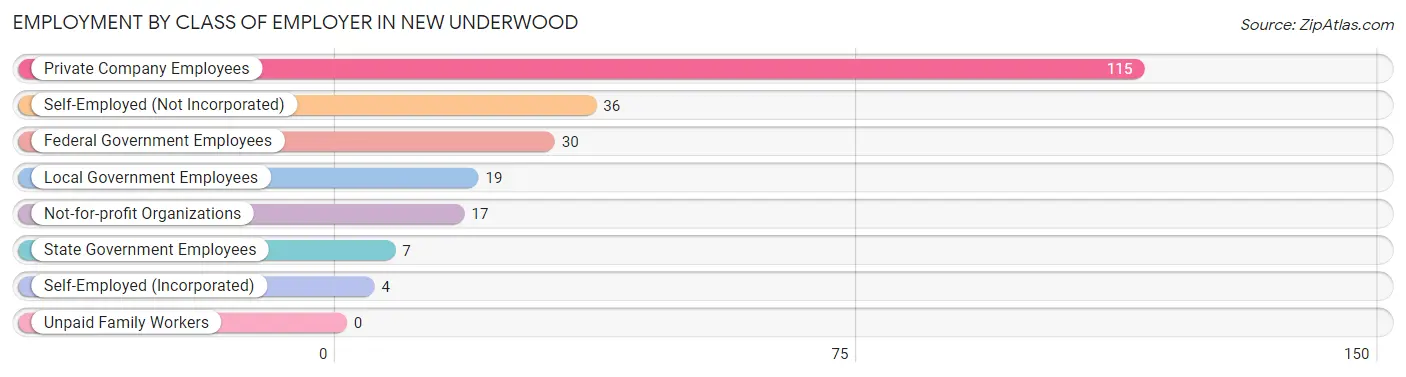
| Employer Class | # Employees | % Employees |
| Private Company Employees | 115 | 50.4% |
| Self-Employed (Incorporated) | 4 | 1.8% |
| Self-Employed (Not Incorporated) | 36 | 15.8% |
| Not-for-profit Organizations | 17 | 7.5% |
| Local Government Employees | 19 | 8.3% |
| State Government Employees | 7 | 3.1% |
| Federal Government Employees | 30 | 13.2% |
| Unpaid Family Workers | 0 | 0.0% |
| Total | 228 | 100.0% |
Employment Status by Age in New Underwood
According to the labor force statistics for New Underwood, out of the total population over 16 years of age (435), 56.6% or 246 individuals are in the labor force, with 6.6% or 16 of them unemployed. The age group with the highest labor force participation rate is 30 to 34 years, with 100.0% or 23 individuals in the labor force. Within the labor force, the 55 to 59 years age range has the highest percentage of unemployed individuals, with 44.4% or 8 of them being unemployed.
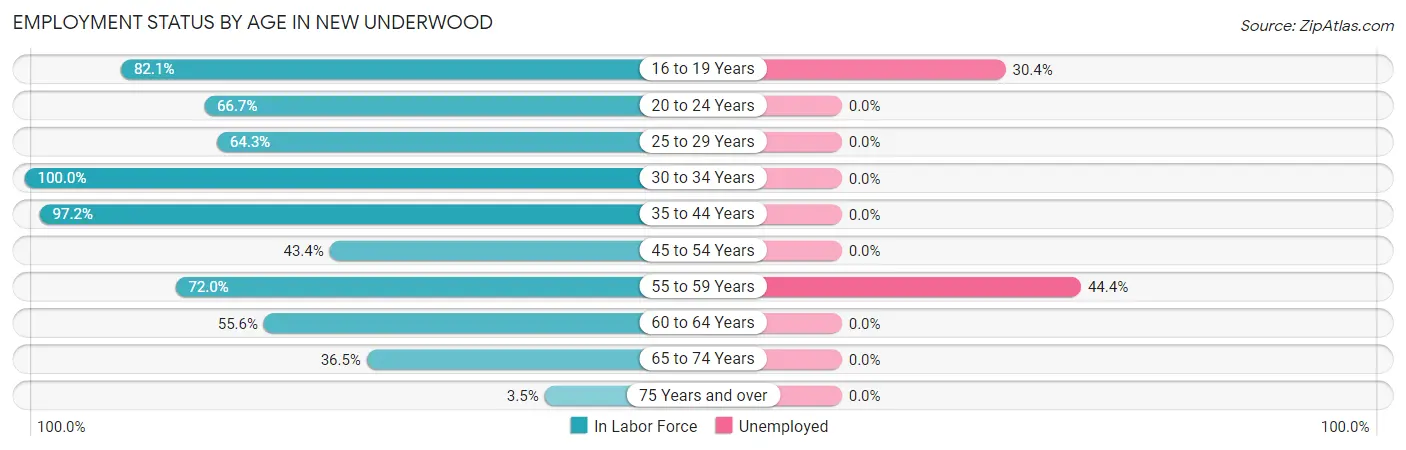
| Age Bracket | In Labor Force | Unemployed |
| 16 to 19 Years | 23 (82.1%) | 7 (30.4%) |
| 20 to 24 Years | 28 (66.7%) | 0 (0.0%) |
| 25 to 29 Years | 9 (64.3%) | 0 (0.0%) |
| 30 to 34 Years | 23 (100.0%) | 0 (0.0%) |
| 35 to 44 Years | 70 (97.2%) | 0 (0.0%) |
| 45 to 54 Years | 49 (43.4%) | 0 (0.0%) |
| 55 to 59 Years | 18 (72.0%) | 8 (44.4%) |
| 60 to 64 Years | 5 (55.6%) | 0 (0.0%) |
| 65 to 74 Years | 19 (36.5%) | 0 (0.0%) |
| 75 Years and over | 2 (3.5%) | 0 (0.0%) |
| Total | 246 (56.6%) | 16 (6.6%) |
Employment Status by Educational Attainment in New Underwood
According to labor force statistics for New Underwood, 68.0% of individuals (174) out of the total population between 25 and 64 years of age (256) are in the labor force, with 4.6% or 8 of them being unemployed. The group with the highest labor force participation rate are those with the educational attainment of less than high school, with 100.0% or 10 individuals in the labor force. Within the labor force, individuals with high school diploma education have the highest percentage of unemployment, with 13.1% or 8 of them being unemployed.
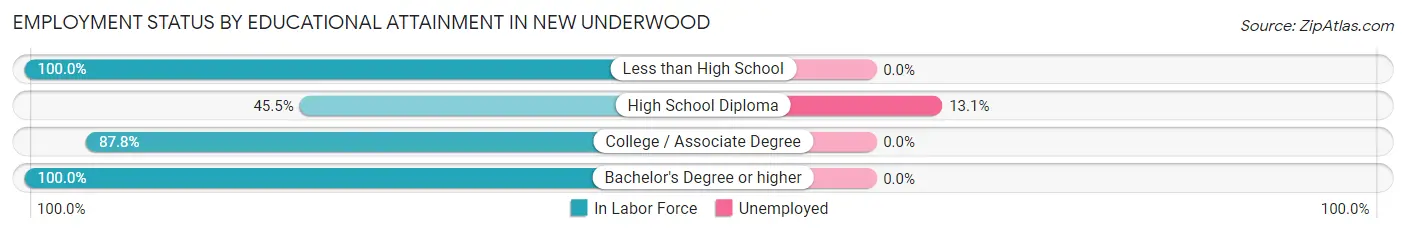
| Educational Attainment | In Labor Force | Unemployed |
| Less than High School | 10 (100.0%) | 0 (0.0%) |
| High School Diploma | 61 (45.5%) | 18 (13.1%) |
| College / Associate Degree | 65 (87.8%) | 0 (0.0%) |
| Bachelor's Degree or higher | 38 (100.0%) | 0 (0.0%) |
| Total | 174 (68.0%) | 12 (4.6%) |
Employment Occupations by Sex in New Underwood
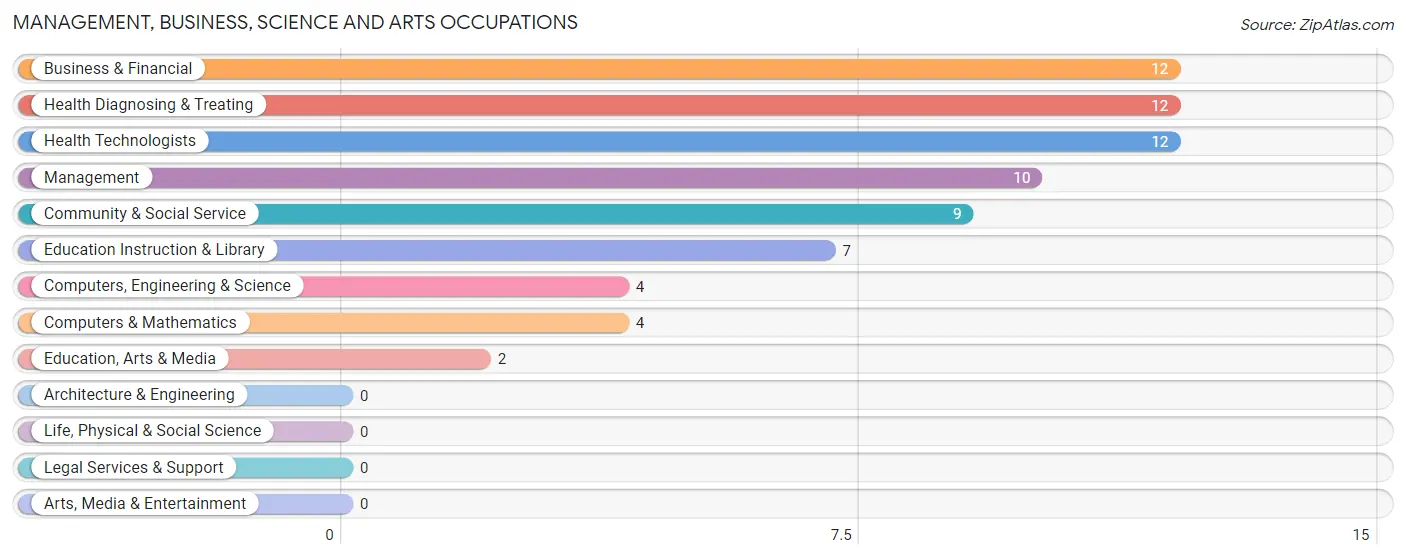
Management, Business, Science and Arts Occupations
The most common Management, Business, Science and Arts occupations in New Underwood are Business & Financial (12 | 5.7%), Health Diagnosing & Treating (12 | 5.7%), Health Technologists (12 | 5.7%), Management (10 | 4.7%), and Community & Social Service (9 | 4.3%).
Management, Business, Science and Arts Occupations by Sex
Within the Management, Business, Science and Arts occupations in New Underwood, the most male-oriented occupations are Business & Financial (83.3%), Health Diagnosing & Treating (83.3%), and Health Technologists (83.3%), while the most female-oriented occupations are Computers, Engineering & Science (100.0%), Computers & Mathematics (100.0%), and Community & Social Service (100.0%).
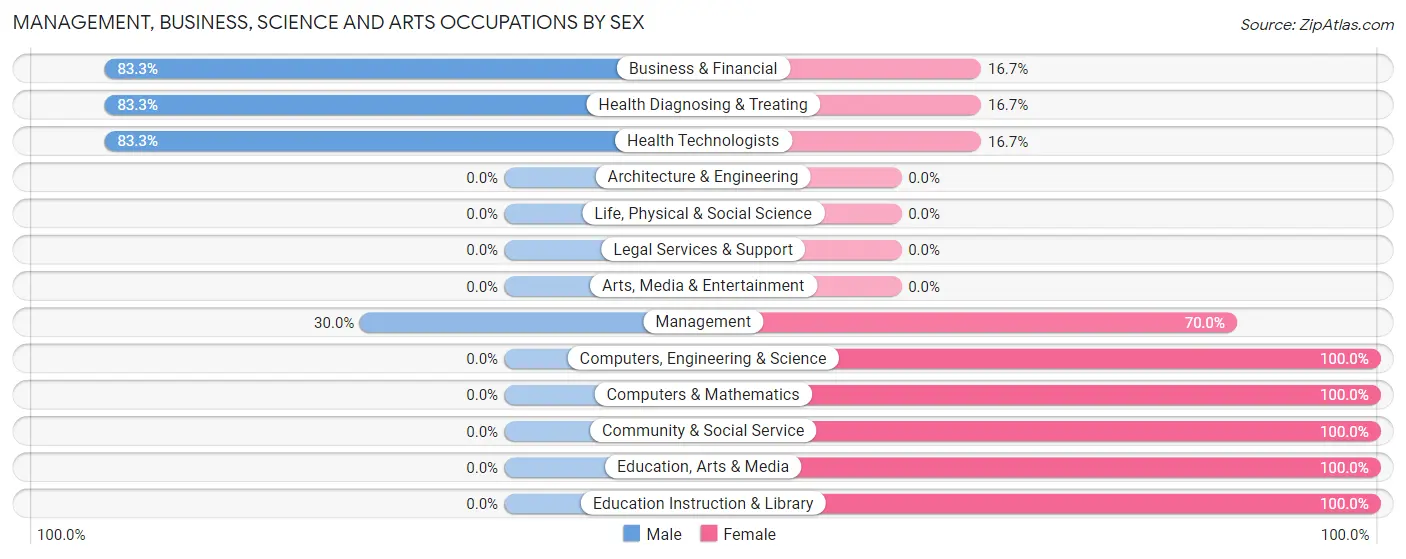
| Occupation | Male | Female |
| Management | 3 (30.0%) | 7 (70.0%) |
| Business & Financial | 10 (83.3%) | 2 (16.7%) |
| Computers, Engineering & Science | 0 (0.0%) | 4 (100.0%) |
| Computers & Mathematics | 0 (0.0%) | 4 (100.0%) |
| Architecture & Engineering | 0 (0.0%) | 0 (0.0%) |
| Life, Physical & Social Science | 0 (0.0%) | 0 (0.0%) |
| Community & Social Service | 0 (0.0%) | 9 (100.0%) |
| Education, Arts & Media | 0 (0.0%) | 2 (100.0%) |
| Legal Services & Support | 0 (0.0%) | 0 (0.0%) |
| Education Instruction & Library | 0 (0.0%) | 7 (100.0%) |
| Arts, Media & Entertainment | 0 (0.0%) | 0 (0.0%) |
| Health Diagnosing & Treating | 10 (83.3%) | 2 (16.7%) |
| Health Technologists | 10 (83.3%) | 2 (16.7%) |
| Total (Category) | 23 (48.9%) | 24 (51.1%) |
| Total (Overall) | 95 (44.8%) | 117 (55.2%) |
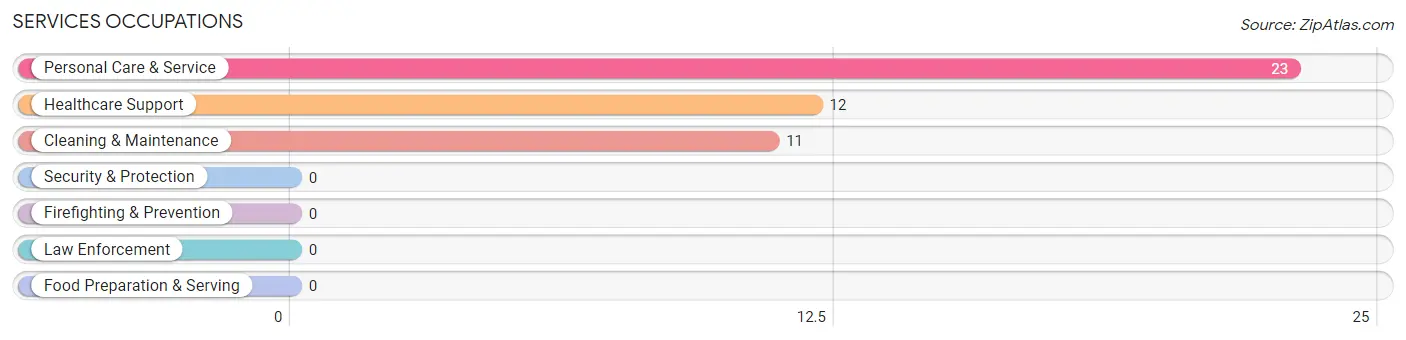
Services Occupations
The most common Services occupations in New Underwood are Personal Care & Service (23 | 10.8%), Healthcare Support (12 | 5.7%), and Cleaning & Maintenance (11 | 5.2%).
Services Occupations by Sex
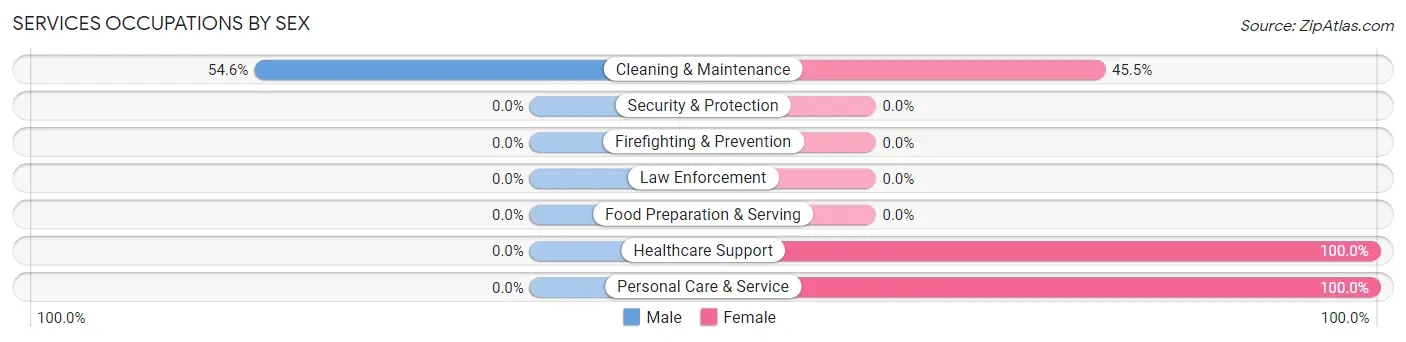
| Occupation | Male | Female |
| Healthcare Support | 0 (0.0%) | 12 (100.0%) |
| Security & Protection | 0 (0.0%) | 0 (0.0%) |
| Firefighting & Prevention | 0 (0.0%) | 0 (0.0%) |
| Law Enforcement | 0 (0.0%) | 0 (0.0%) |
| Food Preparation & Serving | 0 (0.0%) | 0 (0.0%) |
| Cleaning & Maintenance | 6 (54.5%) | 5 (45.5%) |
| Personal Care & Service | 0 (0.0%) | 23 (100.0%) |
| Total (Category) | 6 (13.0%) | 40 (87.0%) |
| Total (Overall) | 95 (44.8%) | 117 (55.2%) |
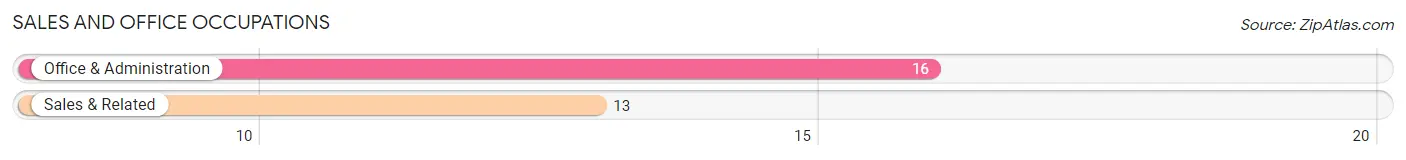
Sales and Office Occupations
The most common Sales and Office occupations in New Underwood are Office & Administration (16 | 7.5%), and Sales & Related (13 | 6.1%).
Sales and Office Occupations by Sex
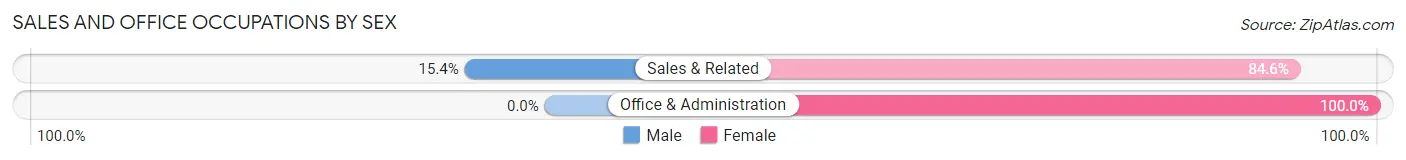
| Occupation | Male | Female |
| Sales & Related | 2 (15.4%) | 11 (84.6%) |
| Office & Administration | 0 (0.0%) | 16 (100.0%) |
| Total (Category) | 2 (6.9%) | 27 (93.1%) |
| Total (Overall) | 95 (44.8%) | 117 (55.2%) |
Natural Resources, Construction and Maintenance Occupations
The most common Natural Resources, Construction and Maintenance occupations in New Underwood are Construction & Extraction (28 | 13.2%), Installation, Maintenance & Repair (21 | 9.9%), and Farming, Fishing & Forestry (1 | 0.5%).
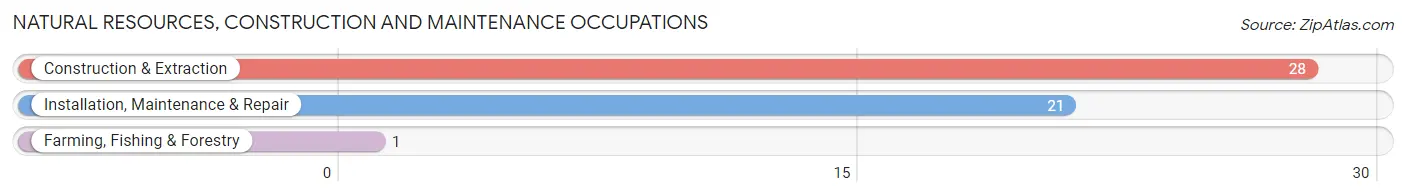
Natural Resources, Construction and Maintenance Occupations by Sex
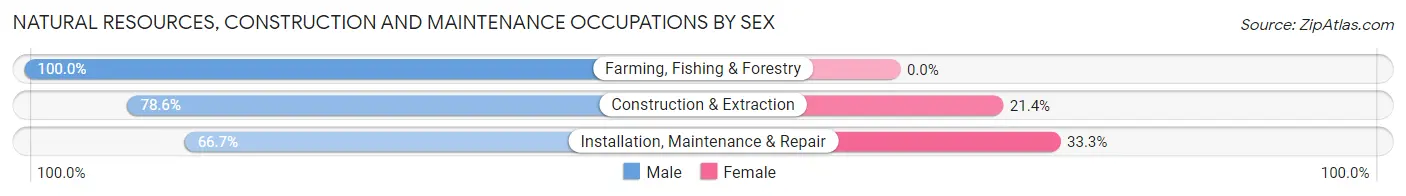
| Occupation | Male | Female |
| Farming, Fishing & Forestry | 1 (100.0%) | 0 (0.0%) |
| Construction & Extraction | 22 (78.6%) | 6 (21.4%) |
| Installation, Maintenance & Repair | 14 (66.7%) | 7 (33.3%) |
| Total (Category) | 37 (74.0%) | 13 (26.0%) |
| Total (Overall) | 95 (44.8%) | 117 (55.2%) |
Production, Transportation and Moving Occupations
The most common Production, Transportation and Moving occupations in New Underwood are Production (22 | 10.4%), Transportation (12 | 5.7%), and Material Moving (6 | 2.8%).
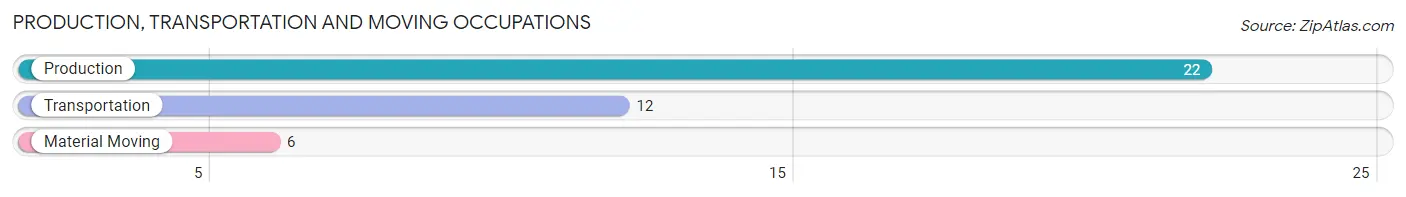
Production, Transportation and Moving Occupations by Sex
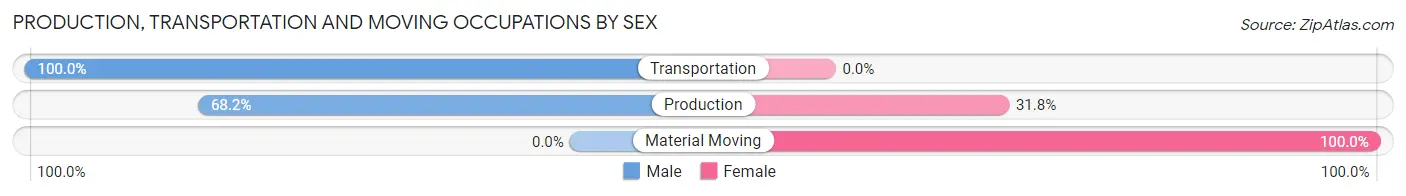
| Occupation | Male | Female |
| Production | 15 (68.2%) | 7 (31.8%) |
| Transportation | 12 (100.0%) | 0 (0.0%) |
| Material Moving | 0 (0.0%) | 6 (100.0%) |
| Total (Category) | 27 (67.5%) | 13 (32.5%) |
| Total (Overall) | 95 (44.8%) | 117 (55.2%) |
Employment Industries by Sex in New Underwood
Employment Industries in New Underwood
The major employment industries in New Underwood include Construction (36 | 17.0%), Health Care & Social Assistance (35 | 16.5%), Educational Services (21 | 9.9%), Transportation & Warehousing (18 | 8.5%), and Public Administration (15 | 7.1%).
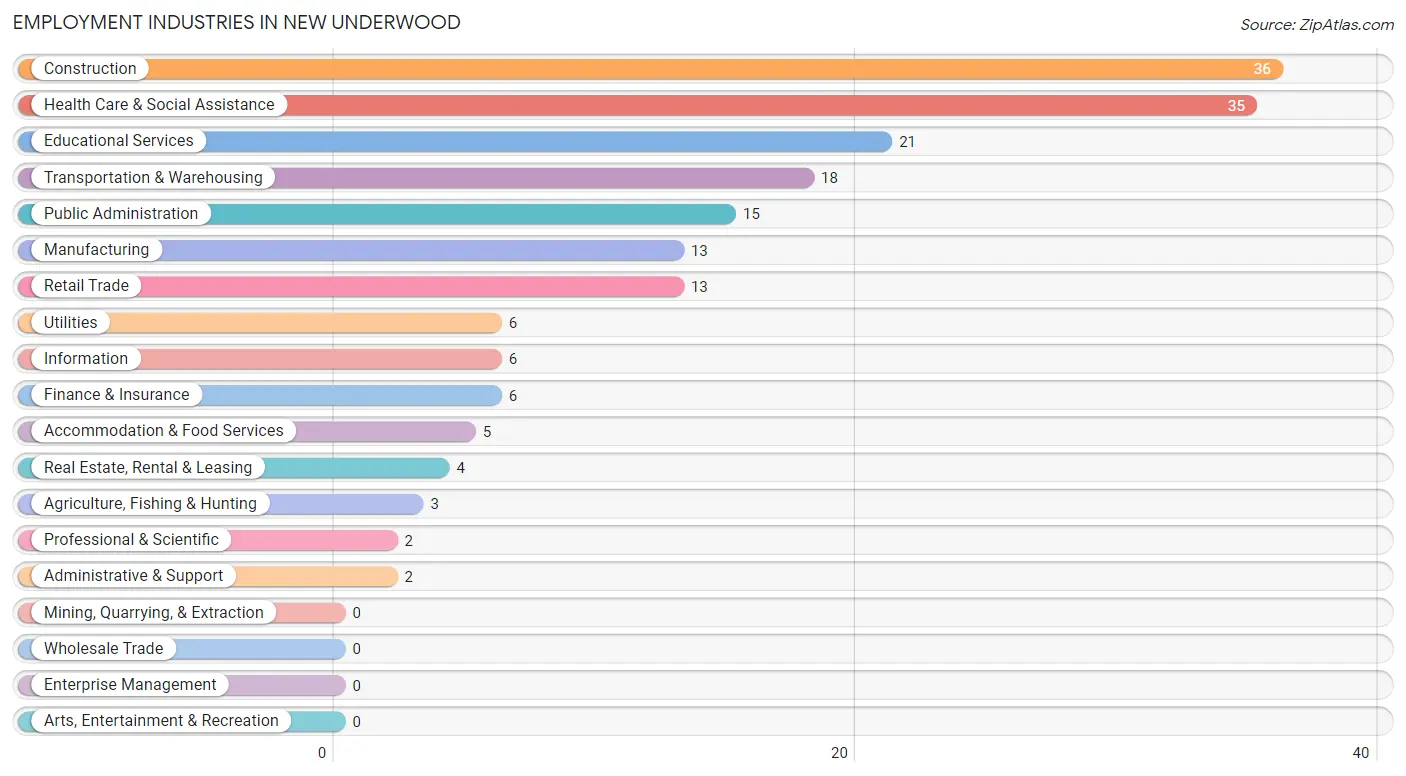
Employment Industries by Sex in New Underwood
The New Underwood industries that see more men than women are Agriculture, Fishing & Hunting (100.0%), Utilities (100.0%), and Administrative & Support (100.0%), whereas the industries that tend to have a higher number of women are Information (100.0%), Finance & Insurance (100.0%), and Real Estate, Rental & Leasing (100.0%).
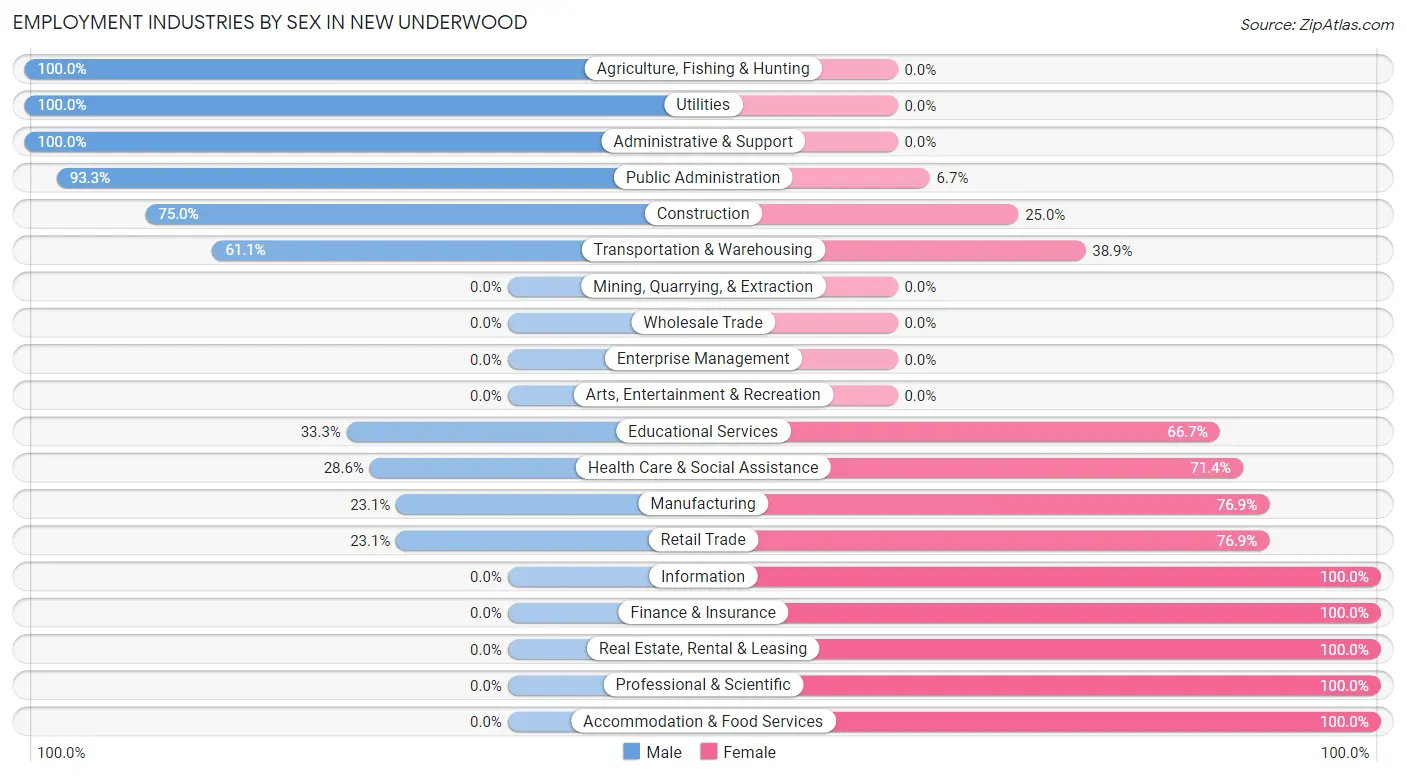
| Industry | Male | Female |
| Agriculture, Fishing & Hunting | 3 (100.0%) | 0 (0.0%) |
| Mining, Quarrying, & Extraction | 0 (0.0%) | 0 (0.0%) |
| Construction | 27 (75.0%) | 9 (25.0%) |
| Manufacturing | 3 (23.1%) | 10 (76.9%) |
| Wholesale Trade | 0 (0.0%) | 0 (0.0%) |
| Retail Trade | 3 (23.1%) | 10 (76.9%) |
| Transportation & Warehousing | 11 (61.1%) | 7 (38.9%) |
| Utilities | 6 (100.0%) | 0 (0.0%) |
| Information | 0 (0.0%) | 6 (100.0%) |
| Finance & Insurance | 0 (0.0%) | 6 (100.0%) |
| Real Estate, Rental & Leasing | 0 (0.0%) | 4 (100.0%) |
| Professional & Scientific | 0 (0.0%) | 2 (100.0%) |
| Enterprise Management | 0 (0.0%) | 0 (0.0%) |
| Administrative & Support | 2 (100.0%) | 0 (0.0%) |
| Educational Services | 7 (33.3%) | 14 (66.7%) |
| Health Care & Social Assistance | 10 (28.6%) | 25 (71.4%) |
| Arts, Entertainment & Recreation | 0 (0.0%) | 0 (0.0%) |
| Accommodation & Food Services | 0 (0.0%) | 5 (100.0%) |
| Public Administration | 14 (93.3%) | 1 (6.7%) |
| Total | 95 (44.8%) | 117 (55.2%) |
Education in New Underwood
School Enrollment in New Underwood
The most common levels of schooling among the 175 students in New Underwood are high school (53 | 30.3%), middle school (46 | 26.3%), and college / undergraduate (29 | 16.6%).
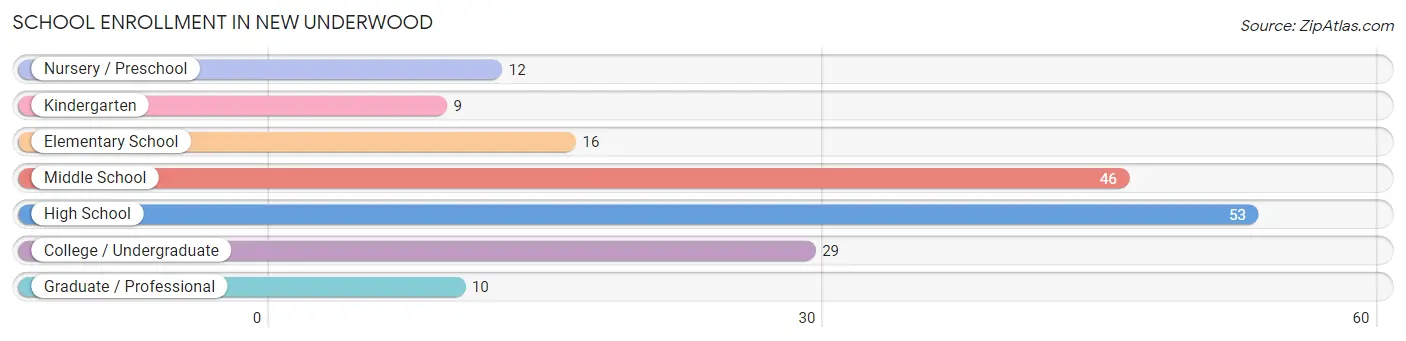
| School Level | # Students | % Students |
| Nursery / Preschool | 12 | 6.9% |
| Kindergarten | 9 | 5.1% |
| Elementary School | 16 | 9.1% |
| Middle School | 46 | 26.3% |
| High School | 53 | 30.3% |
| College / Undergraduate | 29 | 16.6% |
| Graduate / Professional | 10 | 5.7% |
| Total | 175 | 100.0% |
School Enrollment by Age by Funding Source in New Underwood
Out of a total of 175 students who are enrolled in schools in New Underwood, 3 (1.7%) attend a private institution, while the remaining 172 (98.3%) are enrolled in public schools. The age group of 10 to 14 year olds has the highest likelihood of being enrolled in private schools, with 3 (5.1% in the age bracket) enrolled. Conversely, the age group of 3 to 4 year olds has the lowest likelihood of being enrolled in a private school, with 7 (100.0% in the age bracket) attending a public institution.
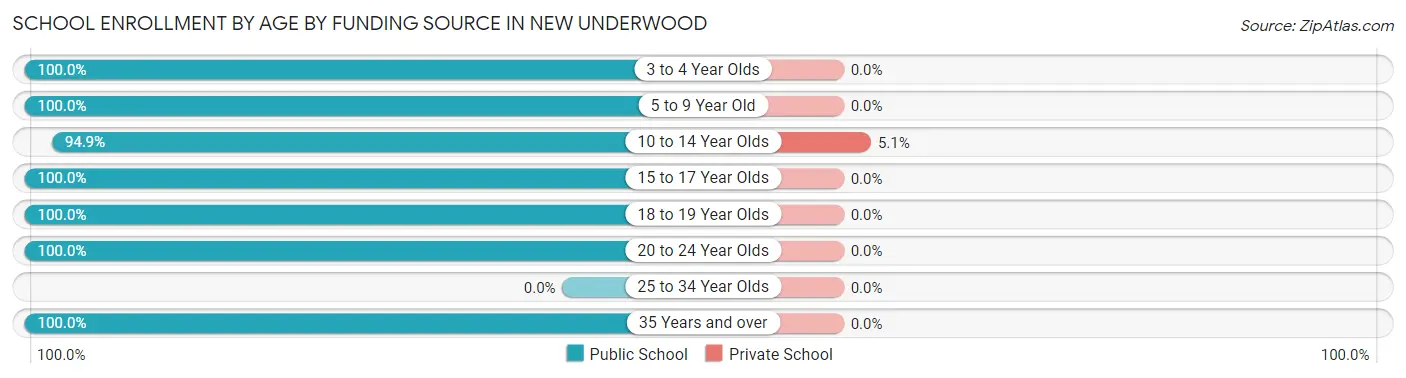
| Age Bracket | Public School | Private School |
| 3 to 4 Year Olds | 7 (100.0%) | 0 (0.0%) |
| 5 to 9 Year Old | 28 (100.0%) | 0 (0.0%) |
| 10 to 14 Year Olds | 56 (94.9%) | 3 (5.1%) |
| 15 to 17 Year Olds | 35 (100.0%) | 0 (0.0%) |
| 18 to 19 Year Olds | 7 (100.0%) | 0 (0.0%) |
| 20 to 24 Year Olds | 29 (100.0%) | 0 (0.0%) |
| 25 to 34 Year Olds | 0 (0.0%) | 0 (0.0%) |
| 35 Years and over | 10 (100.0%) | 0 (0.0%) |
| Total | 172 (98.3%) | 3 (1.7%) |
Educational Attainment by Field of Study in New Underwood
Business (21 | 43.8%), science & technology (9 | 18.8%), arts & humanities (7 | 14.6%), bio, nature & agricultural (3 | 6.2%), and visual & performing arts (3 | 6.2%) are the most common fields of study among 48 individuals in New Underwood who have obtained a bachelor's degree or higher.
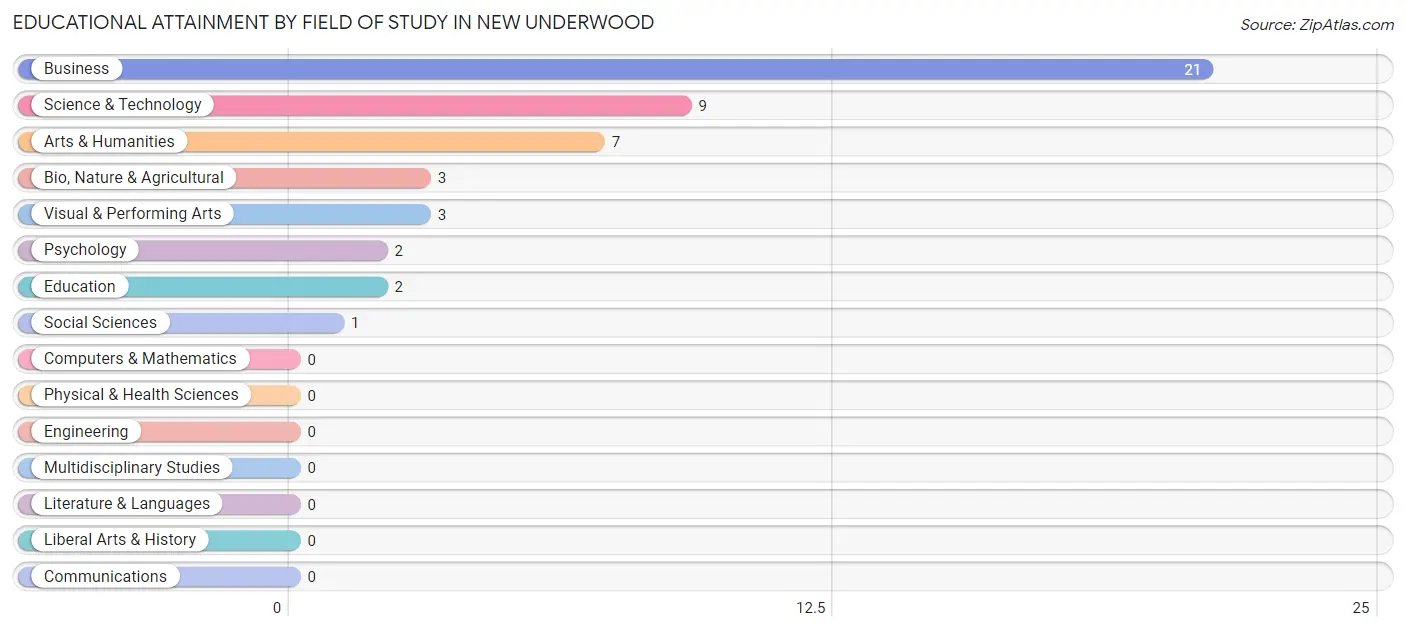
| Field of Study | # Graduates | % Graduates |
| Computers & Mathematics | 0 | 0.0% |
| Bio, Nature & Agricultural | 3 | 6.2% |
| Physical & Health Sciences | 0 | 0.0% |
| Psychology | 2 | 4.2% |
| Social Sciences | 1 | 2.1% |
| Engineering | 0 | 0.0% |
| Multidisciplinary Studies | 0 | 0.0% |
| Science & Technology | 9 | 18.8% |
| Business | 21 | 43.8% |
| Education | 2 | 4.2% |
| Literature & Languages | 0 | 0.0% |
| Liberal Arts & History | 0 | 0.0% |
| Visual & Performing Arts | 3 | 6.2% |
| Communications | 0 | 0.0% |
| Arts & Humanities | 7 | 14.6% |
| Total | 48 | 100.0% |
Transportation & Commute in New Underwood
Vehicle Availability by Sex in New Underwood
The most prevalent vehicle ownership categories in New Underwood are males with 2 vehicles (62, accounting for 54.4%) and females with 2 vehicles (41, making up 54.4%).
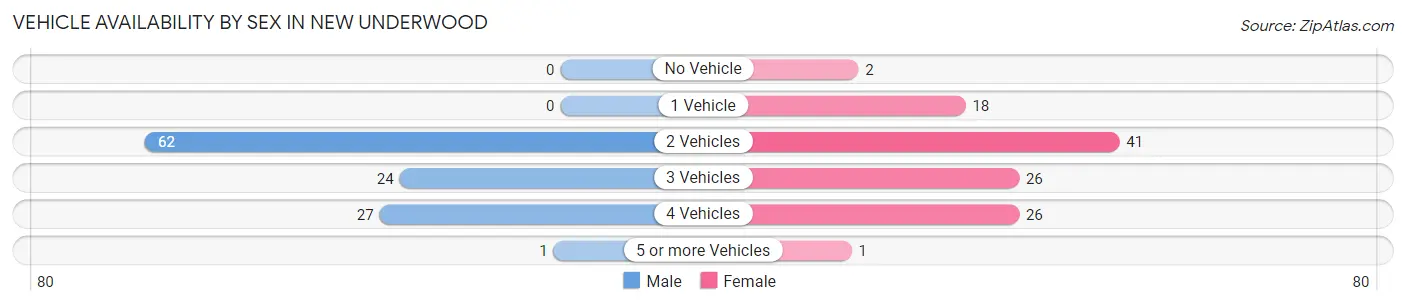
| Vehicles Available | Male | Female |
| No Vehicle | 0 (0.0%) | 2 (1.8%) |
| 1 Vehicle | 0 (0.0%) | 18 (15.8%) |
| 2 Vehicles | 62 (54.4%) | 41 (36.0%) |
| 3 Vehicles | 24 (21.0%) | 26 (22.8%) |
| 4 Vehicles | 27 (23.7%) | 26 (22.8%) |
| 5 or more Vehicles | 1 (0.9%) | 1 (0.9%) |
| Total | 114 (100.0%) | 114 (100.0%) |
Commute Time in New Underwood
The most frequently occuring commute durations in New Underwood are 30 to 34 minutes (51 commuters, 23.3%), 25 to 29 minutes (39 commuters, 17.8%), and 15 to 19 minutes (30 commuters, 13.7%).
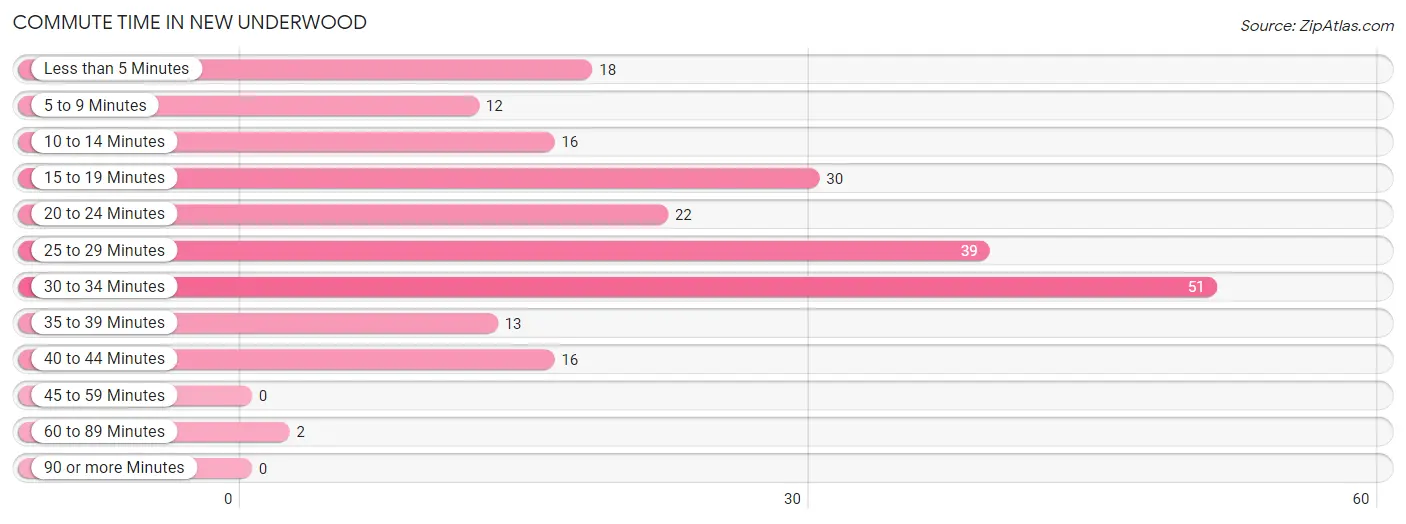
| Commute Time | # Commuters | % Commuters |
| Less than 5 Minutes | 18 | 8.2% |
| 5 to 9 Minutes | 12 | 5.5% |
| 10 to 14 Minutes | 16 | 7.3% |
| 15 to 19 Minutes | 30 | 13.7% |
| 20 to 24 Minutes | 22 | 10.1% |
| 25 to 29 Minutes | 39 | 17.8% |
| 30 to 34 Minutes | 51 | 23.3% |
| 35 to 39 Minutes | 13 | 5.9% |
| 40 to 44 Minutes | 16 | 7.3% |
| 45 to 59 Minutes | 0 | 0.0% |
| 60 to 89 Minutes | 2 | 0.9% |
| 90 or more Minutes | 0 | 0.0% |
Commute Time by Sex in New Underwood
The most common commute times in New Underwood are 30 to 34 minutes (31 commuters, 28.4%) for males and 25 to 29 minutes (28 commuters, 25.5%) for females.

| Commute Time | Male | Female |
| Less than 5 Minutes | 5 (4.6%) | 13 (11.8%) |
| 5 to 9 Minutes | 0 (0.0%) | 12 (10.9%) |
| 10 to 14 Minutes | 9 (8.3%) | 7 (6.4%) |
| 15 to 19 Minutes | 30 (27.5%) | 0 (0.0%) |
| 20 to 24 Minutes | 5 (4.6%) | 17 (15.4%) |
| 25 to 29 Minutes | 11 (10.1%) | 28 (25.5%) |
| 30 to 34 Minutes | 31 (28.4%) | 20 (18.2%) |
| 35 to 39 Minutes | 0 (0.0%) | 13 (11.8%) |
| 40 to 44 Minutes | 16 (14.7%) | 0 (0.0%) |
| 45 to 59 Minutes | 0 (0.0%) | 0 (0.0%) |
| 60 to 89 Minutes | 2 (1.8%) | 0 (0.0%) |
| 90 or more Minutes | 0 (0.0%) | 0 (0.0%) |
Time of Departure to Work by Sex in New Underwood
The most frequent times of departure to work in New Underwood are 6:30 AM to 6:59 AM (26, 23.8%) for males and 7:00 AM to 7:29 AM (28, 25.5%) for females.
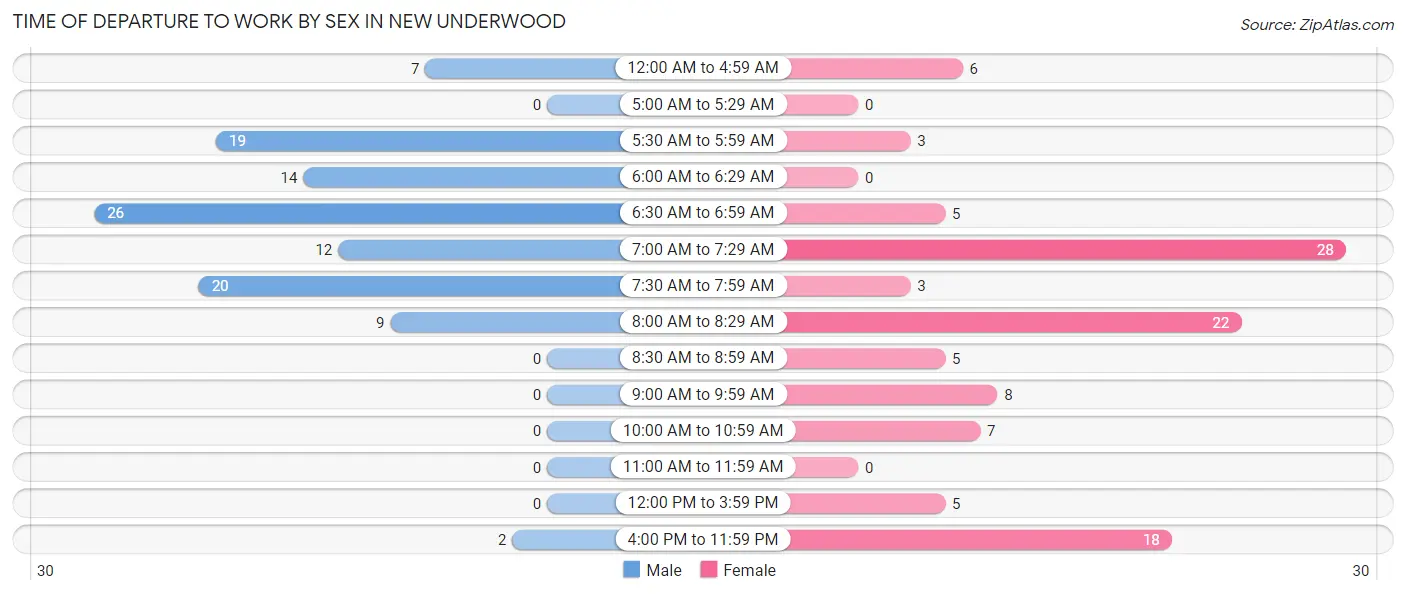
| Time of Departure | Male | Female |
| 12:00 AM to 4:59 AM | 7 (6.4%) | 6 (5.4%) |
| 5:00 AM to 5:29 AM | 0 (0.0%) | 0 (0.0%) |
| 5:30 AM to 5:59 AM | 19 (17.4%) | 3 (2.7%) |
| 6:00 AM to 6:29 AM | 14 (12.8%) | 0 (0.0%) |
| 6:30 AM to 6:59 AM | 26 (23.8%) | 5 (4.5%) |
| 7:00 AM to 7:29 AM | 12 (11.0%) | 28 (25.5%) |
| 7:30 AM to 7:59 AM | 20 (18.3%) | 3 (2.7%) |
| 8:00 AM to 8:29 AM | 9 (8.3%) | 22 (20.0%) |
| 8:30 AM to 8:59 AM | 0 (0.0%) | 5 (4.5%) |
| 9:00 AM to 9:59 AM | 0 (0.0%) | 8 (7.3%) |
| 10:00 AM to 10:59 AM | 0 (0.0%) | 7 (6.4%) |
| 11:00 AM to 11:59 AM | 0 (0.0%) | 0 (0.0%) |
| 12:00 PM to 3:59 PM | 0 (0.0%) | 5 (4.5%) |
| 4:00 PM to 11:59 PM | 2 (1.8%) | 18 (16.4%) |
| Total | 109 (100.0%) | 110 (100.0%) |
Housing Occupancy in New Underwood
Occupancy by Ownership in New Underwood
Of the total 171 dwellings in New Underwood, owner-occupied units account for 122 (71.4%), while renter-occupied units make up 49 (28.6%).
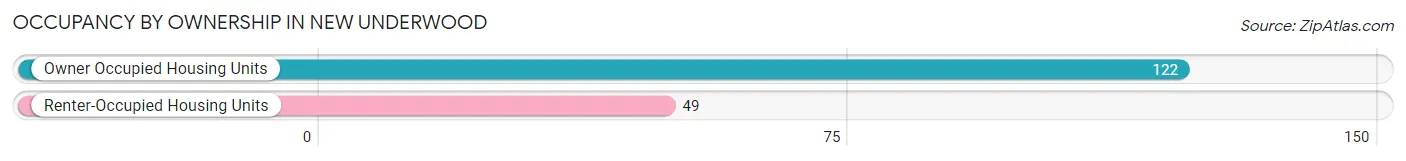
| Occupancy | # Housing Units | % Housing Units |
| Owner Occupied Housing Units | 122 | 71.4% |
| Renter-Occupied Housing Units | 49 | 28.6% |
| Total Occupied Housing Units | 171 | 100.0% |
Occupancy by Household Size in New Underwood
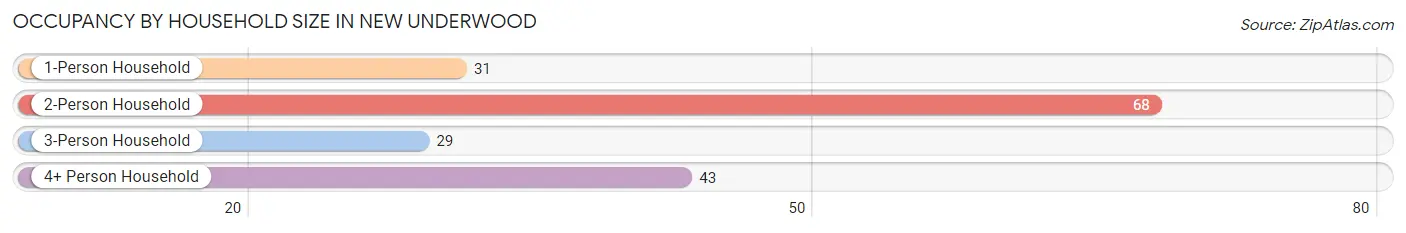
| Household Size | # Housing Units | % Housing Units |
| 1-Person Household | 31 | 18.1% |
| 2-Person Household | 68 | 39.8% |
| 3-Person Household | 29 | 17.0% |
| 4+ Person Household | 43 | 25.2% |
| Total Housing Units | 171 | 100.0% |
Occupancy by Ownership by Household Size in New Underwood
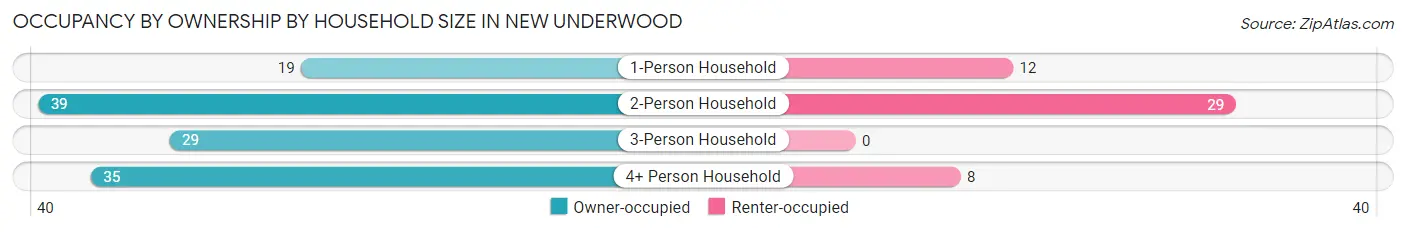
| Household Size | Owner-occupied | Renter-occupied |
| 1-Person Household | 19 (61.3%) | 12 (38.7%) |
| 2-Person Household | 39 (57.4%) | 29 (42.6%) |
| 3-Person Household | 29 (100.0%) | 0 (0.0%) |
| 4+ Person Household | 35 (81.4%) | 8 (18.6%) |
| Total Housing Units | 122 (71.4%) | 49 (28.6%) |
Occupancy by Educational Attainment in New Underwood
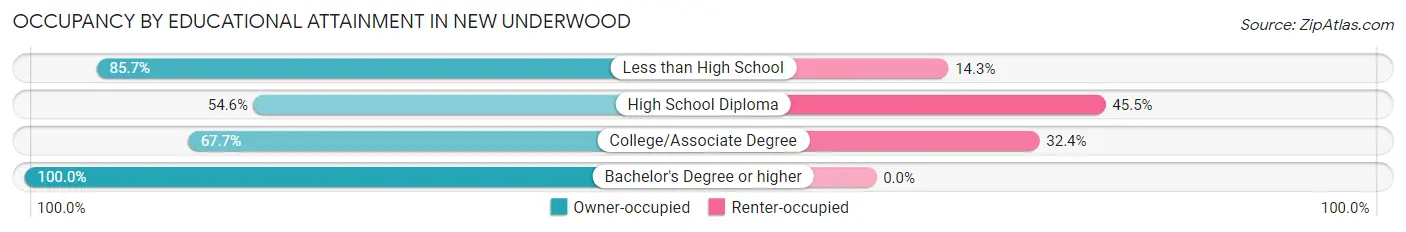
| Household Size | Owner-occupied | Renter-occupied |
| Less than High School | 12 (85.7%) | 2 (14.3%) |
| High School Diploma | 30 (54.5%) | 25 (45.5%) |
| College/Associate Degree | 46 (67.6%) | 22 (32.4%) |
| Bachelor's Degree or higher | 34 (100.0%) | 0 (0.0%) |
Occupancy by Age of Householder in New Underwood
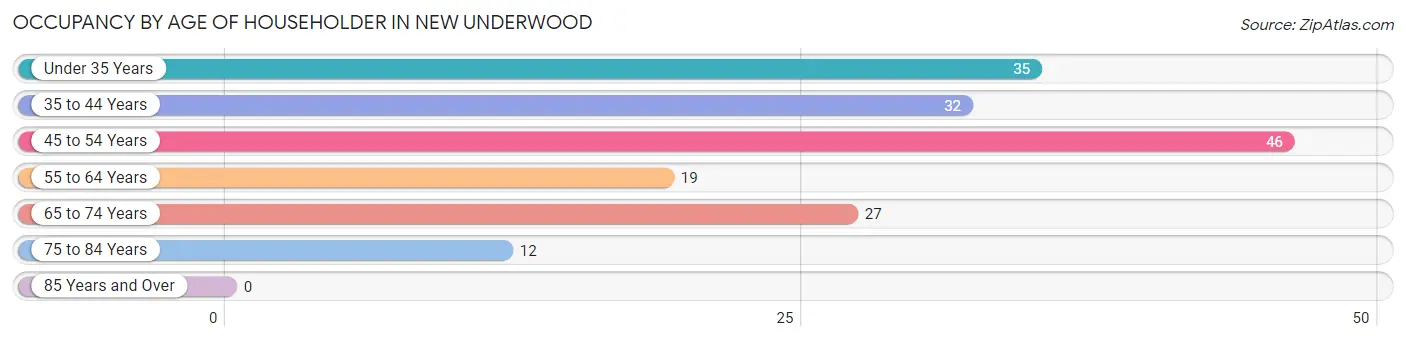
| Age Bracket | # Households | % Households |
| Under 35 Years | 35 | 20.5% |
| 35 to 44 Years | 32 | 18.7% |
| 45 to 54 Years | 46 | 26.9% |
| 55 to 64 Years | 19 | 11.1% |
| 65 to 74 Years | 27 | 15.8% |
| 75 to 84 Years | 12 | 7.0% |
| 85 Years and Over | 0 | 0.0% |
| Total | 171 | 100.0% |
Housing Finances in New Underwood
Median Income by Occupancy in New Underwood
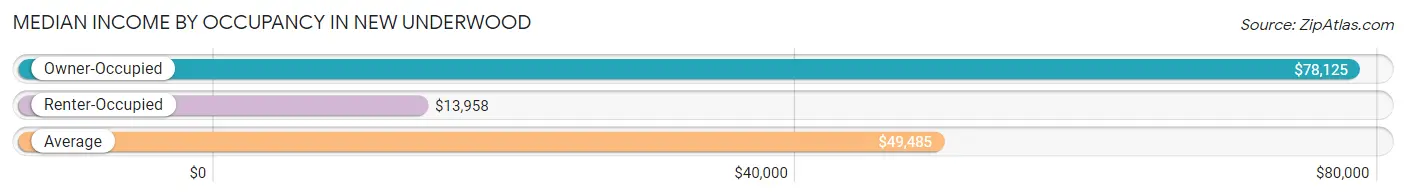
| Occupancy Type | # Households | Median Income |
| Owner-Occupied | 122 (71.4%) | $78,125 |
| Renter-Occupied | 49 (28.6%) | $13,958 |
| Average | 171 (100.0%) | $49,485 |
Occupancy by Householder Income Bracket in New Underwood
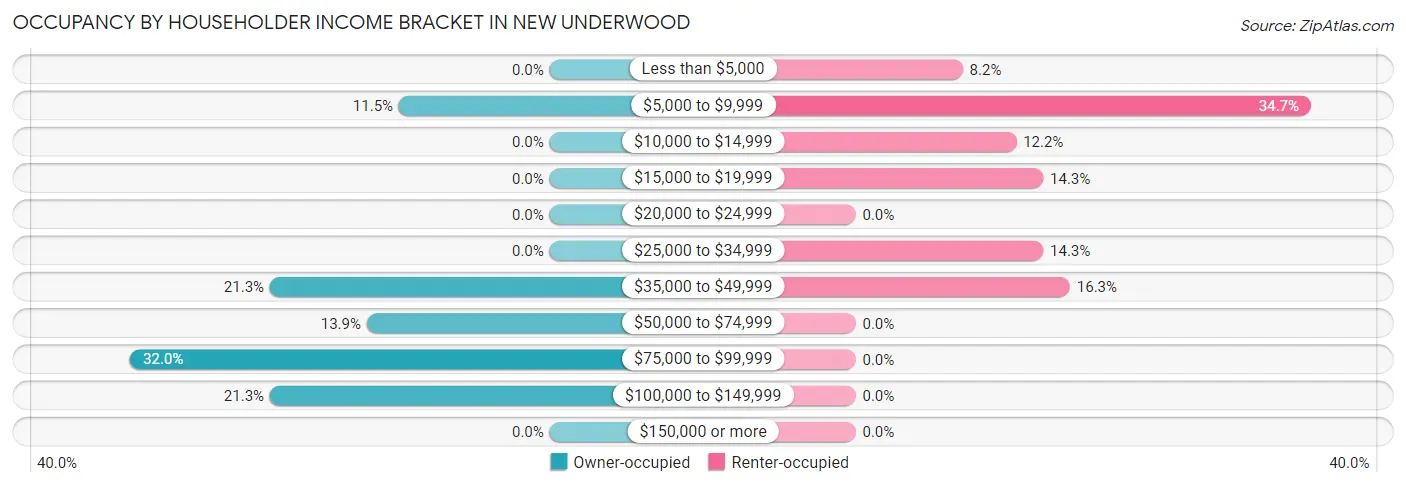
| Income Bracket | Owner-occupied | Renter-occupied |
| Less than $5,000 | 0 (0.0%) | 4 (8.2%) |
| $5,000 to $9,999 | 14 (11.5%) | 17 (34.7%) |
| $10,000 to $14,999 | 0 (0.0%) | 6 (12.2%) |
| $15,000 to $19,999 | 0 (0.0%) | 7 (14.3%) |
| $20,000 to $24,999 | 0 (0.0%) | 0 (0.0%) |
| $25,000 to $34,999 | 0 (0.0%) | 7 (14.3%) |
| $35,000 to $49,999 | 26 (21.3%) | 8 (16.3%) |
| $50,000 to $74,999 | 17 (13.9%) | 0 (0.0%) |
| $75,000 to $99,999 | 39 (32.0%) | 0 (0.0%) |
| $100,000 to $149,999 | 26 (21.3%) | 0 (0.0%) |
| $150,000 or more | 0 (0.0%) | 0 (0.0%) |
| Total | 122 (100.0%) | 49 (100.0%) |
Monthly Housing Cost Tiers in New Underwood
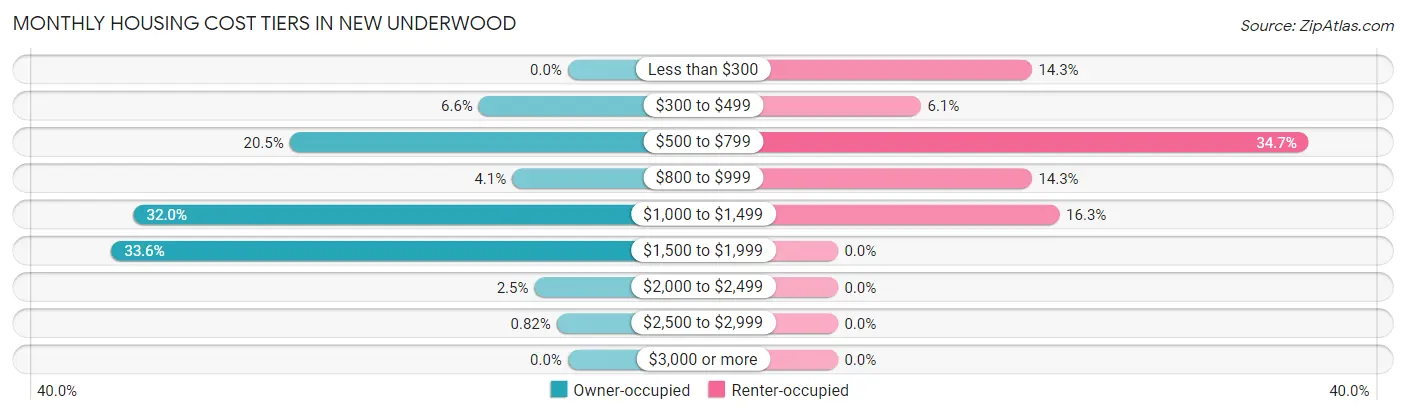
| Monthly Cost | Owner-occupied | Renter-occupied |
| Less than $300 | 0 (0.0%) | 7 (14.3%) |
| $300 to $499 | 8 (6.6%) | 3 (6.1%) |
| $500 to $799 | 25 (20.5%) | 17 (34.7%) |
| $800 to $999 | 5 (4.1%) | 7 (14.3%) |
| $1,000 to $1,499 | 39 (32.0%) | 8 (16.3%) |
| $1,500 to $1,999 | 41 (33.6%) | 0 (0.0%) |
| $2,000 to $2,499 | 3 (2.5%) | 0 (0.0%) |
| $2,500 to $2,999 | 1 (0.8%) | 0 (0.0%) |
| $3,000 or more | 0 (0.0%) | 0 (0.0%) |
| Total | 122 (100.0%) | 49 (100.0%) |
Physical Housing Characteristics in New Underwood
Housing Structures in New Underwood
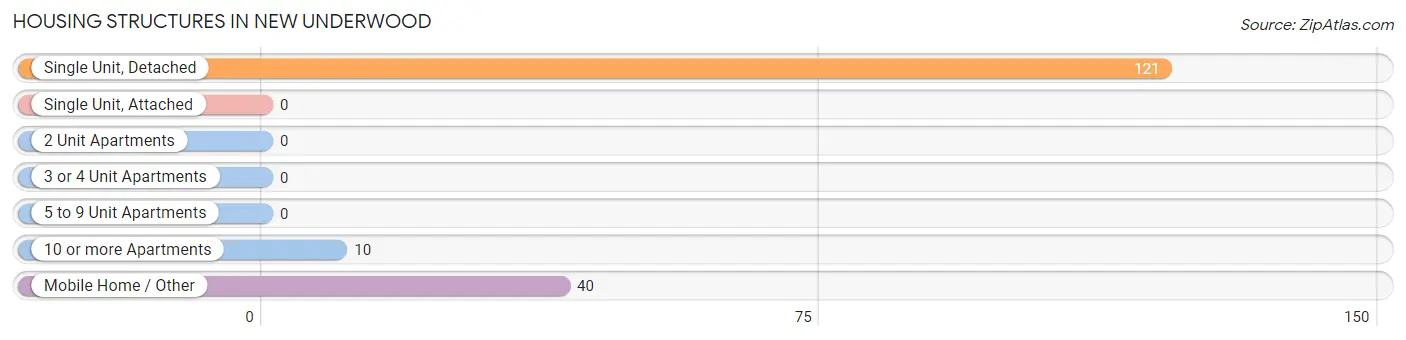
| Structure Type | # Housing Units | % Housing Units |
| Single Unit, Detached | 121 | 70.8% |
| Single Unit, Attached | 0 | 0.0% |
| 2 Unit Apartments | 0 | 0.0% |
| 3 or 4 Unit Apartments | 0 | 0.0% |
| 5 to 9 Unit Apartments | 0 | 0.0% |
| 10 or more Apartments | 10 | 5.9% |
| Mobile Home / Other | 40 | 23.4% |
| Total | 171 | 100.0% |
Housing Structures by Occupancy in New Underwood
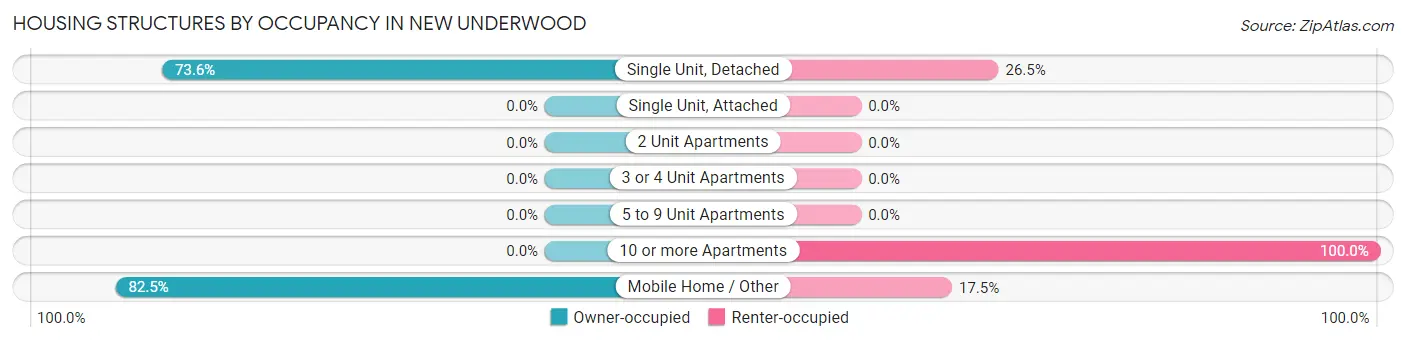
| Structure Type | Owner-occupied | Renter-occupied |
| Single Unit, Detached | 89 (73.6%) | 32 (26.5%) |
| Single Unit, Attached | 0 (0.0%) | 0 (0.0%) |
| 2 Unit Apartments | 0 (0.0%) | 0 (0.0%) |
| 3 or 4 Unit Apartments | 0 (0.0%) | 0 (0.0%) |
| 5 to 9 Unit Apartments | 0 (0.0%) | 0 (0.0%) |
| 10 or more Apartments | 0 (0.0%) | 10 (100.0%) |
| Mobile Home / Other | 33 (82.5%) | 7 (17.5%) |
| Total | 122 (71.4%) | 49 (28.6%) |
Housing Structures by Number of Rooms in New Underwood
| Number of Rooms | Owner-occupied | Renter-occupied |
| 1 Room | 0 (0.0%) | 0 (0.0%) |
| 2 or 3 Rooms | 4 (3.3%) | 10 (20.4%) |
| 4 or 5 Rooms | 71 (58.2%) | 14 (28.6%) |
| 6 or 7 Rooms | 27 (22.1%) | 25 (51.0%) |
| 8 or more Rooms | 20 (16.4%) | 0 (0.0%) |
| Total | 122 (100.0%) | 49 (100.0%) |
Housing Structure by Heating Type in New Underwood
| Heating Type | Owner-occupied | Renter-occupied |
| Utility Gas | 9 (7.4%) | 0 (0.0%) |
| Bottled, Tank, or LP Gas | 75 (61.5%) | 7 (14.3%) |
| Electricity | 36 (29.5%) | 42 (85.7%) |
| Fuel Oil or Kerosene | 0 (0.0%) | 0 (0.0%) |
| Coal or Coke | 0 (0.0%) | 0 (0.0%) |
| All other Fuels | 0 (0.0%) | 0 (0.0%) |
| No Fuel Used | 2 (1.6%) | 0 (0.0%) |
| Total | 122 (100.0%) | 49 (100.0%) |
Household Vehicle Usage in New Underwood
| Vehicles per Household | Owner-occupied | Renter-occupied |
| No Vehicle | 2 (1.6%) | 7 (14.3%) |
| 1 Vehicle | 18 (14.7%) | 10 (20.4%) |
| 2 Vehicles | 59 (48.4%) | 25 (51.0%) |
| 3 or more Vehicles | 43 (35.2%) | 7 (14.3%) |
| Total | 122 (100.0%) | 49 (100.0%) |
Real Estate & Mortgages in New Underwood
Real Estate and Mortgage Overview in New Underwood
| Characteristic | Without Mortgage | With Mortgage |
| Housing Units | 34 | 88 |
| Median Property Value | - | - |
| Median Household Income | $83,750 | $0 |
| Monthly Housing Costs | $639 | $0 |
| Real Estate Taxes | $1,556 | $24 |
Property Value by Mortgage Status in New Underwood
| Property Value | Without Mortgage | With Mortgage |
| Less than $50,000 | 16 (47.1%) | 2 (2.3%) |
| $50,000 to $99,999 | 6 (17.6%) | 10 (11.4%) |
| $100,000 to $299,999 | 9 (26.5%) | 71 (80.7%) |
| $300,000 to $499,999 | 3 (8.8%) | 5 (5.7%) |
| $500,000 to $749,999 | 0 (0.0%) | 0 (0.0%) |
| $750,000 to $999,999 | 0 (0.0%) | 0 (0.0%) |
| $1,000,000 or more | 0 (0.0%) | 0 (0.0%) |
| Total | 34 (100.0%) | 88 (100.0%) |
Household Income by Mortgage Status in New Underwood
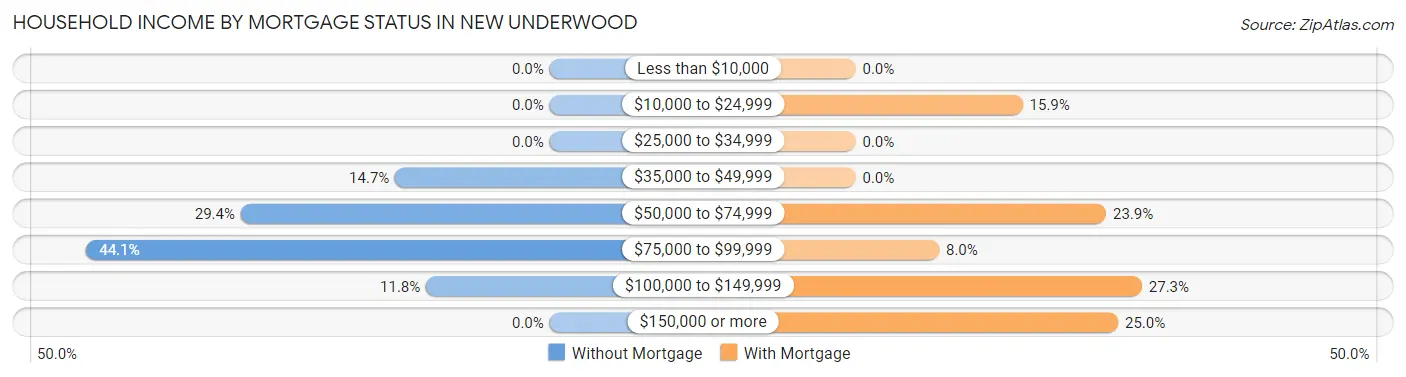
| Household Income | Without Mortgage | With Mortgage |
| Less than $10,000 | 0 (0.0%) | 0 (0.0%) |
| $10,000 to $24,999 | 0 (0.0%) | 14 (15.9%) |
| $25,000 to $34,999 | 0 (0.0%) | 0 (0.0%) |
| $35,000 to $49,999 | 5 (14.7%) | 0 (0.0%) |
| $50,000 to $74,999 | 10 (29.4%) | 21 (23.9%) |
| $75,000 to $99,999 | 15 (44.1%) | 7 (8.0%) |
| $100,000 to $149,999 | 4 (11.8%) | 24 (27.3%) |
| $150,000 or more | 0 (0.0%) | 22 (25.0%) |
| Total | 34 (100.0%) | 88 (100.0%) |
Property Value to Household Income Ratio in New Underwood
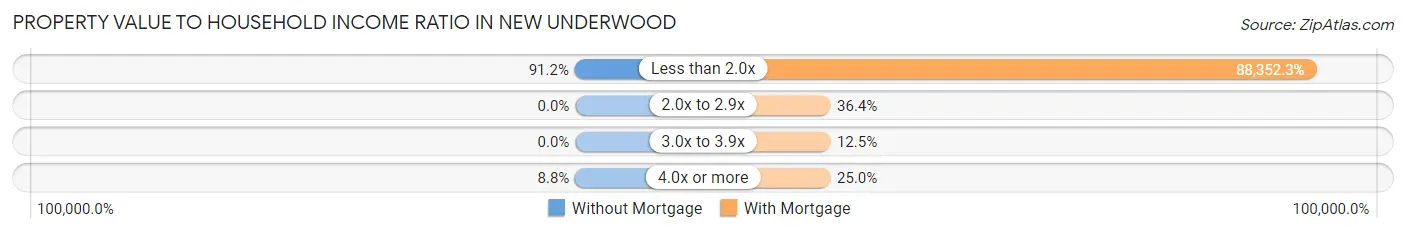
| Value-to-Income Ratio | Without Mortgage | With Mortgage |
| Less than 2.0x | 31 (91.2%) | 77,750 (88,352.3%) |
| 2.0x to 2.9x | 0 (0.0%) | 32 (36.4%) |
| 3.0x to 3.9x | 0 (0.0%) | 11 (12.5%) |
| 4.0x or more | 3 (8.8%) | 22 (25.0%) |
| Total | 34 (100.0%) | 88 (100.0%) |
Real Estate Taxes by Mortgage Status in New Underwood
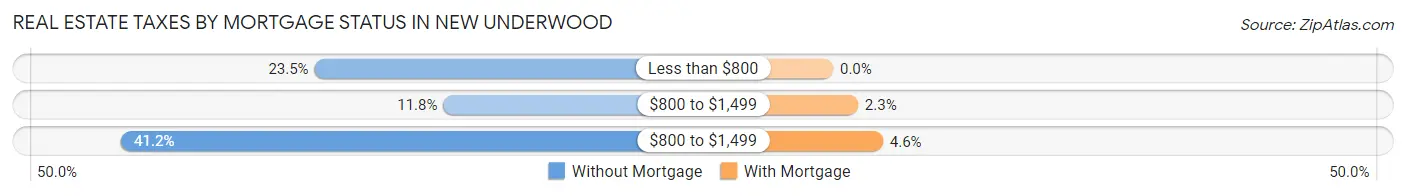
| Property Taxes | Without Mortgage | With Mortgage |
| Less than $800 | 8 (23.5%) | 0 (0.0%) |
| $800 to $1,499 | 4 (11.8%) | 2 (2.3%) |
| $800 to $1,499 | 14 (41.2%) | 4 (4.5%) |
| Total | 34 (100.0%) | 88 (100.0%) |
Health & Disability in New Underwood
Health Insurance Coverage by Age in New Underwood
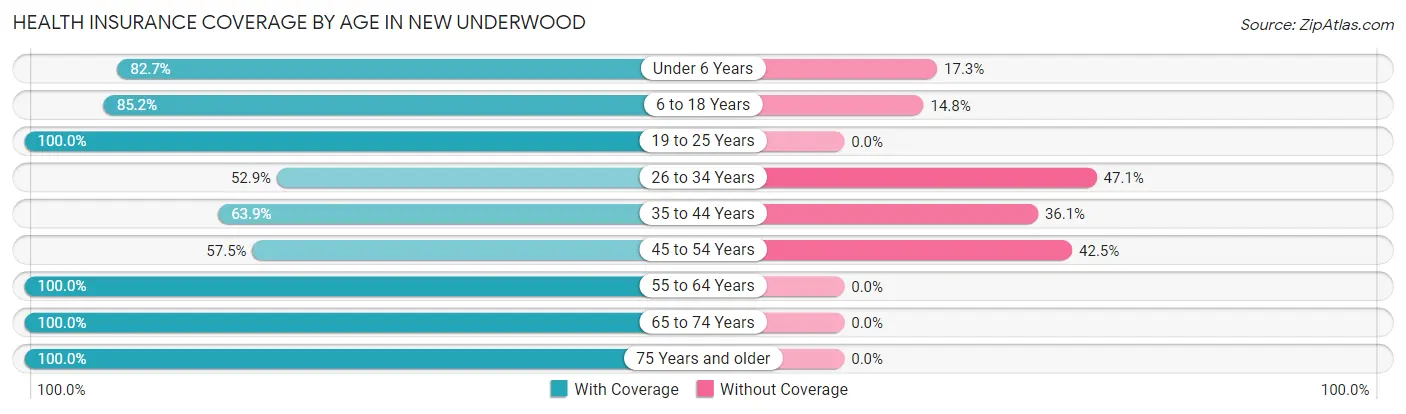
| Age Bracket | With Coverage | Without Coverage |
| Under 6 Years | 43 (82.7%) | 9 (17.3%) |
| 6 to 18 Years | 98 (85.2%) | 17 (14.8%) |
| 19 to 25 Years | 26 (100.0%) | 0 (0.0%) |
| 26 to 34 Years | 18 (52.9%) | 16 (47.1%) |
| 35 to 44 Years | 46 (63.9%) | 26 (36.1%) |
| 45 to 54 Years | 65 (57.5%) | 48 (42.5%) |
| 55 to 64 Years | 34 (100.0%) | 0 (0.0%) |
| 65 to 74 Years | 45 (100.0%) | 0 (0.0%) |
| 75 Years and older | 16 (100.0%) | 0 (0.0%) |
| Total | 391 (77.1%) | 116 (22.9%) |
Health Insurance Coverage by Citizenship Status in New Underwood
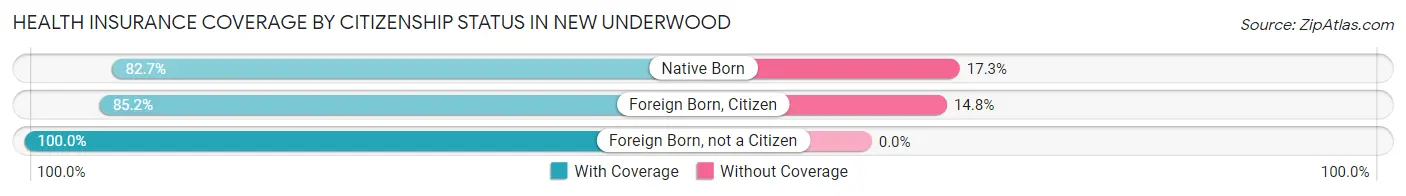
| Citizenship Status | With Coverage | Without Coverage |
| Native Born | 43 (82.7%) | 9 (17.3%) |
| Foreign Born, Citizen | 98 (85.2%) | 17 (14.8%) |
| Foreign Born, not a Citizen | 26 (100.0%) | 0 (0.0%) |
Health Insurance Coverage by Household Income in New Underwood
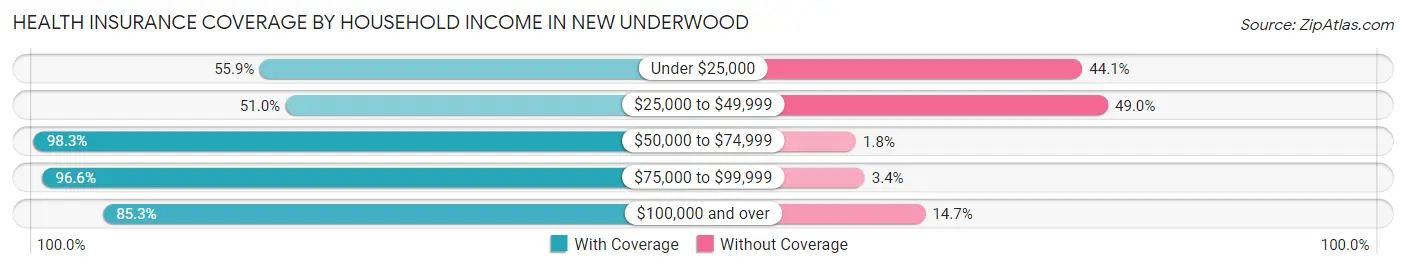
| Household Income | With Coverage | Without Coverage |
| Under $25,000 | 62 (55.9%) | 49 (44.1%) |
| $25,000 to $49,999 | 49 (51.0%) | 47 (49.0%) |
| $50,000 to $74,999 | 56 (98.3%) | 1 (1.8%) |
| $75,000 to $99,999 | 143 (96.6%) | 5 (3.4%) |
| $100,000 and over | 81 (85.3%) | 14 (14.7%) |
Public vs Private Health Insurance Coverage by Age in New Underwood
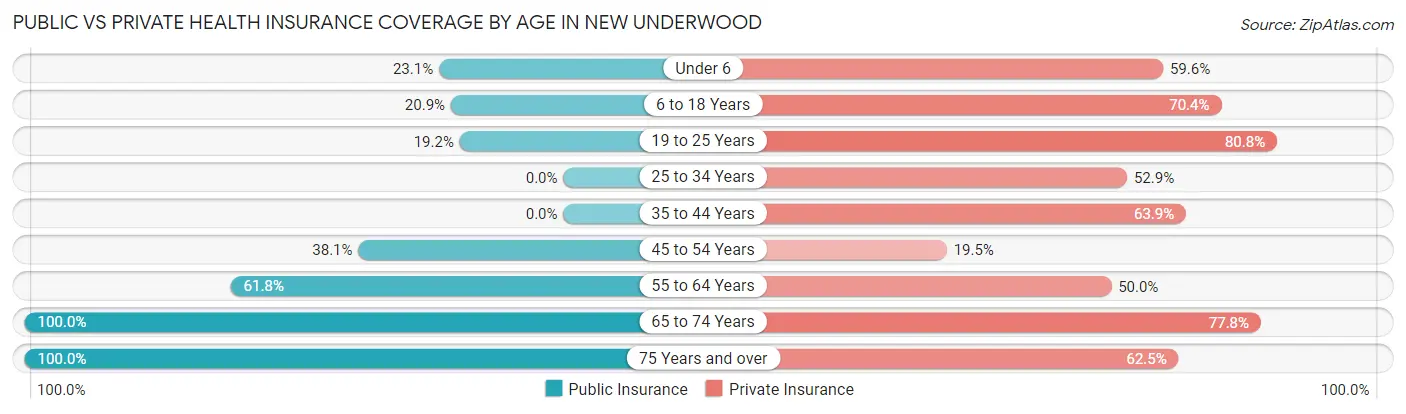
| Age Bracket | Public Insurance | Private Insurance |
| Under 6 | 12 (23.1%) | 31 (59.6%) |
| 6 to 18 Years | 24 (20.9%) | 81 (70.4%) |
| 19 to 25 Years | 5 (19.2%) | 21 (80.8%) |
| 25 to 34 Years | 0 (0.0%) | 18 (52.9%) |
| 35 to 44 Years | 0 (0.0%) | 46 (63.9%) |
| 45 to 54 Years | 43 (38.1%) | 22 (19.5%) |
| 55 to 64 Years | 21 (61.8%) | 17 (50.0%) |
| 65 to 74 Years | 45 (100.0%) | 35 (77.8%) |
| 75 Years and over | 16 (100.0%) | 10 (62.5%) |
| Total | 166 (32.7%) | 281 (55.4%) |
Disability Status by Sex by Age in New Underwood
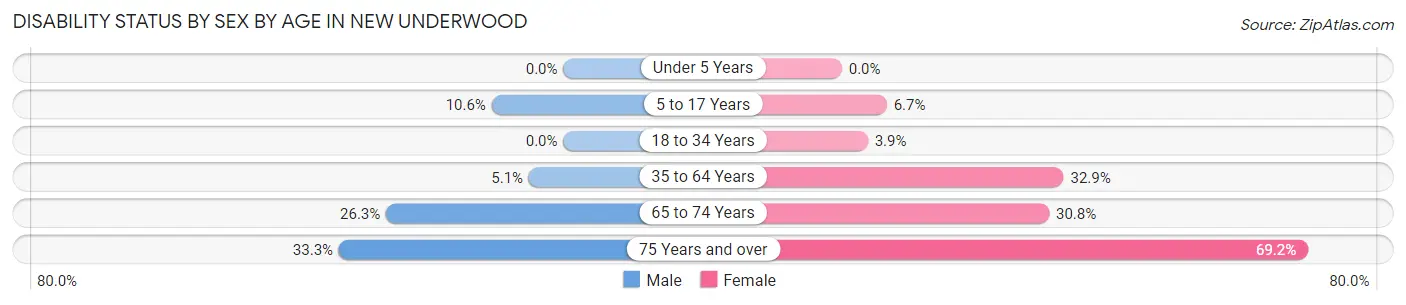
| Age Bracket | Male | Female |
| Under 5 Years | 0 (0.0%) | 0 (0.0%) |
| 5 to 17 Years | 5 (10.6%) | 5 (6.7%) |
| 18 to 34 Years | 0 (0.0%) | 2 (3.8%) |
| 35 to 64 Years | 7 (5.1%) | 27 (32.9%) |
| 65 to 74 Years | 5 (26.3%) | 8 (30.8%) |
| 75 Years and over | 1 (33.3%) | 9 (69.2%) |
Disability Class by Sex by Age in New Underwood
Disability Class: Hearing Difficulty
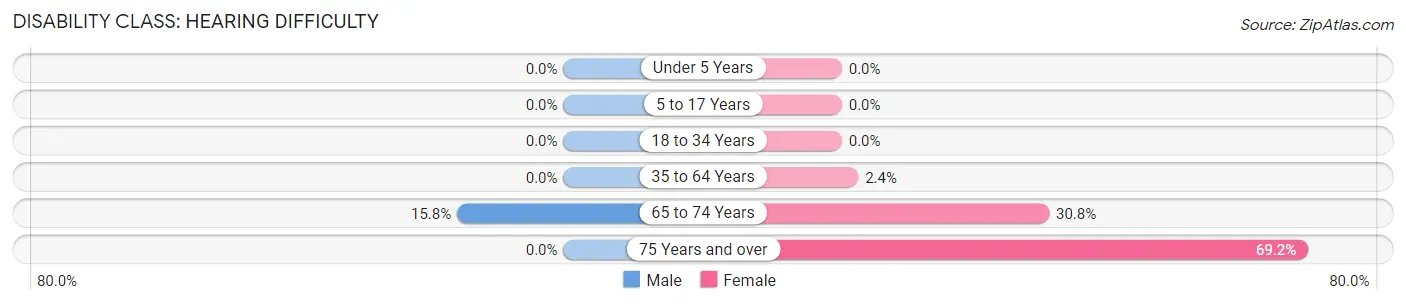
| Age Bracket | Male | Female |
| Under 5 Years | 0 (0.0%) | 0 (0.0%) |
| 5 to 17 Years | 0 (0.0%) | 0 (0.0%) |
| 18 to 34 Years | 0 (0.0%) | 0 (0.0%) |
| 35 to 64 Years | 0 (0.0%) | 2 (2.4%) |
| 65 to 74 Years | 3 (15.8%) | 8 (30.8%) |
| 75 Years and over | 0 (0.0%) | 9 (69.2%) |
Disability Class: Vision Difficulty
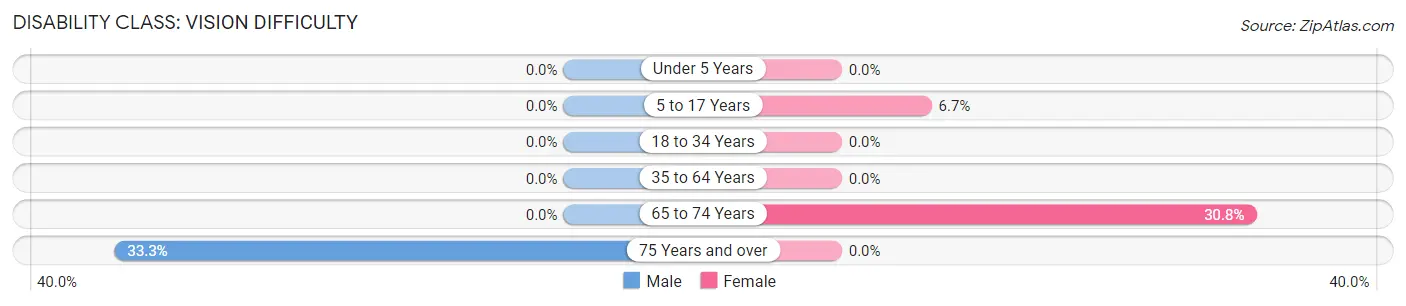
| Age Bracket | Male | Female |
| Under 5 Years | 0 (0.0%) | 0 (0.0%) |
| 5 to 17 Years | 0 (0.0%) | 5 (6.7%) |
| 18 to 34 Years | 0 (0.0%) | 0 (0.0%) |
| 35 to 64 Years | 0 (0.0%) | 0 (0.0%) |
| 65 to 74 Years | 0 (0.0%) | 8 (30.8%) |
| 75 Years and over | 1 (33.3%) | 0 (0.0%) |
Disability Class: Cognitive Difficulty
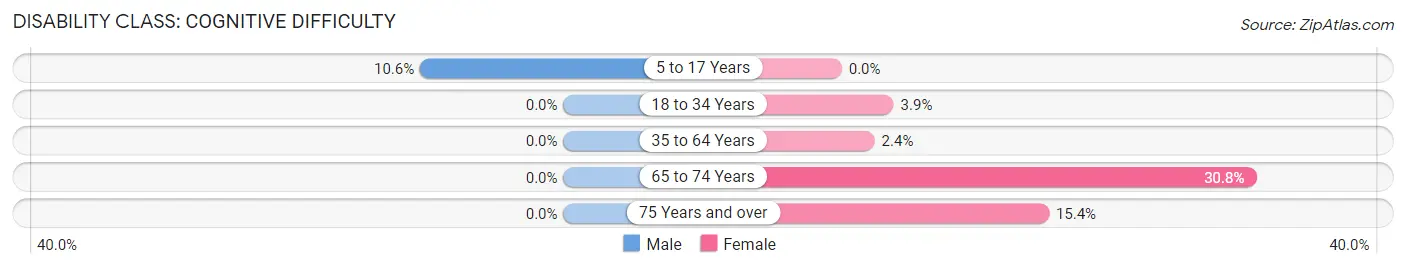
| Age Bracket | Male | Female |
| 5 to 17 Years | 5 (10.6%) | 0 (0.0%) |
| 18 to 34 Years | 0 (0.0%) | 2 (3.8%) |
| 35 to 64 Years | 0 (0.0%) | 2 (2.4%) |
| 65 to 74 Years | 0 (0.0%) | 8 (30.8%) |
| 75 Years and over | 0 (0.0%) | 2 (15.4%) |
Disability Class: Ambulatory Difficulty
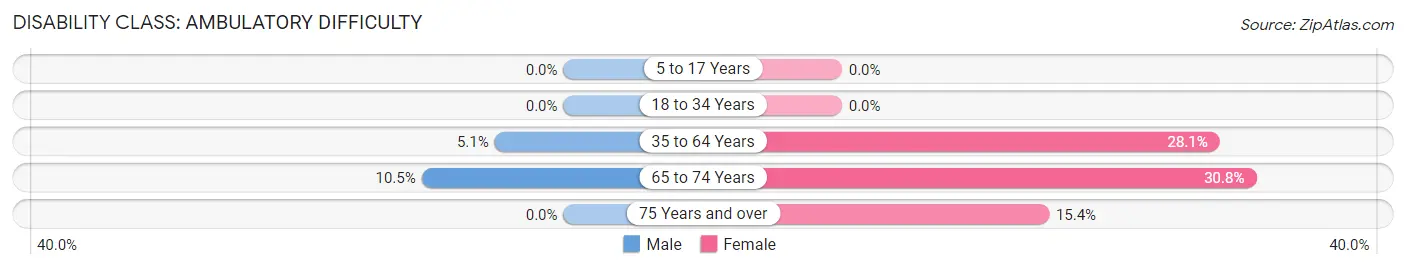
| Age Bracket | Male | Female |
| 5 to 17 Years | 0 (0.0%) | 0 (0.0%) |
| 18 to 34 Years | 0 (0.0%) | 0 (0.0%) |
| 35 to 64 Years | 7 (5.1%) | 23 (28.1%) |
| 65 to 74 Years | 2 (10.5%) | 8 (30.8%) |
| 75 Years and over | 0 (0.0%) | 2 (15.4%) |
Disability Class: Self-Care Difficulty
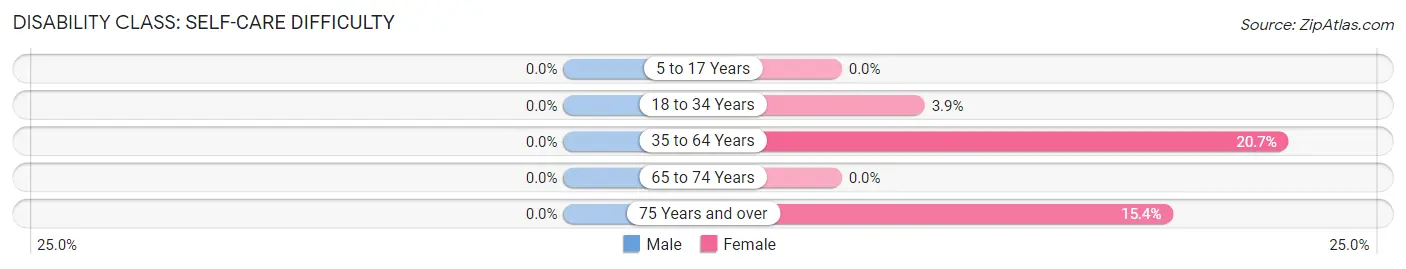
| Age Bracket | Male | Female |
| 5 to 17 Years | 0 (0.0%) | 0 (0.0%) |
| 18 to 34 Years | 0 (0.0%) | 2 (3.8%) |
| 35 to 64 Years | 0 (0.0%) | 17 (20.7%) |
| 65 to 74 Years | 0 (0.0%) | 0 (0.0%) |
| 75 Years and over | 0 (0.0%) | 2 (15.4%) |
Technology Access in New Underwood
Computing Device Access in New Underwood
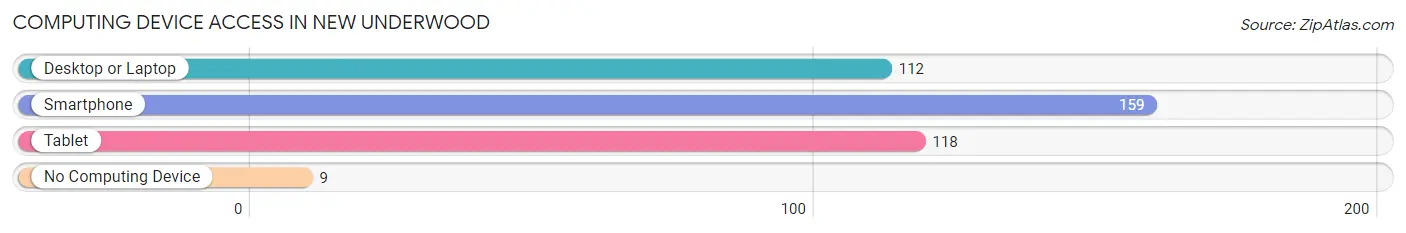
| Device Type | # Households | % Households |
| Desktop or Laptop | 112 | 65.5% |
| Smartphone | 159 | 93.0% |
| Tablet | 118 | 69.0% |
| No Computing Device | 9 | 5.3% |
| Total | 171 | 100.0% |
Internet Access in New Underwood
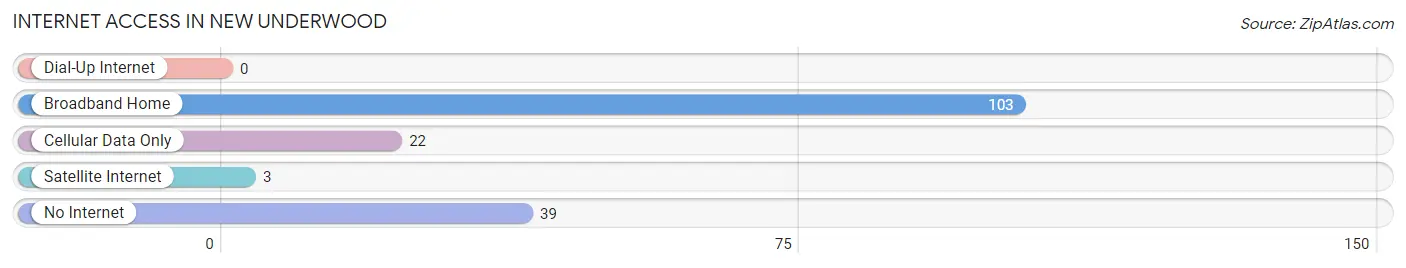
| Internet Type | # Households | % Households |
| Dial-Up Internet | 0 | 0.0% |
| Broadband Home | 103 | 60.2% |
| Cellular Data Only | 22 | 12.9% |
| Satellite Internet | 3 | 1.8% |
| No Internet | 39 | 22.8% |
| Total | 171 | 100.0% |
New Underwood Summary
Underwood, South Dakota is a small town located in the southwestern corner of the state. It is situated in the rolling hills of the Missouri River Valley, and is surrounded by the Black Hills National Forest. The town was founded in 1883 by a group of settlers from Wisconsin, and has since grown to a population of approximately 1,000 people.
Geography
Underwood is located in the Missouri River Valley, and is surrounded by the Black Hills National Forest. The town is situated at an elevation of 3,400 feet, and is located approximately 25 miles south of Rapid City. The town is located in the Central Time Zone, and is part of the Rapid City Metropolitan Statistical Area.
The town is situated on the banks of the Missouri River, and is surrounded by rolling hills and prairies. The area is known for its scenic beauty, and is home to a variety of wildlife, including deer, elk, and bighorn sheep.
Economy
Underwood is a small, rural town, and the economy is largely based on agriculture. The town is home to several farms, and the surrounding area is known for its production of wheat, corn, and other grains. The town is also home to several small businesses, including a grocery store, a hardware store, and a restaurant.
The town is also home to a small manufacturing plant, which produces a variety of products, including furniture and clothing. The plant employs approximately 50 people, and is one of the largest employers in the area.
Demographics
As of the 2010 census, the population of Underwood was 1,000 people. The town is predominantly white, with approximately 95% of the population being of European descent. The remaining 5% of the population is made up of African Americans, Native Americans, and other ethnicities.
The median household income in Underwood is approximately $35,000, and the median age is 40 years old. The town has a low unemployment rate, and the majority of the population is employed in the agricultural and manufacturing industries.
Conclusion
Underwood, South Dakota is a small, rural town located in the Missouri River Valley. The town was founded in 1883 by a group of settlers from Wisconsin, and has since grown to a population of approximately 1,000 people. The town is surrounded by the Black Hills National Forest, and is known for its scenic beauty and wildlife. The economy is largely based on agriculture, and the town is home to several small businesses and a manufacturing plant. The population is predominantly white, with a median household income of approximately $35,000 and a median age of 40 years old.
Common Questions
What is Per Capita Income in New Underwood?
Per Capita income in New Underwood is $20,481.
What is the Median Family Income in New Underwood?
Median Family Income in New Underwood is $52,500.
What is the Median Household income in New Underwood?
Median Household Income in New Underwood is $49,485.
What is Income or Wage Gap in New Underwood?
Income or Wage Gap in New Underwood is 39.3%.
Women in New Underwood earn 60.7 cents for every dollar earned by a man.
What is Inequality or Gini Index in New Underwood?
Inequality or Gini Index in New Underwood is 0.40.
What is the Total Population of New Underwood?
Total Population of New Underwood is 574.
What is the Total Male Population of New Underwood?
Total Male Population of New Underwood is 273.
What is the Total Female Population of New Underwood?
Total Female Population of New Underwood is 301.
What is the Ratio of Males per 100 Females in New Underwood?
There are 90.70 Males per 100 Females in New Underwood.
What is the Ratio of Females per 100 Males in New Underwood?
There are 110.26 Females per 100 Males in New Underwood.
What is the Median Population Age in New Underwood?
Median Population Age in New Underwood is 39.9 Years.
What is the Average Family Size in New Underwood
Average Family Size in New Underwood is 3.5 People.
What is the Average Household Size in New Underwood
Average Household Size in New Underwood is 3.1 People.
How Large is the Labor Force in New Underwood?
There are 246 People in the Labor Forcein in New Underwood.
What is the Percentage of People in the Labor Force in New Underwood?
56.6% of People are in the Labor Force in New Underwood.
What is the Unemployment Rate in New Underwood?
Unemployment Rate in New Underwood is 6.6%.