Platte, SD Map & Demographics
Platte Map
Platte Overview
$32,812
PER CAPITA INCOME
$71,548
AVG FAMILY INCOME
$61,923
AVG HOUSEHOLD INCOME
43.1%
WAGE / INCOME GAP [ % ]
56.9¢/ $1
WAGE / INCOME GAP [ $ ]
0.39
INEQUALITY / GINI INDEX
1,299
TOTAL POPULATION
674
MALE POPULATION
625
FEMALE POPULATION
107.84
MALES / 100 FEMALES
92.73
FEMALES / 100 MALES
33.9
MEDIAN AGE
3.1
AVG FAMILY SIZE
2.3
AVG HOUSEHOLD SIZE
700
LABOR FORCE [ PEOPLE ]
70.1%
PERCENT IN LABOR FORCE
0.7%
UNEMPLOYMENT RATE
Platte Zip Codes
Platte Area Codes
Income in Platte
Income Overview in Platte
Per Capita Income in Platte is $32,812, while median incomes of families and households are $71,548 and $61,923 respectively.
| Characteristic | Number | Measure |
| Per Capita Income | 1,299 | $32,812 |
| Median Family Income | 308 | $71,548 |
| Mean Family Income | 308 | $78,742 |
| Median Household Income | 548 | $61,923 |
| Mean Household Income | 548 | $71,465 |
| Income Deficit | 308 | $0 |
| Wage / Income Gap (%) | 1,299 | 43.15% |
| Wage / Income Gap ($) | 1,299 | 56.85¢ per $1 |
| Gini / Inequality Index | 1,299 | 0.39 |
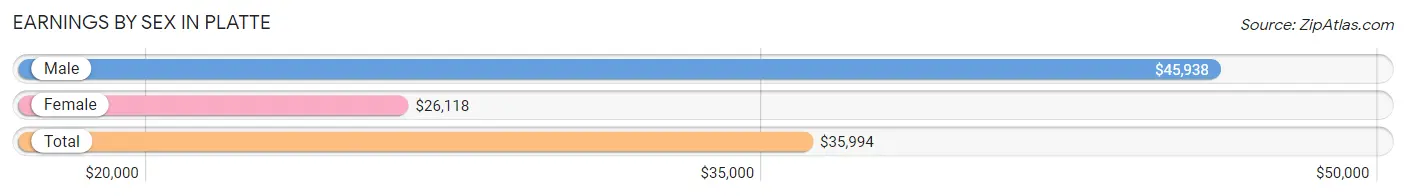
Earnings by Sex in Platte
Average Earnings in Platte are $35,994, $45,938 for men and $26,118 for women, a difference of 43.1%.
| Sex | Number | Average Earnings |
| Male | 430 (56.4%) | $45,938 |
| Female | 333 (43.6%) | $26,118 |
| Total | 763 (100.0%) | $35,994 |
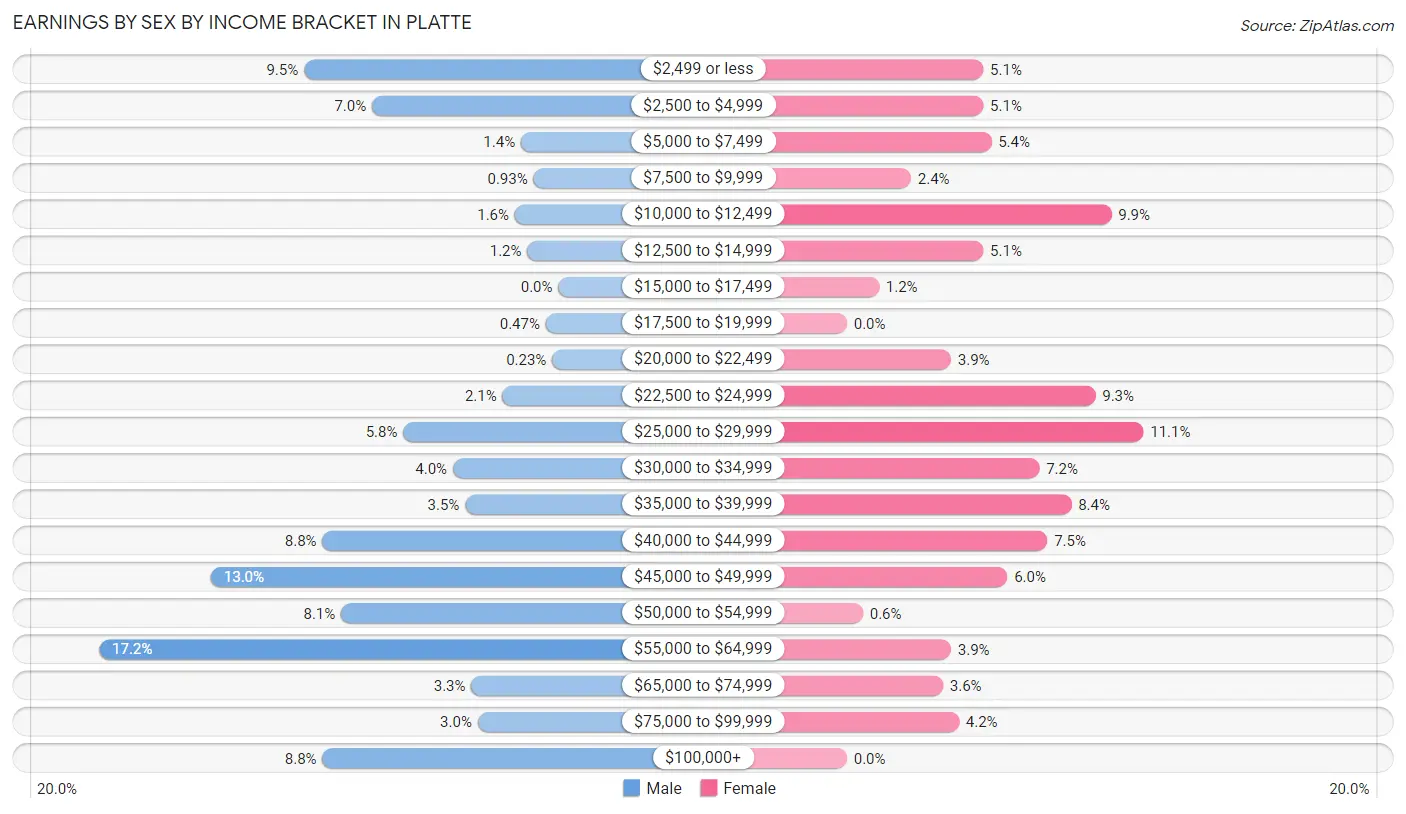
Earnings by Sex by Income Bracket in Platte
The most common earnings brackets in Platte are $55,000 to $64,999 for men (74 | 17.2%) and $25,000 to $29,999 for women (37 | 11.1%).
| Income | Male | Female |
| $2,499 or less | 41 (9.5%) | 17 (5.1%) |
| $2,500 to $4,999 | 30 (7.0%) | 17 (5.1%) |
| $5,000 to $7,499 | 6 (1.4%) | 18 (5.4%) |
| $7,500 to $9,999 | 4 (0.9%) | 8 (2.4%) |
| $10,000 to $12,499 | 7 (1.6%) | 33 (9.9%) |
| $12,500 to $14,999 | 5 (1.2%) | 17 (5.1%) |
| $15,000 to $17,499 | 0 (0.0%) | 4 (1.2%) |
| $17,500 to $19,999 | 2 (0.5%) | 0 (0.0%) |
| $20,000 to $22,499 | 1 (0.2%) | 13 (3.9%) |
| $22,500 to $24,999 | 9 (2.1%) | 31 (9.3%) |
| $25,000 to $29,999 | 25 (5.8%) | 37 (11.1%) |
| $30,000 to $34,999 | 17 (4.0%) | 24 (7.2%) |
| $35,000 to $39,999 | 15 (3.5%) | 28 (8.4%) |
| $40,000 to $44,999 | 38 (8.8%) | 25 (7.5%) |
| $45,000 to $49,999 | 56 (13.0%) | 20 (6.0%) |
| $50,000 to $54,999 | 35 (8.1%) | 2 (0.6%) |
| $55,000 to $64,999 | 74 (17.2%) | 13 (3.9%) |
| $65,000 to $74,999 | 14 (3.3%) | 12 (3.6%) |
| $75,000 to $99,999 | 13 (3.0%) | 14 (4.2%) |
| $100,000+ | 38 (8.8%) | 0 (0.0%) |
| Total | 430 (100.0%) | 333 (100.0%) |
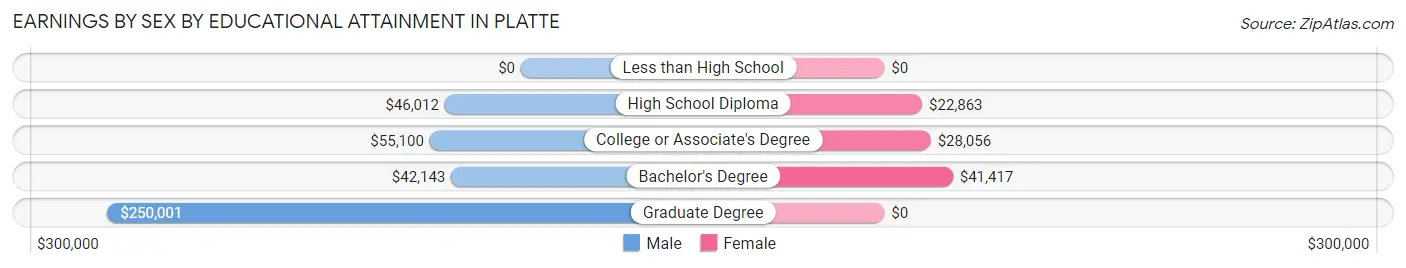
Earnings by Sex by Educational Attainment in Platte
Average earnings in Platte are $47,891 for men and $27,986 for women, a difference of 41.6%. Men with an educational attainment of graduate degree enjoy the highest average annual earnings of $250,001, while those with bachelor's degree education earn the least with $42,143. Women with an educational attainment of bachelor's degree earn the most with the average annual earnings of $41,417, while those with high school diploma education have the smallest earnings of $22,863.
| Educational Attainment | Male Income | Female Income |
| Less than High School | - | - |
| High School Diploma | $46,012 | $22,863 |
| College or Associate's Degree | $55,100 | $28,056 |
| Bachelor's Degree | $42,143 | $41,417 |
| Graduate Degree | $250,001 | $0 |
| Total | $47,891 | $27,986 |
Family Income in Platte
Family Income Brackets in Platte
According to the Platte family income data, there are 80 families falling into the $50,000 to $74,999 income range, which is the most common income bracket and makes up 26.0% of all families. Conversely, the $200,000+ income bracket is the least frequent group with only 6 families (1.9%) belonging to this category.
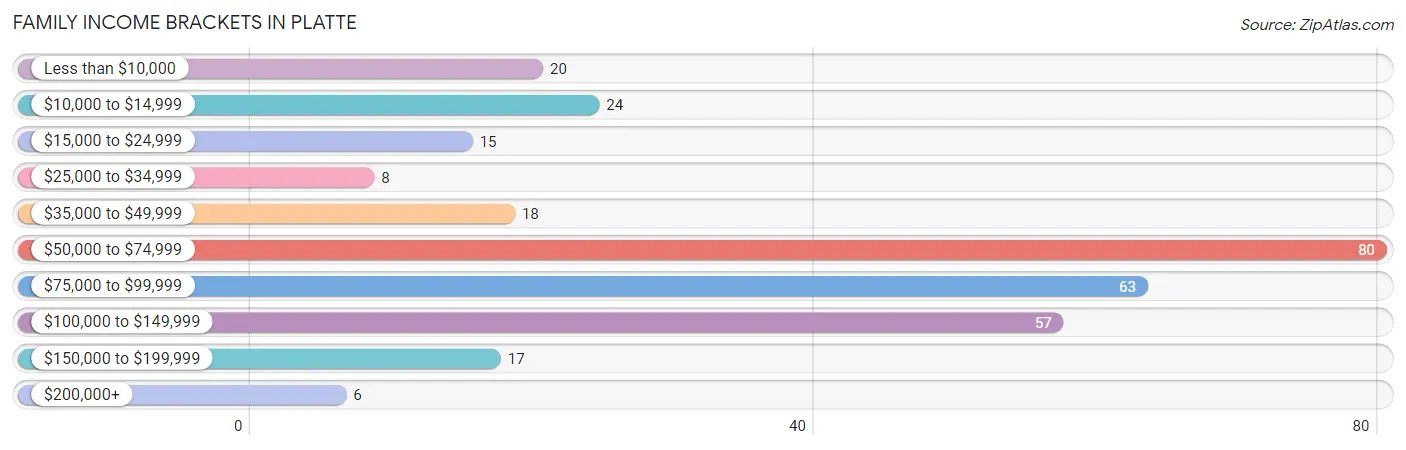
| Income Bracket | # Families | % Families |
| Less than $10,000 | 20 | 6.5% |
| $10,000 to $14,999 | 24 | 7.8% |
| $15,000 to $24,999 | 15 | 4.9% |
| $25,000 to $34,999 | 8 | 2.6% |
| $35,000 to $49,999 | 18 | 5.8% |
| $50,000 to $74,999 | 80 | 26.0% |
| $75,000 to $99,999 | 63 | 20.5% |
| $100,000 to $149,999 | 57 | 18.5% |
| $150,000 to $199,999 | 17 | 5.5% |
| $200,000+ | 6 | 1.9% |
Family Income by Famaliy Size in Platte
3-person families (76 | 24.7%) account for the highest median family income in Platte with $86,944 per family, while 2-person families (138 | 44.8%) have the highest median income of $35,834 per family member.
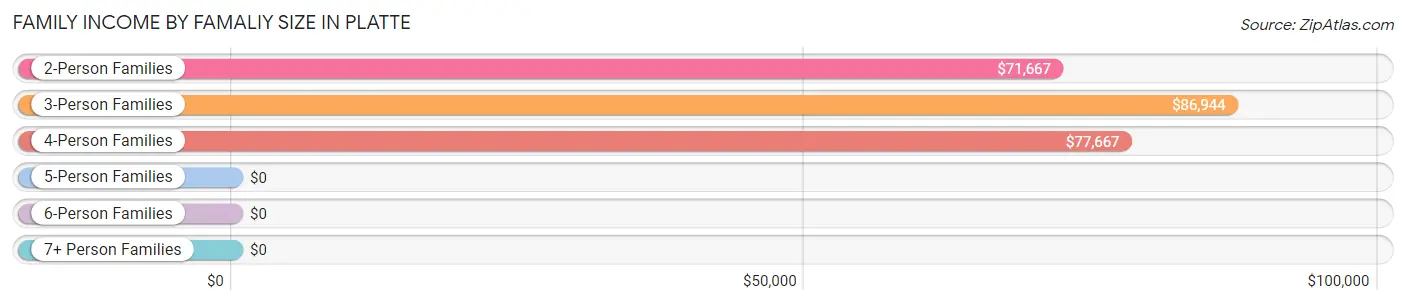
| Income Bracket | # Families | Median Income |
| 2-Person Families | 138 (44.8%) | $71,667 |
| 3-Person Families | 76 (24.7%) | $86,944 |
| 4-Person Families | 66 (21.4%) | $77,667 |
| 5-Person Families | 18 (5.8%) | $0 |
| 6-Person Families | 0 (0.0%) | $0 |
| 7+ Person Families | 10 (3.3%) | $0 |
| Total | 308 (100.0%) | $71,548 |
Family Income by Number of Earners in Platte
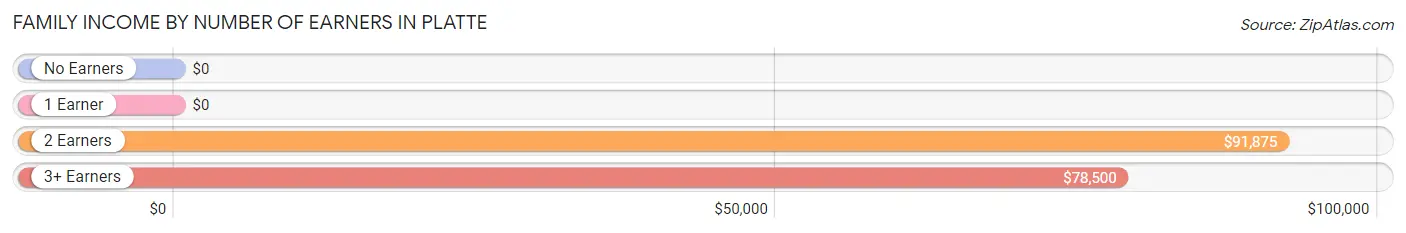
| Number of Earners | # Families | Median Income |
| No Earners | 50 (16.2%) | $0 |
| 1 Earner | 40 (13.0%) | $0 |
| 2 Earners | 164 (53.2%) | $91,875 |
| 3+ Earners | 54 (17.5%) | $78,500 |
| Total | 308 (100.0%) | $71,548 |
Household Income in Platte
Household Income Brackets in Platte
With 146 households falling in the category, the $50,000 to $74,999 income range is the most frequent in Platte, accounting for 26.6% of all households. In contrast, only 5 households (0.9%) fall into the less than $10,000 income bracket, making it the least populous group.
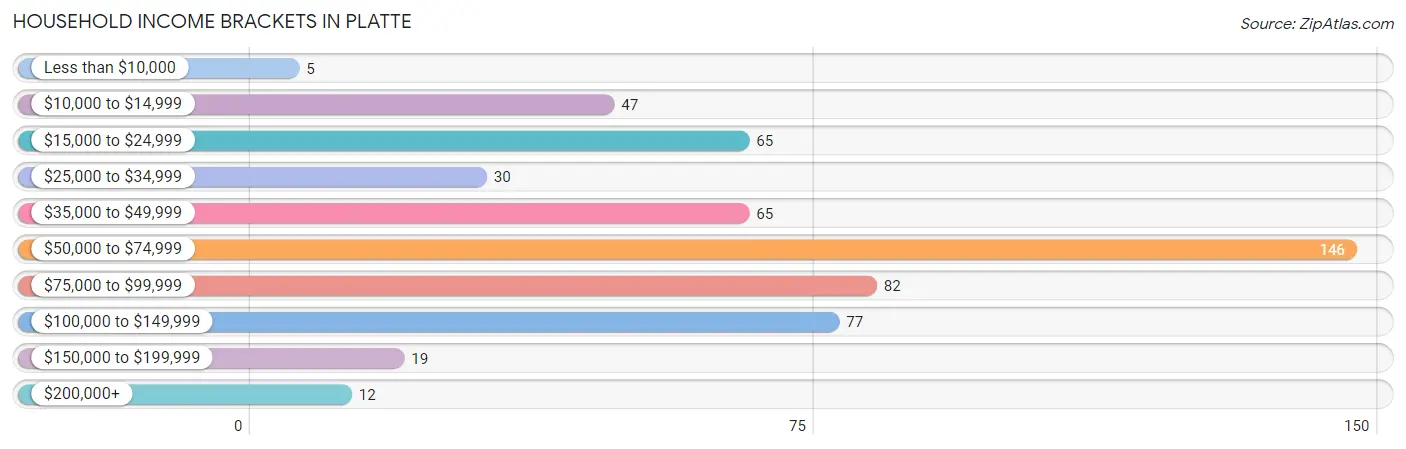
| Income Bracket | # Households | % Households |
| Less than $10,000 | 5 | 0.9% |
| $10,000 to $14,999 | 47 | 8.6% |
| $15,000 to $24,999 | 65 | 11.9% |
| $25,000 to $34,999 | 30 | 5.5% |
| $35,000 to $49,999 | 65 | 11.9% |
| $50,000 to $74,999 | 146 | 26.6% |
| $75,000 to $99,999 | 82 | 15.0% |
| $100,000 to $149,999 | 77 | 14.1% |
| $150,000 to $199,999 | 19 | 3.5% |
| $200,000+ | 12 | 2.2% |
Household Income by Householder Age in Platte
The median household income in Platte is $61,923, with the highest median household income of $68,967 found in the 25 to 44 years age bracket for the primary householder. A total of 221 households (40.3%) fall into this category. Meanwhile, the 15 to 24 years age bracket for the primary householder has the lowest median household income of $24,188, with 31 households (5.7%) in this group.
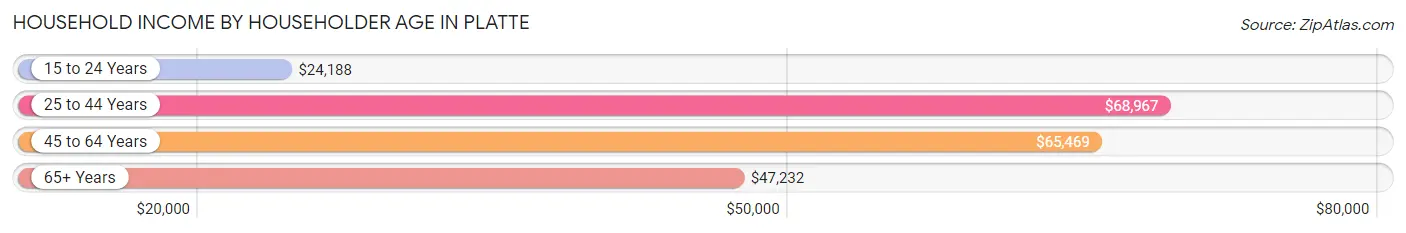
| Income Bracket | # Households | Median Income |
| 15 to 24 Years | 31 (5.7%) | $24,188 |
| 25 to 44 Years | 221 (40.3%) | $68,967 |
| 45 to 64 Years | 145 (26.5%) | $65,469 |
| 65+ Years | 151 (27.6%) | $47,232 |
| Total | 548 (100.0%) | $61,923 |
Poverty in Platte
Income Below Poverty by Sex and Age in Platte
With 12.9% poverty level for males and 22.6% for females among the residents of Platte, 12 to 14 year old males and 6 to 11 year old females are the most vulnerable to poverty, with 7 males (77.8%) and 40 females (70.2%) in their respective age groups living below the poverty level.
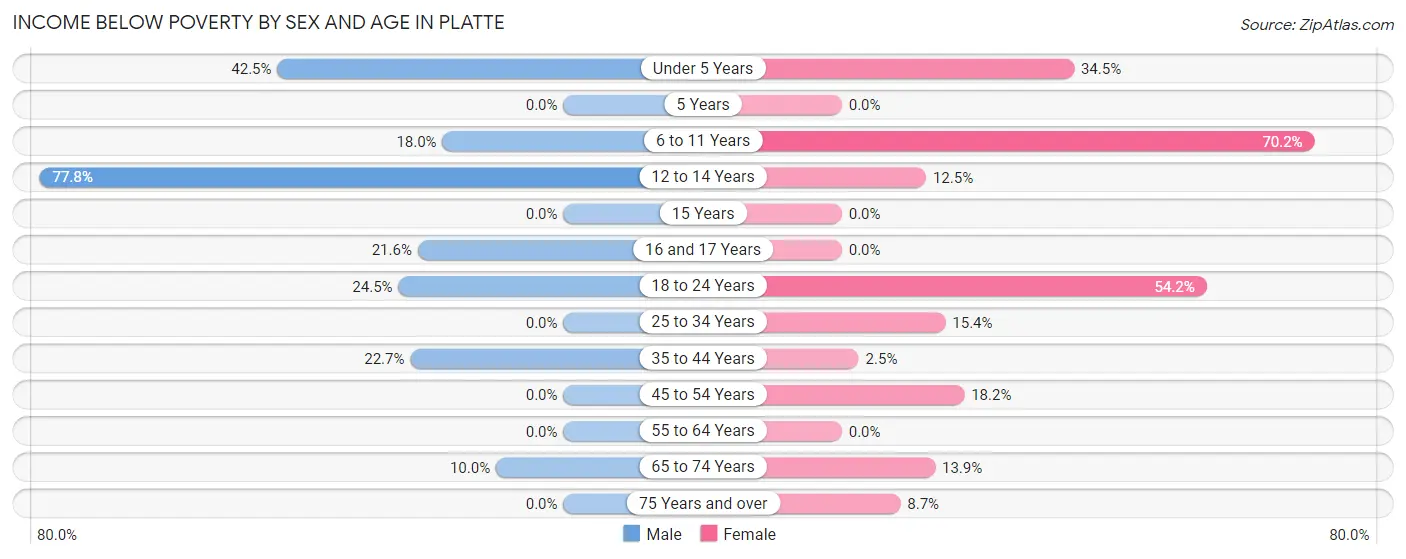
| Age Bracket | Male | Female |
| Under 5 Years | 31 (42.5%) | 20 (34.5%) |
| 5 Years | 0 (0.0%) | 0 (0.0%) |
| 6 to 11 Years | 7 (17.9%) | 40 (70.2%) |
| 12 to 14 Years | 7 (77.8%) | 6 (12.5%) |
| 15 Years | 0 (0.0%) | 0 (0.0%) |
| 16 and 17 Years | 8 (21.6%) | 0 (0.0%) |
| 18 to 24 Years | 12 (24.5%) | 26 (54.2%) |
| 25 to 34 Years | 0 (0.0%) | 16 (15.4%) |
| 35 to 44 Years | 10 (22.7%) | 1 (2.5%) |
| 45 to 54 Years | 0 (0.0%) | 14 (18.2%) |
| 55 to 64 Years | 0 (0.0%) | 0 (0.0%) |
| 65 to 74 Years | 8 (10.0%) | 9 (13.9%) |
| 75 Years and over | 0 (0.0%) | 4 (8.7%) |
| Total | 83 (12.9%) | 136 (22.6%) |
Income Above Poverty by Sex and Age in Platte
According to the poverty statistics in Platte, males aged 5 years and females aged 5 years are the age groups that are most secure financially, with 100.0% of males and 100.0% of females in these age groups living above the poverty line.
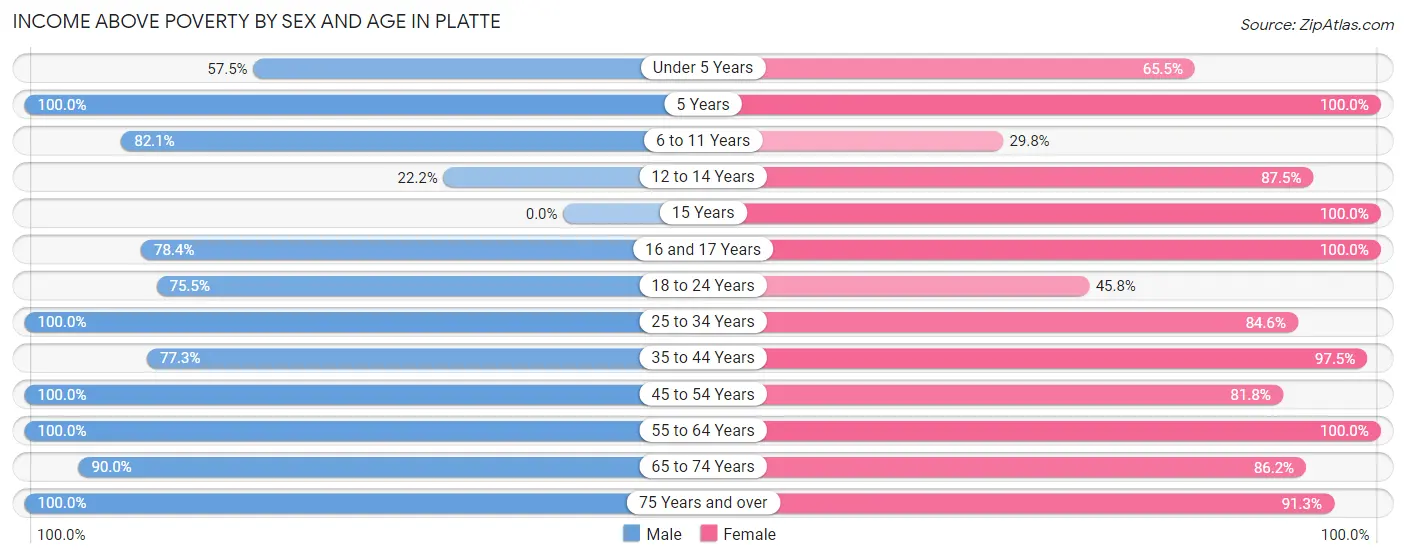
| Age Bracket | Male | Female |
| Under 5 Years | 42 (57.5%) | 38 (65.5%) |
| 5 Years | 5 (100.0%) | 1 (100.0%) |
| 6 to 11 Years | 32 (82.1%) | 17 (29.8%) |
| 12 to 14 Years | 2 (22.2%) | 42 (87.5%) |
| 15 Years | 0 (0.0%) | 8 (100.0%) |
| 16 and 17 Years | 29 (78.4%) | 3 (100.0%) |
| 18 to 24 Years | 37 (75.5%) | 22 (45.8%) |
| 25 to 34 Years | 126 (100.0%) | 88 (84.6%) |
| 35 to 44 Years | 34 (77.3%) | 39 (97.5%) |
| 45 to 54 Years | 84 (100.0%) | 63 (81.8%) |
| 55 to 64 Years | 43 (100.0%) | 48 (100.0%) |
| 65 to 74 Years | 72 (90.0%) | 56 (86.2%) |
| 75 Years and over | 54 (100.0%) | 42 (91.3%) |
| Total | 560 (87.1%) | 467 (77.4%) |
Income Below Poverty Among Married-Couple Families in Platte
The poverty statistics for married-couple families in Platte show that 1.7% or 4 of the total 242 families live below the poverty line. Families with no children have the highest poverty rate of 3.0%, comprising of 4 families. On the other hand, families with 1 or 2 children have the lowest poverty rate of 0.0%, which includes 0 families.
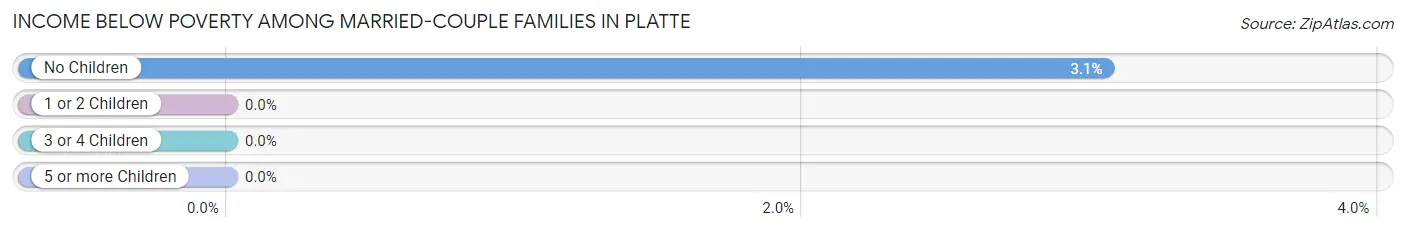
| Children | Above Poverty | Below Poverty |
| No Children | 127 (97.0%) | 4 (3.0%) |
| 1 or 2 Children | 104 (100.0%) | 0 (0.0%) |
| 3 or 4 Children | 4 (100.0%) | 0 (0.0%) |
| 5 or more Children | 3 (100.0%) | 0 (0.0%) |
| Total | 238 (98.4%) | 4 (1.7%) |
Income Below Poverty Among Single-Parent Households in Platte
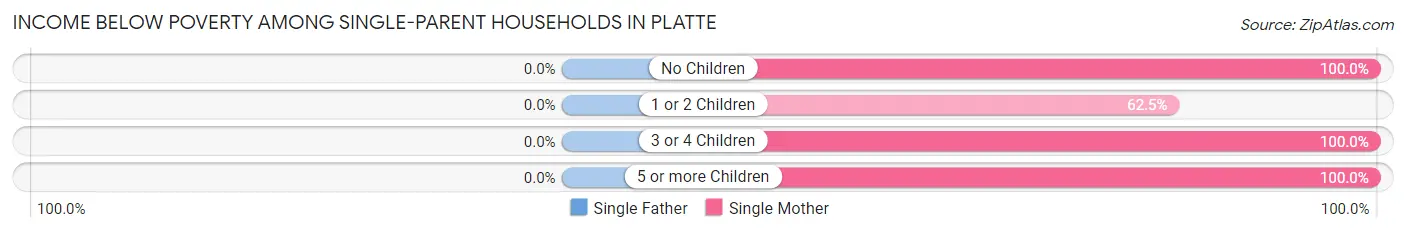
| Children | Single Father | Single Mother |
| No Children | 0 (0.0%) | 7 (100.0%) |
| 1 or 2 Children | 0 (0.0%) | 20 (62.5%) |
| 3 or 4 Children | 0 (0.0%) | 20 (100.0%) |
| 5 or more Children | 0 (0.0%) | 7 (100.0%) |
| Total | 0 (0.0%) | 54 (81.8%) |
Income Below Poverty Among Married-Couple vs Single-Parent Households in Platte
The poverty data for Platte shows that 4 of the married-couple family households (1.7%) and 54 of the single-parent households (81.8%) are living below the poverty level. Within the married-couple family households, those with no children have the highest poverty rate, with 4 households (3.0%) falling below the poverty line. Among the single-parent households, those with no children have the highest poverty rate, with 7 household (100.0%) living below poverty.
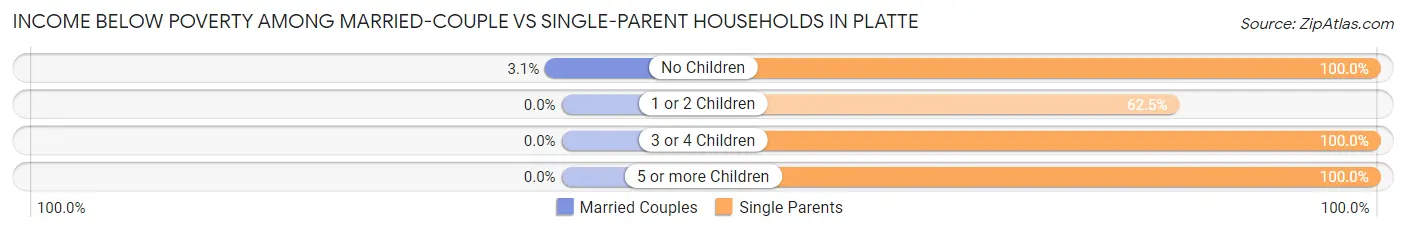
| Children | Married-Couple Families | Single-Parent Households |
| No Children | 4 (3.0%) | 7 (100.0%) |
| 1 or 2 Children | 0 (0.0%) | 20 (62.5%) |
| 3 or 4 Children | 0 (0.0%) | 20 (100.0%) |
| 5 or more Children | 0 (0.0%) | 7 (100.0%) |
| Total | 4 (1.7%) | 54 (81.8%) |
Race in Platte
The most populous races in Platte are White / Caucasian (1,251 | 96.3%), Two or more Races (20 | 1.5%), and Hispanic or Latino (15 | 1.1%).
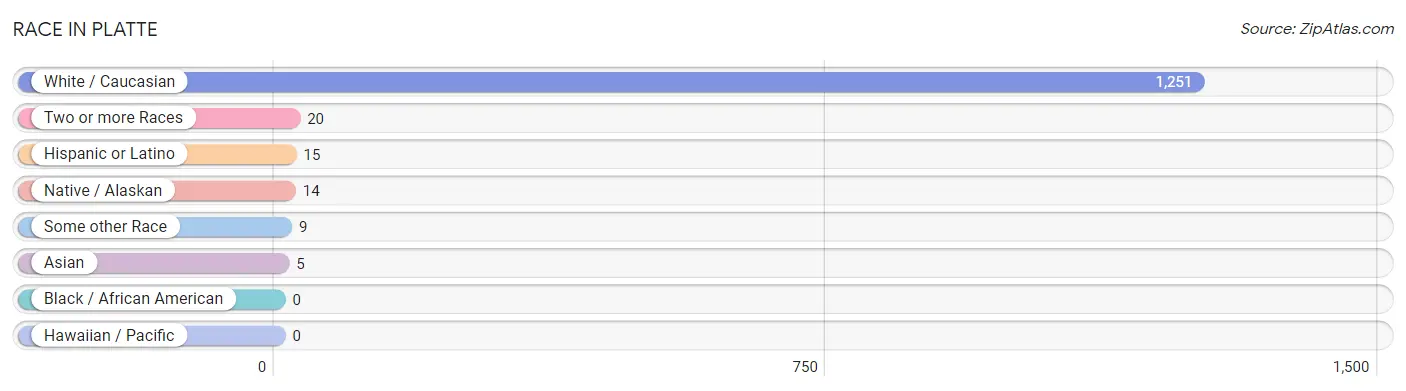
| Race | # Population | % Population |
| Asian | 5 | 0.4% |
| Black / African American | 0 | 0.0% |
| Hawaiian / Pacific | 0 | 0.0% |
| Hispanic or Latino | 15 | 1.1% |
| Native / Alaskan | 14 | 1.1% |
| White / Caucasian | 1,251 | 96.3% |
| Two or more Races | 20 | 1.5% |
| Some other Race | 9 | 0.7% |
| Total | 1,299 | 100.0% |
Ancestry in Platte
The most populous ancestries reported in Platte are German (489 | 37.6%), Dutch (346 | 26.6%), Irish (171 | 13.2%), American (123 | 9.5%), and European (122 | 9.4%), together accounting for 96.3% of all Platte residents.
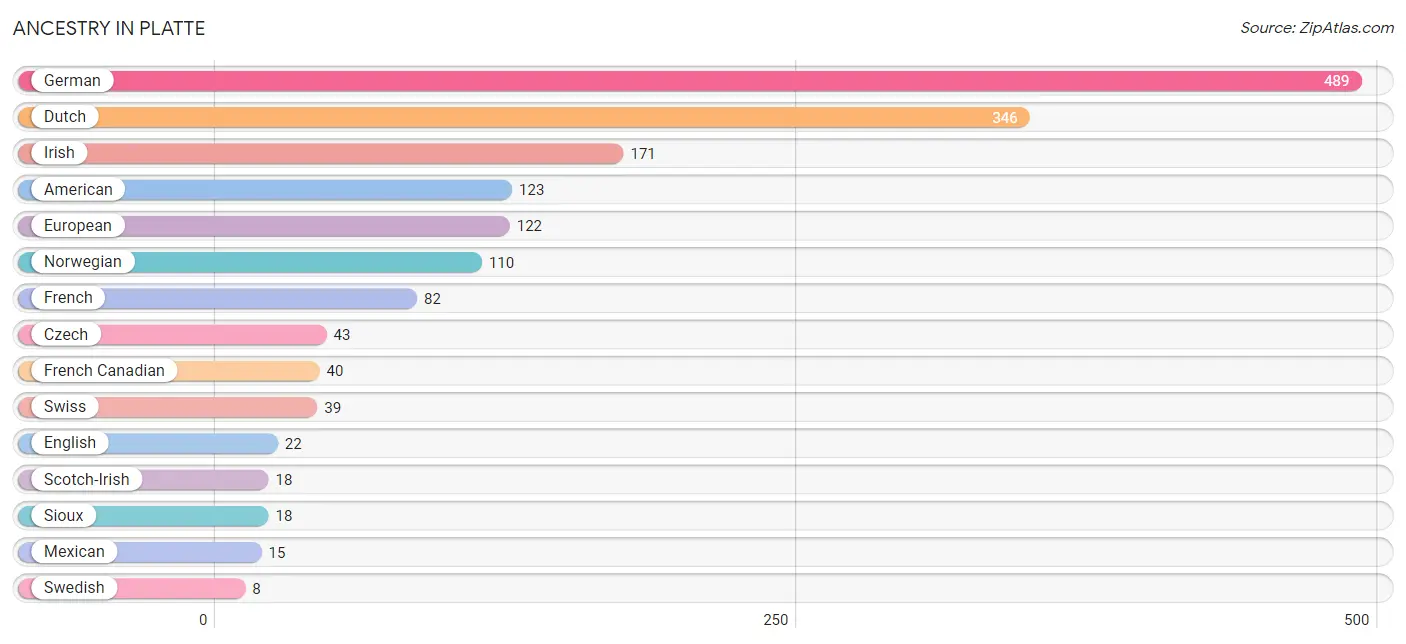
| Ancestry | # Population | % Population |
| American | 123 | 9.5% |
| Canadian | 2 | 0.2% |
| Czech | 43 | 3.3% |
| Danish | 3 | 0.2% |
| Dutch | 346 | 26.6% |
| English | 22 | 1.7% |
| European | 122 | 9.4% |
| French | 82 | 6.3% |
| French Canadian | 40 | 3.1% |
| German | 489 | 37.6% |
| Irish | 171 | 13.2% |
| Mexican | 15 | 1.1% |
| Norwegian | 110 | 8.5% |
| Polish | 1 | 0.1% |
| Portuguese | 4 | 0.3% |
| Russian | 2 | 0.2% |
| Scotch-Irish | 18 | 1.4% |
| Sioux | 18 | 1.4% |
| Sri Lankan | 5 | 0.4% |
| Swedish | 8 | 0.6% |
| Swiss | 39 | 3.0% |
| Welsh | 2 | 0.2% | View All 22 Rows |
Immigrants in Platte
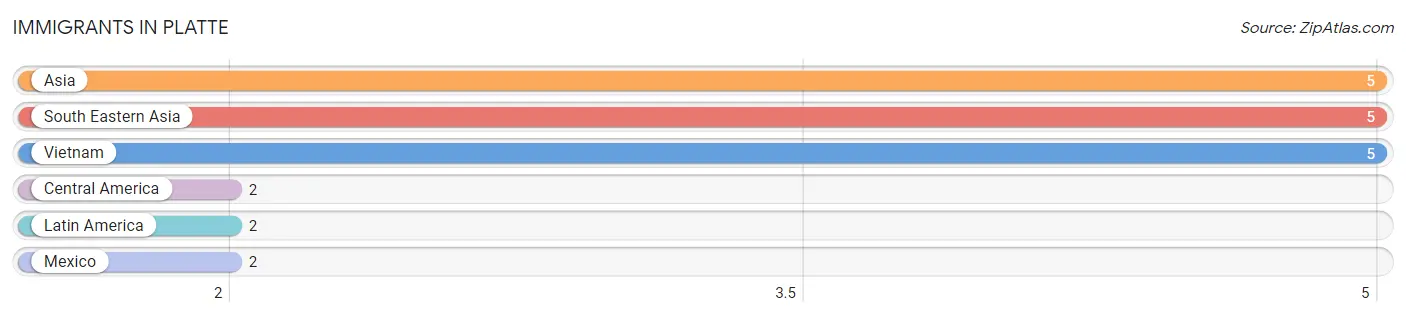
The most numerous immigrant groups reported in Platte came from Asia (5 | 0.4%), South Eastern Asia (5 | 0.4%), Vietnam (5 | 0.4%), Central America (2 | 0.2%), and Latin America (2 | 0.2%), together accounting for 1.4% of all Platte residents.
| Immigration Origin | # Population | % Population |
| Asia | 5 | 0.4% |
| Central America | 2 | 0.2% |
| Latin America | 2 | 0.2% |
| Mexico | 2 | 0.2% |
| South Eastern Asia | 5 | 0.4% |
| Vietnam | 5 | 0.4% | View All 6 Rows |
Sex and Age in Platte
Sex and Age in Platte
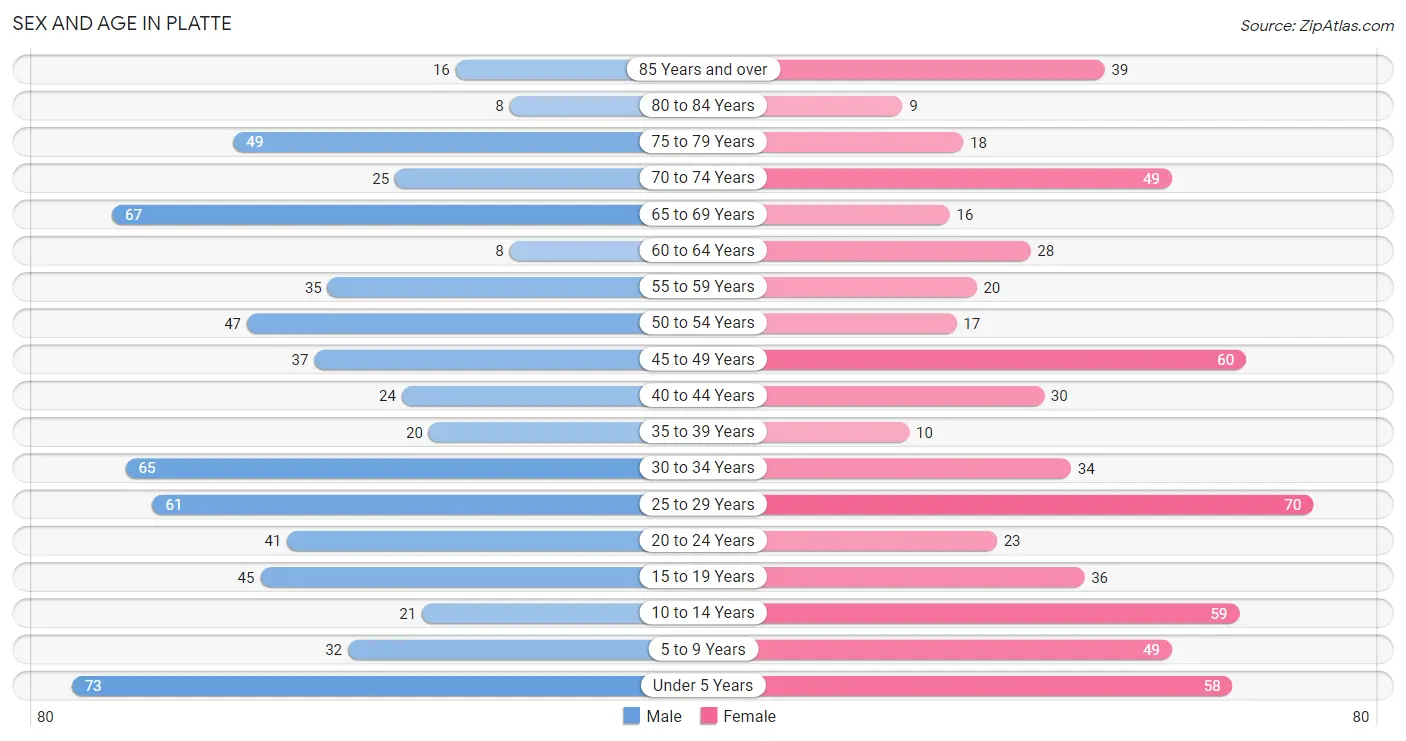
The most populous age groups in Platte are Under 5 Years (73 | 10.8%) for men and 25 to 29 Years (70 | 11.2%) for women.
| Age Bracket | Male | Female |
| Under 5 Years | 73 (10.8%) | 58 (9.3%) |
| 5 to 9 Years | 32 (4.8%) | 49 (7.8%) |
| 10 to 14 Years | 21 (3.1%) | 59 (9.4%) |
| 15 to 19 Years | 45 (6.7%) | 36 (5.8%) |
| 20 to 24 Years | 41 (6.1%) | 23 (3.7%) |
| 25 to 29 Years | 61 (9.0%) | 70 (11.2%) |
| 30 to 34 Years | 65 (9.6%) | 34 (5.4%) |
| 35 to 39 Years | 20 (3.0%) | 10 (1.6%) |
| 40 to 44 Years | 24 (3.6%) | 30 (4.8%) |
| 45 to 49 Years | 37 (5.5%) | 60 (9.6%) |
| 50 to 54 Years | 47 (7.0%) | 17 (2.7%) |
| 55 to 59 Years | 35 (5.2%) | 20 (3.2%) |
| 60 to 64 Years | 8 (1.2%) | 28 (4.5%) |
| 65 to 69 Years | 67 (9.9%) | 16 (2.6%) |
| 70 to 74 Years | 25 (3.7%) | 49 (7.8%) |
| 75 to 79 Years | 49 (7.3%) | 18 (2.9%) |
| 80 to 84 Years | 8 (1.2%) | 9 (1.4%) |
| 85 Years and over | 16 (2.4%) | 39 (6.2%) |
| Total | 674 (100.0%) | 625 (100.0%) |
Families and Households in Platte
Median Family Size in Platte
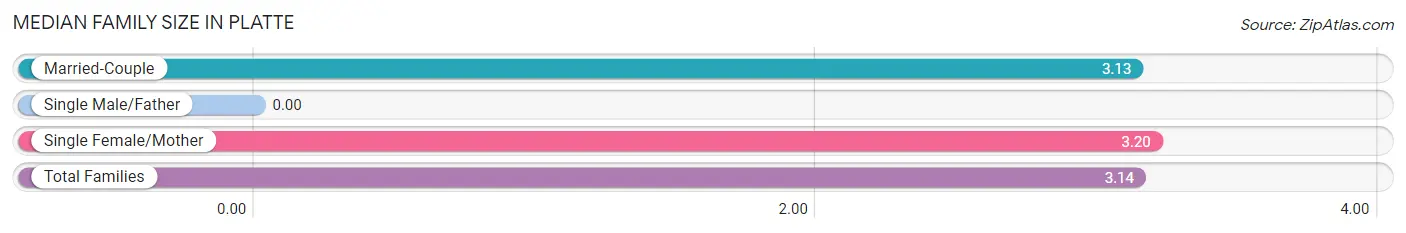
| Family Type | # Families | Family Size |
| Married-Couple | 242 (78.6%) | 3.13 |
| Single Male/Father | 0 (0.0%) | - |
| Single Female/Mother | 66 (21.4%) | 3.20 |
| Total Families | 308 (100.0%) | 3.14 |
Median Household Size in Platte
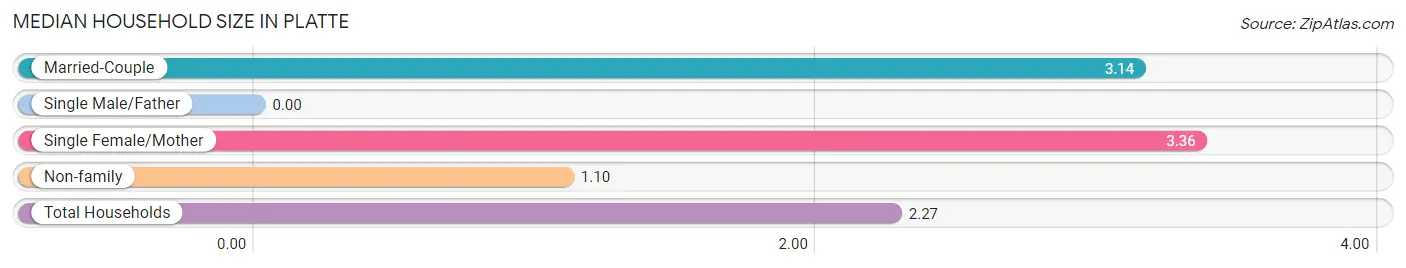
| Household Type | # Households | Household Size |
| Married-Couple | 242 (44.2%) | 3.14 |
| Single Male/Father | 0 (0.0%) | - |
| Single Female/Mother | 66 (12.0%) | 3.36 |
| Non-family | 240 (43.8%) | 1.10 |
| Total Households | 548 (100.0%) | 2.27 |
Household Size by Marriage Status in Platte
Out of a total of 548 households in Platte, 308 (56.2%) are family households, while 240 (43.8%) are nonfamily households. The most numerous type of family households are 2-person households, comprising 135, and the most common type of nonfamily households are 1-person households, comprising 219.
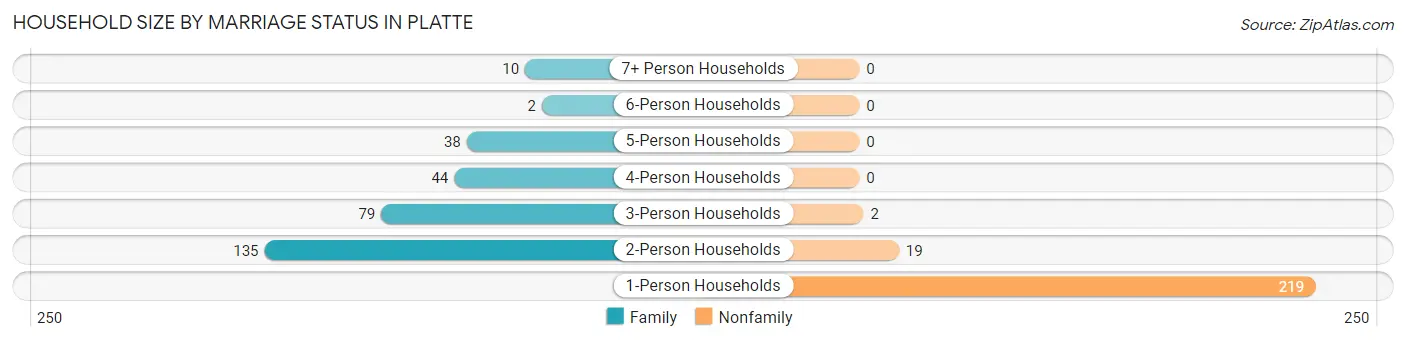
| Household Size | Family Households | Nonfamily Households |
| 1-Person Households | - | 219 (40.0%) |
| 2-Person Households | 135 (24.6%) | 19 (3.5%) |
| 3-Person Households | 79 (14.4%) | 2 (0.4%) |
| 4-Person Households | 44 (8.0%) | 0 (0.0%) |
| 5-Person Households | 38 (6.9%) | 0 (0.0%) |
| 6-Person Households | 2 (0.4%) | 0 (0.0%) |
| 7+ Person Households | 10 (1.8%) | 0 (0.0%) |
| Total | 308 (56.2%) | 240 (43.8%) |
Female Fertility in Platte
Fertility by Age in Platte
Average fertility rate in Platte is 175.0 births per 1,000 women. Women in the age bracket of 20 to 34 years have the highest fertility rate with 354.0 births per 1,000 women. Women in the age bracket of 20 to 34 years acount for 97.8% of all women with births.
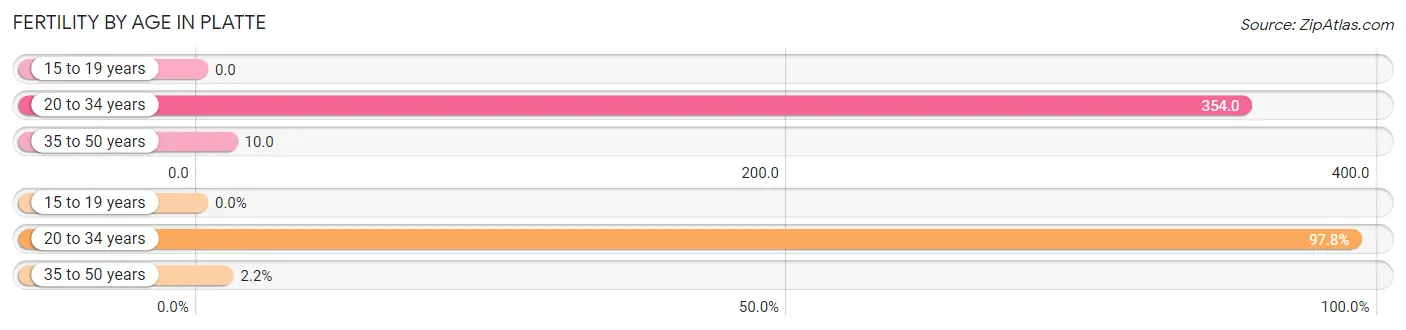
| Age Bracket | Women with Births | Births / 1,000 Women |
| 15 to 19 years | 0 (0.0%) | 0.0 |
| 20 to 34 years | 45 (97.8%) | 354.0 |
| 35 to 50 years | 1 (2.2%) | 10.0 |
| Total | 46 (100.0%) | 175.0 |
Fertility by Age by Marriage Status in Platte
56.5% of women with births (46) in Platte are married. The highest percentage of unmarried women with births falls into 20 to 34 years age bracket with 44.4% of them unmarried at the time of birth, while the lowest percentage of unmarried women with births belong to 35 to 50 years age bracket with 0.0% of them unmarried.
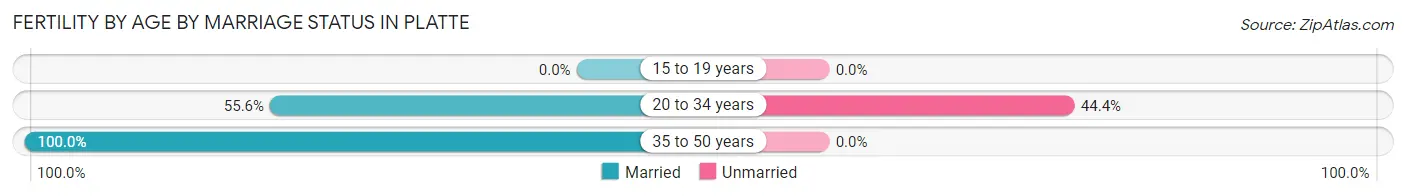
| Age Bracket | Married | Unmarried |
| 15 to 19 years | 0 (0.0%) | 0 (0.0%) |
| 20 to 34 years | 25 (55.6%) | 20 (44.4%) |
| 35 to 50 years | 1 (100.0%) | 0 (0.0%) |
| Total | 26 (56.5%) | 20 (43.5%) |
Fertility by Education in Platte
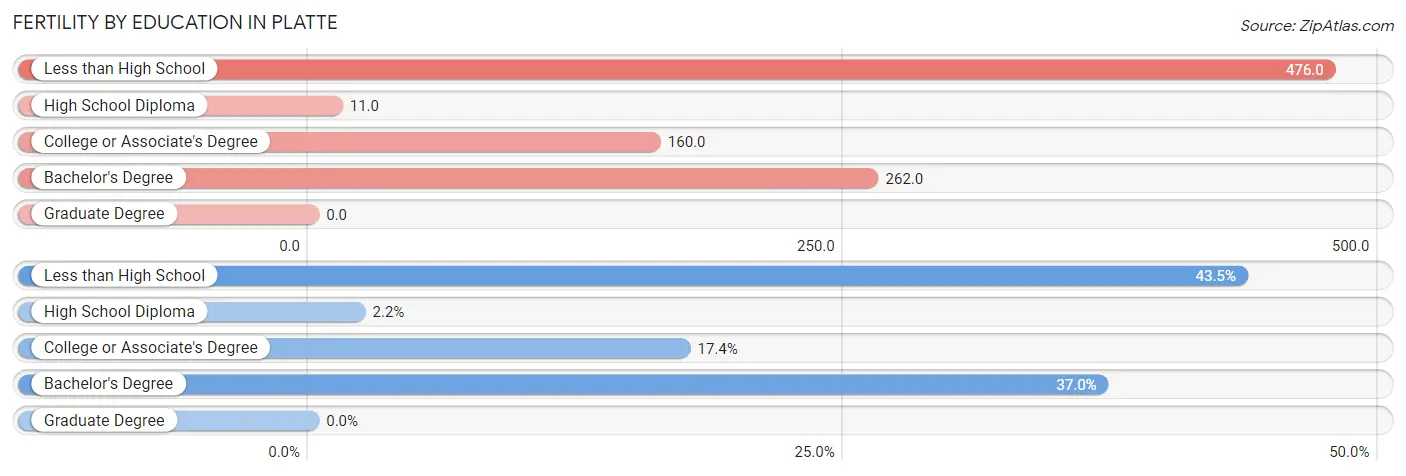
| Educational Attainment | Women with Births | Births / 1,000 Women |
| Less than High School | 20 (43.5%) | 476.0 |
| High School Diploma | 1 (2.2%) | 11.0 |
| College or Associate's Degree | 8 (17.4%) | 160.0 |
| Bachelor's Degree | 17 (37.0%) | 262.0 |
| Graduate Degree | 0 (0.0%) | 0.0 |
| Total | 46 (100.0%) | 175.0 |
Fertility by Education by Marriage Status in Platte
43.5% of women with births in Platte are unmarried. Women with the educational attainment of high school diploma are most likely to be married with 100.0% of them married at childbirth, while women with the educational attainment of less than high school are least likely to be married with 100.0% of them unmarried at childbirth.
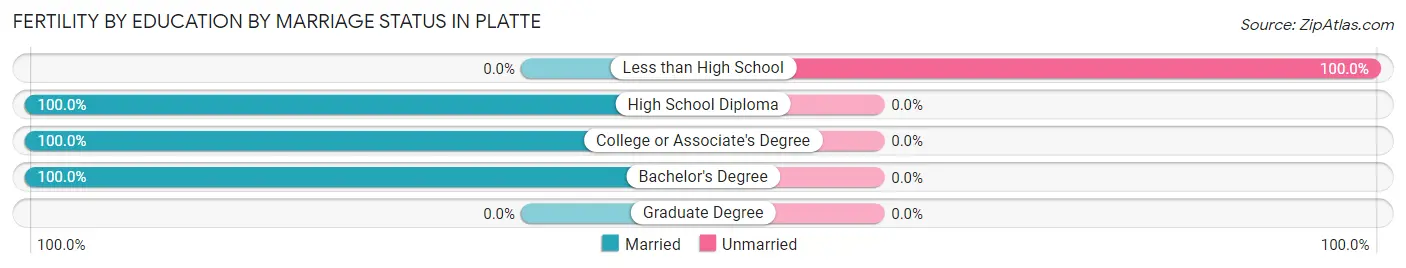
| Educational Attainment | Married | Unmarried |
| Less than High School | 0 (0.0%) | 20 (100.0%) |
| High School Diploma | 1 (100.0%) | 0 (0.0%) |
| College or Associate's Degree | 8 (100.0%) | 0 (0.0%) |
| Bachelor's Degree | 17 (100.0%) | 0 (0.0%) |
| Graduate Degree | 0 (0.0%) | 0 (0.0%) |
| Total | 26 (56.5%) | 20 (43.5%) |
Employment Characteristics in Platte
Employment by Class of Employer in Platte
Among the 677 employed individuals in Platte, private company employees (383 | 56.6%), self-employed (not incorporated) (82 | 12.1%), and self-employed (incorporated) (71 | 10.5%) make up the most common classes of employment.
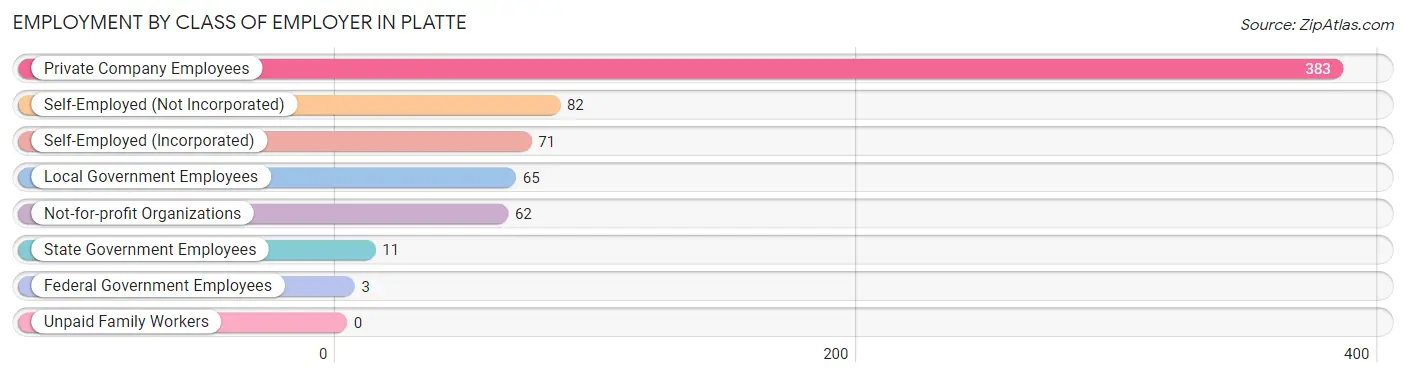
| Employer Class | # Employees | % Employees |
| Private Company Employees | 383 | 56.6% |
| Self-Employed (Incorporated) | 71 | 10.5% |
| Self-Employed (Not Incorporated) | 82 | 12.1% |
| Not-for-profit Organizations | 62 | 9.2% |
| Local Government Employees | 65 | 9.6% |
| State Government Employees | 11 | 1.6% |
| Federal Government Employees | 3 | 0.4% |
| Unpaid Family Workers | 0 | 0.0% |
| Total | 677 | 100.0% |
Employment Status by Age in Platte
According to the labor force statistics for Platte, out of the total population over 16 years of age (999), 70.1% or 700 individuals are in the labor force, with 0.7% or 5 of them unemployed. The age group with the highest labor force participation rate is 25 to 29 years, with 100.0% or 131 individuals in the labor force. Within the labor force, the 20 to 24 years age range has the highest percentage of unemployed individuals, with 8.3% or 2 of them being unemployed.
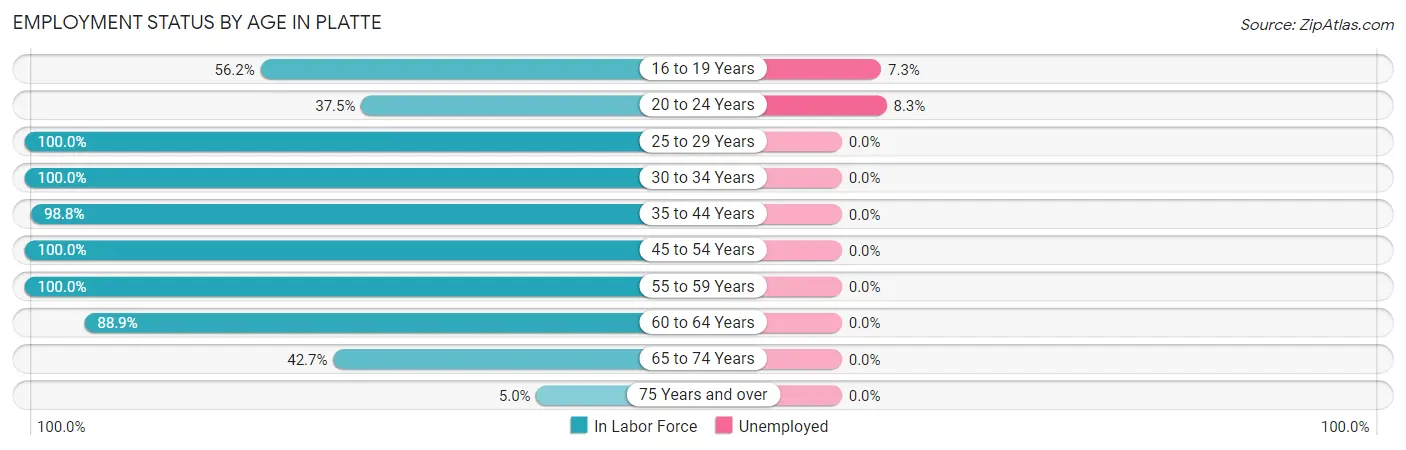
| Age Bracket | In Labor Force | Unemployed |
| 16 to 19 Years | 41 (56.2%) | 3 (7.3%) |
| 20 to 24 Years | 24 (37.5%) | 2 (8.3%) |
| 25 to 29 Years | 131 (100.0%) | 0 (0.0%) |
| 30 to 34 Years | 99 (100.0%) | 0 (0.0%) |
| 35 to 44 Years | 83 (98.8%) | 0 (0.0%) |
| 45 to 54 Years | 161 (100.0%) | 0 (0.0%) |
| 55 to 59 Years | 55 (100.0%) | 0 (0.0%) |
| 60 to 64 Years | 32 (88.9%) | 0 (0.0%) |
| 65 to 74 Years | 67 (42.7%) | 0 (0.0%) |
| 75 Years and over | 7 (5.0%) | 0 (0.0%) |
| Total | 700 (70.1%) | 5 (0.7%) |
Employment Status by Educational Attainment in Platte
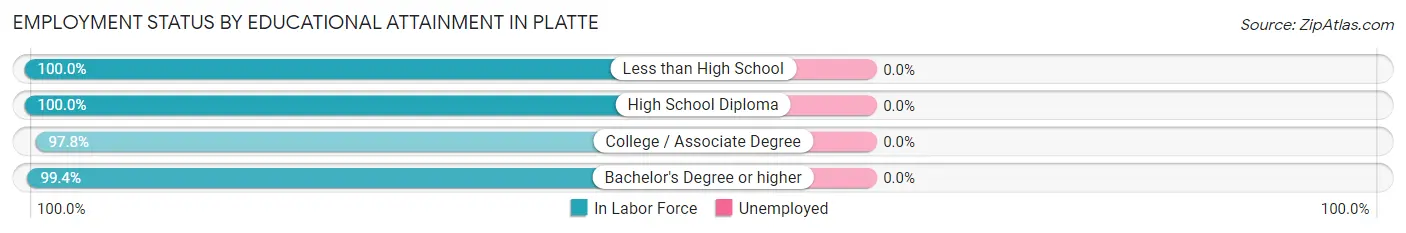
| Educational Attainment | In Labor Force | Unemployed |
| Less than High School | 1 (100.0%) | 0 (0.0%) |
| High School Diploma | 214 (100.0%) | 0 (0.0%) |
| College / Associate Degree | 176 (97.8%) | 0 (0.0%) |
| Bachelor's Degree or higher | 170 (99.4%) | 0 (0.0%) |
| Total | 561 (99.1%) | 0 (0.0%) |
Employment Occupations by Sex in Platte
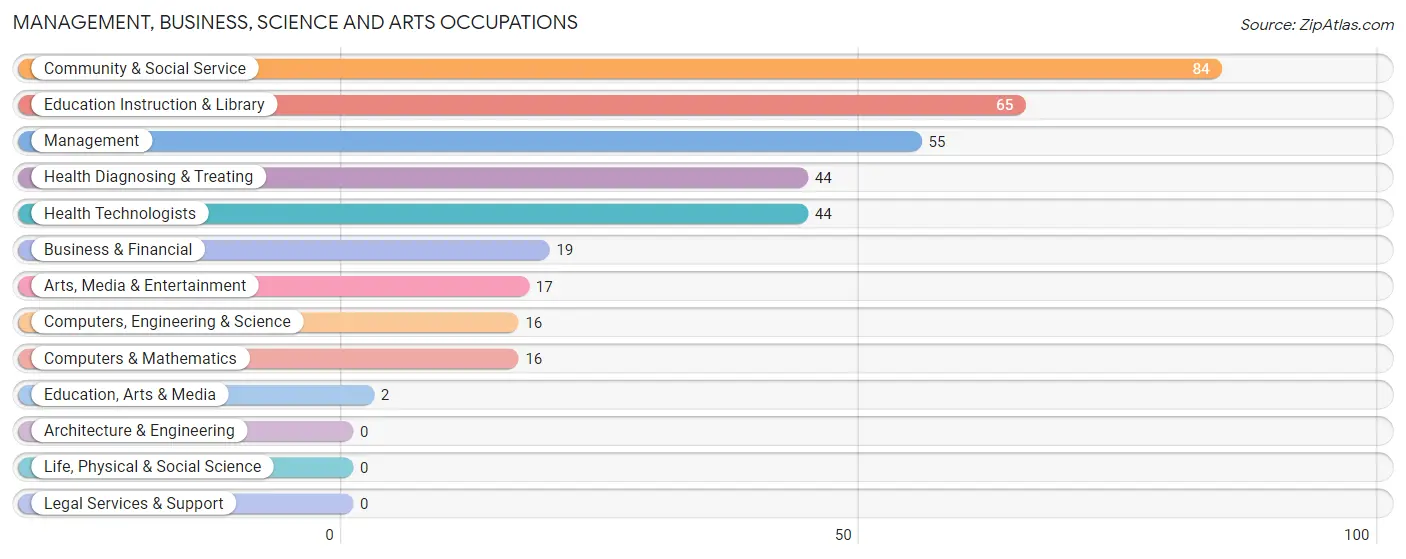
Management, Business, Science and Arts Occupations
The most common Management, Business, Science and Arts occupations in Platte are Community & Social Service (84 | 12.1%), Education Instruction & Library (65 | 9.3%), Management (55 | 7.9%), Health Diagnosing & Treating (44 | 6.3%), and Health Technologists (44 | 6.3%).
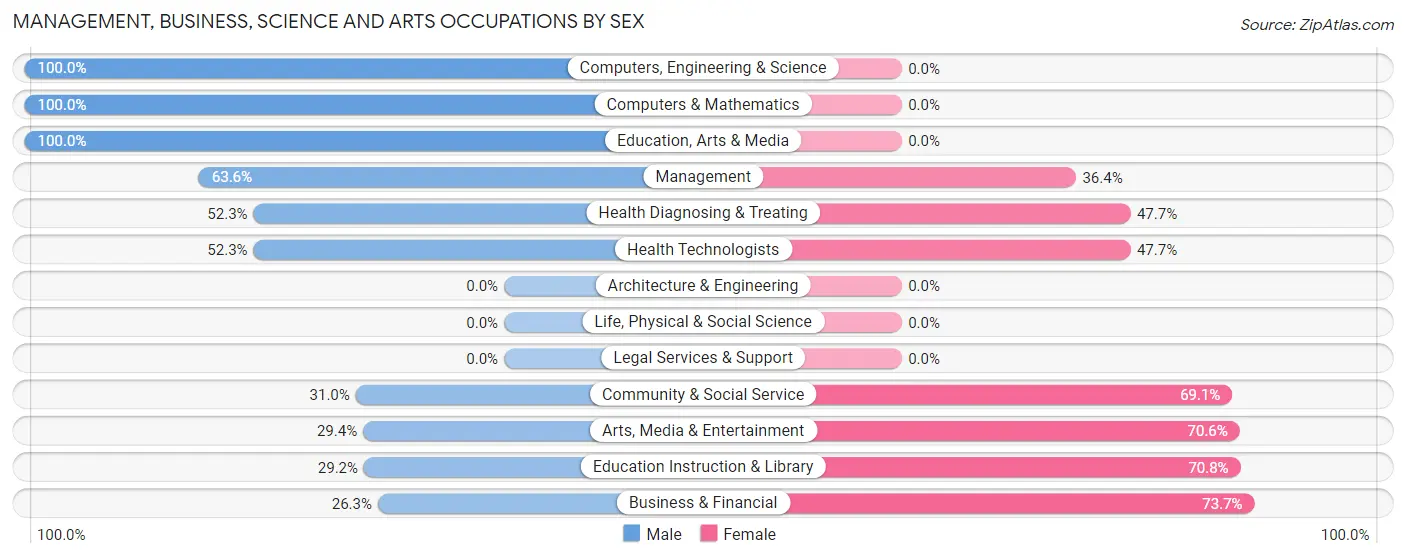
Management, Business, Science and Arts Occupations by Sex
Within the Management, Business, Science and Arts occupations in Platte, the most male-oriented occupations are Computers, Engineering & Science (100.0%), Computers & Mathematics (100.0%), and Education, Arts & Media (100.0%), while the most female-oriented occupations are Business & Financial (73.7%), Education Instruction & Library (70.8%), and Arts, Media & Entertainment (70.6%).
| Occupation | Male | Female |
| Management | 35 (63.6%) | 20 (36.4%) |
| Business & Financial | 5 (26.3%) | 14 (73.7%) |
| Computers, Engineering & Science | 16 (100.0%) | 0 (0.0%) |
| Computers & Mathematics | 16 (100.0%) | 0 (0.0%) |
| Architecture & Engineering | 0 (0.0%) | 0 (0.0%) |
| Life, Physical & Social Science | 0 (0.0%) | 0 (0.0%) |
| Community & Social Service | 26 (30.9%) | 58 (69.1%) |
| Education, Arts & Media | 2 (100.0%) | 0 (0.0%) |
| Legal Services & Support | 0 (0.0%) | 0 (0.0%) |
| Education Instruction & Library | 19 (29.2%) | 46 (70.8%) |
| Arts, Media & Entertainment | 5 (29.4%) | 12 (70.6%) |
| Health Diagnosing & Treating | 23 (52.3%) | 21 (47.7%) |
| Health Technologists | 23 (52.3%) | 21 (47.7%) |
| Total (Category) | 105 (48.2%) | 113 (51.8%) |
| Total (Overall) | 379 (54.5%) | 316 (45.5%) |
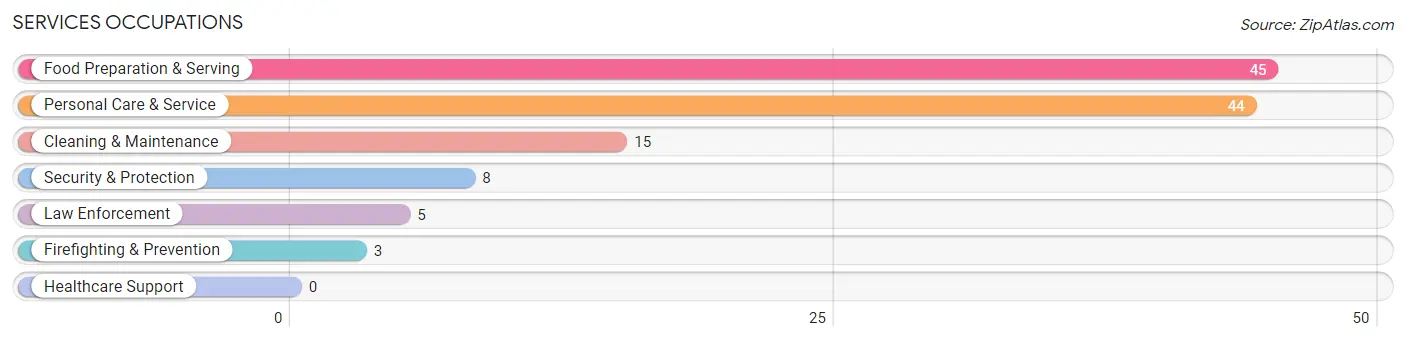
Services Occupations
The most common Services occupations in Platte are Food Preparation & Serving (45 | 6.5%), Personal Care & Service (44 | 6.3%), Cleaning & Maintenance (15 | 2.2%), Security & Protection (8 | 1.1%), and Law Enforcement (5 | 0.7%).
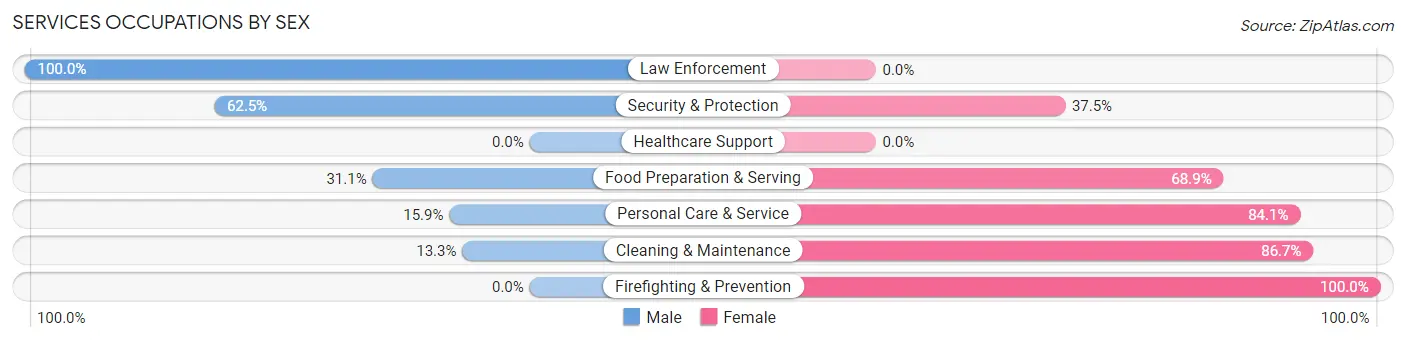
Services Occupations by Sex
Within the Services occupations in Platte, the most male-oriented occupations are Law Enforcement (100.0%), Security & Protection (62.5%), and Food Preparation & Serving (31.1%), while the most female-oriented occupations are Firefighting & Prevention (100.0%), Cleaning & Maintenance (86.7%), and Personal Care & Service (84.1%).
| Occupation | Male | Female |
| Healthcare Support | 0 (0.0%) | 0 (0.0%) |
| Security & Protection | 5 (62.5%) | 3 (37.5%) |
| Firefighting & Prevention | 0 (0.0%) | 3 (100.0%) |
| Law Enforcement | 5 (100.0%) | 0 (0.0%) |
| Food Preparation & Serving | 14 (31.1%) | 31 (68.9%) |
| Cleaning & Maintenance | 2 (13.3%) | 13 (86.7%) |
| Personal Care & Service | 7 (15.9%) | 37 (84.1%) |
| Total (Category) | 28 (25.0%) | 84 (75.0%) |
| Total (Overall) | 379 (54.5%) | 316 (45.5%) |
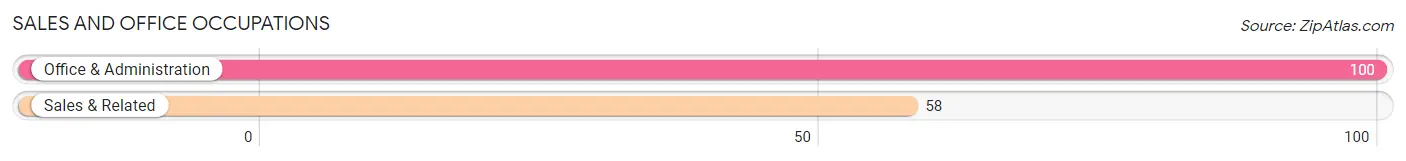
Sales and Office Occupations
The most common Sales and Office occupations in Platte are Office & Administration (100 | 14.4%), and Sales & Related (58 | 8.4%).
Sales and Office Occupations by Sex
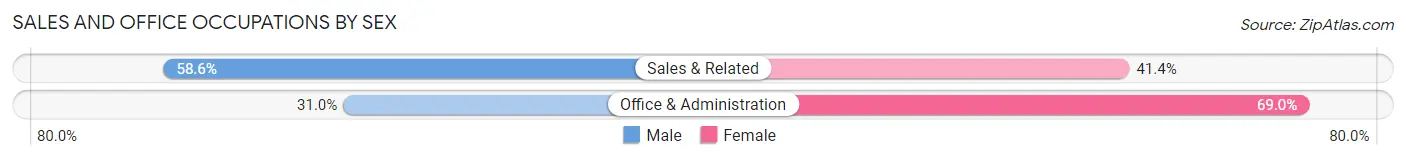
| Occupation | Male | Female |
| Sales & Related | 34 (58.6%) | 24 (41.4%) |
| Office & Administration | 31 (31.0%) | 69 (69.0%) |
| Total (Category) | 65 (41.1%) | 93 (58.9%) |
| Total (Overall) | 379 (54.5%) | 316 (45.5%) |
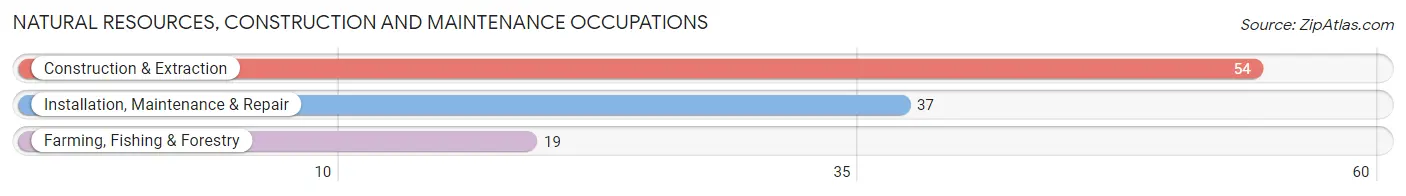
Natural Resources, Construction and Maintenance Occupations
The most common Natural Resources, Construction and Maintenance occupations in Platte are Construction & Extraction (54 | 7.8%), Installation, Maintenance & Repair (37 | 5.3%), and Farming, Fishing & Forestry (19 | 2.7%).
Natural Resources, Construction and Maintenance Occupations by Sex
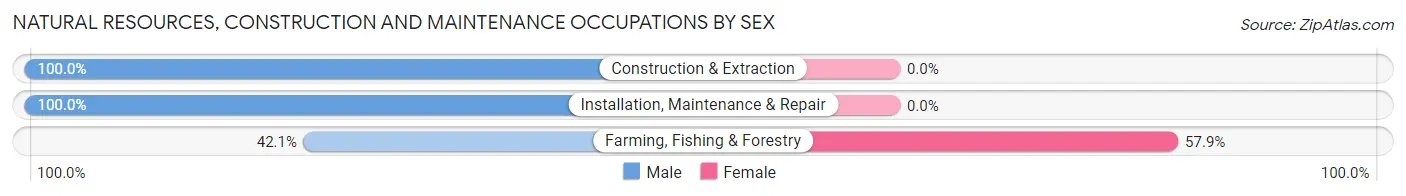
| Occupation | Male | Female |
| Farming, Fishing & Forestry | 8 (42.1%) | 11 (57.9%) |
| Construction & Extraction | 54 (100.0%) | 0 (0.0%) |
| Installation, Maintenance & Repair | 37 (100.0%) | 0 (0.0%) |
| Total (Category) | 99 (90.0%) | 11 (10.0%) |
| Total (Overall) | 379 (54.5%) | 316 (45.5%) |
Production, Transportation and Moving Occupations
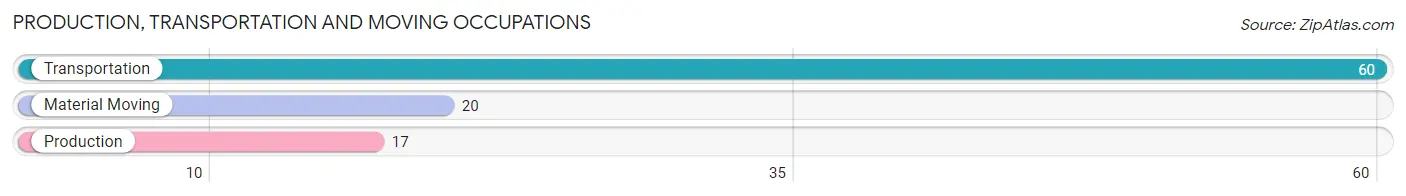
The most common Production, Transportation and Moving occupations in Platte are Transportation (60 | 8.6%), Material Moving (20 | 2.9%), and Production (17 | 2.5%).
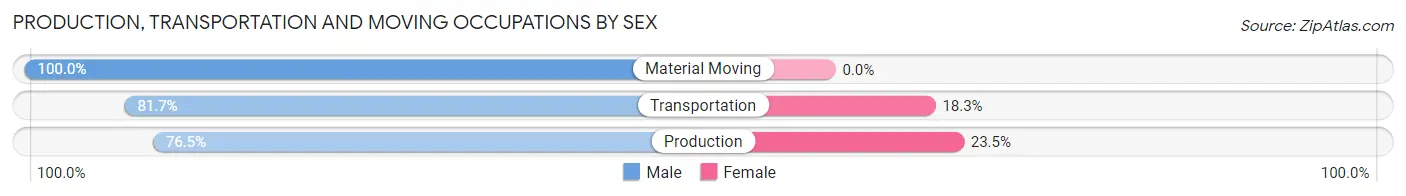
Production, Transportation and Moving Occupations by Sex
| Occupation | Male | Female |
| Production | 13 (76.5%) | 4 (23.5%) |
| Transportation | 49 (81.7%) | 11 (18.3%) |
| Material Moving | 20 (100.0%) | 0 (0.0%) |
| Total (Category) | 82 (84.5%) | 15 (15.5%) |
| Total (Overall) | 379 (54.5%) | 316 (45.5%) |
Employment Industries by Sex in Platte
Employment Industries in Platte
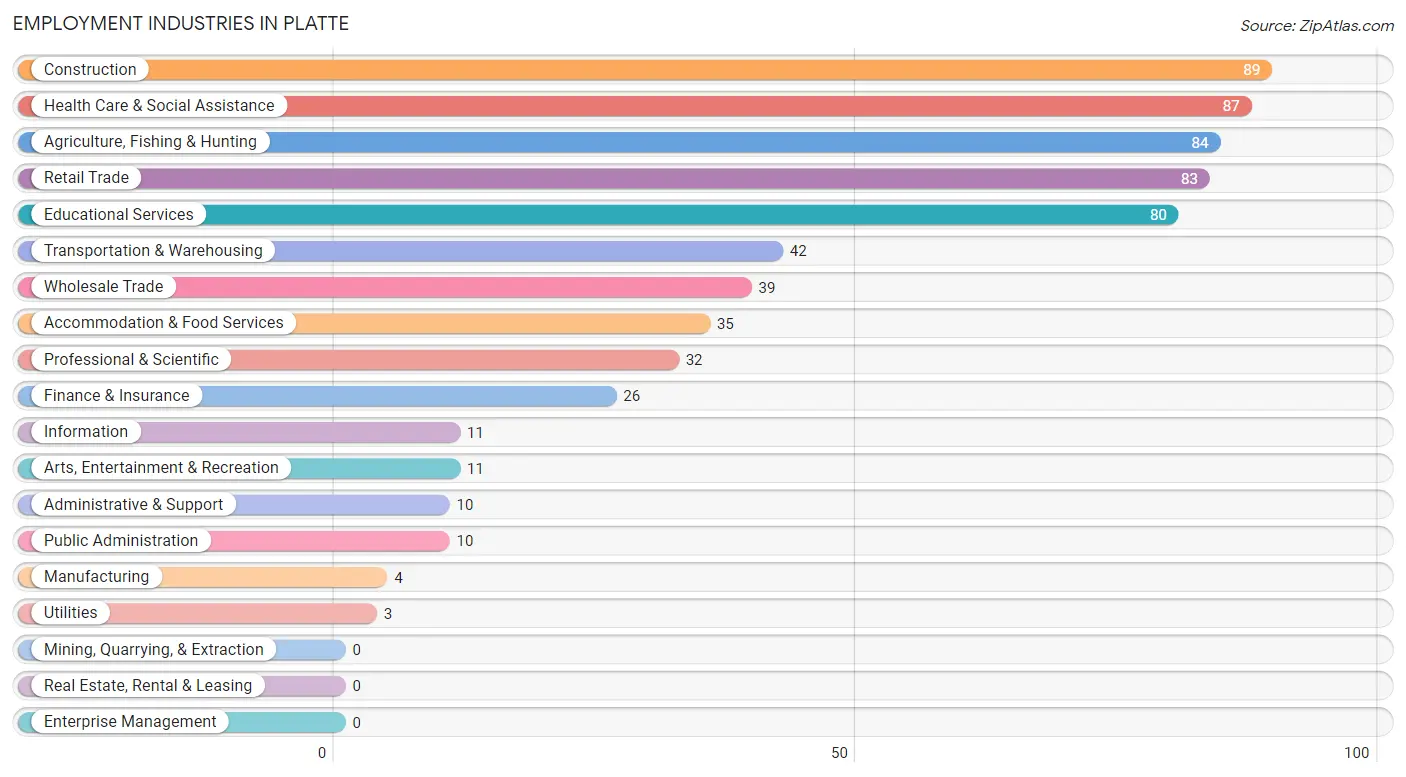
The major employment industries in Platte include Construction (89 | 12.8%), Health Care & Social Assistance (87 | 12.5%), Agriculture, Fishing & Hunting (84 | 12.1%), Retail Trade (83 | 11.9%), and Educational Services (80 | 11.5%).
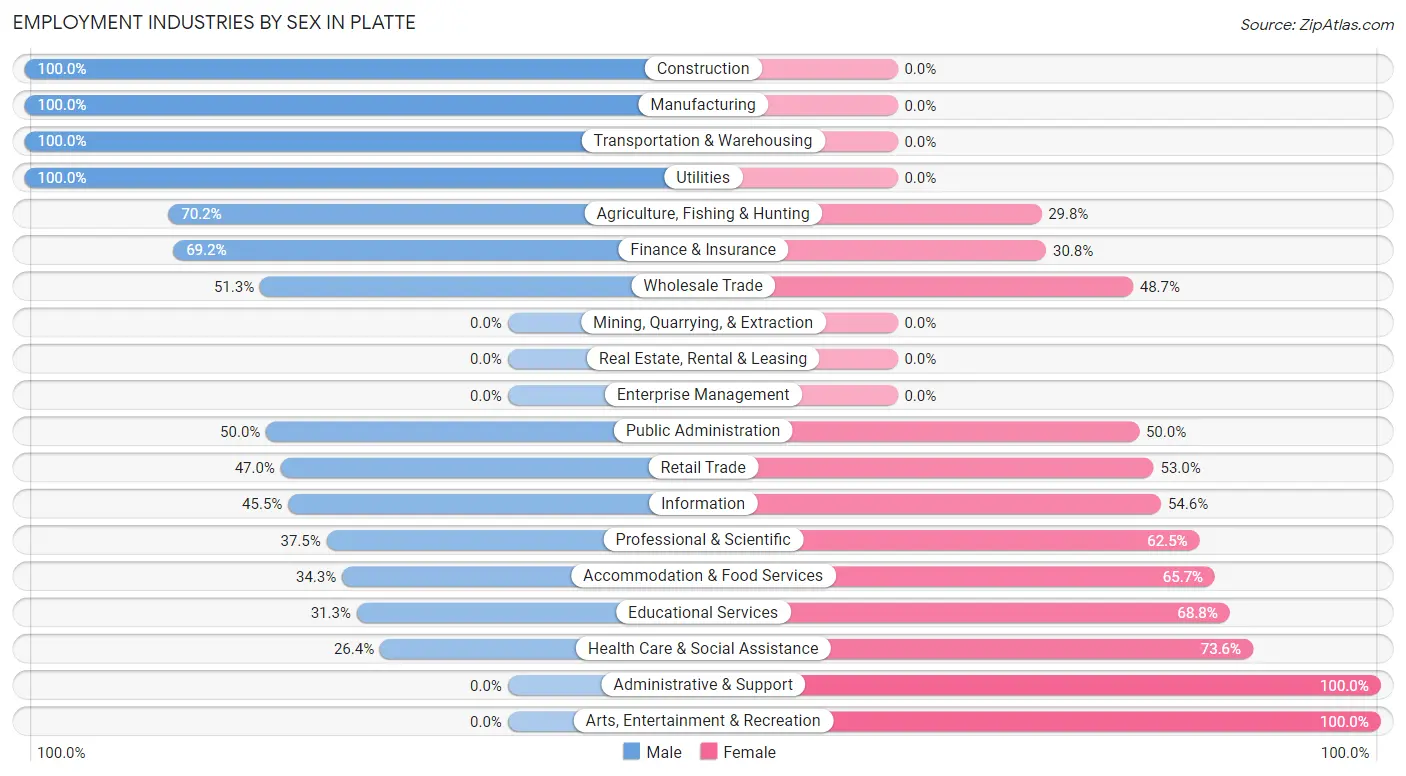
Employment Industries by Sex in Platte
The Platte industries that see more men than women are Construction (100.0%), Manufacturing (100.0%), and Transportation & Warehousing (100.0%), whereas the industries that tend to have a higher number of women are Administrative & Support (100.0%), Arts, Entertainment & Recreation (100.0%), and Health Care & Social Assistance (73.6%).
| Industry | Male | Female |
| Agriculture, Fishing & Hunting | 59 (70.2%) | 25 (29.8%) |
| Mining, Quarrying, & Extraction | 0 (0.0%) | 0 (0.0%) |
| Construction | 89 (100.0%) | 0 (0.0%) |
| Manufacturing | 4 (100.0%) | 0 (0.0%) |
| Wholesale Trade | 20 (51.3%) | 19 (48.7%) |
| Retail Trade | 39 (47.0%) | 44 (53.0%) |
| Transportation & Warehousing | 42 (100.0%) | 0 (0.0%) |
| Utilities | 3 (100.0%) | 0 (0.0%) |
| Information | 5 (45.5%) | 6 (54.5%) |
| Finance & Insurance | 18 (69.2%) | 8 (30.8%) |
| Real Estate, Rental & Leasing | 0 (0.0%) | 0 (0.0%) |
| Professional & Scientific | 12 (37.5%) | 20 (62.5%) |
| Enterprise Management | 0 (0.0%) | 0 (0.0%) |
| Administrative & Support | 0 (0.0%) | 10 (100.0%) |
| Educational Services | 25 (31.2%) | 55 (68.8%) |
| Health Care & Social Assistance | 23 (26.4%) | 64 (73.6%) |
| Arts, Entertainment & Recreation | 0 (0.0%) | 11 (100.0%) |
| Accommodation & Food Services | 12 (34.3%) | 23 (65.7%) |
| Public Administration | 5 (50.0%) | 5 (50.0%) |
| Total | 379 (54.5%) | 316 (45.5%) |
Education in Platte
School Enrollment in Platte
The most common levels of schooling among the 250 students in Platte are high school (70 | 28.0%), elementary school (69 | 27.6%), and middle school (64 | 25.6%).
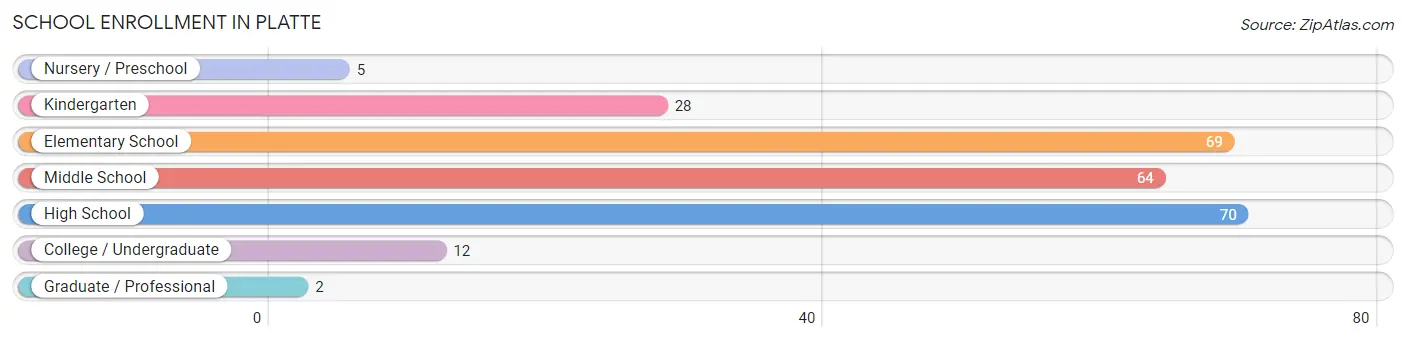
| School Level | # Students | % Students |
| Nursery / Preschool | 5 | 2.0% |
| Kindergarten | 28 | 11.2% |
| Elementary School | 69 | 27.6% |
| Middle School | 64 | 25.6% |
| High School | 70 | 28.0% |
| College / Undergraduate | 12 | 4.8% |
| Graduate / Professional | 2 | 0.8% |
| Total | 250 | 100.0% |
School Enrollment by Age by Funding Source in Platte
Out of a total of 250 students who are enrolled in schools in Platte, 94 (37.6%) attend a private institution, while the remaining 156 (62.4%) are enrolled in public schools. The age group of 10 to 14 year olds has the highest likelihood of being enrolled in private schools, with 52 (65.0% in the age bracket) enrolled. Conversely, the age group of 3 to 4 year olds has the lowest likelihood of being enrolled in a private school, with 5 (100.0% in the age bracket) attending a public institution.
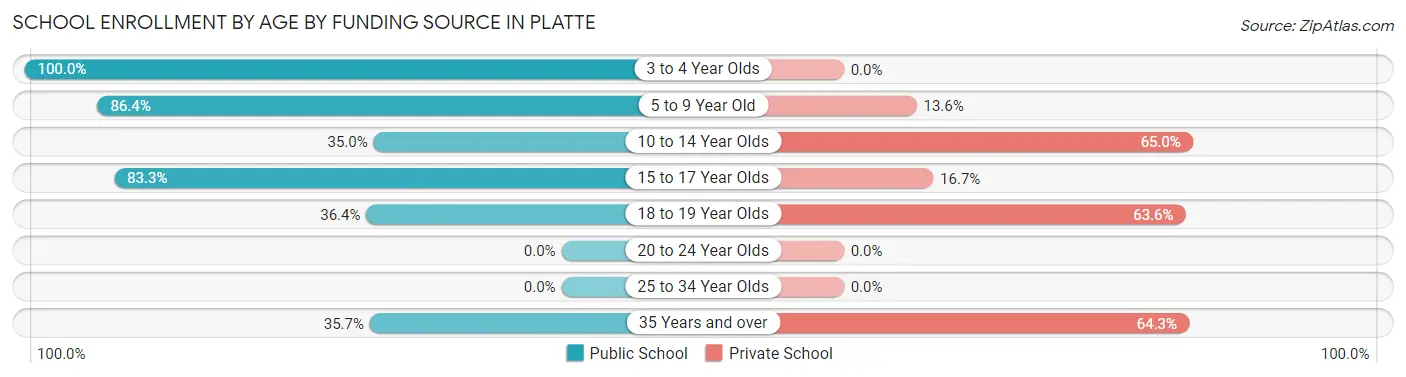
| Age Bracket | Public School | Private School |
| 3 to 4 Year Olds | 5 (100.0%) | 0 (0.0%) |
| 5 to 9 Year Old | 70 (86.4%) | 11 (13.6%) |
| 10 to 14 Year Olds | 28 (35.0%) | 52 (65.0%) |
| 15 to 17 Year Olds | 40 (83.3%) | 8 (16.7%) |
| 18 to 19 Year Olds | 8 (36.4%) | 14 (63.6%) |
| 20 to 24 Year Olds | 0 (0.0%) | 0 (0.0%) |
| 25 to 34 Year Olds | 0 (0.0%) | 0 (0.0%) |
| 35 Years and over | 5 (35.7%) | 9 (64.3%) |
| Total | 156 (62.4%) | 94 (37.6%) |
Educational Attainment by Field of Study in Platte
Education (72 | 29.9%), science & technology (63 | 26.1%), bio, nature & agricultural (37 | 15.3%), business (36 | 14.9%), and psychology (11 | 4.6%) are the most common fields of study among 241 individuals in Platte who have obtained a bachelor's degree or higher.
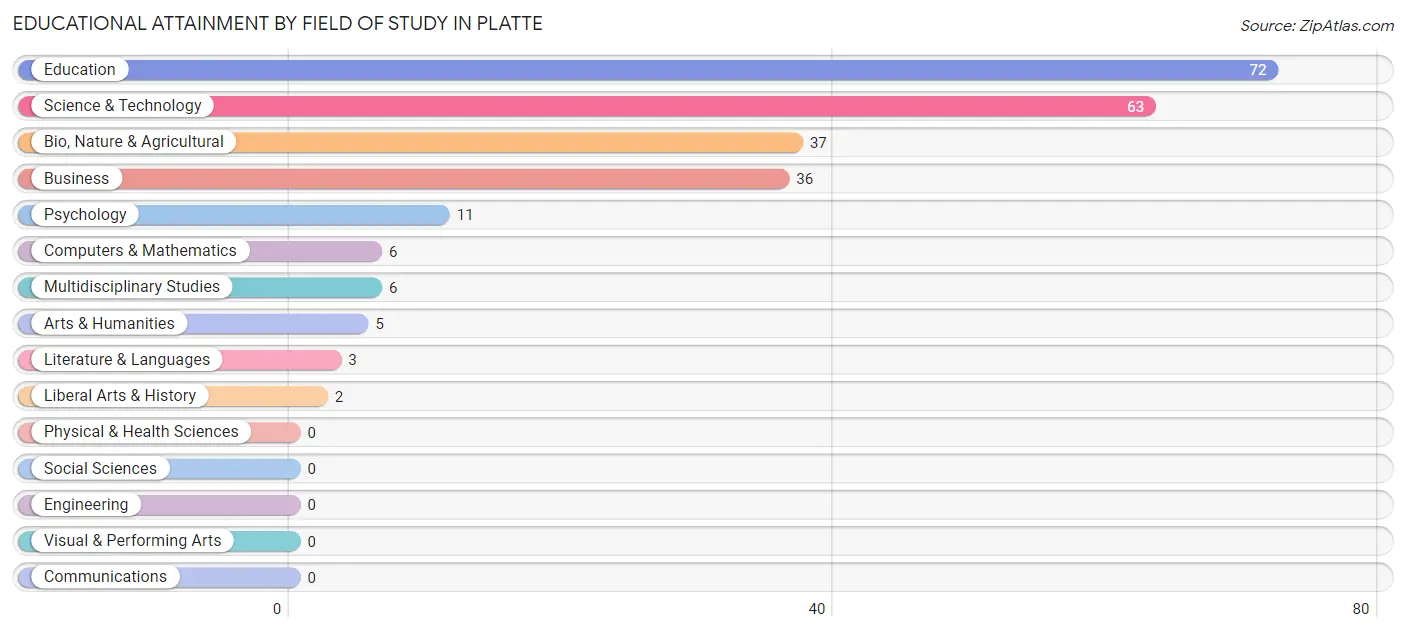
| Field of Study | # Graduates | % Graduates |
| Computers & Mathematics | 6 | 2.5% |
| Bio, Nature & Agricultural | 37 | 15.3% |
| Physical & Health Sciences | 0 | 0.0% |
| Psychology | 11 | 4.6% |
| Social Sciences | 0 | 0.0% |
| Engineering | 0 | 0.0% |
| Multidisciplinary Studies | 6 | 2.5% |
| Science & Technology | 63 | 26.1% |
| Business | 36 | 14.9% |
| Education | 72 | 29.9% |
| Literature & Languages | 3 | 1.2% |
| Liberal Arts & History | 2 | 0.8% |
| Visual & Performing Arts | 0 | 0.0% |
| Communications | 0 | 0.0% |
| Arts & Humanities | 5 | 2.1% |
| Total | 241 | 100.0% |
Transportation & Commute in Platte
Vehicle Availability by Sex in Platte
The most prevalent vehicle ownership categories in Platte are males with 2 vehicles (184, accounting for 48.8%) and females with 2 vehicles (123, making up 61.7%).
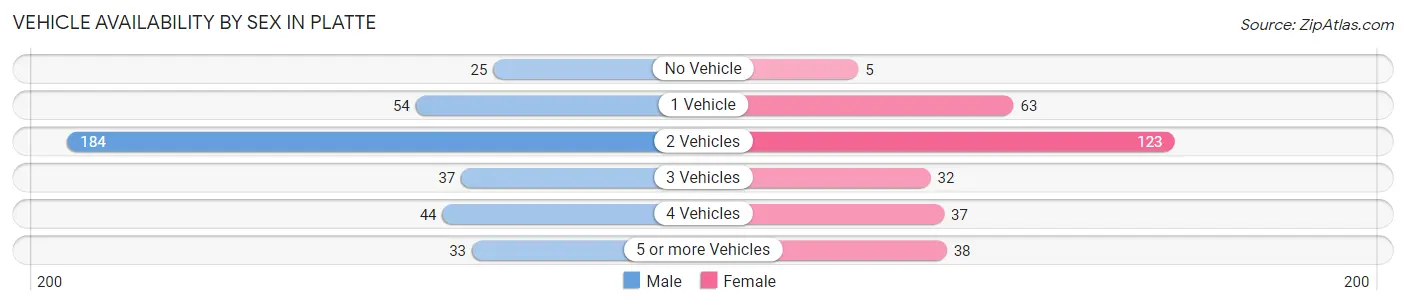
| Vehicles Available | Male | Female |
| No Vehicle | 25 (6.6%) | 5 (1.7%) |
| 1 Vehicle | 54 (14.3%) | 63 (21.1%) |
| 2 Vehicles | 184 (48.8%) | 123 (41.3%) |
| 3 Vehicles | 37 (9.8%) | 32 (10.7%) |
| 4 Vehicles | 44 (11.7%) | 37 (12.4%) |
| 5 or more Vehicles | 33 (8.7%) | 38 (12.8%) |
| Total | 377 (100.0%) | 298 (100.0%) |
Commute Time in Platte
The most frequently occuring commute durations in Platte are 5 to 9 minutes (311 commuters, 48.1%), less than 5 minutes (183 commuters, 28.3%), and 15 to 19 minutes (57 commuters, 8.8%).
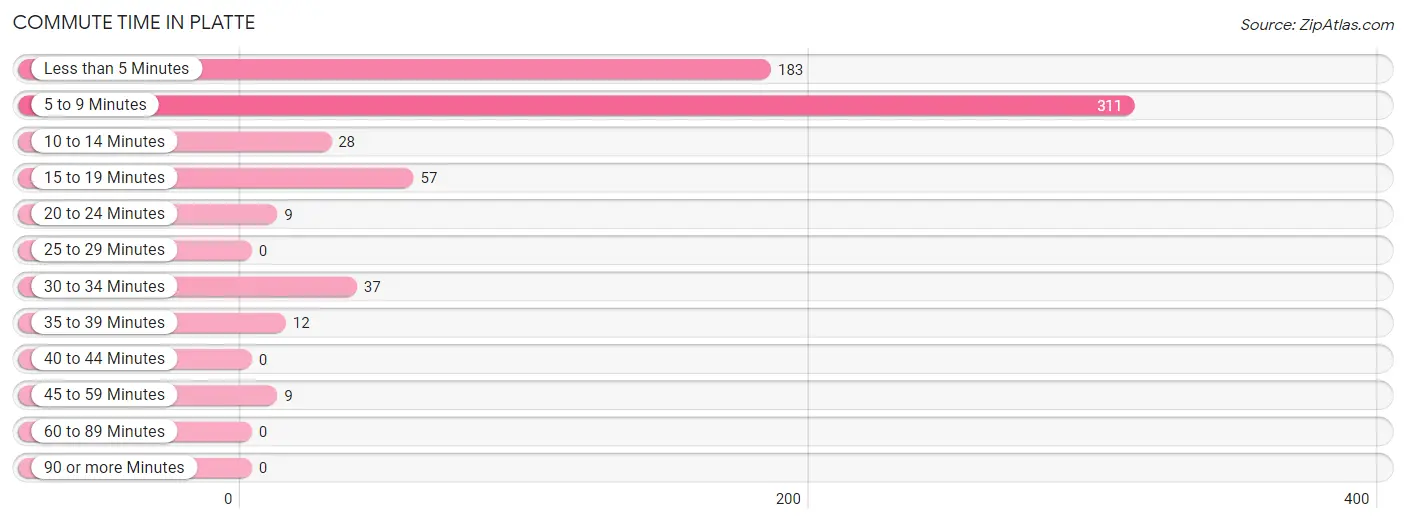
| Commute Time | # Commuters | % Commuters |
| Less than 5 Minutes | 183 | 28.3% |
| 5 to 9 Minutes | 311 | 48.1% |
| 10 to 14 Minutes | 28 | 4.3% |
| 15 to 19 Minutes | 57 | 8.8% |
| 20 to 24 Minutes | 9 | 1.4% |
| 25 to 29 Minutes | 0 | 0.0% |
| 30 to 34 Minutes | 37 | 5.7% |
| 35 to 39 Minutes | 12 | 1.9% |
| 40 to 44 Minutes | 0 | 0.0% |
| 45 to 59 Minutes | 9 | 1.4% |
| 60 to 89 Minutes | 0 | 0.0% |
| 90 or more Minutes | 0 | 0.0% |
Commute Time by Sex in Platte
The most common commute times in Platte are 5 to 9 minutes (171 commuters, 46.3%) for males and 5 to 9 minutes (140 commuters, 50.5%) for females.
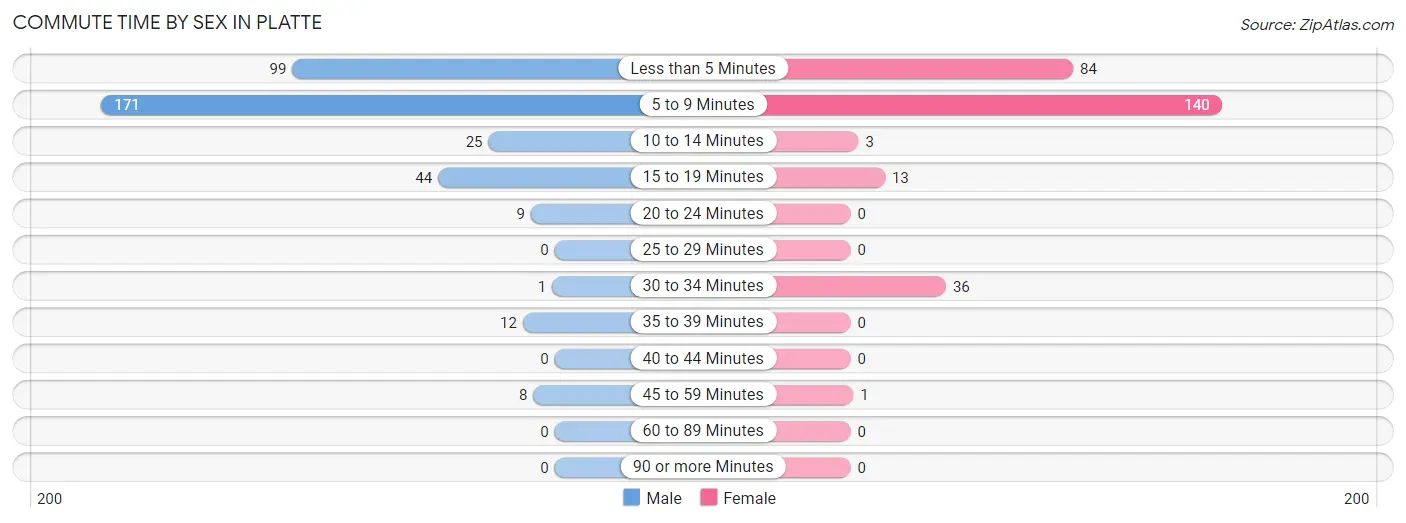
| Commute Time | Male | Female |
| Less than 5 Minutes | 99 (26.8%) | 84 (30.3%) |
| 5 to 9 Minutes | 171 (46.3%) | 140 (50.5%) |
| 10 to 14 Minutes | 25 (6.8%) | 3 (1.1%) |
| 15 to 19 Minutes | 44 (11.9%) | 13 (4.7%) |
| 20 to 24 Minutes | 9 (2.4%) | 0 (0.0%) |
| 25 to 29 Minutes | 0 (0.0%) | 0 (0.0%) |
| 30 to 34 Minutes | 1 (0.3%) | 36 (13.0%) |
| 35 to 39 Minutes | 12 (3.3%) | 0 (0.0%) |
| 40 to 44 Minutes | 0 (0.0%) | 0 (0.0%) |
| 45 to 59 Minutes | 8 (2.2%) | 1 (0.4%) |
| 60 to 89 Minutes | 0 (0.0%) | 0 (0.0%) |
| 90 or more Minutes | 0 (0.0%) | 0 (0.0%) |
Time of Departure to Work by Sex in Platte
The most frequent times of departure to work in Platte are 8:00 AM to 8:29 AM (84, 22.8%) for males and 7:30 AM to 7:59 AM (83, 30.0%) for females.
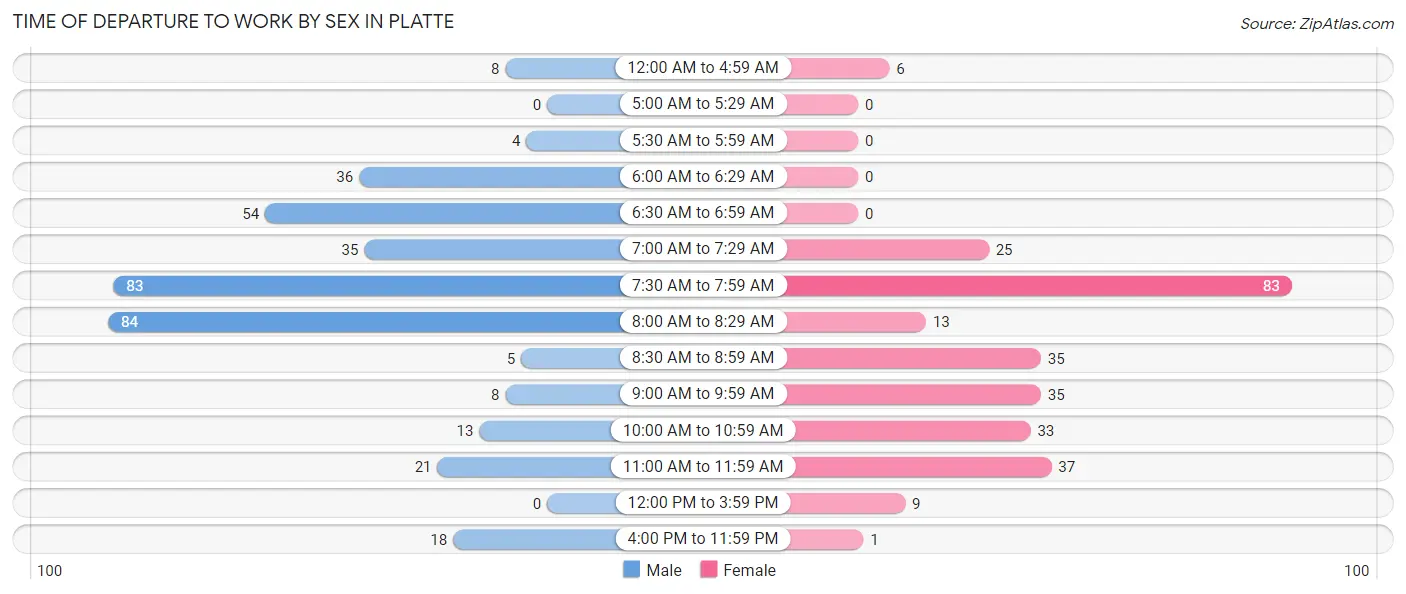
| Time of Departure | Male | Female |
| 12:00 AM to 4:59 AM | 8 (2.2%) | 6 (2.2%) |
| 5:00 AM to 5:29 AM | 0 (0.0%) | 0 (0.0%) |
| 5:30 AM to 5:59 AM | 4 (1.1%) | 0 (0.0%) |
| 6:00 AM to 6:29 AM | 36 (9.8%) | 0 (0.0%) |
| 6:30 AM to 6:59 AM | 54 (14.6%) | 0 (0.0%) |
| 7:00 AM to 7:29 AM | 35 (9.5%) | 25 (9.0%) |
| 7:30 AM to 7:59 AM | 83 (22.5%) | 83 (30.0%) |
| 8:00 AM to 8:29 AM | 84 (22.8%) | 13 (4.7%) |
| 8:30 AM to 8:59 AM | 5 (1.4%) | 35 (12.6%) |
| 9:00 AM to 9:59 AM | 8 (2.2%) | 35 (12.6%) |
| 10:00 AM to 10:59 AM | 13 (3.5%) | 33 (11.9%) |
| 11:00 AM to 11:59 AM | 21 (5.7%) | 37 (13.4%) |
| 12:00 PM to 3:59 PM | 0 (0.0%) | 9 (3.3%) |
| 4:00 PM to 11:59 PM | 18 (4.9%) | 1 (0.4%) |
| Total | 369 (100.0%) | 277 (100.0%) |
Housing Occupancy in Platte
Occupancy by Ownership in Platte
Of the total 548 dwellings in Platte, owner-occupied units account for 398 (72.6%), while renter-occupied units make up 150 (27.4%).
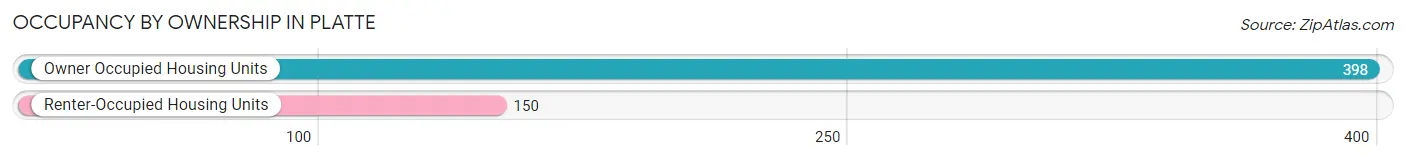
| Occupancy | # Housing Units | % Housing Units |
| Owner Occupied Housing Units | 398 | 72.6% |
| Renter-Occupied Housing Units | 150 | 27.4% |
| Total Occupied Housing Units | 548 | 100.0% |
Occupancy by Household Size in Platte
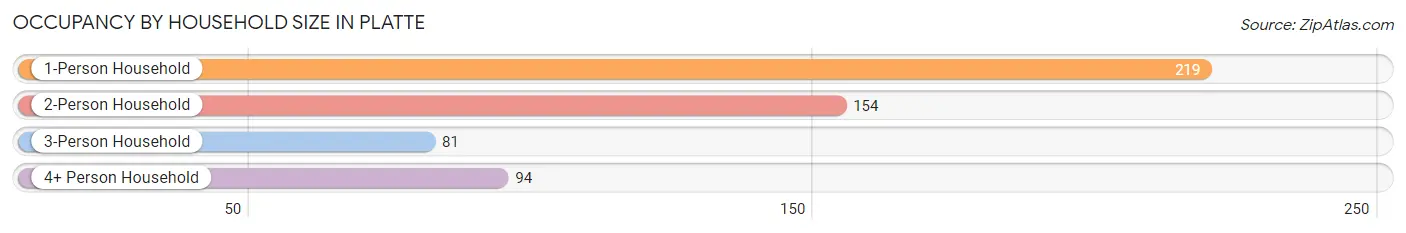
| Household Size | # Housing Units | % Housing Units |
| 1-Person Household | 219 | 40.0% |
| 2-Person Household | 154 | 28.1% |
| 3-Person Household | 81 | 14.8% |
| 4+ Person Household | 94 | 17.2% |
| Total Housing Units | 548 | 100.0% |
Occupancy by Ownership by Household Size in Platte
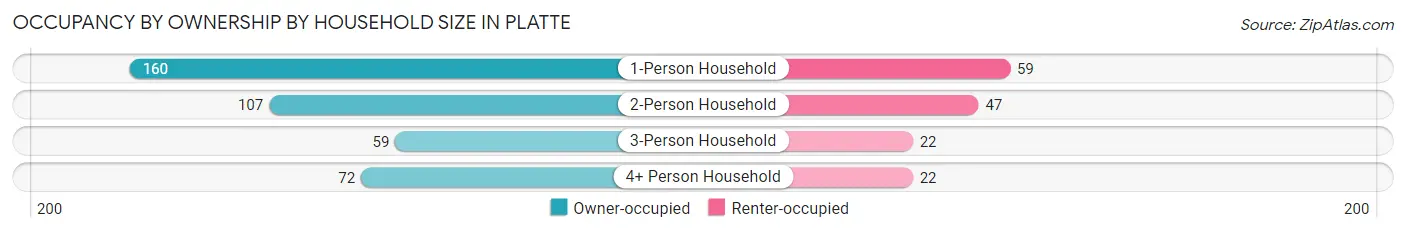
| Household Size | Owner-occupied | Renter-occupied |
| 1-Person Household | 160 (73.1%) | 59 (26.9%) |
| 2-Person Household | 107 (69.5%) | 47 (30.5%) |
| 3-Person Household | 59 (72.8%) | 22 (27.2%) |
| 4+ Person Household | 72 (76.6%) | 22 (23.4%) |
| Total Housing Units | 398 (72.6%) | 150 (27.4%) |
Occupancy by Educational Attainment in Platte
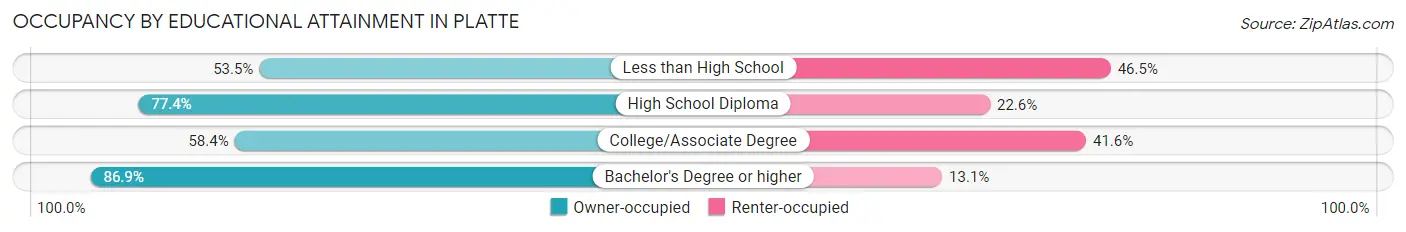
| Household Size | Owner-occupied | Renter-occupied |
| Less than High School | 23 (53.5%) | 20 (46.5%) |
| High School Diploma | 175 (77.4%) | 51 (22.6%) |
| College/Associate Degree | 87 (58.4%) | 62 (41.6%) |
| Bachelor's Degree or higher | 113 (86.9%) | 17 (13.1%) |
Occupancy by Age of Householder in Platte
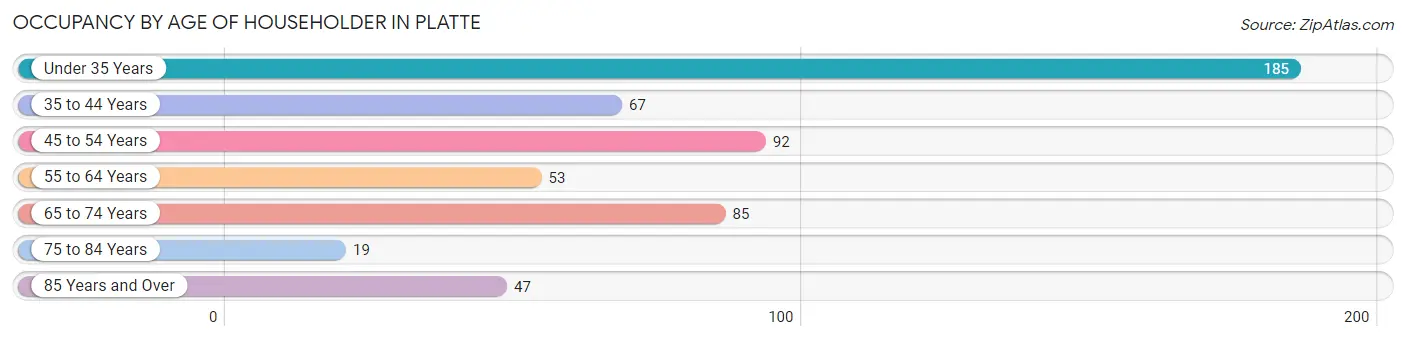
| Age Bracket | # Households | % Households |
| Under 35 Years | 185 | 33.8% |
| 35 to 44 Years | 67 | 12.2% |
| 45 to 54 Years | 92 | 16.8% |
| 55 to 64 Years | 53 | 9.7% |
| 65 to 74 Years | 85 | 15.5% |
| 75 to 84 Years | 19 | 3.5% |
| 85 Years and Over | 47 | 8.6% |
| Total | 548 | 100.0% |
Housing Finances in Platte
Median Income by Occupancy in Platte
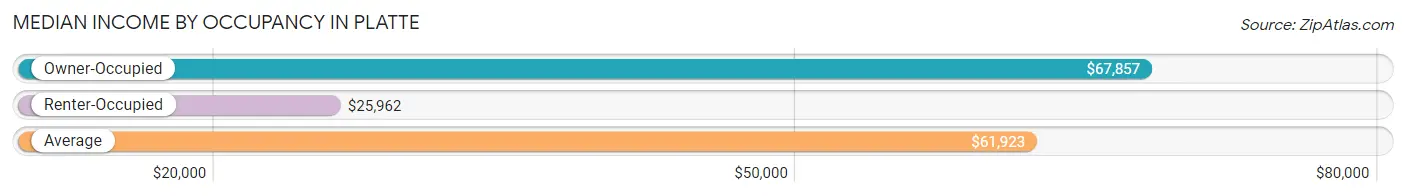
| Occupancy Type | # Households | Median Income |
| Owner-Occupied | 398 (72.6%) | $67,857 |
| Renter-Occupied | 150 (27.4%) | $25,962 |
| Average | 548 (100.0%) | $61,923 |
Occupancy by Householder Income Bracket in Platte
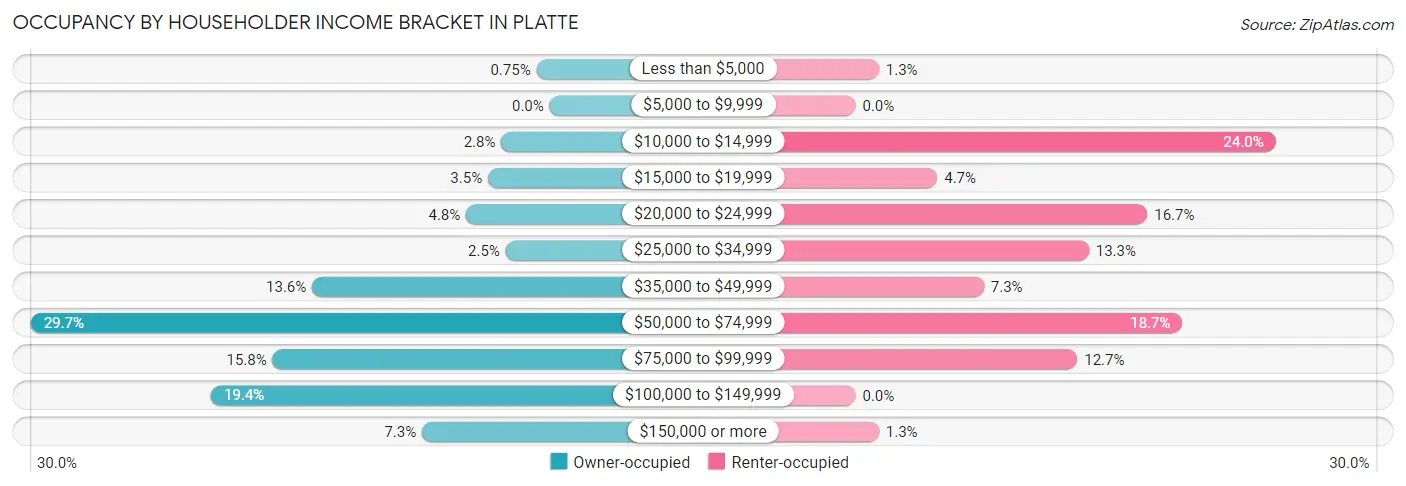
| Income Bracket | Owner-occupied | Renter-occupied |
| Less than $5,000 | 3 (0.7%) | 2 (1.3%) |
| $5,000 to $9,999 | 0 (0.0%) | 0 (0.0%) |
| $10,000 to $14,999 | 11 (2.8%) | 36 (24.0%) |
| $15,000 to $19,999 | 14 (3.5%) | 7 (4.7%) |
| $20,000 to $24,999 | 19 (4.8%) | 25 (16.7%) |
| $25,000 to $34,999 | 10 (2.5%) | 20 (13.3%) |
| $35,000 to $49,999 | 54 (13.6%) | 11 (7.3%) |
| $50,000 to $74,999 | 118 (29.6%) | 28 (18.7%) |
| $75,000 to $99,999 | 63 (15.8%) | 19 (12.7%) |
| $100,000 to $149,999 | 77 (19.4%) | 0 (0.0%) |
| $150,000 or more | 29 (7.3%) | 2 (1.3%) |
| Total | 398 (100.0%) | 150 (100.0%) |
Monthly Housing Cost Tiers in Platte
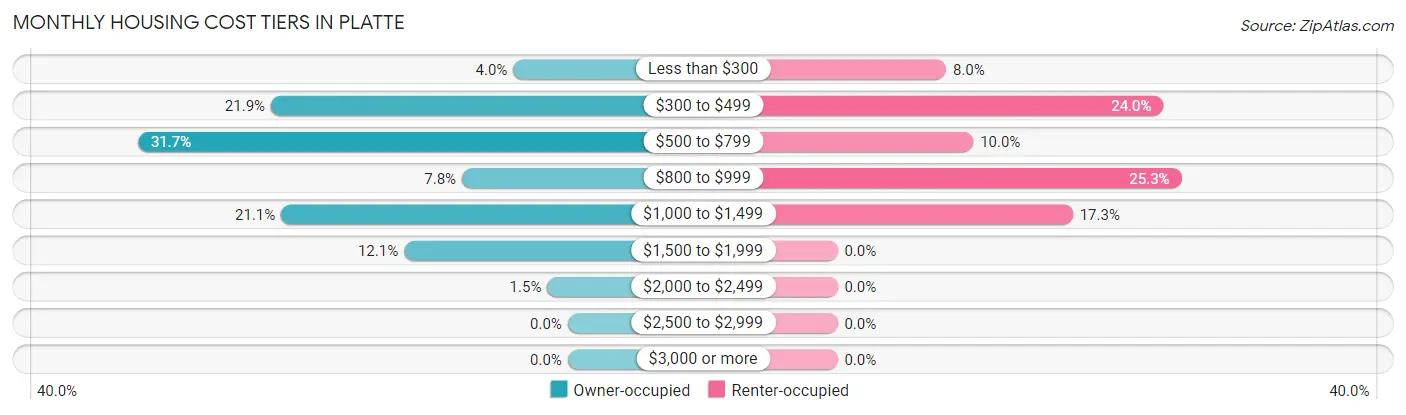
| Monthly Cost | Owner-occupied | Renter-occupied |
| Less than $300 | 16 (4.0%) | 12 (8.0%) |
| $300 to $499 | 87 (21.9%) | 36 (24.0%) |
| $500 to $799 | 126 (31.7%) | 15 (10.0%) |
| $800 to $999 | 31 (7.8%) | 38 (25.3%) |
| $1,000 to $1,499 | 84 (21.1%) | 26 (17.3%) |
| $1,500 to $1,999 | 48 (12.1%) | 0 (0.0%) |
| $2,000 to $2,499 | 6 (1.5%) | 0 (0.0%) |
| $2,500 to $2,999 | 0 (0.0%) | 0 (0.0%) |
| $3,000 or more | 0 (0.0%) | 0 (0.0%) |
| Total | 398 (100.0%) | 150 (100.0%) |
Physical Housing Characteristics in Platte
Housing Structures in Platte
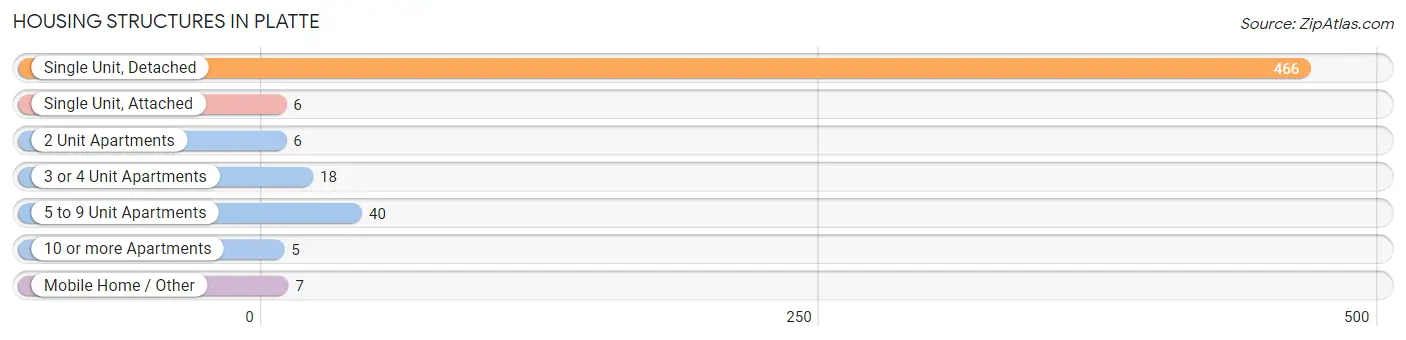
| Structure Type | # Housing Units | % Housing Units |
| Single Unit, Detached | 466 | 85.0% |
| Single Unit, Attached | 6 | 1.1% |
| 2 Unit Apartments | 6 | 1.1% |
| 3 or 4 Unit Apartments | 18 | 3.3% |
| 5 to 9 Unit Apartments | 40 | 7.3% |
| 10 or more Apartments | 5 | 0.9% |
| Mobile Home / Other | 7 | 1.3% |
| Total | 548 | 100.0% |
Housing Structures by Occupancy in Platte
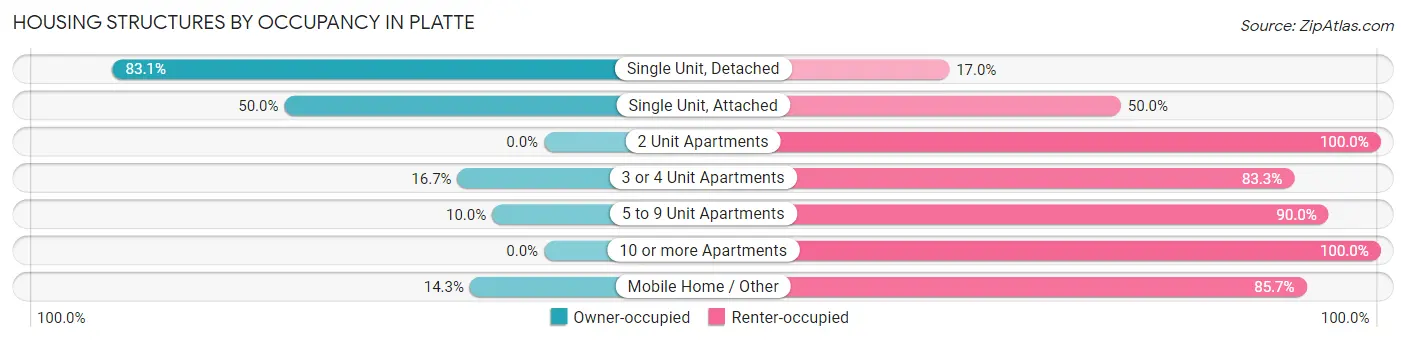
| Structure Type | Owner-occupied | Renter-occupied |
| Single Unit, Detached | 387 (83.1%) | 79 (17.0%) |
| Single Unit, Attached | 3 (50.0%) | 3 (50.0%) |
| 2 Unit Apartments | 0 (0.0%) | 6 (100.0%) |
| 3 or 4 Unit Apartments | 3 (16.7%) | 15 (83.3%) |
| 5 to 9 Unit Apartments | 4 (10.0%) | 36 (90.0%) |
| 10 or more Apartments | 0 (0.0%) | 5 (100.0%) |
| Mobile Home / Other | 1 (14.3%) | 6 (85.7%) |
| Total | 398 (72.6%) | 150 (27.4%) |
Housing Structures by Number of Rooms in Platte
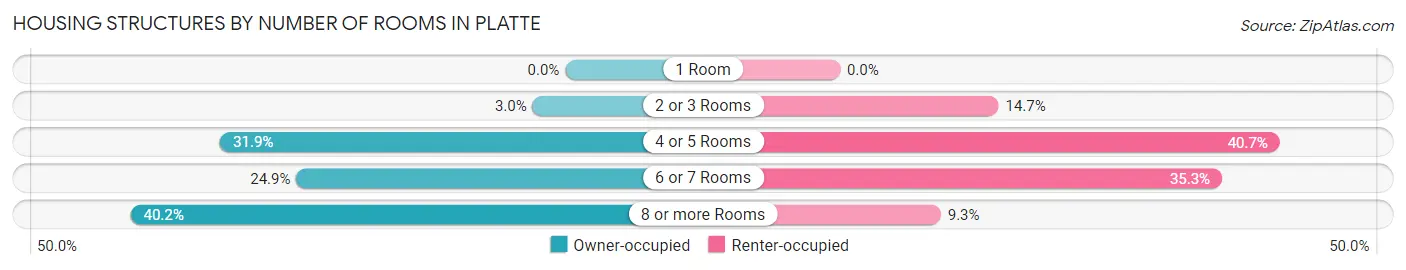
| Number of Rooms | Owner-occupied | Renter-occupied |
| 1 Room | 0 (0.0%) | 0 (0.0%) |
| 2 or 3 Rooms | 12 (3.0%) | 22 (14.7%) |
| 4 or 5 Rooms | 127 (31.9%) | 61 (40.7%) |
| 6 or 7 Rooms | 99 (24.9%) | 53 (35.3%) |
| 8 or more Rooms | 160 (40.2%) | 14 (9.3%) |
| Total | 398 (100.0%) | 150 (100.0%) |
Housing Structure by Heating Type in Platte
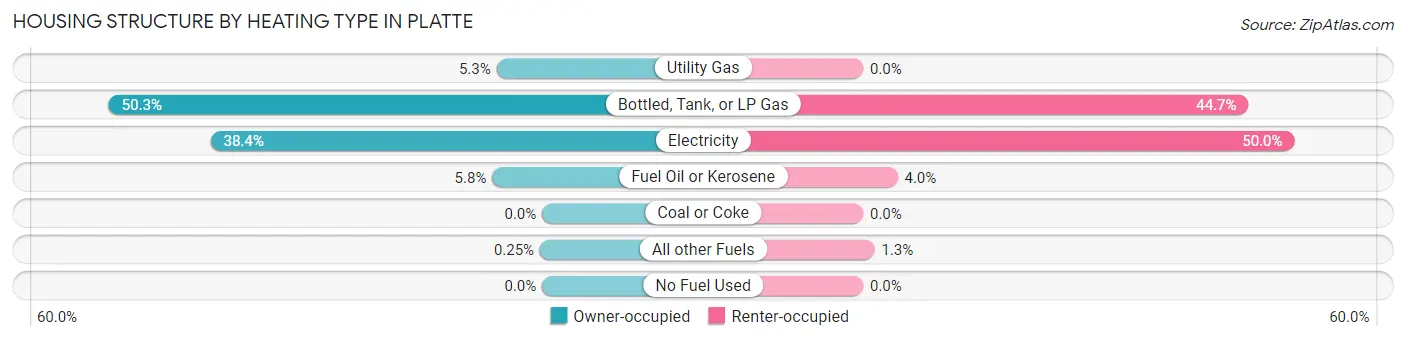
| Heating Type | Owner-occupied | Renter-occupied |
| Utility Gas | 21 (5.3%) | 0 (0.0%) |
| Bottled, Tank, or LP Gas | 200 (50.2%) | 67 (44.7%) |
| Electricity | 153 (38.4%) | 75 (50.0%) |
| Fuel Oil or Kerosene | 23 (5.8%) | 6 (4.0%) |
| Coal or Coke | 0 (0.0%) | 0 (0.0%) |
| All other Fuels | 1 (0.3%) | 2 (1.3%) |
| No Fuel Used | 0 (0.0%) | 0 (0.0%) |
| Total | 398 (100.0%) | 150 (100.0%) |
Household Vehicle Usage in Platte
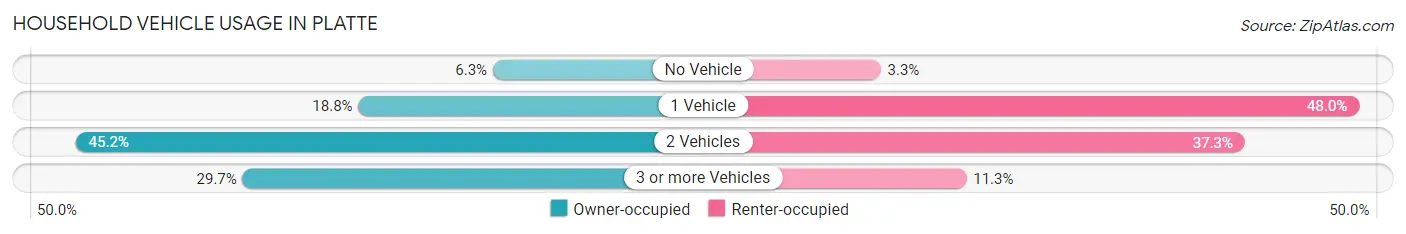
| Vehicles per Household | Owner-occupied | Renter-occupied |
| No Vehicle | 25 (6.3%) | 5 (3.3%) |
| 1 Vehicle | 75 (18.8%) | 72 (48.0%) |
| 2 Vehicles | 180 (45.2%) | 56 (37.3%) |
| 3 or more Vehicles | 118 (29.6%) | 17 (11.3%) |
| Total | 398 (100.0%) | 150 (100.0%) |
Real Estate & Mortgages in Platte
Real Estate and Mortgage Overview in Platte
| Characteristic | Without Mortgage | With Mortgage |
| Housing Units | 212 | 186 |
| Median Property Value | $173,100 | $144,500 |
| Median Household Income | $61,538 | $18 |
| Monthly Housing Costs | $512 | $0 |
| Real Estate Taxes | $1,436 | $17 |
Property Value by Mortgage Status in Platte
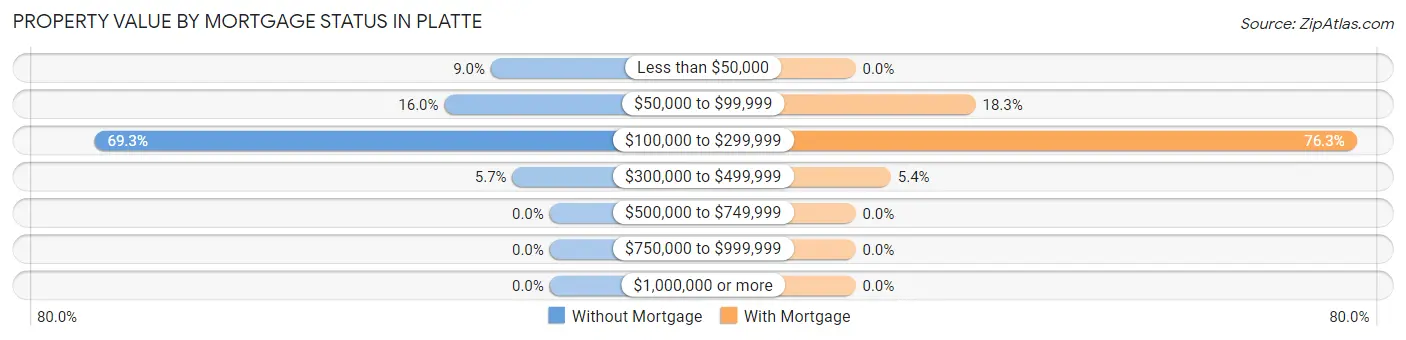
| Property Value | Without Mortgage | With Mortgage |
| Less than $50,000 | 19 (9.0%) | 0 (0.0%) |
| $50,000 to $99,999 | 34 (16.0%) | 34 (18.3%) |
| $100,000 to $299,999 | 147 (69.3%) | 142 (76.3%) |
| $300,000 to $499,999 | 12 (5.7%) | 10 (5.4%) |
| $500,000 to $749,999 | 0 (0.0%) | 0 (0.0%) |
| $750,000 to $999,999 | 0 (0.0%) | 0 (0.0%) |
| $1,000,000 or more | 0 (0.0%) | 0 (0.0%) |
| Total | 212 (100.0%) | 186 (100.0%) |
Household Income by Mortgage Status in Platte
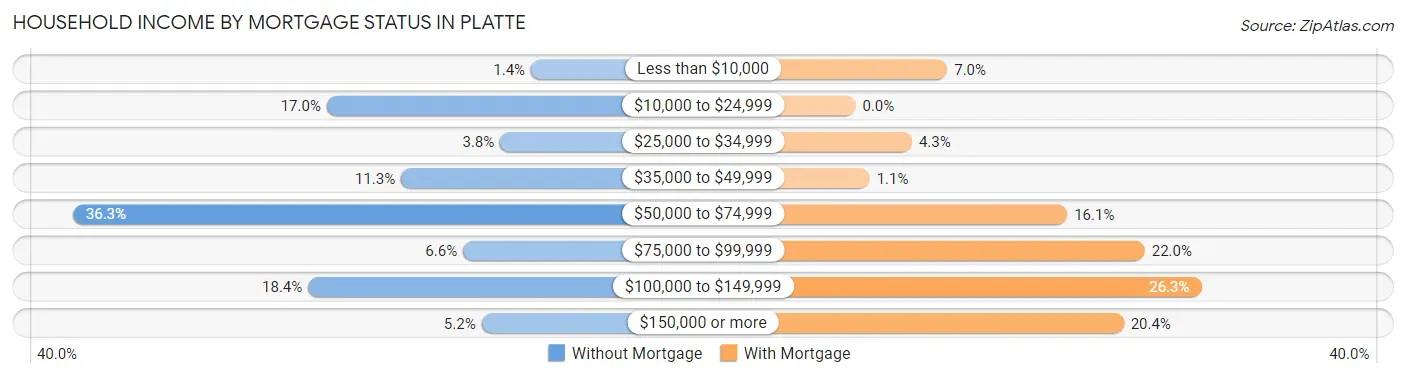
| Household Income | Without Mortgage | With Mortgage |
| Less than $10,000 | 3 (1.4%) | 13 (7.0%) |
| $10,000 to $24,999 | 36 (17.0%) | 0 (0.0%) |
| $25,000 to $34,999 | 8 (3.8%) | 8 (4.3%) |
| $35,000 to $49,999 | 24 (11.3%) | 2 (1.1%) |
| $50,000 to $74,999 | 77 (36.3%) | 30 (16.1%) |
| $75,000 to $99,999 | 14 (6.6%) | 41 (22.0%) |
| $100,000 to $149,999 | 39 (18.4%) | 49 (26.3%) |
| $150,000 or more | 11 (5.2%) | 38 (20.4%) |
| Total | 212 (100.0%) | 186 (100.0%) |
Property Value to Household Income Ratio in Platte
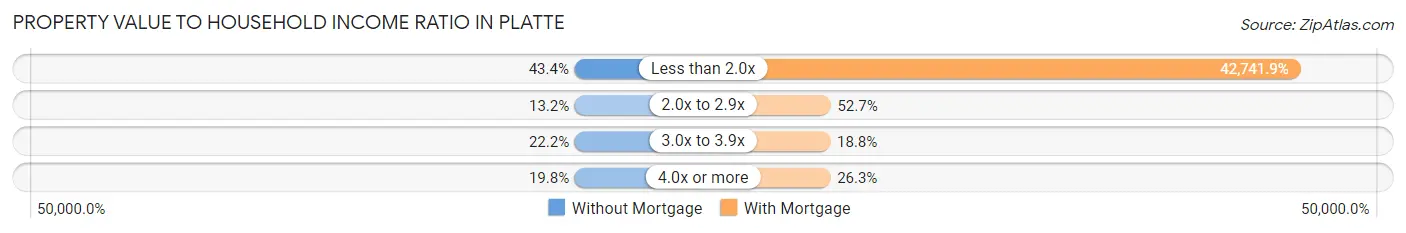
| Value-to-Income Ratio | Without Mortgage | With Mortgage |
| Less than 2.0x | 92 (43.4%) | 79,500 (42,741.9%) |
| 2.0x to 2.9x | 28 (13.2%) | 98 (52.7%) |
| 3.0x to 3.9x | 47 (22.2%) | 35 (18.8%) |
| 4.0x or more | 42 (19.8%) | 49 (26.3%) |
| Total | 212 (100.0%) | 186 (100.0%) |
Real Estate Taxes by Mortgage Status in Platte
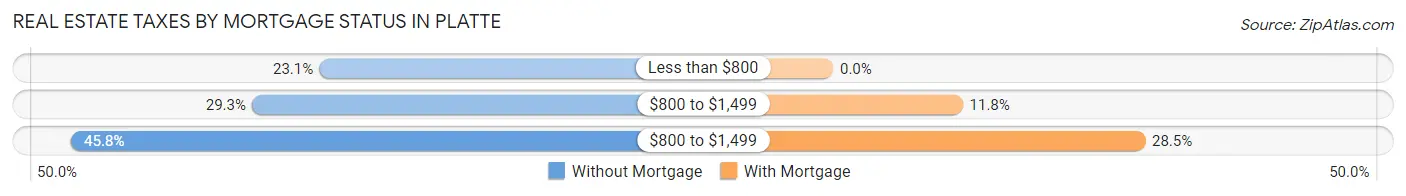
| Property Taxes | Without Mortgage | With Mortgage |
| Less than $800 | 49 (23.1%) | 0 (0.0%) |
| $800 to $1,499 | 62 (29.2%) | 22 (11.8%) |
| $800 to $1,499 | 97 (45.8%) | 53 (28.5%) |
| Total | 212 (100.0%) | 186 (100.0%) |
Health & Disability in Platte
Health Insurance Coverage by Age in Platte
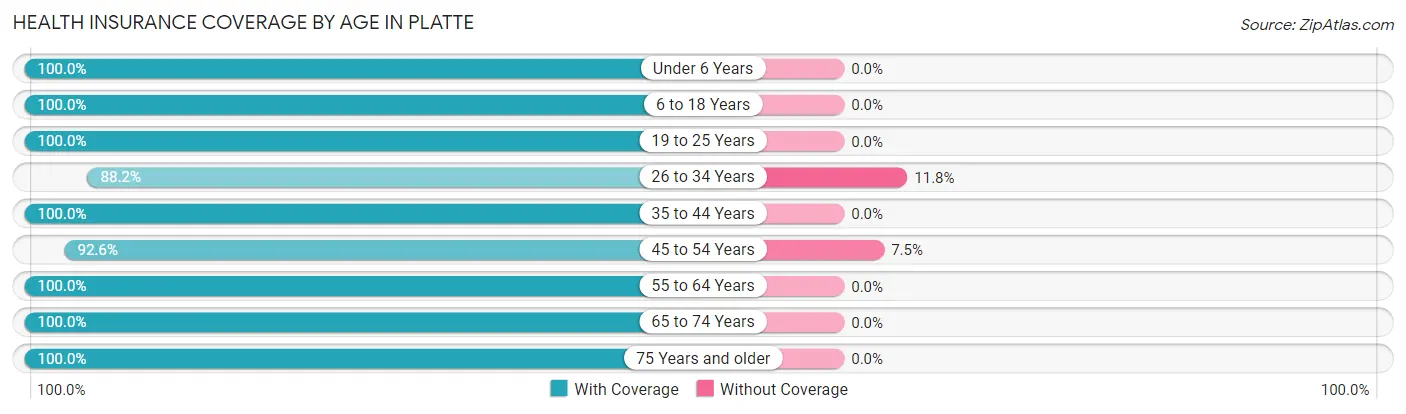
| Age Bracket | With Coverage | Without Coverage |
| Under 6 Years | 137 (100.0%) | 0 (0.0%) |
| 6 to 18 Years | 220 (100.0%) | 0 (0.0%) |
| 19 to 25 Years | 106 (100.0%) | 0 (0.0%) |
| 26 to 34 Years | 180 (88.2%) | 24 (11.8%) |
| 35 to 44 Years | 84 (100.0%) | 0 (0.0%) |
| 45 to 54 Years | 149 (92.5%) | 12 (7.4%) |
| 55 to 64 Years | 91 (100.0%) | 0 (0.0%) |
| 65 to 74 Years | 145 (100.0%) | 0 (0.0%) |
| 75 Years and older | 100 (100.0%) | 0 (0.0%) |
| Total | 1,212 (97.1%) | 36 (2.9%) |
Health Insurance Coverage by Citizenship Status in Platte
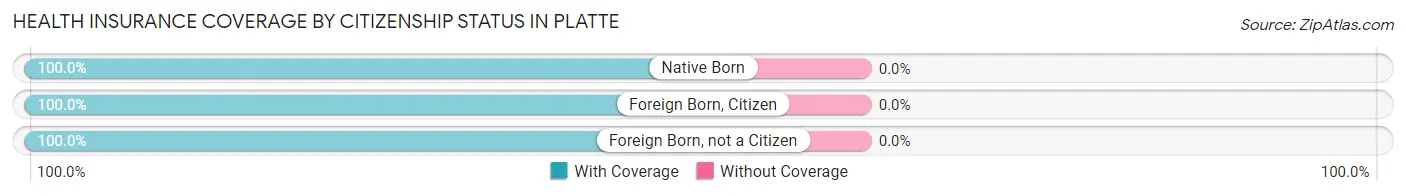
| Citizenship Status | With Coverage | Without Coverage |
| Native Born | 137 (100.0%) | 0 (0.0%) |
| Foreign Born, Citizen | 220 (100.0%) | 0 (0.0%) |
| Foreign Born, not a Citizen | 106 (100.0%) | 0 (0.0%) |
Health Insurance Coverage by Household Income in Platte
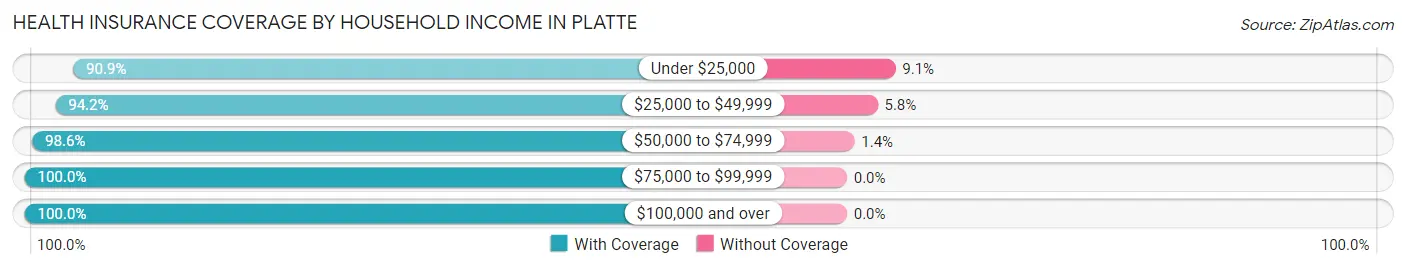
| Household Income | With Coverage | Without Coverage |
| Under $25,000 | 230 (90.9%) | 23 (9.1%) |
| $25,000 to $49,999 | 131 (94.2%) | 8 (5.8%) |
| $50,000 to $74,999 | 348 (98.6%) | 5 (1.4%) |
| $75,000 to $99,999 | 222 (100.0%) | 0 (0.0%) |
| $100,000 and over | 279 (100.0%) | 0 (0.0%) |
Public vs Private Health Insurance Coverage by Age in Platte
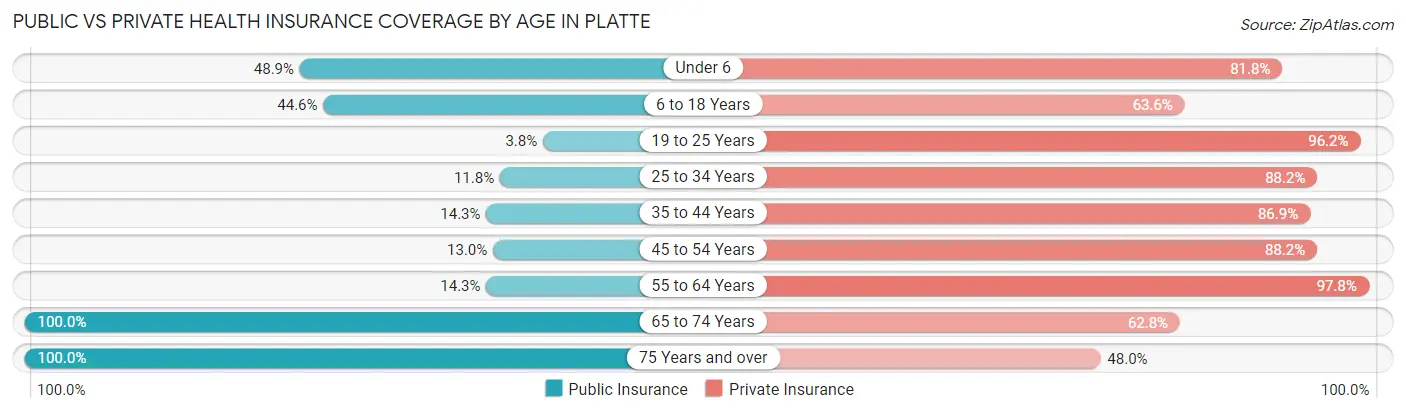
| Age Bracket | Public Insurance | Private Insurance |
| Under 6 | 67 (48.9%) | 112 (81.8%) |
| 6 to 18 Years | 98 (44.6%) | 140 (63.6%) |
| 19 to 25 Years | 4 (3.8%) | 102 (96.2%) |
| 25 to 34 Years | 24 (11.8%) | 180 (88.2%) |
| 35 to 44 Years | 12 (14.3%) | 73 (86.9%) |
| 45 to 54 Years | 21 (13.0%) | 142 (88.2%) |
| 55 to 64 Years | 13 (14.3%) | 89 (97.8%) |
| 65 to 74 Years | 145 (100.0%) | 91 (62.8%) |
| 75 Years and over | 100 (100.0%) | 48 (48.0%) |
| Total | 484 (38.8%) | 977 (78.3%) |
Disability Status by Sex by Age in Platte
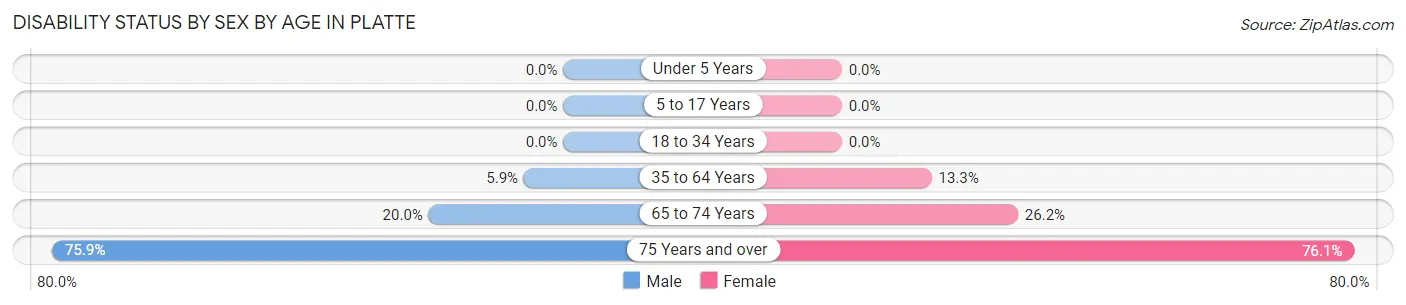
| Age Bracket | Male | Female |
| Under 5 Years | 0 (0.0%) | 0 (0.0%) |
| 5 to 17 Years | 0 (0.0%) | 0 (0.0%) |
| 18 to 34 Years | 0 (0.0%) | 0 (0.0%) |
| 35 to 64 Years | 10 (5.9%) | 22 (13.3%) |
| 65 to 74 Years | 16 (20.0%) | 17 (26.2%) |
| 75 Years and over | 41 (75.9%) | 35 (76.1%) |
Disability Class by Sex by Age in Platte
Disability Class: Hearing Difficulty
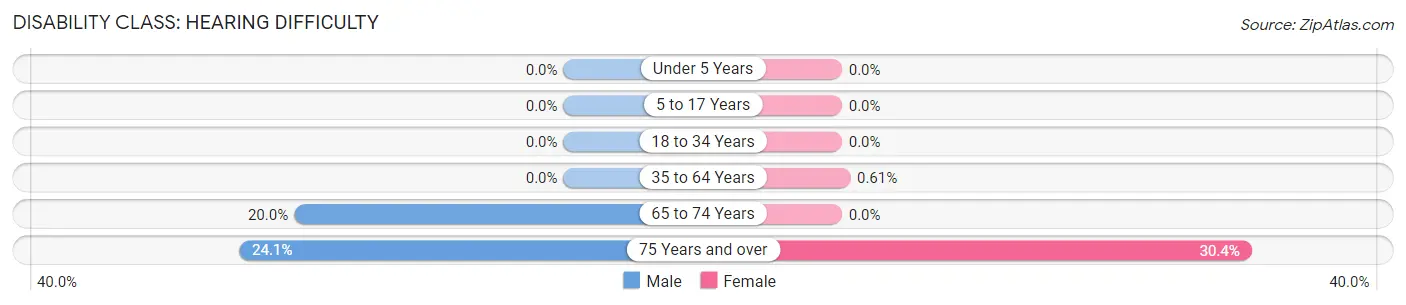
| Age Bracket | Male | Female |
| Under 5 Years | 0 (0.0%) | 0 (0.0%) |
| 5 to 17 Years | 0 (0.0%) | 0 (0.0%) |
| 18 to 34 Years | 0 (0.0%) | 0 (0.0%) |
| 35 to 64 Years | 0 (0.0%) | 1 (0.6%) |
| 65 to 74 Years | 16 (20.0%) | 0 (0.0%) |
| 75 Years and over | 13 (24.1%) | 14 (30.4%) |
Disability Class: Vision Difficulty
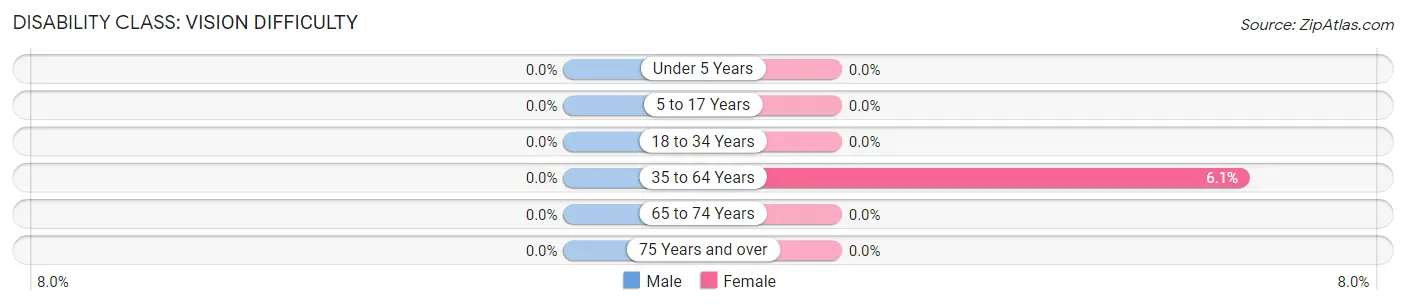
| Age Bracket | Male | Female |
| Under 5 Years | 0 (0.0%) | 0 (0.0%) |
| 5 to 17 Years | 0 (0.0%) | 0 (0.0%) |
| 18 to 34 Years | 0 (0.0%) | 0 (0.0%) |
| 35 to 64 Years | 0 (0.0%) | 10 (6.1%) |
| 65 to 74 Years | 0 (0.0%) | 0 (0.0%) |
| 75 Years and over | 0 (0.0%) | 0 (0.0%) |
Disability Class: Cognitive Difficulty
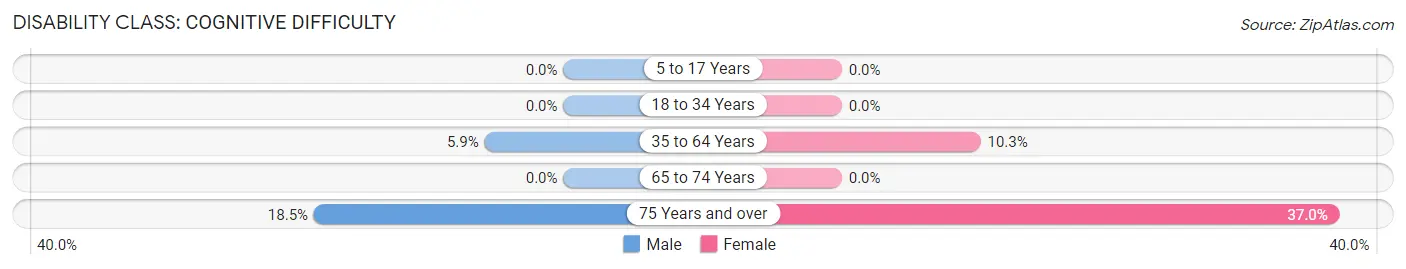
| Age Bracket | Male | Female |
| 5 to 17 Years | 0 (0.0%) | 0 (0.0%) |
| 18 to 34 Years | 0 (0.0%) | 0 (0.0%) |
| 35 to 64 Years | 10 (5.9%) | 17 (10.3%) |
| 65 to 74 Years | 0 (0.0%) | 0 (0.0%) |
| 75 Years and over | 10 (18.5%) | 17 (37.0%) |
Disability Class: Ambulatory Difficulty
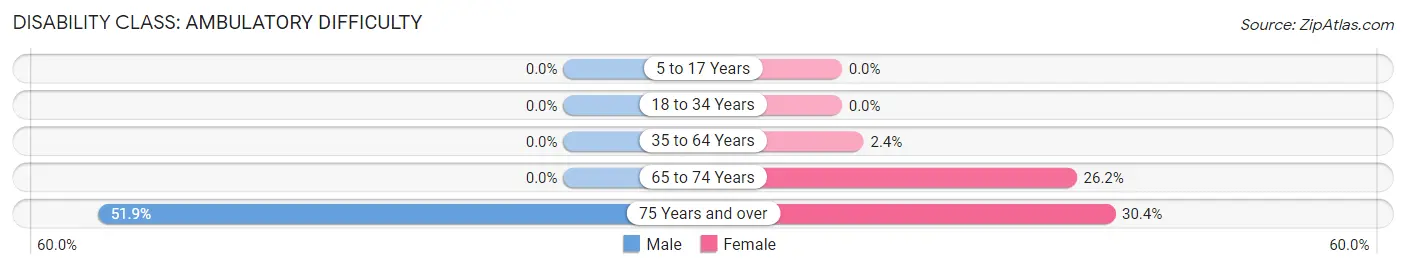
| Age Bracket | Male | Female |
| 5 to 17 Years | 0 (0.0%) | 0 (0.0%) |
| 18 to 34 Years | 0 (0.0%) | 0 (0.0%) |
| 35 to 64 Years | 0 (0.0%) | 4 (2.4%) |
| 65 to 74 Years | 0 (0.0%) | 17 (26.2%) |
| 75 Years and over | 28 (51.8%) | 14 (30.4%) |
Disability Class: Self-Care Difficulty
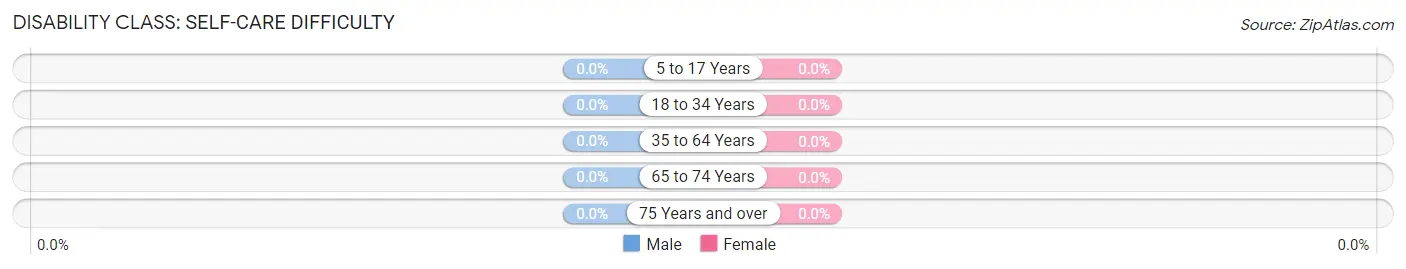
| Age Bracket | Male | Female |
| 5 to 17 Years | 0 (0.0%) | 0 (0.0%) |
| 18 to 34 Years | 0 (0.0%) | 0 (0.0%) |
| 35 to 64 Years | 0 (0.0%) | 0 (0.0%) |
| 65 to 74 Years | 0 (0.0%) | 0 (0.0%) |
| 75 Years and over | 0 (0.0%) | 0 (0.0%) |
Technology Access in Platte
Computing Device Access in Platte
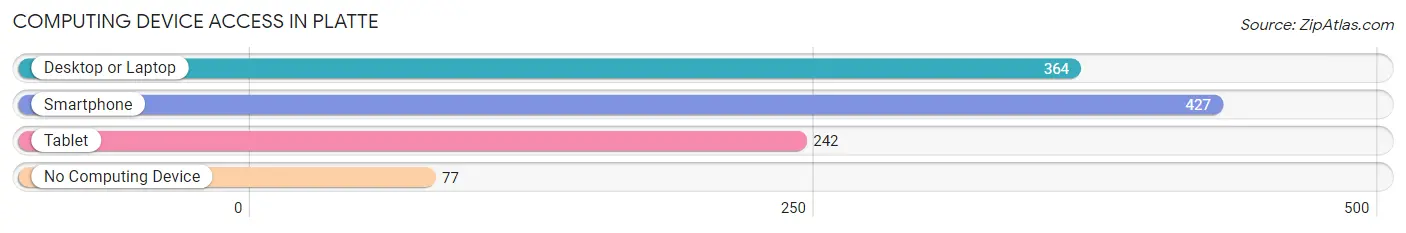
| Device Type | # Households | % Households |
| Desktop or Laptop | 364 | 66.4% |
| Smartphone | 427 | 77.9% |
| Tablet | 242 | 44.2% |
| No Computing Device | 77 | 14.1% |
| Total | 548 | 100.0% |
Internet Access in Platte
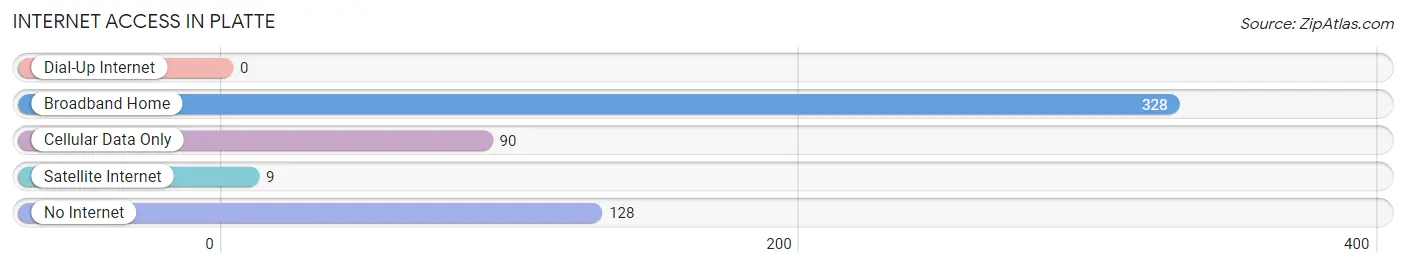
| Internet Type | # Households | % Households |
| Dial-Up Internet | 0 | 0.0% |
| Broadband Home | 328 | 59.9% |
| Cellular Data Only | 90 | 16.4% |
| Satellite Internet | 9 | 1.6% |
| No Internet | 128 | 23.4% |
| Total | 548 | 100.0% |
Platte Summary
Platte, South Dakota is a small town located in Charles Mix County in the southeastern corner of the state. It is situated along the Missouri River, and is the county seat of Charles Mix County. The town was founded in 1881 and has a population of approximately 1,000 people.
Geography
Platte is located in the southeastern corner of South Dakota, in Charles Mix County. It is situated along the Missouri River, and is the county seat of Charles Mix County. The town is located at an elevation of 1,845 feet (562 meters) above sea level. The town is located in the Central Plains region of the United States, and is part of the Great Plains region. The town is located in the Central Time Zone.
The town is located in a semi-arid climate, with hot summers and cold winters. The average annual temperature is 48.3°F (9.1°C). The average annual precipitation is 20.3 inches (51.6 cm).
Economy
The economy of Platte is largely based on agriculture. The town is home to several large farms, as well as a number of smaller farms. The town is also home to a number of businesses, including a grocery store, a hardware store, a bank, and a few restaurants.
The town is also home to a number of manufacturing companies, including a plastics manufacturer, a metal fabrication company, and a printing company. The town is also home to a number of service-based businesses, including a number of auto repair shops, a number of beauty salons, and a number of medical offices.
Demographics
As of the 2010 census, the population of Platte was 1,000 people. The racial makeup of the town was 97.2% White, 0.7% African American, 0.3% Native American, 0.2% Asian, 0.1% Pacific Islander, 0.2% from other races, and 1.3% from two or more races. Hispanic or Latino of any race were 1.3% of the population.
The median income for a household in Platte was $37,500, and the median income for a family was $45,000. The per capita income for the town was $18,000. About 10.2% of families and 12.3% of the population were below the poverty line, including 16.7% of those under age 18 and 8.3% of those age 65 or over.
History
Platte was founded in 1881, when the town was platted by the Platte Land Company. The town was named after the Platte River, which runs through the area. The town was incorporated in 1883, and the first post office was established in 1884.
The town was a major stop on the Chicago, Milwaukee, St. Paul and Pacific Railroad, which ran through the town from 1883 to 1980. The railroad was a major source of employment for the town, and it was also a major source of transportation for the town.
The town was also home to a number of businesses, including a number of hotels, a number of saloons, and a number of stores. The town was also home to a number of churches, including the First Presbyterian Church, which was founded in 1883.
The town was also home to a number of schools, including the Platte High School, which was founded in 1884. The school was closed in 1971, and the building is now used as a community center.
The town was also home to a number of fraternal organizations, including the Knights of Pythias, which was founded in 1885. The organization was active in the town until the early 1900s.
The town was also home to a number of newspapers, including the Platte County News, which was founded in 1887. The newspaper is still published today.
The town was also home to a number of cultural events, including the Platte County Fair, which was founded in 1891. The fair is still held every year.
The town was also home to a number of military units, including the Platte County National Guard, which was founded in 1894. The unit was active until the early 2000s.
The town was also home to a number of businesses, including a number of banks, a number of hotels, a number of restaurants, and a number of stores. The town was also home to a number of manufacturing companies, including a plastics manufacturer, a metal fabrication company, and a printing company.
The town was also home to a number of service-based businesses, including a number of auto repair shops, a number of beauty salons, and a number of medical offices. The town was also home to a number of churches, including the First Presbyterian Church, which was founded in 1883.
The town was also home to a number of fraternal organizations, including the Knights of Pythias, which was founded in 1885. The organization was active in the town until the early 1900s.
The town was also home to a number of newspapers, including the Platte County News, which was founded in 1887. The newspaper is still published today.
The town was also home to a number of cultural events, including the Platte County Fair, which was founded in 1891. The fair is still held every year.
The town was also home to a number of military units, including the Platte County National Guard, which was founded in 1894. The unit was active until the early 2000s.
Common Questions
What is Per Capita Income in Platte?
Per Capita income in Platte is $32,812.
What is the Median Family Income in Platte?
Median Family Income in Platte is $71,548.
What is the Median Household income in Platte?
Median Household Income in Platte is $61,923.
What is Income or Wage Gap in Platte?
Income or Wage Gap in Platte is 43.1%.
Women in Platte earn 56.9 cents for every dollar earned by a man.
What is Inequality or Gini Index in Platte?
Inequality or Gini Index in Platte is 0.39.
What is the Total Population of Platte?
Total Population of Platte is 1,299.
What is the Total Male Population of Platte?
Total Male Population of Platte is 674.
What is the Total Female Population of Platte?
Total Female Population of Platte is 625.
What is the Ratio of Males per 100 Females in Platte?
There are 107.84 Males per 100 Females in Platte.
What is the Ratio of Females per 100 Males in Platte?
There are 92.73 Females per 100 Males in Platte.
What is the Median Population Age in Platte?
Median Population Age in Platte is 33.9 Years.
What is the Average Family Size in Platte
Average Family Size in Platte is 3.1 People.
What is the Average Household Size in Platte
Average Household Size in Platte is 2.3 People.
How Large is the Labor Force in Platte?
There are 700 People in the Labor Forcein in Platte.
What is the Percentage of People in the Labor Force in Platte?
70.1% of People are in the Labor Force in Platte.
What is the Unemployment Rate in Platte?
Unemployment Rate in Platte is 0.7%.