Zip Codes with the Highest Percentage of Population Employed in Computer & Mathematics in South Dakota
RELATED REPORTS & OPTIONS
Computer & Mathematics
South Dakota
Compare Zip Codes
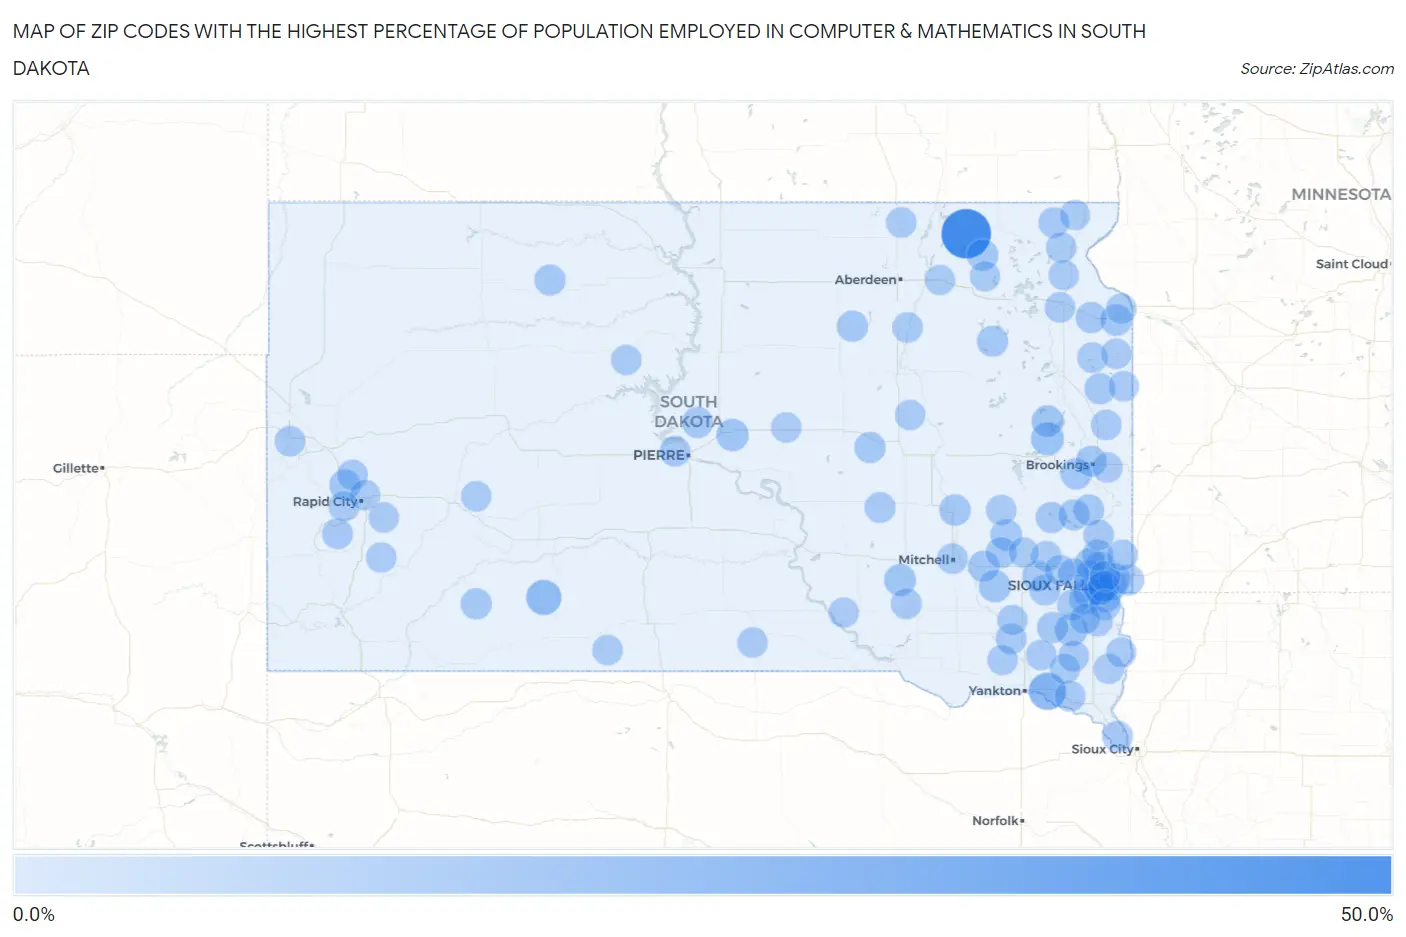
Map of Zip Codes with the Highest Percentage of Population Employed in Computer & Mathematics in South Dakota
0.0%
50.0%
Zip Codes with the Highest Percentage of Population Employed in Computer & Mathematics in South Dakota
| Zip Code | % Employed | vs State | vs National | |
| 1. | 57421 | 50.0% | 2.0%(+48.0)#1 | 3.5%(+46.5)#15 |
| 2. | 57031 | 18.5% | 2.0%(+16.5)#2 | 3.5%(+14.9)#164 |
| 3. | 57577 | 13.2% | 2.0%(+11.2)#3 | 3.5%(+9.69)#349 |
| 4. | 57214 | 7.7% | 2.0%(+5.68)#4 | 3.5%(+4.17)#1,321 |
| 5. | 57021 | 6.9% | 2.0%(+4.86)#5 | 3.5%(+3.35)#1,698 |
| 6. | 57522 | 6.2% | 2.0%(+4.22)#6 | 3.5%(+2.71)#2,124 |
| 7. | 57332 | 5.6% | 2.0%(+3.58)#7 | 3.5%(+2.07)#2,679 |
| 8. | 57375 | 5.0% | 2.0%(+2.94)#8 | 3.5%(+1.43)#3,422 |
| 9. | 57248 | 4.8% | 2.0%(+2.77)#9 | 3.5%(+1.26)#3,667 |
| 10. | 57108 | 4.7% | 2.0%(+2.67)#10 | 3.5%(+1.16)#3,811 |
| 11. | 57454 | 4.5% | 2.0%(+2.52)#11 | 3.5%(+1.01)#4,029 |
| 12. | 57321 | 4.3% | 2.0%(+2.24)#12 | 3.5%(+0.731)#4,505 |
| 13. | 57105 | 4.2% | 2.0%(+2.22)#13 | 3.5%(+0.711)#4,544 |
| 14. | 57055 | 4.2% | 2.0%(+2.20)#14 | 3.5%(+0.688)#4,590 |
| 15. | 57107 | 4.1% | 2.0%(+2.11)#15 | 3.5%(+0.595)#4,774 |
| 16. | 57252 | 4.0% | 2.0%(+1.99)#16 | 3.5%(+0.484)#5,019 |
| 17. | 57071 | 3.9% | 2.0%(+1.87)#17 | 3.5%(+0.354)#5,288 |
| 18. | 57311 | 3.9% | 2.0%(+1.86)#18 | 3.5%(+0.350)#5,300 |
| 19. | 57197 | 3.8% | 2.0%(+1.82)#19 | 3.5%(+0.312)#5,389 |
| 20. | 57314 | 3.8% | 2.0%(+1.82)#20 | 3.5%(+0.312)#5,390 |
| 21. | 57718 | 3.7% | 2.0%(+1.71)#21 | 3.5%(+0.203)#5,650 |
| 22. | 57110 | 3.7% | 2.0%(+1.69)#22 | 3.5%(+0.181)#5,710 |
| 23. | 57064 | 3.6% | 2.0%(+1.60)#23 | 3.5%(+0.086)#5,938 |
| 24. | 57501 | 3.5% | 2.0%(+1.44)#24 | 3.5%(-0.071)#6,328 |
| 25. | 57435 | 3.4% | 2.0%(+1.43)#25 | 3.5%(-0.076)#6,352 |
| 26. | 57381 | 3.4% | 2.0%(+1.40)#26 | 3.5%(-0.106)#6,429 |
| 27. | 57106 | 3.4% | 2.0%(+1.38)#27 | 3.5%(-0.128)#6,492 |
| 28. | 57269 | 3.4% | 2.0%(+1.38)#28 | 3.5%(-0.135)#6,511 |
| 29. | 57005 | 3.4% | 2.0%(+1.37)#29 | 3.5%(-0.144)#6,543 |
| 30. | 57217 | 3.3% | 2.0%(+1.25)#30 | 3.5%(-0.264)#6,908 |
| 31. | 57752 | 3.2% | 2.0%(+1.23)#31 | 3.5%(-0.279)#6,958 |
| 32. | 57020 | 3.2% | 2.0%(+1.15)#32 | 3.5%(-0.364)#7,224 |
| 33. | 57633 | 3.2% | 2.0%(+1.14)#33 | 3.5%(-0.371)#7,250 |
| 34. | 57374 | 3.1% | 2.0%(+1.14)#34 | 3.5%(-0.375)#7,263 |
| 35. | 57036 | 3.1% | 2.0%(+1.12)#35 | 3.5%(-0.390)#7,310 |
| 36. | 57042 | 3.1% | 2.0%(+1.11)#36 | 3.5%(-0.400)#7,339 |
| 37. | 57033 | 3.1% | 2.0%(+1.09)#37 | 3.5%(-0.417)#7,387 |
| 38. | 57226 | 3.1% | 2.0%(+1.07)#38 | 3.5%(-0.437)#7,442 |
| 39. | 57006 | 3.0% | 2.0%(+0.972)#39 | 3.5%(-0.539)#7,797 |
| 40. | 57075 | 3.0% | 2.0%(+0.964)#40 | 3.5%(-0.547)#7,819 |
| 41. | 57103 | 2.9% | 2.0%(+0.899)#41 | 3.5%(-0.612)#8,057 |
| 42. | 57017 | 2.9% | 2.0%(+0.851)#42 | 3.5%(-0.659)#8,232 |
| 43. | 57047 | 2.8% | 2.0%(+0.764)#43 | 3.5%(-0.747)#8,534 |
| 44. | 57003 | 2.7% | 2.0%(+0.701)#44 | 3.5%(-0.810)#8,768 |
| 45. | 57068 | 2.7% | 2.0%(+0.667)#45 | 3.5%(-0.843)#8,914 |
| 46. | 57382 | 2.7% | 2.0%(+0.644)#46 | 3.5%(-0.867)#8,995 |
| 47. | 57069 | 2.6% | 2.0%(+0.608)#47 | 3.5%(-0.902)#9,137 |
| 48. | 57104 | 2.6% | 2.0%(+0.542)#48 | 3.5%(-0.968)#9,400 |
| 49. | 57769 | 2.5% | 2.0%(+0.456)#49 | 3.5%(-1.05)#9,767 |
| 50. | 57038 | 2.5% | 2.0%(+0.444)#50 | 3.5%(-1.07)#9,810 |
| 51. | 57328 | 2.4% | 2.0%(+0.425)#51 | 3.5%(-1.09)#9,882 |
| 52. | 57030 | 2.4% | 2.0%(+0.390)#52 | 3.5%(-1.12)#10,016 |
| 53. | 57015 | 2.3% | 2.0%(+0.280)#53 | 3.5%(-1.23)#10,486 |
| 54. | 57751 | 2.2% | 2.0%(+0.229)#54 | 3.5%(-1.28)#10,703 |
| 55. | 57012 | 2.2% | 2.0%(+0.212)#55 | 3.5%(-1.30)#10,775 |
| 56. | 57014 | 2.2% | 2.0%(+0.190)#56 | 3.5%(-1.32)#10,868 |
| 57. | 57032 | 2.2% | 2.0%(+0.140)#57 | 3.5%(-1.37)#11,093 |
| 58. | 57045 | 2.1% | 2.0%(+0.050)#58 | 3.5%(-1.46)#11,511 |
| 59. | 57022 | 2.0% | 2.0%(+0.009)#59 | 3.5%(-1.50)#11,704 |
| 60. | 57461 | 2.0% | 2.0%(-0.000)#60 | 3.5%(-1.51)#11,744 |
| 61. | 57532 | 2.0% | 2.0%(-0.037)#61 | 3.5%(-1.55)#11,913 |
| 62. | 57224 | 2.0% | 2.0%(-0.053)#62 | 3.5%(-1.56)#11,994 |
| 63. | 57301 | 1.9% | 2.0%(-0.121)#63 | 3.5%(-1.63)#12,334 |
| 64. | 57441 | 1.9% | 2.0%(-0.148)#64 | 3.5%(-1.66)#12,463 |
| 65. | 57265 | 1.9% | 2.0%(-0.162)#65 | 3.5%(-1.67)#12,519 |
| 66. | 57790 | 1.8% | 2.0%(-0.208)#66 | 3.5%(-1.72)#12,731 |
| 67. | 57266 | 1.8% | 2.0%(-0.209)#67 | 3.5%(-1.72)#12,737 |
| 68. | 57262 | 1.8% | 2.0%(-0.244)#68 | 3.5%(-1.75)#12,883 |
| 69. | 57783 | 1.8% | 2.0%(-0.247)#69 | 3.5%(-1.76)#12,896 |
| 70. | 57037 | 1.8% | 2.0%(-0.253)#70 | 3.5%(-1.76)#12,917 |
| 71. | 57268 | 1.7% | 2.0%(-0.266)#71 | 3.5%(-1.78)#12,981 |
| 72. | 57216 | 1.7% | 2.0%(-0.277)#72 | 3.5%(-1.79)#13,051 |
| 73. | 57259 | 1.7% | 2.0%(-0.290)#73 | 3.5%(-1.80)#13,112 |
| 74. | 57237 | 1.7% | 2.0%(-0.307)#74 | 3.5%(-1.82)#13,211 |
| 75. | 57701 | 1.7% | 2.0%(-0.316)#75 | 3.5%(-1.83)#13,263 |
| 76. | 57349 | 1.7% | 2.0%(-0.319)#76 | 3.5%(-1.83)#13,275 |
| 77. | 57040 | 1.6% | 2.0%(-0.366)#77 | 3.5%(-1.88)#13,529 |
| 78. | 57528 | 1.6% | 2.0%(-0.379)#78 | 3.5%(-1.89)#13,610 |
| 79. | 57077 | 1.6% | 2.0%(-0.383)#79 | 3.5%(-1.89)#13,635 |
| 80. | 57048 | 1.6% | 2.0%(-0.386)#80 | 3.5%(-1.90)#13,654 |
| 81. | 57002 | 1.6% | 2.0%(-0.422)#81 | 3.5%(-1.93)#13,847 |
| 82. | 57572 | 1.6% | 2.0%(-0.456)#82 | 3.5%(-1.97)#14,038 |
| 83. | 57035 | 1.5% | 2.0%(-0.467)#83 | 3.5%(-1.98)#14,106 |
| 84. | 57348 | 1.5% | 2.0%(-0.539)#84 | 3.5%(-2.05)#14,528 |
| 85. | 57039 | 1.4% | 2.0%(-0.571)#85 | 3.5%(-2.08)#14,708 |
| 86. | 57445 | 1.4% | 2.0%(-0.581)#86 | 3.5%(-2.09)#14,754 |
| 87. | 57468 | 1.4% | 2.0%(-0.585)#87 | 3.5%(-2.10)#14,785 |
| 88. | 57345 | 1.4% | 2.0%(-0.588)#88 | 3.5%(-2.10)#14,799 |
| 89. | 57029 | 1.4% | 2.0%(-0.613)#89 | 3.5%(-2.12)#14,953 |
| 90. | 57703 | 1.4% | 2.0%(-0.648)#90 | 3.5%(-2.16)#15,144 |
| 91. | 57744 | 1.3% | 2.0%(-0.665)#91 | 3.5%(-2.18)#15,236 |
| 92. | 57257 | 1.3% | 2.0%(-0.675)#92 | 3.5%(-2.19)#15,297 |
| 93. | 57073 | 1.3% | 2.0%(-0.686)#93 | 3.5%(-2.20)#15,360 |
| 94. | 57625 | 1.3% | 2.0%(-0.688)#94 | 3.5%(-2.20)#15,371 |
| 95. | 57001 | 1.3% | 2.0%(-0.693)#95 | 3.5%(-2.20)#15,408 |
| 96. | 57058 | 1.3% | 2.0%(-0.698)#96 | 3.5%(-2.21)#15,438 |
| 97. | 57702 | 1.3% | 2.0%(-0.703)#97 | 3.5%(-2.21)#15,459 |
| 98. | 57255 | 1.3% | 2.0%(-0.715)#98 | 3.5%(-2.23)#15,529 |
| 99. | 57034 | 1.3% | 2.0%(-0.748)#99 | 3.5%(-2.26)#15,738 |
| 100. | 57369 | 1.3% | 2.0%(-0.763)#100 | 3.5%(-2.27)#15,817 |
Common Questions
What are the Top 10 Zip Codes with the Highest Percentage of Population Employed in Computer & Mathematics in South Dakota?
Top 10 Zip Codes with the Highest Percentage of Population Employed in Computer & Mathematics in South Dakota are:
What zip code has the Highest Percentage of Population Employed in Computer & Mathematics in South Dakota?
57421 has the Highest Percentage of Population Employed in Computer & Mathematics in South Dakota with 50.0%.
What is the Percentage of Population Employed in Computer & Mathematics in the State of South Dakota?
Percentage of Population Employed in Computer & Mathematics in South Dakota is 2.0%.
What is the Percentage of Population Employed in Computer & Mathematics in the United States?
Percentage of Population Employed in Computer & Mathematics in the United States is 3.5%.