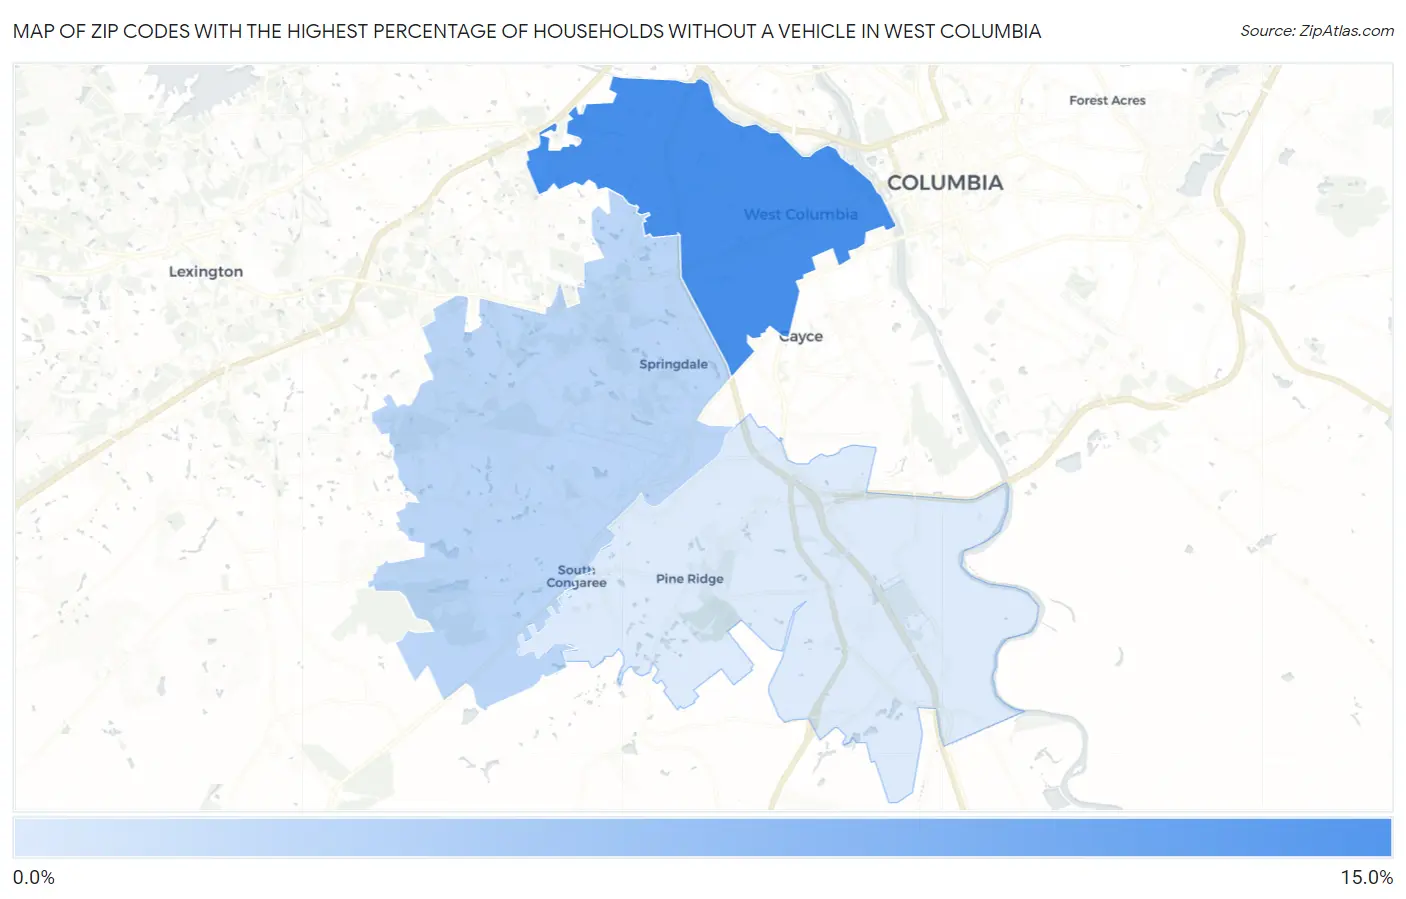
Zip Codes with the Highest Percentage of Households Without a Vehicle in West Columbia, SC
RELATED REPORTS & OPTIONS
Households without a Cars
West Columbia
Compare Zip Codes
Map of Zip Codes with the Highest Percentage of Households Without a Vehicle in West Columbia
3.3%
10.1%
Zip Codes with the Highest Percentage of Households Without a Vehicle in West Columbia, SC
| Zip Code | Housholds Without a Car | vs State | vs National | |
| 1. | 29169 | 10.1% | 5.7%(+4.40)#77 | 8.3%(+1.80)#4,782 |
| 2. | 29170 | 4.8% | 5.7%(-0.900)#213 | 8.3%(-3.50)#13,387 |
| 3. | 29172 | 3.3% | 5.7%(-2.40)#279 | 8.3%(-5.00)#18,077 |
1
Common Questions
What are the Top Zip Codes with the Highest Percentage of Households Without a Vehicle in West Columbia, SC?
Top Zip Codes with the Highest Percentage of Households Without a Vehicle in West Columbia, SC are:
What zip code has the Highest Percentage of Households Without a Vehicle in West Columbia, SC?
29169 has the Highest Percentage of Households Without a Vehicle in West Columbia, SC with 10.1%.
What is the Percentage of Households Without a Vehicle in West Columbia, SC?
Percentage of Households Without a Vehicle in West Columbia is 8.7%.
What is the Percentage of Households Without a Vehicle in South Carolina?
Percentage of Households Without a Vehicle in South Carolina is 5.7%.
What is the Percentage of Households Without a Vehicle in the United States?
Percentage of Households Without a Vehicle in the United States is 8.3%.