Zip Codes with the Highest Percentage of Population Employed in Community & Social Service in Seneca, SC
RELATED REPORTS & OPTIONS
Community & Social Service
Seneca
Compare Zip Codes
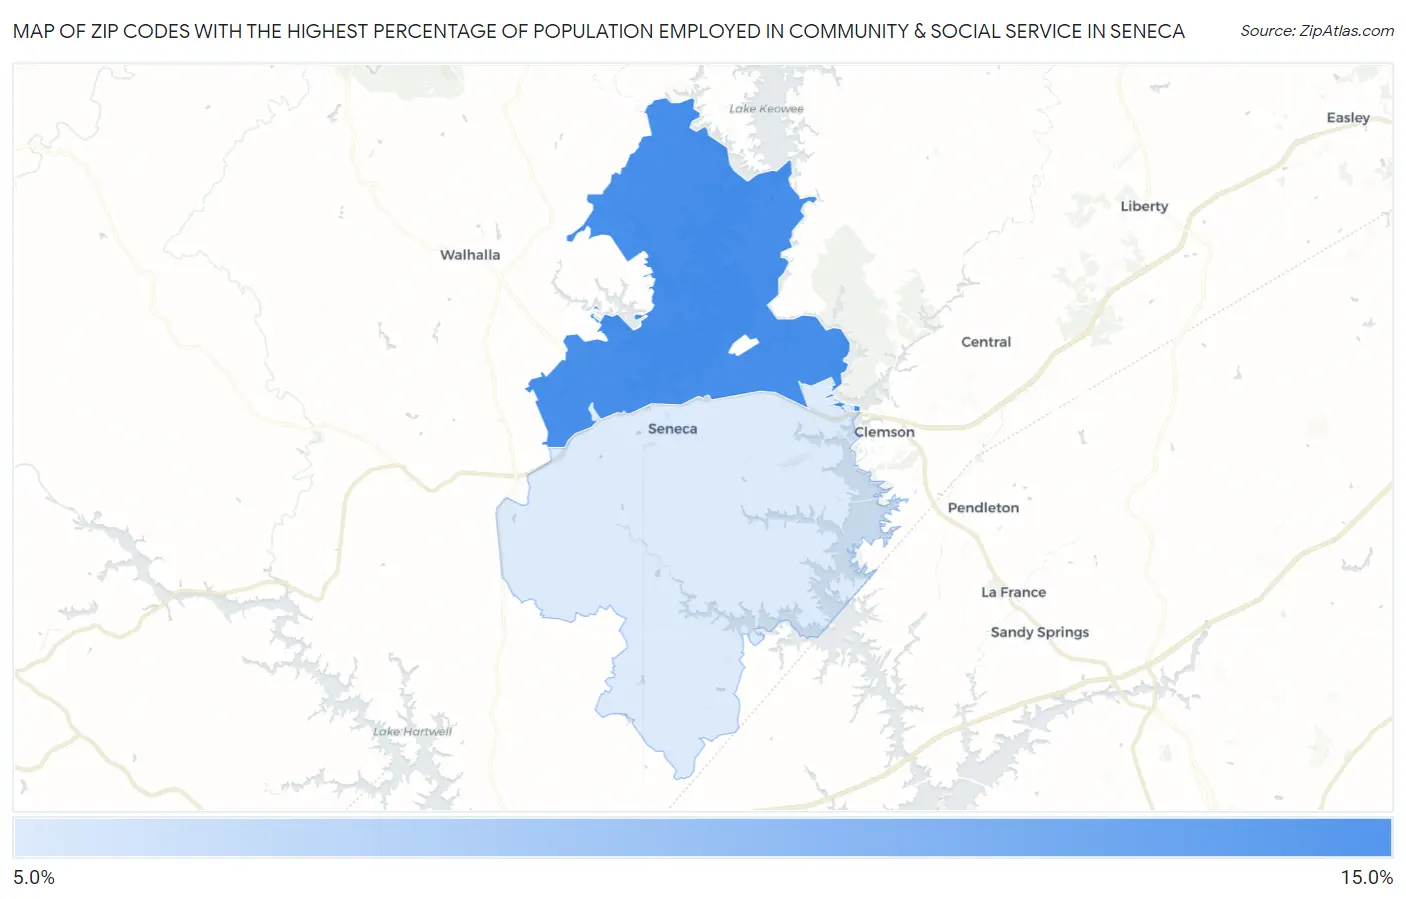
Map of Zip Codes with the Highest Percentage of Population Employed in Community & Social Service in Seneca
10.5%
12.3%
Zip Codes with the Highest Percentage of Population Employed in Community & Social Service in Seneca, SC
| Zip Code | % Employed | vs State | vs National | |
| 1. | 29672 | 12.3% | 10.4%(+1.94)#86 | 11.2%(+1.12)#8,719 |
| 2. | 29678 | 10.5% | 10.4%(+0.143)#138 | 11.2%(-0.671)#12,763 |
1
Common Questions
What are the Top Zip Codes with the Highest Percentage of Population Employed in Community & Social Service in Seneca, SC?
Top Zip Codes with the Highest Percentage of Population Employed in Community & Social Service in Seneca, SC are:
What zip code has the Highest Percentage of Population Employed in Community & Social Service in Seneca, SC?
29672 has the Highest Percentage of Population Employed in Community & Social Service in Seneca, SC with 12.3%.
What is the Percentage of Population Employed in Community & Social Service in Seneca, SC?
Percentage of Population Employed in Community & Social Service in Seneca is 12.0%.
What is the Percentage of Population Employed in Community & Social Service in South Carolina?
Percentage of Population Employed in Community & Social Service in South Carolina is 10.4%.
What is the Percentage of Population Employed in Community & Social Service in the United States?
Percentage of Population Employed in Community & Social Service in the United States is 11.2%.