Locust Grove, OK Map & Demographics
Locust Grove Map
Locust Grove Overview
$23,421
PER CAPITA INCOME
$49,643
AVG FAMILY INCOME
$41,313
AVG HOUSEHOLD INCOME
30.7%
WAGE / INCOME GAP [ % ]
69.3¢/ $1
WAGE / INCOME GAP [ $ ]
$12,927
FAMILY INCOME DEFICIT
0.47
INEQUALITY / GINI INDEX
1,424
TOTAL POPULATION
679
MALE POPULATION
745
FEMALE POPULATION
91.14
MALES / 100 FEMALES
109.72
FEMALES / 100 MALES
36.6
MEDIAN AGE
3.3
AVG FAMILY SIZE
2.6
AVG HOUSEHOLD SIZE
658
LABOR FORCE [ PEOPLE ]
57.8%
PERCENT IN LABOR FORCE
6.3%
UNEMPLOYMENT RATE
Locust Grove Zip Codes
Locust Grove Area Codes
Income in Locust Grove
Income Overview in Locust Grove
Per Capita Income in Locust Grove is $23,421, while median incomes of families and households are $49,643 and $41,313 respectively.
| Characteristic | Number | Measure |
| Per Capita Income | 1,424 | $23,421 |
| Median Family Income | 346 | $49,643 |
| Mean Family Income | 346 | $62,206 |
| Median Household Income | 557 | $41,313 |
| Mean Household Income | 557 | $56,047 |
| Income Deficit | 346 | $12,927 |
| Wage / Income Gap (%) | 1,424 | 30.70% |
| Wage / Income Gap ($) | 1,424 | 69.30¢ per $1 |
| Gini / Inequality Index | 1,424 | 0.47 |
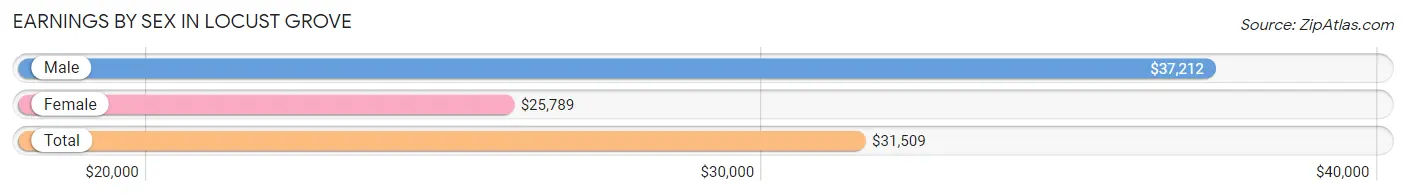
Earnings by Sex in Locust Grove
Average Earnings in Locust Grove are $31,509, $37,212 for men and $25,789 for women, a difference of 30.7%.
| Sex | Number | Average Earnings |
| Male | 345 (50.4%) | $37,212 |
| Female | 340 (49.6%) | $25,789 |
| Total | 685 (100.0%) | $31,509 |
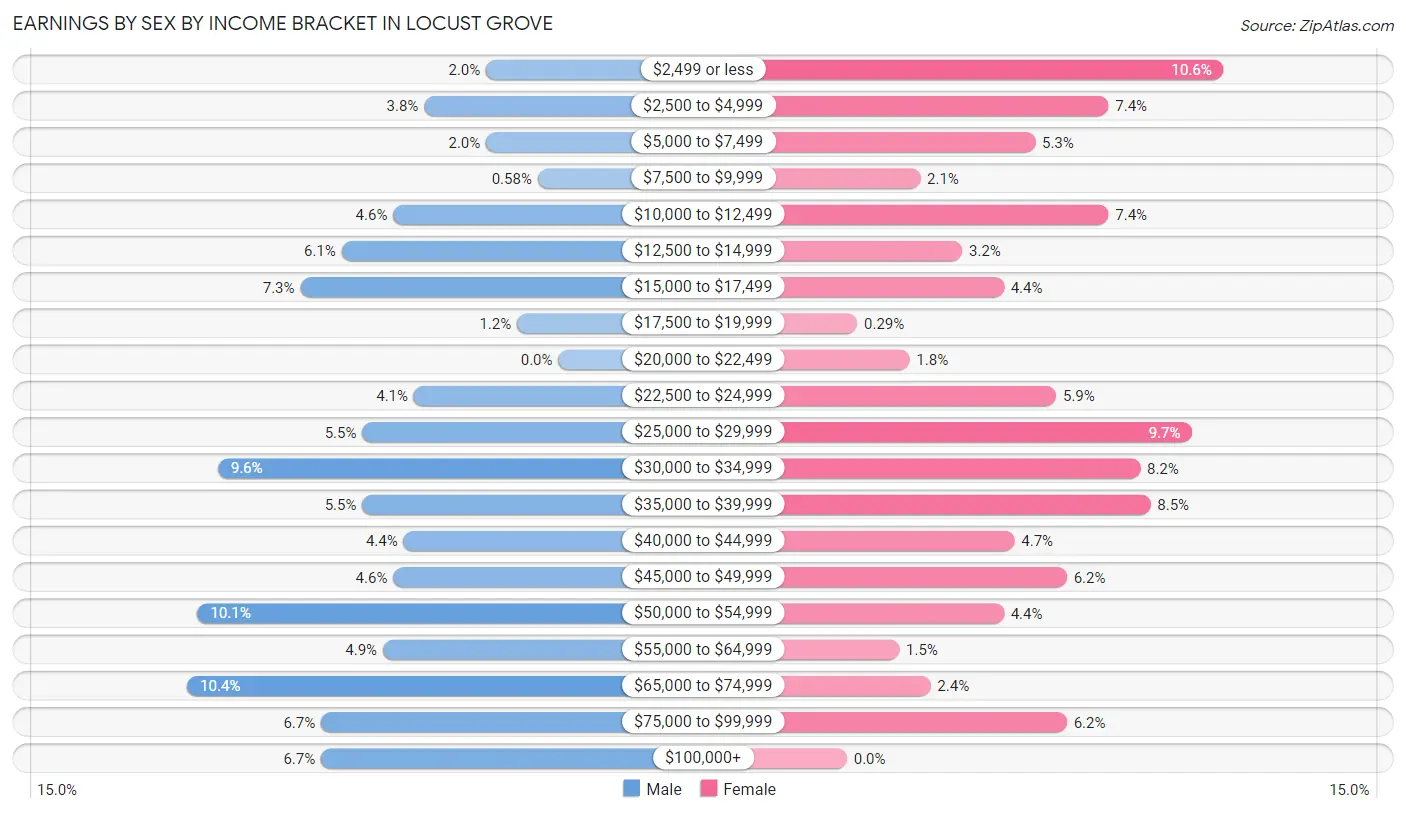
Earnings by Sex by Income Bracket in Locust Grove
The most common earnings brackets in Locust Grove are $65,000 to $74,999 for men (36 | 10.4%) and $2,499 or less for women (36 | 10.6%).
| Income | Male | Female |
| $2,499 or less | 7 (2.0%) | 36 (10.6%) |
| $2,500 to $4,999 | 13 (3.8%) | 25 (7.3%) |
| $5,000 to $7,499 | 7 (2.0%) | 18 (5.3%) |
| $7,500 to $9,999 | 2 (0.6%) | 7 (2.1%) |
| $10,000 to $12,499 | 16 (4.6%) | 25 (7.3%) |
| $12,500 to $14,999 | 21 (6.1%) | 11 (3.2%) |
| $15,000 to $17,499 | 25 (7.2%) | 15 (4.4%) |
| $17,500 to $19,999 | 4 (1.2%) | 1 (0.3%) |
| $20,000 to $22,499 | 0 (0.0%) | 6 (1.8%) |
| $22,500 to $24,999 | 14 (4.1%) | 20 (5.9%) |
| $25,000 to $29,999 | 19 (5.5%) | 33 (9.7%) |
| $30,000 to $34,999 | 33 (9.6%) | 28 (8.2%) |
| $35,000 to $39,999 | 19 (5.5%) | 29 (8.5%) |
| $40,000 to $44,999 | 15 (4.3%) | 16 (4.7%) |
| $45,000 to $49,999 | 16 (4.6%) | 21 (6.2%) |
| $50,000 to $54,999 | 35 (10.1%) | 15 (4.4%) |
| $55,000 to $64,999 | 17 (4.9%) | 5 (1.5%) |
| $65,000 to $74,999 | 36 (10.4%) | 8 (2.4%) |
| $75,000 to $99,999 | 23 (6.7%) | 21 (6.2%) |
| $100,000+ | 23 (6.7%) | 0 (0.0%) |
| Total | 345 (100.0%) | 340 (100.0%) |
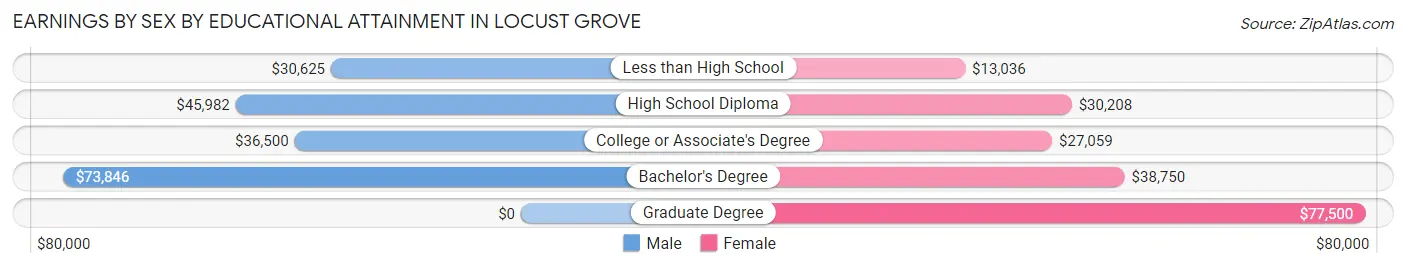
Earnings by Sex by Educational Attainment in Locust Grove
Average earnings in Locust Grove are $45,156 for men and $30,385 for women, a difference of 32.7%. Men with an educational attainment of bachelor's degree enjoy the highest average annual earnings of $73,846, while those with less than high school education earn the least with $30,625. Women with an educational attainment of graduate degree earn the most with the average annual earnings of $77,500, while those with less than high school education have the smallest earnings of $13,036.
| Educational Attainment | Male Income | Female Income |
| Less than High School | $30,625 | $13,036 |
| High School Diploma | $45,982 | $30,208 |
| College or Associate's Degree | $36,500 | $27,059 |
| Bachelor's Degree | $73,846 | $38,750 |
| Graduate Degree | - | - |
| Total | $45,156 | $30,385 |
Family Income in Locust Grove
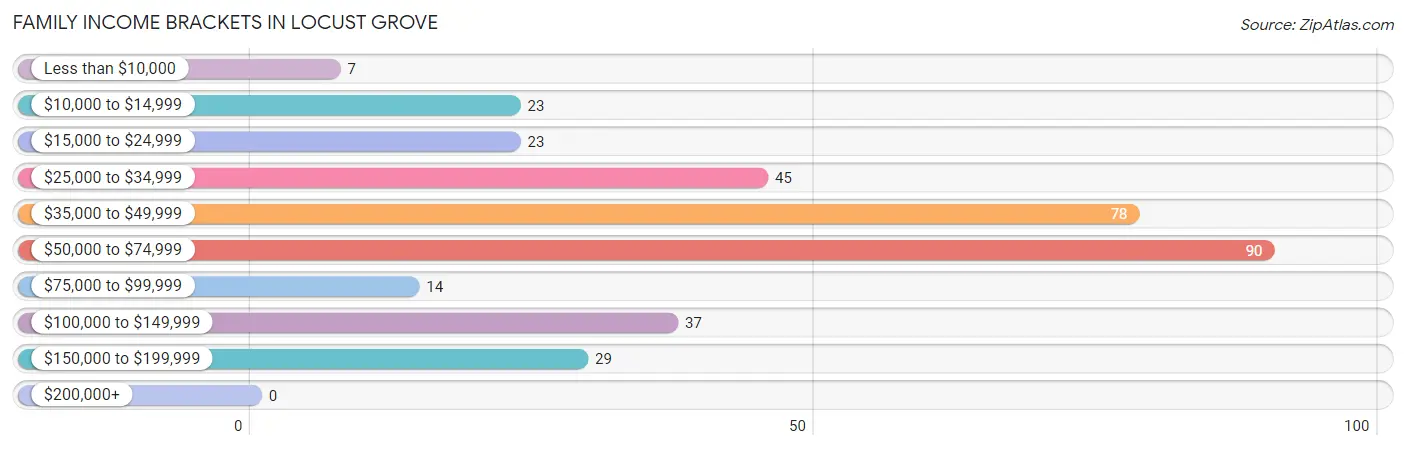
Family Income Brackets in Locust Grove
According to the Locust Grove family income data, there are 90 families falling into the $50,000 to $74,999 income range, which is the most common income bracket and makes up 26.0% of all families.
| Income Bracket | # Families | % Families |
| Less than $10,000 | 7 | 2.0% |
| $10,000 to $14,999 | 23 | 6.6% |
| $15,000 to $24,999 | 23 | 6.6% |
| $25,000 to $34,999 | 45 | 13.0% |
| $35,000 to $49,999 | 78 | 22.5% |
| $50,000 to $74,999 | 90 | 26.0% |
| $75,000 to $99,999 | 14 | 4.0% |
| $100,000 to $149,999 | 37 | 10.7% |
| $150,000 to $199,999 | 29 | 8.4% |
| $200,000+ | 0 | 0.0% |
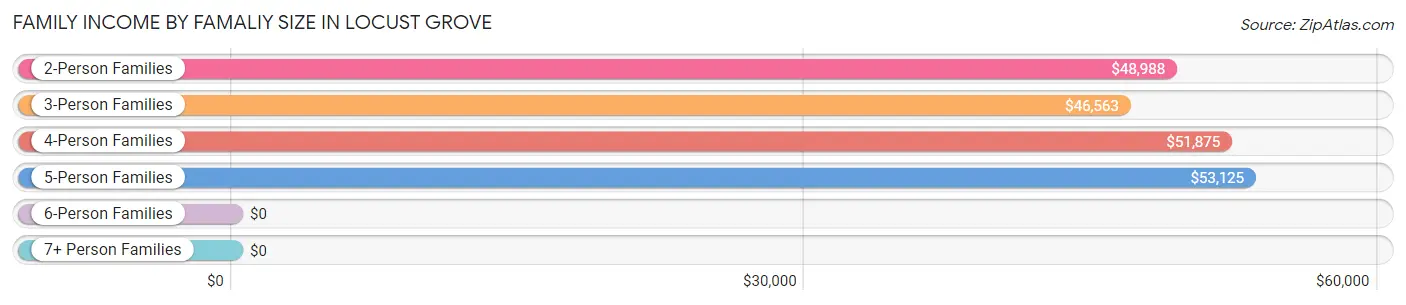
Family Income by Famaliy Size in Locust Grove
5-person families (37 | 10.7%) account for the highest median family income in Locust Grove with $53,125 per family, while 2-person families (159 | 46.0%) have the highest median income of $24,494 per family member.
| Income Bracket | # Families | Median Income |
| 2-Person Families | 159 (46.0%) | $48,988 |
| 3-Person Families | 69 (19.9%) | $46,563 |
| 4-Person Families | 54 (15.6%) | $51,875 |
| 5-Person Families | 37 (10.7%) | $53,125 |
| 6-Person Families | 20 (5.8%) | $0 |
| 7+ Person Families | 7 (2.0%) | $0 |
| Total | 346 (100.0%) | $49,643 |
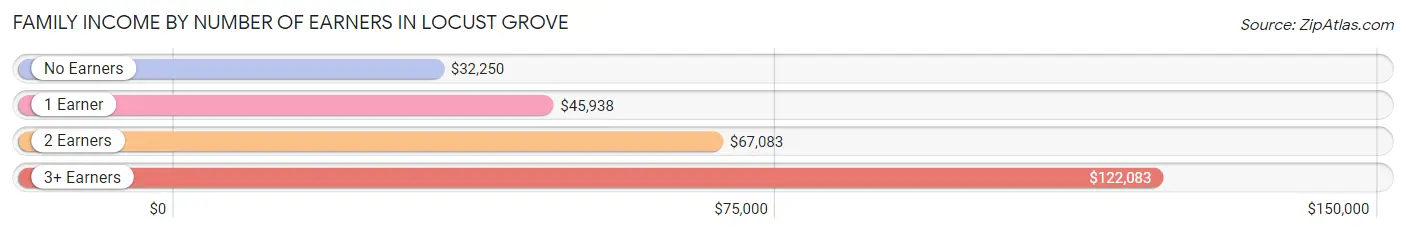
Family Income by Number of Earners in Locust Grove
The median family income in Locust Grove is $49,643, with families comprising 3+ earners (35) having the highest median family income of $122,083, while families with no earners (43) have the lowest median family income of $32,250, accounting for 10.1% and 12.4% of families, respectively.
| Number of Earners | # Families | Median Income |
| No Earners | 43 (12.4%) | $32,250 |
| 1 Earner | 155 (44.8%) | $45,938 |
| 2 Earners | 113 (32.7%) | $67,083 |
| 3+ Earners | 35 (10.1%) | $122,083 |
| Total | 346 (100.0%) | $49,643 |
Household Income in Locust Grove
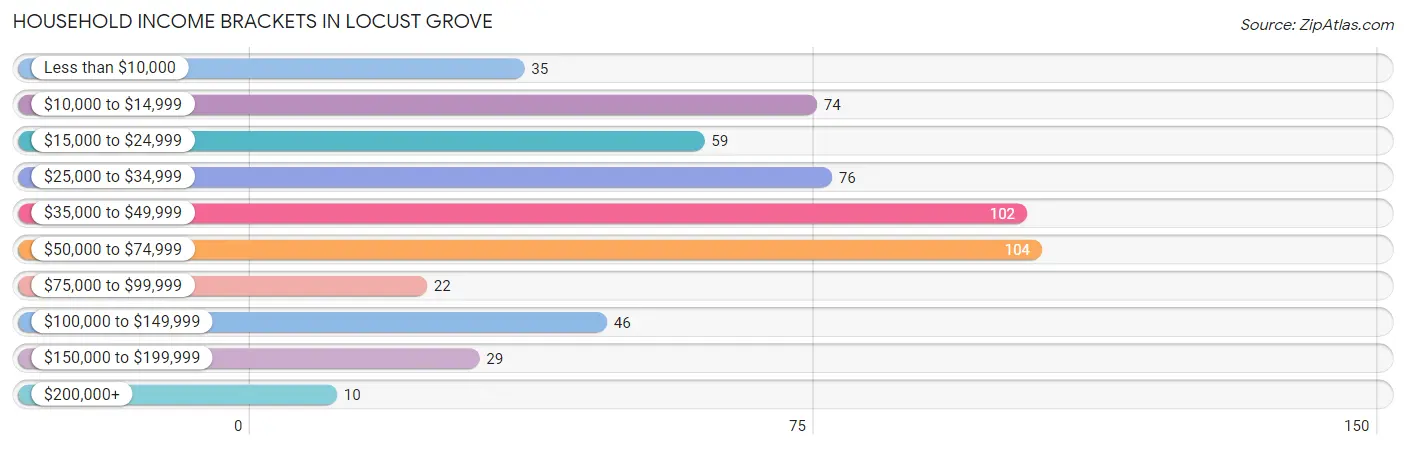
Household Income Brackets in Locust Grove
With 104 households falling in the category, the $50,000 to $74,999 income range is the most frequent in Locust Grove, accounting for 18.7% of all households. In contrast, only 10 households (1.8%) fall into the $200,000+ income bracket, making it the least populous group.
| Income Bracket | # Households | % Households |
| Less than $10,000 | 35 | 6.3% |
| $10,000 to $14,999 | 74 | 13.3% |
| $15,000 to $24,999 | 59 | 10.6% |
| $25,000 to $34,999 | 76 | 13.6% |
| $35,000 to $49,999 | 102 | 18.3% |
| $50,000 to $74,999 | 104 | 18.7% |
| $75,000 to $99,999 | 22 | 3.9% |
| $100,000 to $149,999 | 46 | 8.3% |
| $150,000 to $199,999 | 29 | 5.2% |
| $200,000+ | 10 | 1.8% |
Household Income by Householder Age in Locust Grove
The median household income in Locust Grove is $41,313, with the highest median household income of $49,271 found in the 25 to 44 years age bracket for the primary householder. A total of 167 households (30.0%) fall into this category. Meanwhile, the 65+ years age bracket for the primary householder has the lowest median household income of $24,318, with 138 households (24.8%) in this group.
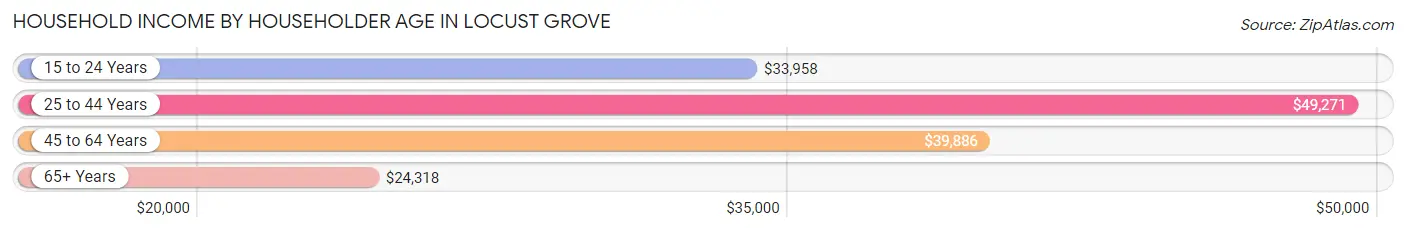
| Income Bracket | # Households | Median Income |
| 15 to 24 Years | 29 (5.2%) | $33,958 |
| 25 to 44 Years | 167 (30.0%) | $49,271 |
| 45 to 64 Years | 223 (40.0%) | $39,886 |
| 65+ Years | 138 (24.8%) | $24,318 |
| Total | 557 (100.0%) | $41,313 |
Poverty in Locust Grove
Income Below Poverty by Sex and Age in Locust Grove
With 16.6% poverty level for males and 25.9% for females among the residents of Locust Grove, 5 year old males and 5 year old females are the most vulnerable to poverty, with 4 males (57.1%) and 14 females (70.0%) in their respective age groups living below the poverty level.
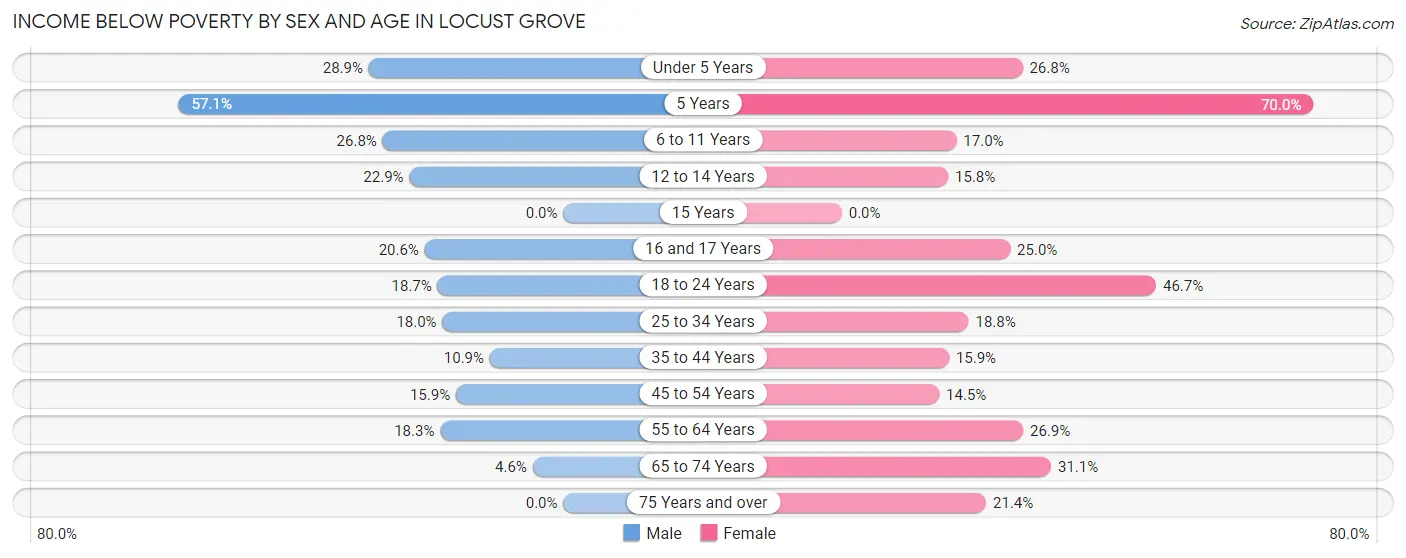
| Age Bracket | Male | Female |
| Under 5 Years | 13 (28.9%) | 11 (26.8%) |
| 5 Years | 4 (57.1%) | 14 (70.0%) |
| 6 to 11 Years | 11 (26.8%) | 8 (17.0%) |
| 12 to 14 Years | 8 (22.9%) | 3 (15.8%) |
| 15 Years | 0 (0.0%) | 0 (0.0%) |
| 16 and 17 Years | 7 (20.6%) | 7 (25.0%) |
| 18 to 24 Years | 14 (18.7%) | 42 (46.7%) |
| 25 to 34 Years | 14 (17.9%) | 16 (18.8%) |
| 35 to 44 Years | 12 (10.9%) | 14 (15.9%) |
| 45 to 54 Years | 11 (15.9%) | 12 (14.5%) |
| 55 to 64 Years | 17 (18.3%) | 28 (26.9%) |
| 65 to 74 Years | 2 (4.5%) | 32 (31.1%) |
| 75 Years and over | 0 (0.0%) | 6 (21.4%) |
| Total | 113 (16.6%) | 193 (25.9%) |
Income Above Poverty by Sex and Age in Locust Grove
According to the poverty statistics in Locust Grove, males aged 15 years and females aged 15 years are the age groups that are most secure financially, with 100.0% of males and 100.0% of females in these age groups living above the poverty line.
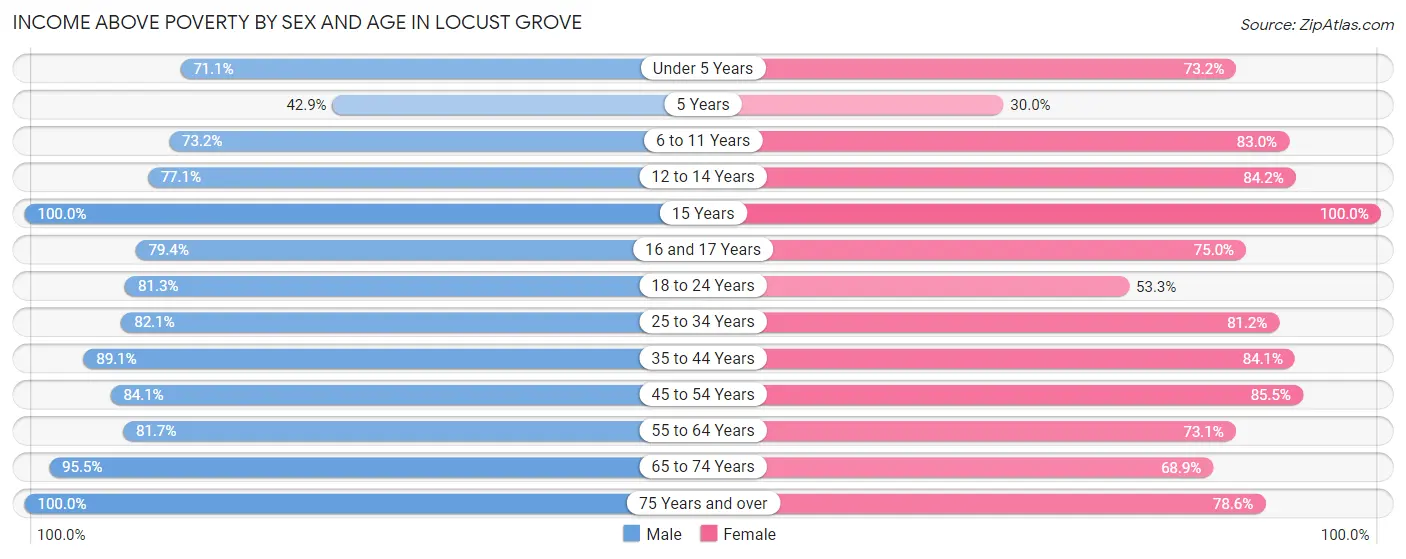
| Age Bracket | Male | Female |
| Under 5 Years | 32 (71.1%) | 30 (73.2%) |
| 5 Years | 3 (42.9%) | 6 (30.0%) |
| 6 to 11 Years | 30 (73.2%) | 39 (83.0%) |
| 12 to 14 Years | 27 (77.1%) | 16 (84.2%) |
| 15 Years | 22 (100.0%) | 9 (100.0%) |
| 16 and 17 Years | 27 (79.4%) | 21 (75.0%) |
| 18 to 24 Years | 61 (81.3%) | 48 (53.3%) |
| 25 to 34 Years | 64 (82.1%) | 69 (81.2%) |
| 35 to 44 Years | 98 (89.1%) | 74 (84.1%) |
| 45 to 54 Years | 58 (84.1%) | 71 (85.5%) |
| 55 to 64 Years | 76 (81.7%) | 76 (73.1%) |
| 65 to 74 Years | 42 (95.5%) | 71 (68.9%) |
| 75 Years and over | 26 (100.0%) | 22 (78.6%) |
| Total | 566 (83.4%) | 552 (74.1%) |
Income Below Poverty Among Married-Couple Families in Locust Grove
The poverty statistics for married-couple families in Locust Grove show that 9.5% or 20 of the total 211 families live below the poverty line. Families with 1 or 2 children have the highest poverty rate of 14.7%, comprising of 11 families. On the other hand, families with no children have the lowest poverty rate of 6.5%, which includes 7 families.
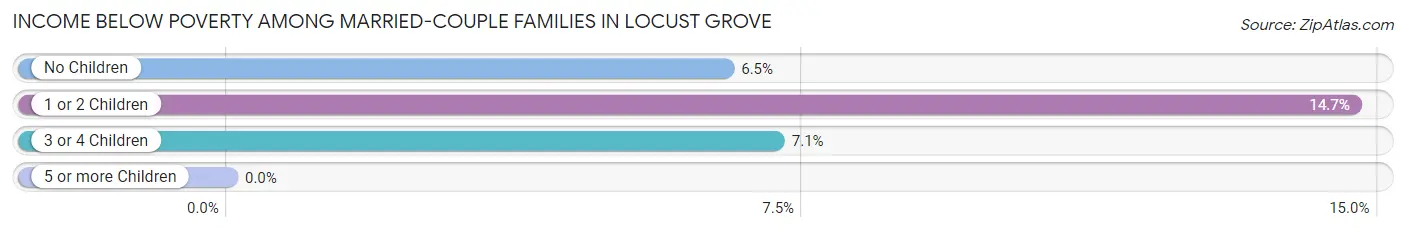
| Children | Above Poverty | Below Poverty |
| No Children | 101 (93.5%) | 7 (6.5%) |
| 1 or 2 Children | 64 (85.3%) | 11 (14.7%) |
| 3 or 4 Children | 26 (92.9%) | 2 (7.1%) |
| 5 or more Children | 0 (0.0%) | 0 (0.0%) |
| Total | 191 (90.5%) | 20 (9.5%) |
Income Below Poverty Among Single-Parent Households in Locust Grove
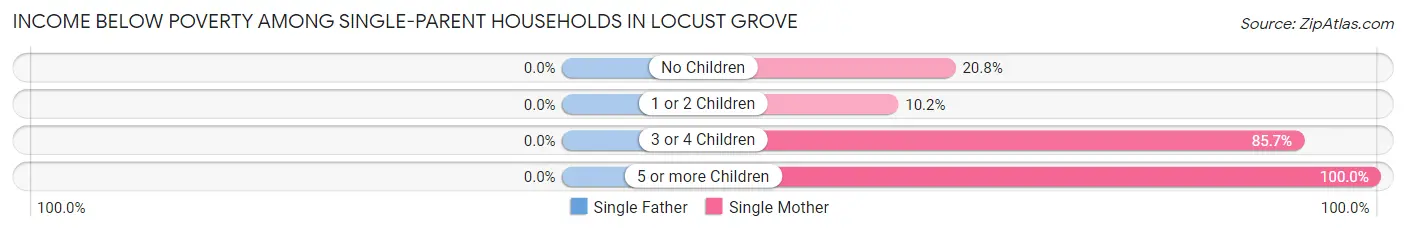
| Children | Single Father | Single Mother |
| No Children | 0 (0.0%) | 5 (20.8%) |
| 1 or 2 Children | 0 (0.0%) | 6 (10.2%) |
| 3 or 4 Children | 0 (0.0%) | 12 (85.7%) |
| 5 or more Children | 0 (0.0%) | 5 (100.0%) |
| Total | 0 (0.0%) | 28 (27.5%) |
Income Below Poverty Among Married-Couple vs Single-Parent Households in Locust Grove
The poverty data for Locust Grove shows that 20 of the married-couple family households (9.5%) and 28 of the single-parent households (20.7%) are living below the poverty level. Within the married-couple family households, those with 1 or 2 children have the highest poverty rate, with 11 households (14.7%) falling below the poverty line. Among the single-parent households, those with 5 or more children have the highest poverty rate, with 5 household (100.0%) living below poverty.
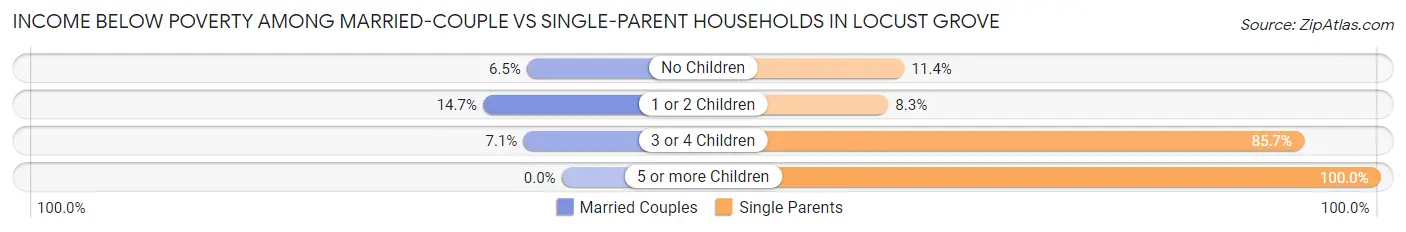
| Children | Married-Couple Families | Single-Parent Households |
| No Children | 7 (6.5%) | 5 (11.4%) |
| 1 or 2 Children | 11 (14.7%) | 6 (8.3%) |
| 3 or 4 Children | 2 (7.1%) | 12 (85.7%) |
| 5 or more Children | 0 (0.0%) | 5 (100.0%) |
| Total | 20 (9.5%) | 28 (20.7%) |
Race in Locust Grove
The most populous races in Locust Grove are Native / Alaskan (698 | 49.0%), White / Caucasian (505 | 35.5%), and Two or more Races (196 | 13.8%).
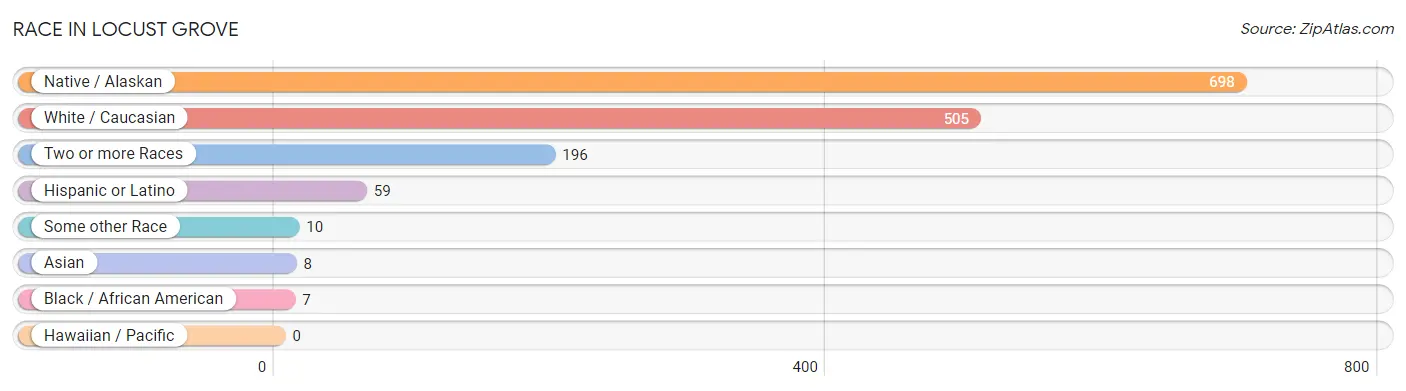
| Race | # Population | % Population |
| Asian | 8 | 0.6% |
| Black / African American | 7 | 0.5% |
| Hawaiian / Pacific | 0 | 0.0% |
| Hispanic or Latino | 59 | 4.1% |
| Native / Alaskan | 698 | 49.0% |
| White / Caucasian | 505 | 35.5% |
| Two or more Races | 196 | 13.8% |
| Some other Race | 10 | 0.7% |
| Total | 1,424 | 100.0% |
Ancestry in Locust Grove
The most populous ancestries reported in Locust Grove are Cherokee (676 | 47.5%), Creek (114 | 8.0%), German (106 | 7.4%), Irish (94 | 6.6%), and American (55 | 3.9%), together accounting for 73.4% of all Locust Grove residents.
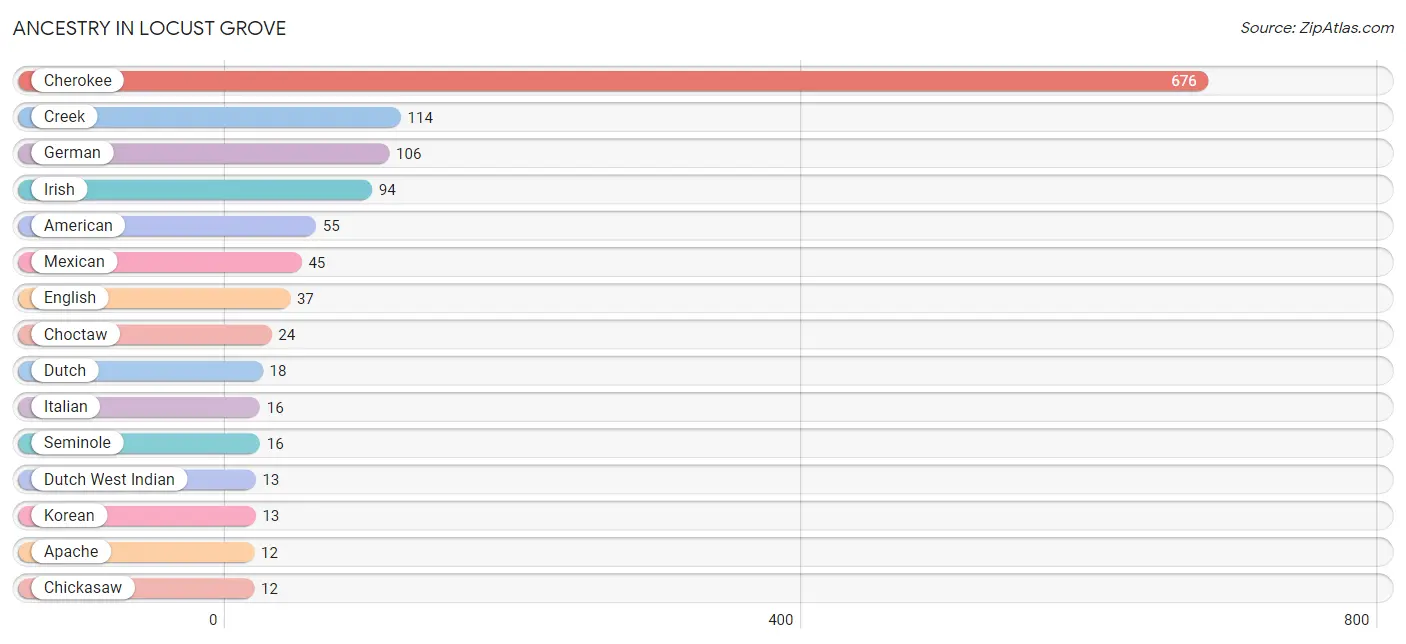
| Ancestry | # Population | % Population |
| American | 55 | 3.9% |
| Apache | 12 | 0.8% |
| British | 4 | 0.3% |
| Burmese | 5 | 0.4% |
| Central American | 11 | 0.8% |
| Cherokee | 676 | 47.5% |
| Chickasaw | 12 | 0.8% |
| Choctaw | 24 | 1.7% |
| Creek | 114 | 8.0% |
| Czech | 7 | 0.5% |
| Dutch | 18 | 1.3% |
| Dutch West Indian | 13 | 0.9% |
| English | 37 | 2.6% |
| European | 8 | 0.6% |
| French | 9 | 0.6% |
| German | 106 | 7.4% |
| Guatemalan | 11 | 0.8% |
| Irish | 94 | 6.6% |
| Italian | 16 | 1.1% |
| Kiowa | 12 | 0.8% |
| Korean | 13 | 0.9% |
| Mexican | 45 | 3.2% |
| Navajo | 12 | 0.8% |
| Norwegian | 7 | 0.5% |
| Romanian | 2 | 0.1% |
| Russian | 11 | 0.8% |
| Scandinavian | 2 | 0.1% |
| Scotch-Irish | 1 | 0.1% |
| Scottish | 12 | 0.8% |
| Seminole | 16 | 1.1% |
| Spanish | 3 | 0.2% |
| Swedish | 7 | 0.5% |
| Welsh | 1 | 0.1% | View All 33 Rows |
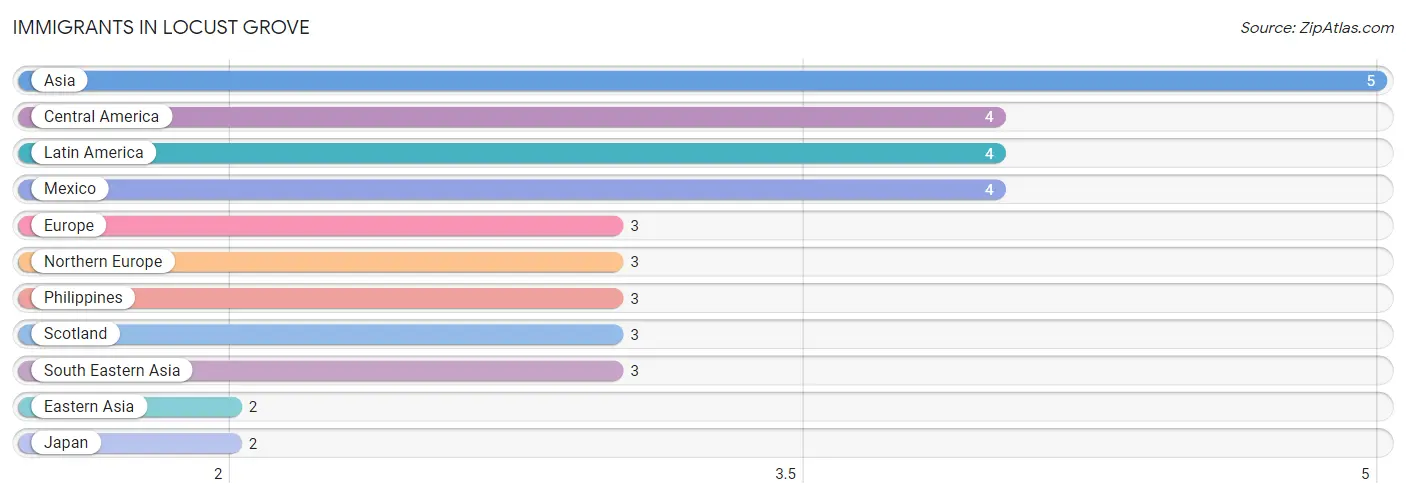
Immigrants in Locust Grove
The most numerous immigrant groups reported in Locust Grove came from Asia (5 | 0.4%), Central America (4 | 0.3%), Latin America (4 | 0.3%), Mexico (4 | 0.3%), and Europe (3 | 0.2%), together accounting for 1.4% of all Locust Grove residents.
| Immigration Origin | # Population | % Population |
| Asia | 5 | 0.4% |
| Central America | 4 | 0.3% |
| Eastern Asia | 2 | 0.1% |
| Europe | 3 | 0.2% |
| Japan | 2 | 0.1% |
| Latin America | 4 | 0.3% |
| Mexico | 4 | 0.3% |
| Northern Europe | 3 | 0.2% |
| Philippines | 3 | 0.2% |
| Scotland | 3 | 0.2% |
| South Eastern Asia | 3 | 0.2% | View All 11 Rows |
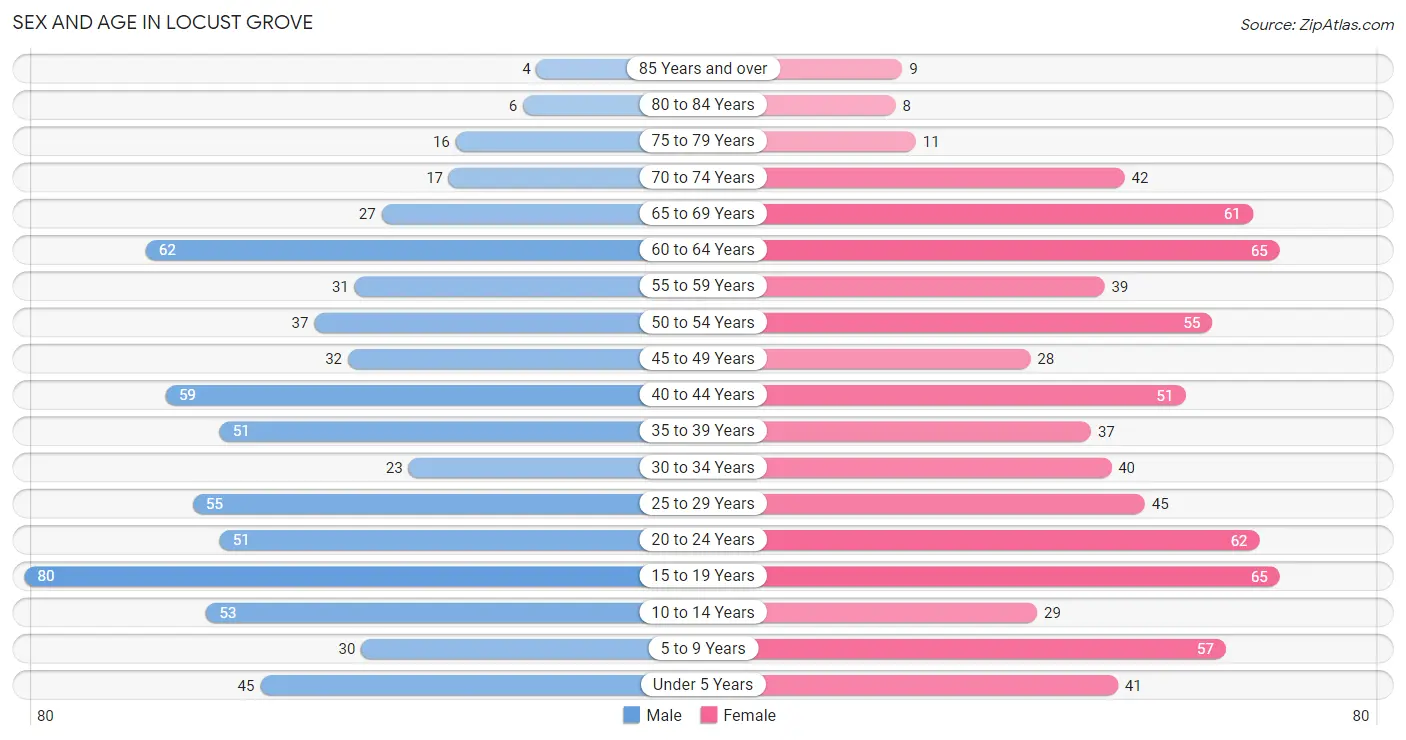
Sex and Age in Locust Grove
Sex and Age in Locust Grove
The most populous age groups in Locust Grove are 15 to 19 Years (80 | 11.8%) for men and 15 to 19 Years (65 | 8.7%) for women.
| Age Bracket | Male | Female |
| Under 5 Years | 45 (6.6%) | 41 (5.5%) |
| 5 to 9 Years | 30 (4.4%) | 57 (7.6%) |
| 10 to 14 Years | 53 (7.8%) | 29 (3.9%) |
| 15 to 19 Years | 80 (11.8%) | 65 (8.7%) |
| 20 to 24 Years | 51 (7.5%) | 62 (8.3%) |
| 25 to 29 Years | 55 (8.1%) | 45 (6.0%) |
| 30 to 34 Years | 23 (3.4%) | 40 (5.4%) |
| 35 to 39 Years | 51 (7.5%) | 37 (5.0%) |
| 40 to 44 Years | 59 (8.7%) | 51 (6.9%) |
| 45 to 49 Years | 32 (4.7%) | 28 (3.8%) |
| 50 to 54 Years | 37 (5.4%) | 55 (7.4%) |
| 55 to 59 Years | 31 (4.6%) | 39 (5.2%) |
| 60 to 64 Years | 62 (9.1%) | 65 (8.7%) |
| 65 to 69 Years | 27 (4.0%) | 61 (8.2%) |
| 70 to 74 Years | 17 (2.5%) | 42 (5.6%) |
| 75 to 79 Years | 16 (2.4%) | 11 (1.5%) |
| 80 to 84 Years | 6 (0.9%) | 8 (1.1%) |
| 85 Years and over | 4 (0.6%) | 9 (1.2%) |
| Total | 679 (100.0%) | 745 (100.0%) |
Families and Households in Locust Grove
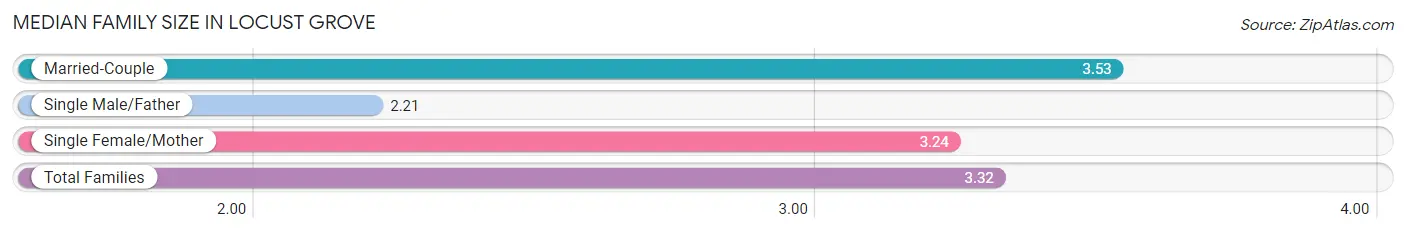
Median Family Size in Locust Grove
The median family size in Locust Grove is 3.32 persons per family, with married-couple families (211 | 61.0%) accounting for the largest median family size of 3.53 persons per family. On the other hand, single male/father families (33 | 9.5%) represent the smallest median family size with 2.21 persons per family.
| Family Type | # Families | Family Size |
| Married-Couple | 211 (61.0%) | 3.53 |
| Single Male/Father | 33 (9.5%) | 2.21 |
| Single Female/Mother | 102 (29.5%) | 3.24 |
| Total Families | 346 (100.0%) | 3.32 |
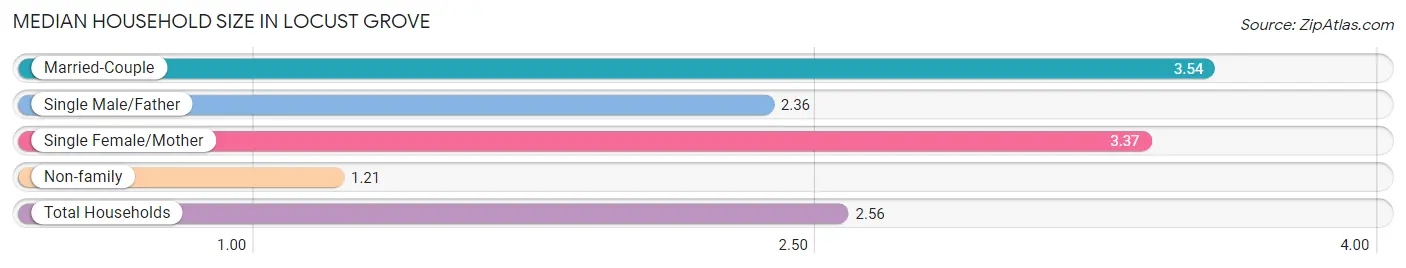
Median Household Size in Locust Grove
The median household size in Locust Grove is 2.56 persons per household, with married-couple households (211 | 37.9%) accounting for the largest median household size of 3.54 persons per household. non-family households (211 | 37.9%) represent the smallest median household size with 1.21 persons per household.
| Household Type | # Households | Household Size |
| Married-Couple | 211 (37.9%) | 3.54 |
| Single Male/Father | 33 (5.9%) | 2.36 |
| Single Female/Mother | 102 (18.3%) | 3.37 |
| Non-family | 211 (37.9%) | 1.21 |
| Total Households | 557 (100.0%) | 2.56 |
Household Size by Marriage Status in Locust Grove
Out of a total of 557 households in Locust Grove, 346 (62.1%) are family households, while 211 (37.9%) are nonfamily households. The most numerous type of family households are 2-person households, comprising 153, and the most common type of nonfamily households are 1-person households, comprising 181.
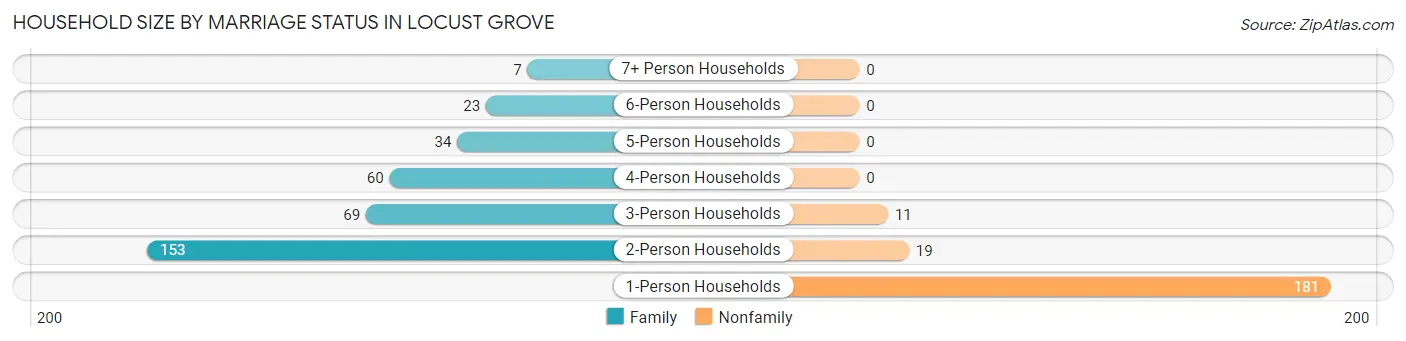
| Household Size | Family Households | Nonfamily Households |
| 1-Person Households | - | 181 (32.5%) |
| 2-Person Households | 153 (27.5%) | 19 (3.4%) |
| 3-Person Households | 69 (12.4%) | 11 (2.0%) |
| 4-Person Households | 60 (10.8%) | 0 (0.0%) |
| 5-Person Households | 34 (6.1%) | 0 (0.0%) |
| 6-Person Households | 23 (4.1%) | 0 (0.0%) |
| 7+ Person Households | 7 (1.3%) | 0 (0.0%) |
| Total | 346 (62.1%) | 211 (37.9%) |
Female Fertility in Locust Grove
Fertility by Age in Locust Grove
Average fertility rate in Locust Grove is 36.0 births per 1,000 women. Women in the age bracket of 15 to 19 years have the highest fertility rate with 77.0 births per 1,000 women. Women in the age bracket of 20 to 34 years acount for 58.3% of all women with births.
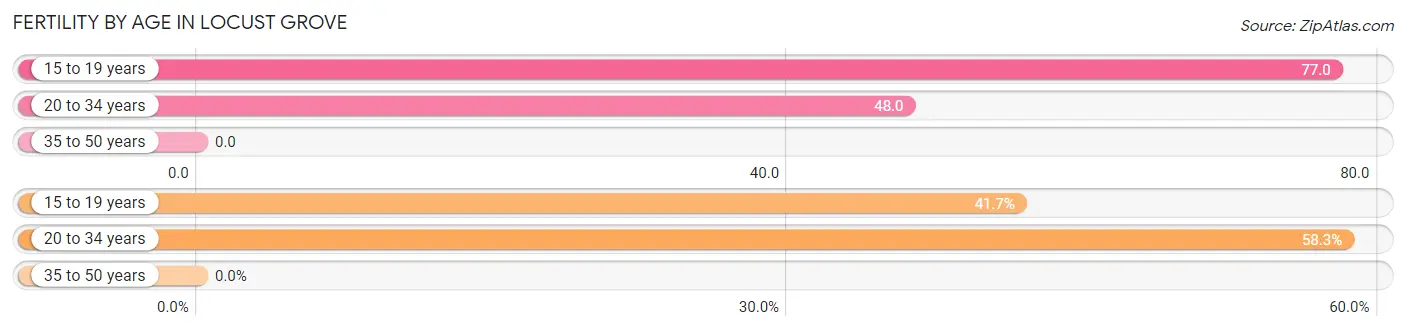
| Age Bracket | Women with Births | Births / 1,000 Women |
| 15 to 19 years | 5 (41.7%) | 77.0 |
| 20 to 34 years | 7 (58.3%) | 48.0 |
| 35 to 50 years | 0 (0.0%) | 0.0 |
| Total | 12 (100.0%) | 36.0 |
Fertility by Age by Marriage Status in Locust Grove
58.3% of women with births (12) in Locust Grove are married. The highest percentage of unmarried women with births falls into 15 to 19 years age bracket with 100.0% of them unmarried at the time of birth, while the lowest percentage of unmarried women with births belong to 20 to 34 years age bracket with 0.0% of them unmarried.
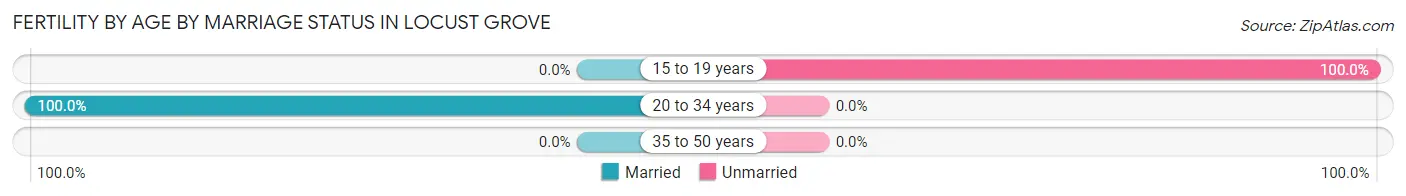
| Age Bracket | Married | Unmarried |
| 15 to 19 years | 0 (0.0%) | 5 (100.0%) |
| 20 to 34 years | 7 (100.0%) | 0 (0.0%) |
| 35 to 50 years | 0 (0.0%) | 0 (0.0%) |
| Total | 7 (58.3%) | 5 (41.7%) |
Fertility by Education in Locust Grove
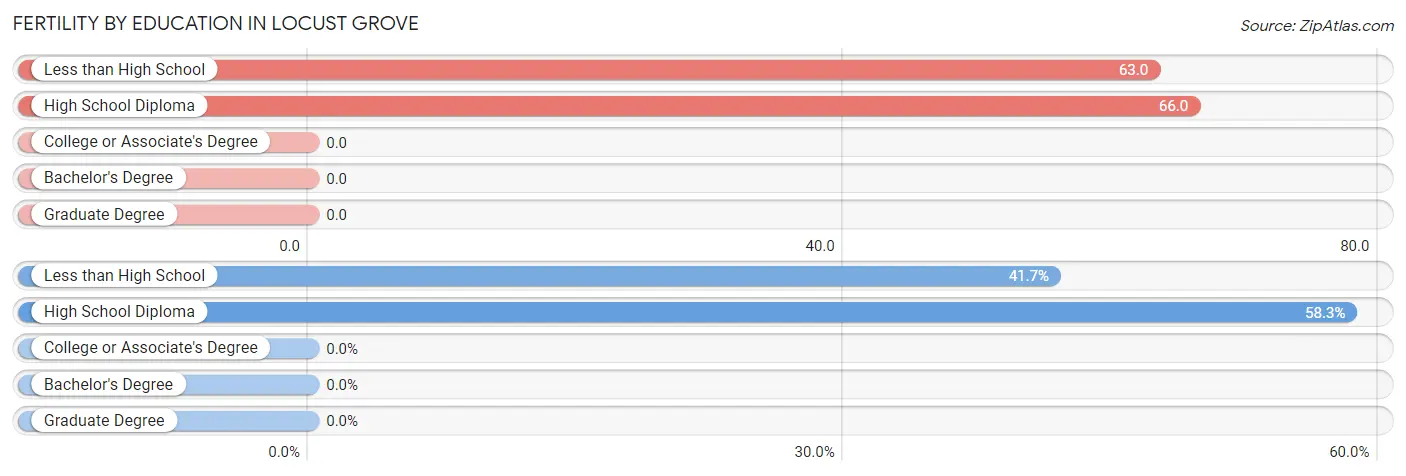
| Educational Attainment | Women with Births | Births / 1,000 Women |
| Less than High School | 5 (41.7%) | 63.0 |
| High School Diploma | 7 (58.3%) | 66.0 |
| College or Associate's Degree | 0 (0.0%) | 0.0 |
| Bachelor's Degree | 0 (0.0%) | 0.0 |
| Graduate Degree | 0 (0.0%) | 0.0 |
| Total | 12 (100.0%) | 36.0 |
Fertility by Education by Marriage Status in Locust Grove
41.7% of women with births in Locust Grove are unmarried. Women with the educational attainment of high school diploma are most likely to be married with 100.0% of them married at childbirth, while women with the educational attainment of less than high school are least likely to be married with 100.0% of them unmarried at childbirth.
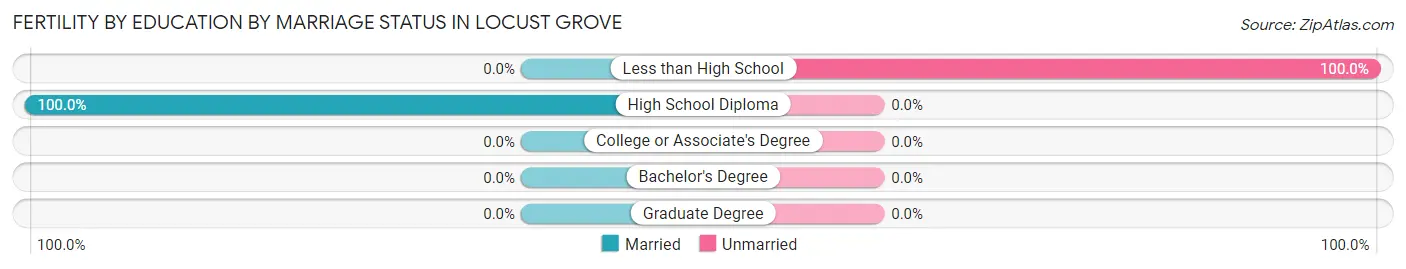
| Educational Attainment | Married | Unmarried |
| Less than High School | 0 (0.0%) | 5 (100.0%) |
| High School Diploma | 7 (100.0%) | 0 (0.0%) |
| College or Associate's Degree | 0 (0.0%) | 0 (0.0%) |
| Bachelor's Degree | 0 (0.0%) | 0 (0.0%) |
| Graduate Degree | 0 (0.0%) | 0 (0.0%) |
| Total | 7 (58.3%) | 5 (41.7%) |
Employment Characteristics in Locust Grove
Employment by Class of Employer in Locust Grove
Among the 610 employed individuals in Locust Grove, private company employees (396 | 64.9%), self-employed (not incorporated) (57 | 9.3%), and local government employees (44 | 7.2%) make up the most common classes of employment.
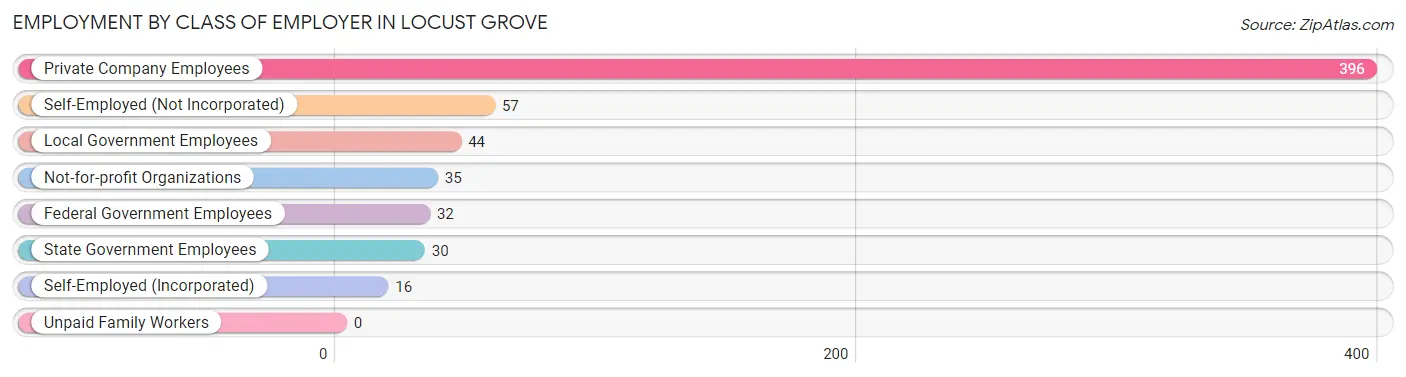
| Employer Class | # Employees | % Employees |
| Private Company Employees | 396 | 64.9% |
| Self-Employed (Incorporated) | 16 | 2.6% |
| Self-Employed (Not Incorporated) | 57 | 9.3% |
| Not-for-profit Organizations | 35 | 5.7% |
| Local Government Employees | 44 | 7.2% |
| State Government Employees | 30 | 4.9% |
| Federal Government Employees | 32 | 5.2% |
| Unpaid Family Workers | 0 | 0.0% |
| Total | 610 | 100.0% |
Employment Status by Age in Locust Grove
According to the labor force statistics for Locust Grove, out of the total population over 16 years of age (1,138), 57.8% or 658 individuals are in the labor force, with 6.3% or 41 of them unemployed. The age group with the highest labor force participation rate is 30 to 34 years, with 95.2% or 60 individuals in the labor force. Within the labor force, the 20 to 24 years age range has the highest percentage of unemployed individuals, with 26.0% or 26 of them being unemployed.
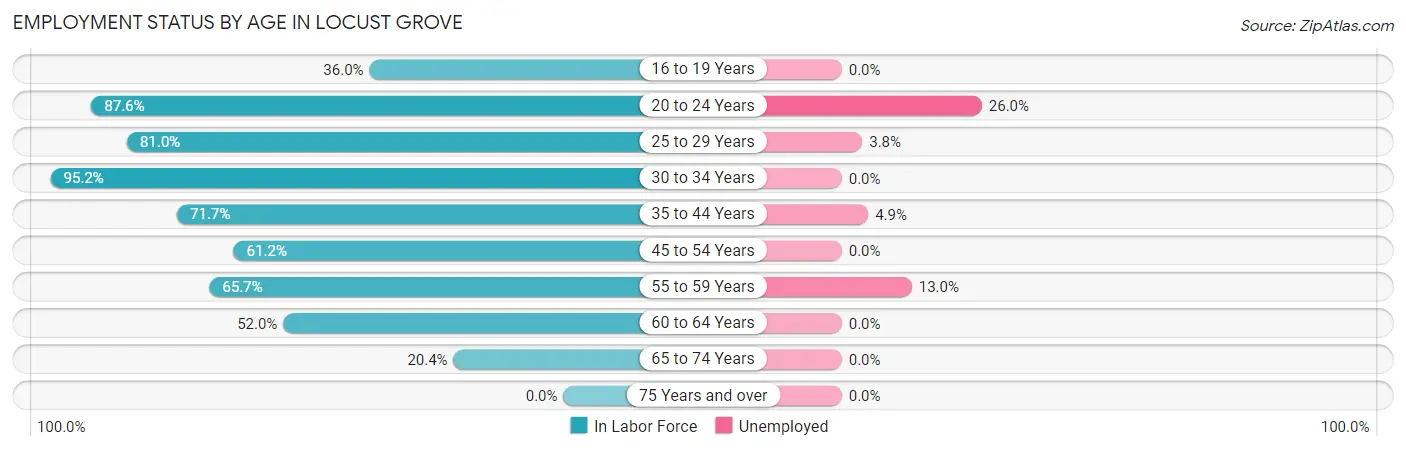
| Age Bracket | In Labor Force | Unemployed |
| 16 to 19 Years | 41 (36.0%) | 0 (0.0%) |
| 20 to 24 Years | 99 (87.6%) | 26 (26.0%) |
| 25 to 29 Years | 81 (81.0%) | 3 (3.8%) |
| 30 to 34 Years | 60 (95.2%) | 0 (0.0%) |
| 35 to 44 Years | 142 (71.7%) | 7 (4.9%) |
| 45 to 54 Years | 93 (61.2%) | 0 (0.0%) |
| 55 to 59 Years | 46 (65.7%) | 6 (13.0%) |
| 60 to 64 Years | 66 (52.0%) | 0 (0.0%) |
| 65 to 74 Years | 30 (20.4%) | 0 (0.0%) |
| 75 Years and over | 0 (0.0%) | 0 (0.0%) |
| Total | 658 (57.8%) | 41 (6.3%) |
Employment Status by Educational Attainment in Locust Grove
According to labor force statistics for Locust Grove, 68.7% of individuals (488) out of the total population between 25 and 64 years of age (710) are in the labor force, with 3.3% or 16 of them being unemployed. The group with the highest labor force participation rate are those with the educational attainment of bachelor's degree or higher, with 88.5% or 77 individuals in the labor force. Within the labor force, individuals with high school diploma education have the highest percentage of unemployment, with 6.7% or 12 of them being unemployed.
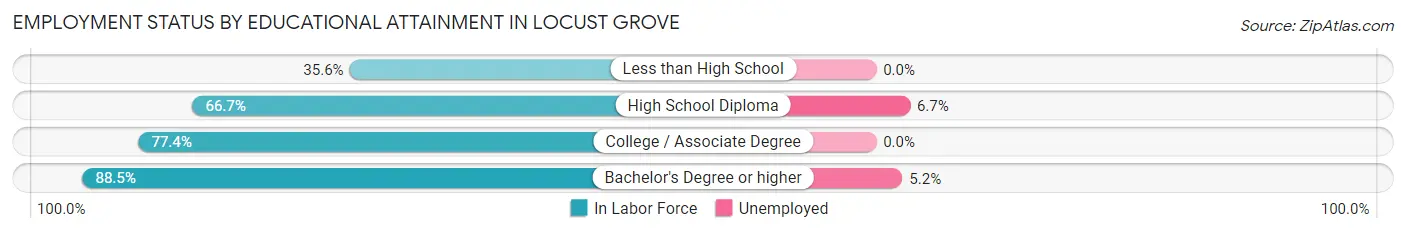
| Educational Attainment | In Labor Force | Unemployed |
| Less than High School | 36 (35.6%) | 0 (0.0%) |
| High School Diploma | 180 (66.7%) | 18 (6.7%) |
| College / Associate Degree | 195 (77.4%) | 0 (0.0%) |
| Bachelor's Degree or higher | 77 (88.5%) | 5 (5.2%) |
| Total | 488 (68.7%) | 23 (3.3%) |
Employment Occupations by Sex in Locust Grove
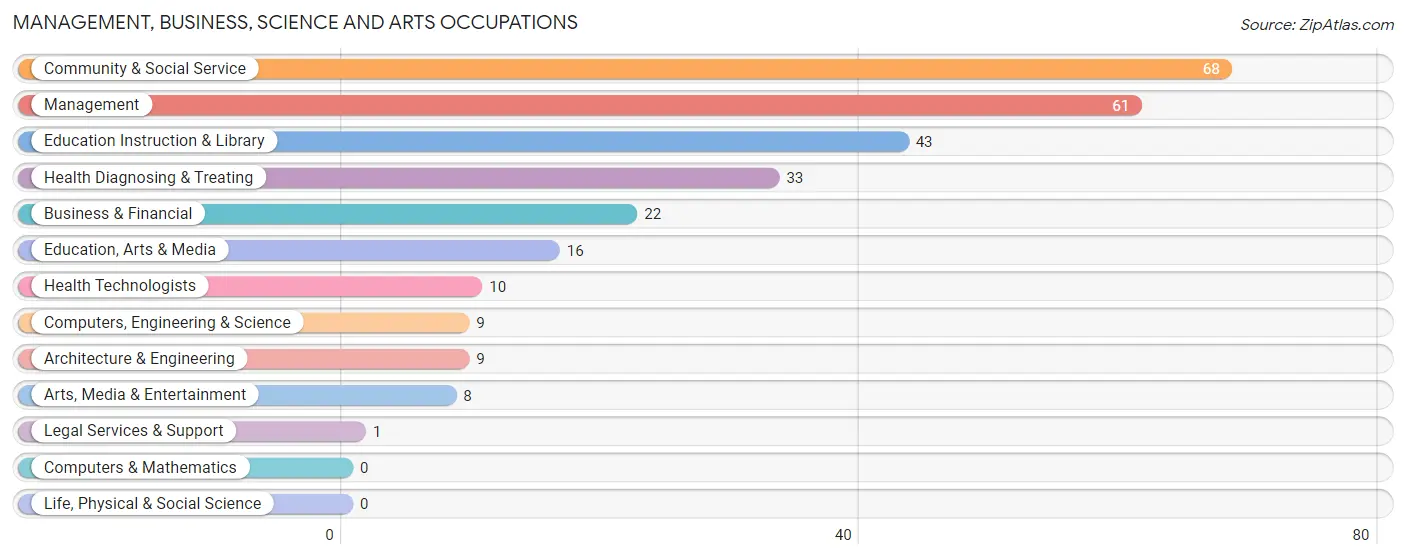
Management, Business, Science and Arts Occupations
The most common Management, Business, Science and Arts occupations in Locust Grove are Community & Social Service (68 | 11.1%), Management (61 | 10.0%), Education Instruction & Library (43 | 7.0%), Health Diagnosing & Treating (33 | 5.4%), and Business & Financial (22 | 3.6%).
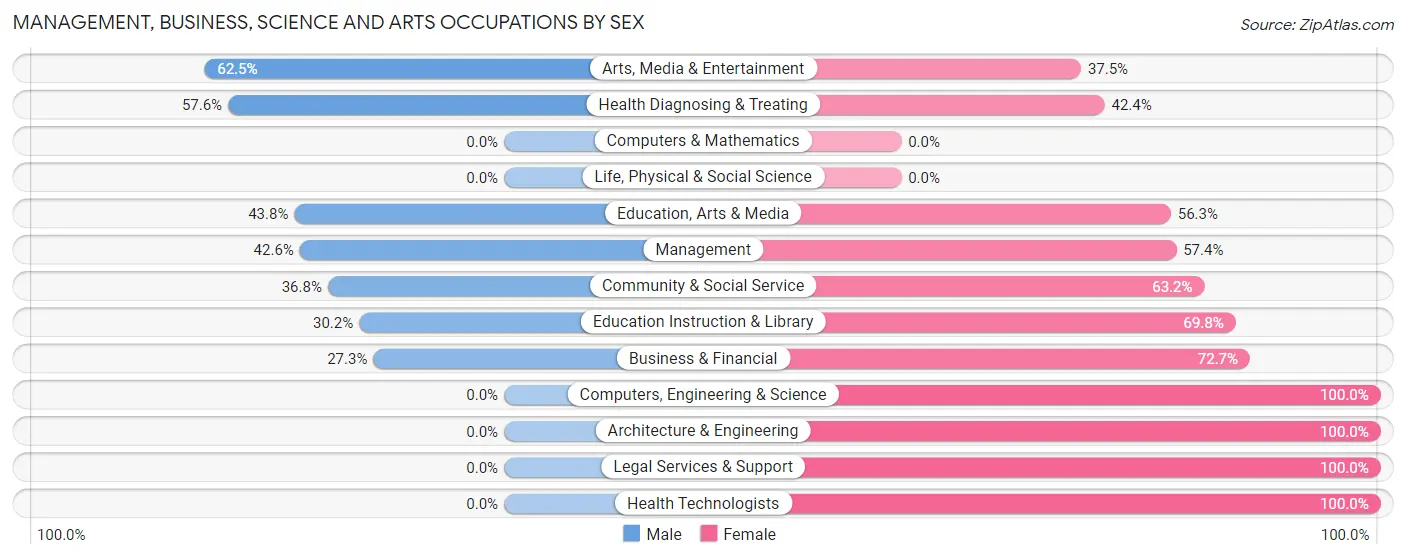
Management, Business, Science and Arts Occupations by Sex
Within the Management, Business, Science and Arts occupations in Locust Grove, the most male-oriented occupations are Arts, Media & Entertainment (62.5%), Health Diagnosing & Treating (57.6%), and Education, Arts & Media (43.8%), while the most female-oriented occupations are Computers, Engineering & Science (100.0%), Architecture & Engineering (100.0%), and Legal Services & Support (100.0%).
| Occupation | Male | Female |
| Management | 26 (42.6%) | 35 (57.4%) |
| Business & Financial | 6 (27.3%) | 16 (72.7%) |
| Computers, Engineering & Science | 0 (0.0%) | 9 (100.0%) |
| Computers & Mathematics | 0 (0.0%) | 0 (0.0%) |
| Architecture & Engineering | 0 (0.0%) | 9 (100.0%) |
| Life, Physical & Social Science | 0 (0.0%) | 0 (0.0%) |
| Community & Social Service | 25 (36.8%) | 43 (63.2%) |
| Education, Arts & Media | 7 (43.8%) | 9 (56.2%) |
| Legal Services & Support | 0 (0.0%) | 1 (100.0%) |
| Education Instruction & Library | 13 (30.2%) | 30 (69.8%) |
| Arts, Media & Entertainment | 5 (62.5%) | 3 (37.5%) |
| Health Diagnosing & Treating | 19 (57.6%) | 14 (42.4%) |
| Health Technologists | 0 (0.0%) | 10 (100.0%) |
| Total (Category) | 76 (39.4%) | 117 (60.6%) |
| Total (Overall) | 300 (49.1%) | 311 (50.9%) |
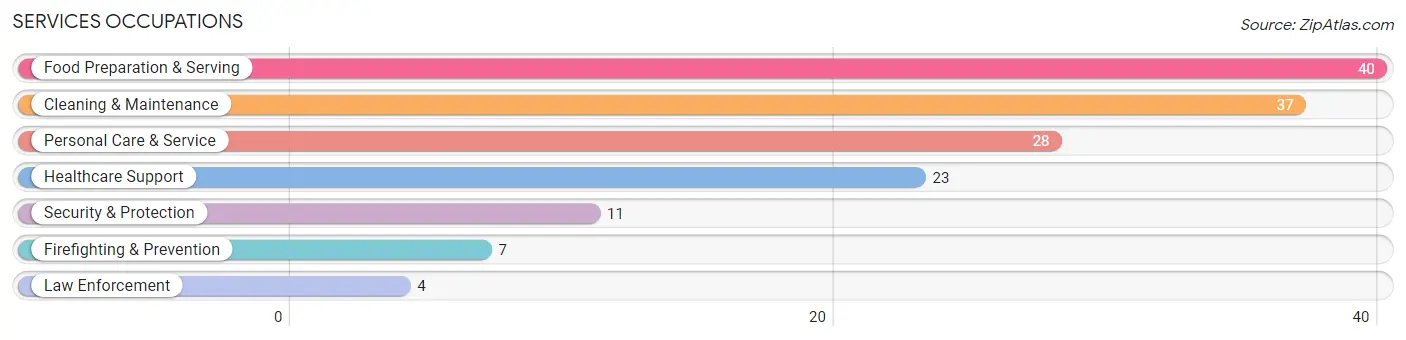
Services Occupations
The most common Services occupations in Locust Grove are Food Preparation & Serving (40 | 6.6%), Cleaning & Maintenance (37 | 6.1%), Personal Care & Service (28 | 4.6%), Healthcare Support (23 | 3.8%), and Security & Protection (11 | 1.8%).
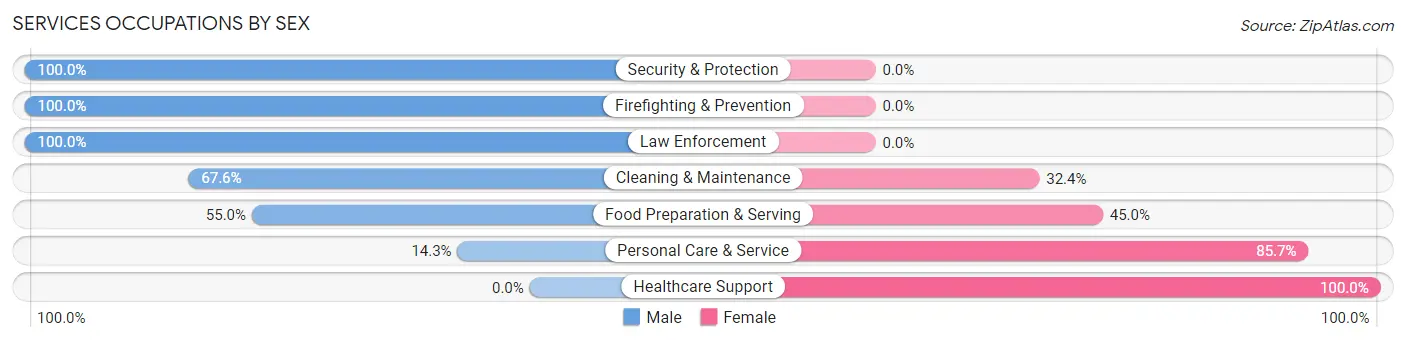
Services Occupations by Sex
Within the Services occupations in Locust Grove, the most male-oriented occupations are Security & Protection (100.0%), Firefighting & Prevention (100.0%), and Law Enforcement (100.0%), while the most female-oriented occupations are Healthcare Support (100.0%), Personal Care & Service (85.7%), and Food Preparation & Serving (45.0%).
| Occupation | Male | Female |
| Healthcare Support | 0 (0.0%) | 23 (100.0%) |
| Security & Protection | 11 (100.0%) | 0 (0.0%) |
| Firefighting & Prevention | 7 (100.0%) | 0 (0.0%) |
| Law Enforcement | 4 (100.0%) | 0 (0.0%) |
| Food Preparation & Serving | 22 (55.0%) | 18 (45.0%) |
| Cleaning & Maintenance | 25 (67.6%) | 12 (32.4%) |
| Personal Care & Service | 4 (14.3%) | 24 (85.7%) |
| Total (Category) | 62 (44.6%) | 77 (55.4%) |
| Total (Overall) | 300 (49.1%) | 311 (50.9%) |
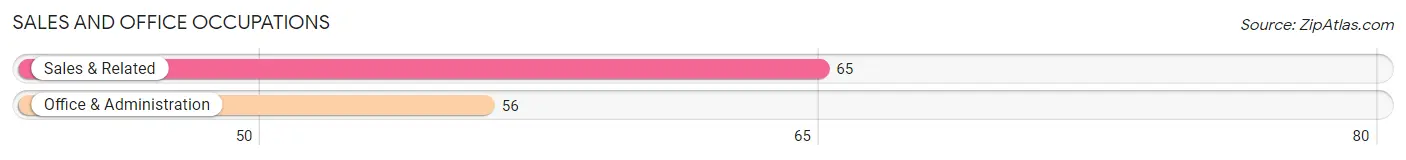
Sales and Office Occupations
The most common Sales and Office occupations in Locust Grove are Sales & Related (65 | 10.6%), and Office & Administration (56 | 9.2%).
Sales and Office Occupations by Sex

| Occupation | Male | Female |
| Sales & Related | 23 (35.4%) | 42 (64.6%) |
| Office & Administration | 10 (17.9%) | 46 (82.1%) |
| Total (Category) | 33 (27.3%) | 88 (72.7%) |
| Total (Overall) | 300 (49.1%) | 311 (50.9%) |
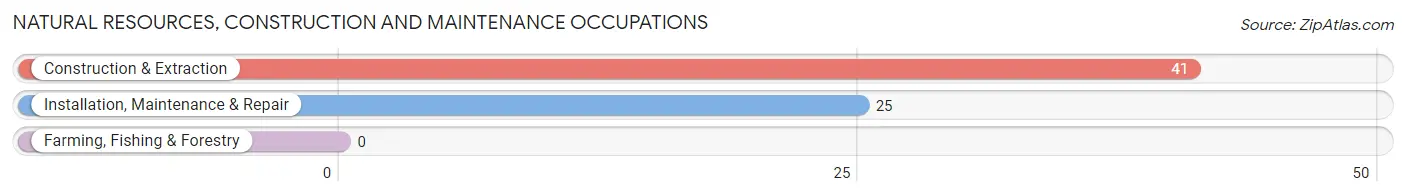
Natural Resources, Construction and Maintenance Occupations
The most common Natural Resources, Construction and Maintenance occupations in Locust Grove are Construction & Extraction (41 | 6.7%), and Installation, Maintenance & Repair (25 | 4.1%).
Natural Resources, Construction and Maintenance Occupations by Sex
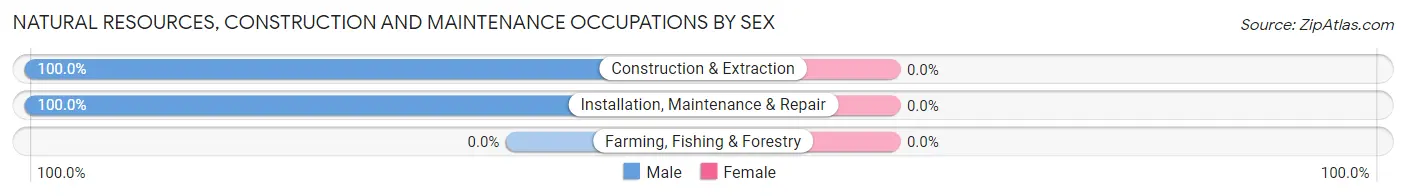
| Occupation | Male | Female |
| Farming, Fishing & Forestry | 0 (0.0%) | 0 (0.0%) |
| Construction & Extraction | 41 (100.0%) | 0 (0.0%) |
| Installation, Maintenance & Repair | 25 (100.0%) | 0 (0.0%) |
| Total (Category) | 66 (100.0%) | 0 (0.0%) |
| Total (Overall) | 300 (49.1%) | 311 (50.9%) |
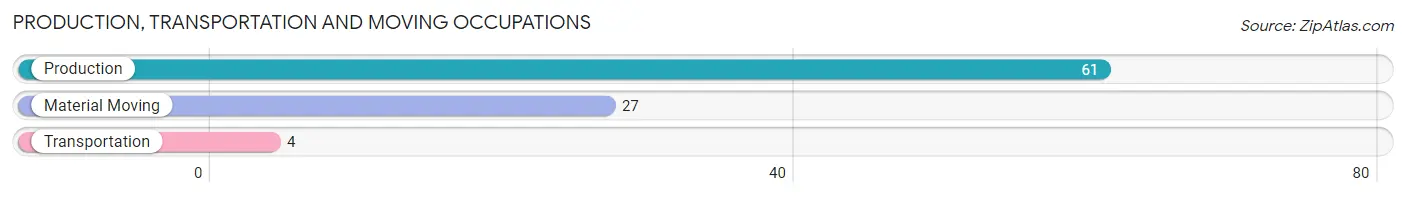
Production, Transportation and Moving Occupations
The most common Production, Transportation and Moving occupations in Locust Grove are Production (61 | 10.0%), Material Moving (27 | 4.4%), and Transportation (4 | 0.6%).
Production, Transportation and Moving Occupations by Sex
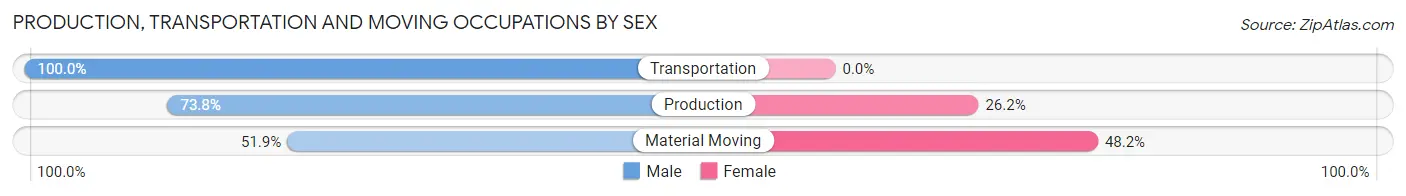
| Occupation | Male | Female |
| Production | 45 (73.8%) | 16 (26.2%) |
| Transportation | 4 (100.0%) | 0 (0.0%) |
| Material Moving | 14 (51.8%) | 13 (48.1%) |
| Total (Category) | 63 (68.5%) | 29 (31.5%) |
| Total (Overall) | 300 (49.1%) | 311 (50.9%) |
Employment Industries by Sex in Locust Grove
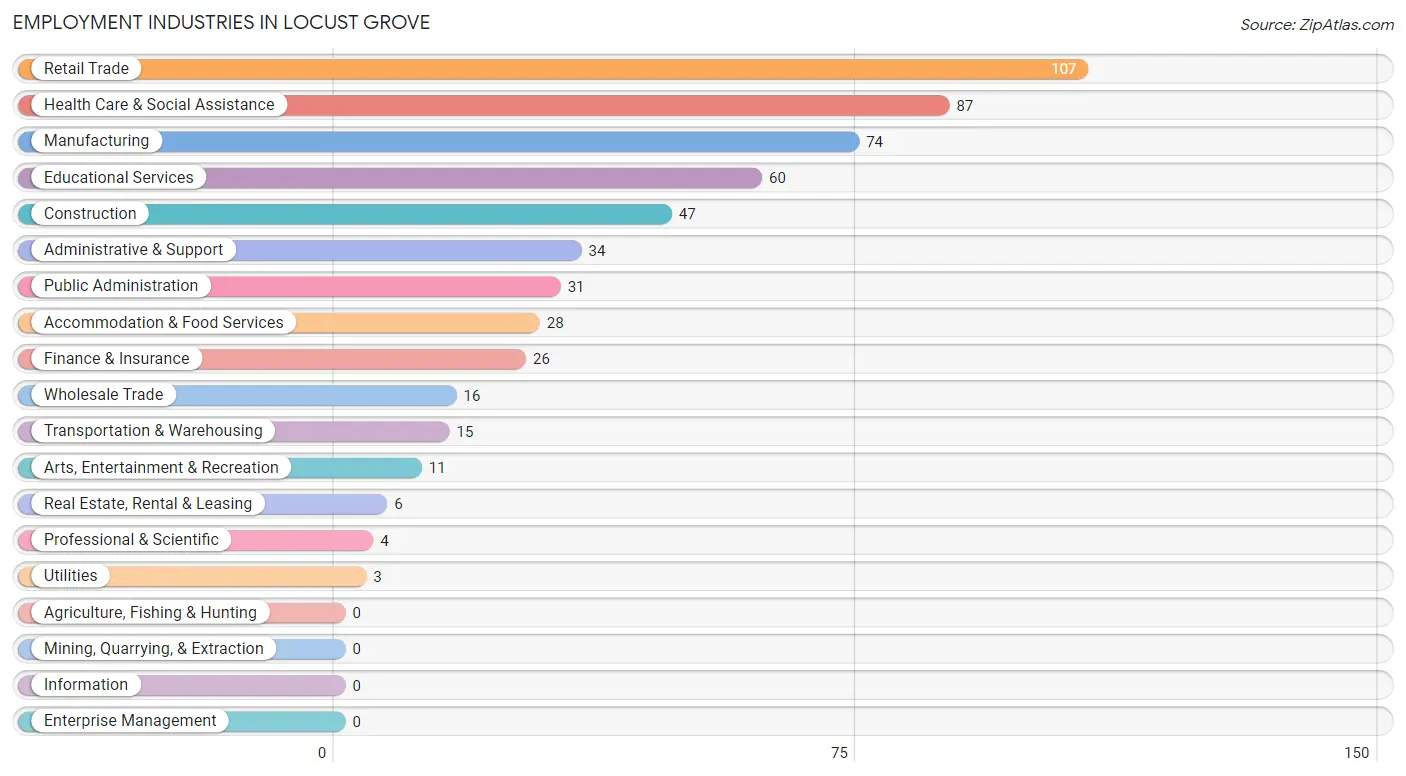
Employment Industries in Locust Grove
The major employment industries in Locust Grove include Retail Trade (107 | 17.5%), Health Care & Social Assistance (87 | 14.2%), Manufacturing (74 | 12.1%), Educational Services (60 | 9.8%), and Construction (47 | 7.7%).
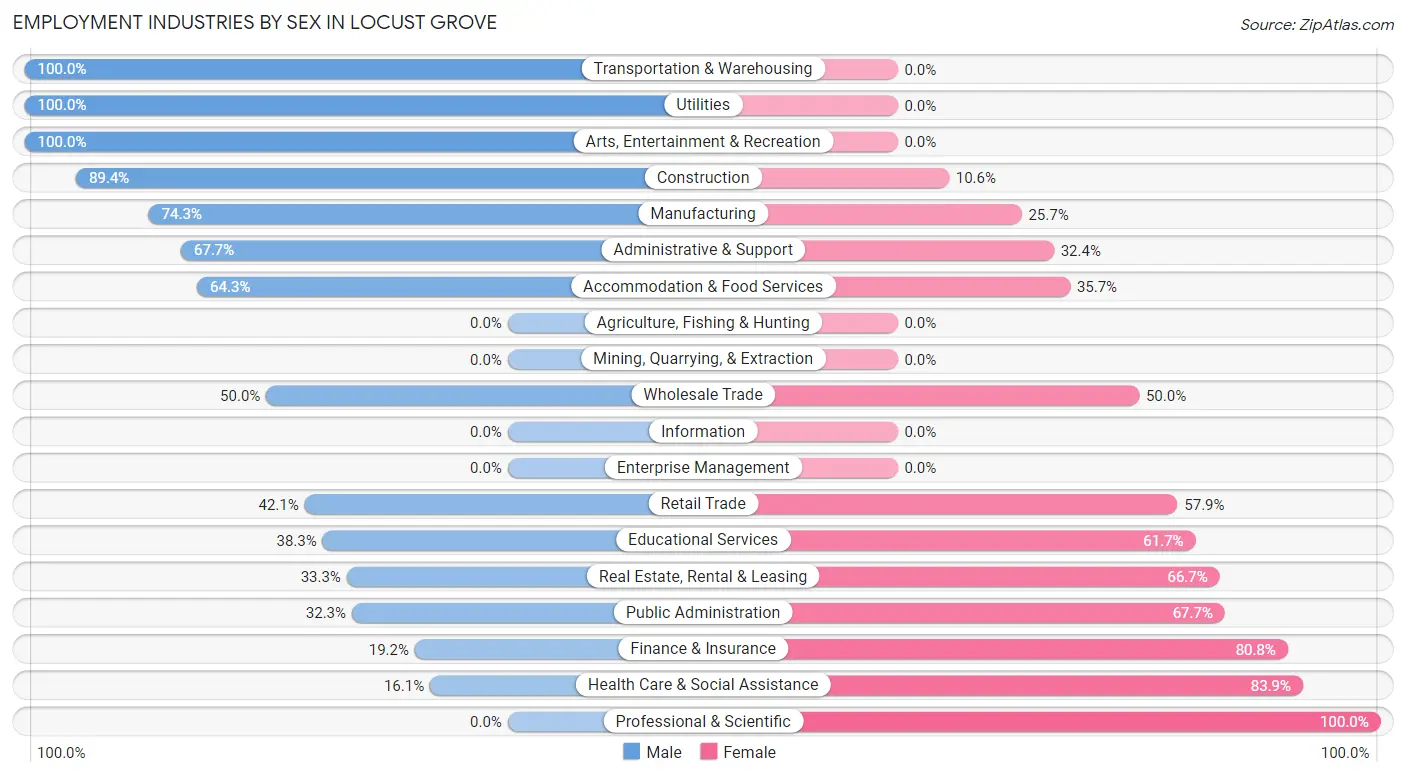
Employment Industries by Sex in Locust Grove
The Locust Grove industries that see more men than women are Transportation & Warehousing (100.0%), Utilities (100.0%), and Arts, Entertainment & Recreation (100.0%), whereas the industries that tend to have a higher number of women are Professional & Scientific (100.0%), Health Care & Social Assistance (83.9%), and Finance & Insurance (80.8%).
| Industry | Male | Female |
| Agriculture, Fishing & Hunting | 0 (0.0%) | 0 (0.0%) |
| Mining, Quarrying, & Extraction | 0 (0.0%) | 0 (0.0%) |
| Construction | 42 (89.4%) | 5 (10.6%) |
| Manufacturing | 55 (74.3%) | 19 (25.7%) |
| Wholesale Trade | 8 (50.0%) | 8 (50.0%) |
| Retail Trade | 45 (42.1%) | 62 (57.9%) |
| Transportation & Warehousing | 15 (100.0%) | 0 (0.0%) |
| Utilities | 3 (100.0%) | 0 (0.0%) |
| Information | 0 (0.0%) | 0 (0.0%) |
| Finance & Insurance | 5 (19.2%) | 21 (80.8%) |
| Real Estate, Rental & Leasing | 2 (33.3%) | 4 (66.7%) |
| Professional & Scientific | 0 (0.0%) | 4 (100.0%) |
| Enterprise Management | 0 (0.0%) | 0 (0.0%) |
| Administrative & Support | 23 (67.6%) | 11 (32.4%) |
| Educational Services | 23 (38.3%) | 37 (61.7%) |
| Health Care & Social Assistance | 14 (16.1%) | 73 (83.9%) |
| Arts, Entertainment & Recreation | 11 (100.0%) | 0 (0.0%) |
| Accommodation & Food Services | 18 (64.3%) | 10 (35.7%) |
| Public Administration | 10 (32.3%) | 21 (67.7%) |
| Total | 300 (49.1%) | 311 (50.9%) |
Education in Locust Grove
School Enrollment in Locust Grove
The most common levels of schooling among the 362 students in Locust Grove are high school (123 | 34.0%), middle school (69 | 19.1%), and elementary school (52 | 14.4%).
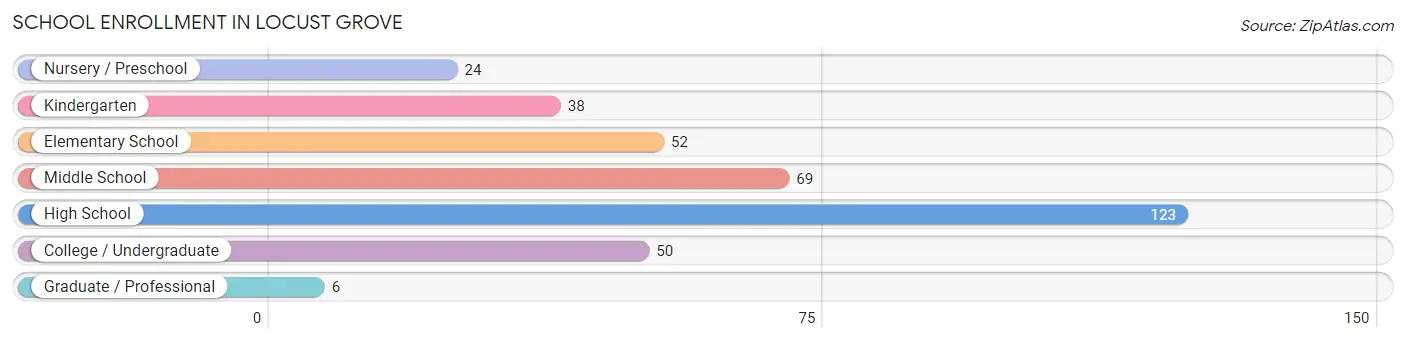
| School Level | # Students | % Students |
| Nursery / Preschool | 24 | 6.6% |
| Kindergarten | 38 | 10.5% |
| Elementary School | 52 | 14.4% |
| Middle School | 69 | 19.1% |
| High School | 123 | 34.0% |
| College / Undergraduate | 50 | 13.8% |
| Graduate / Professional | 6 | 1.7% |
| Total | 362 | 100.0% |
School Enrollment by Age by Funding Source in Locust Grove
Out of a total of 362 students who are enrolled in schools in Locust Grove, 9 (2.5%) attend a private institution, while the remaining 353 (97.5%) are enrolled in public schools. The age group of 10 to 14 year olds has the highest likelihood of being enrolled in private schools, with 3 (3.7% in the age bracket) enrolled. Conversely, the age group of 3 to 4 year olds has the lowest likelihood of being enrolled in a private school, with 14 (100.0% in the age bracket) attending a public institution.
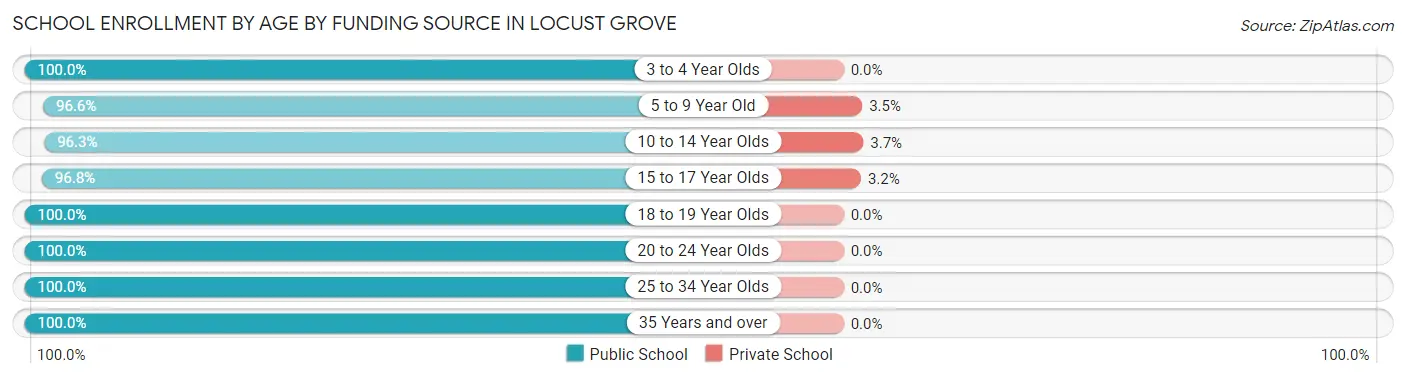
| Age Bracket | Public School | Private School |
| 3 to 4 Year Olds | 14 (100.0%) | 0 (0.0%) |
| 5 to 9 Year Old | 84 (96.6%) | 3 (3.5%) |
| 10 to 14 Year Olds | 79 (96.3%) | 3 (3.7%) |
| 15 to 17 Year Olds | 90 (96.8%) | 3 (3.2%) |
| 18 to 19 Year Olds | 43 (100.0%) | 0 (0.0%) |
| 20 to 24 Year Olds | 37 (100.0%) | 0 (0.0%) |
| 25 to 34 Year Olds | 2 (100.0%) | 0 (0.0%) |
| 35 Years and over | 4 (100.0%) | 0 (0.0%) |
| Total | 353 (97.5%) | 9 (2.5%) |
Educational Attainment by Field of Study in Locust Grove
Education (47 | 43.1%), arts & humanities (20 | 18.3%), science & technology (14 | 12.8%), business (9 | 8.3%), and bio, nature & agricultural (4 | 3.7%) are the most common fields of study among 109 individuals in Locust Grove who have obtained a bachelor's degree or higher.
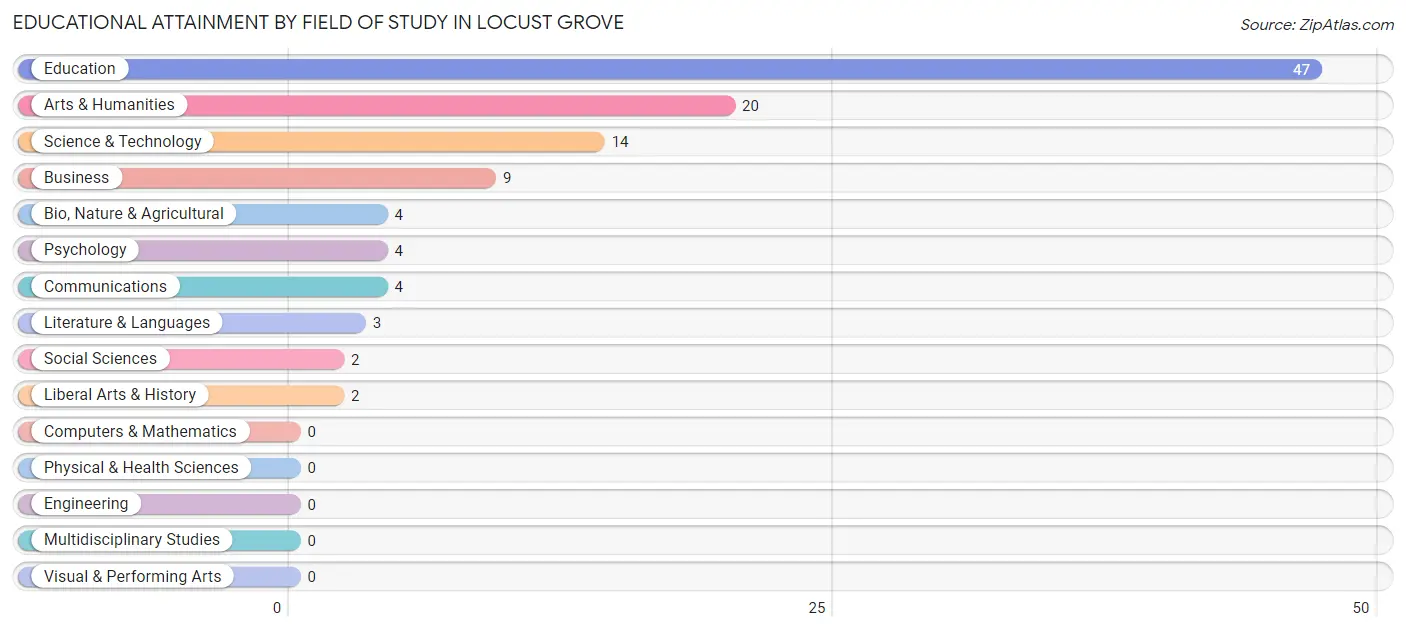
| Field of Study | # Graduates | % Graduates |
| Computers & Mathematics | 0 | 0.0% |
| Bio, Nature & Agricultural | 4 | 3.7% |
| Physical & Health Sciences | 0 | 0.0% |
| Psychology | 4 | 3.7% |
| Social Sciences | 2 | 1.8% |
| Engineering | 0 | 0.0% |
| Multidisciplinary Studies | 0 | 0.0% |
| Science & Technology | 14 | 12.8% |
| Business | 9 | 8.3% |
| Education | 47 | 43.1% |
| Literature & Languages | 3 | 2.8% |
| Liberal Arts & History | 2 | 1.8% |
| Visual & Performing Arts | 0 | 0.0% |
| Communications | 4 | 3.7% |
| Arts & Humanities | 20 | 18.3% |
| Total | 109 | 100.0% |
Transportation & Commute in Locust Grove
Vehicle Availability by Sex in Locust Grove
The most prevalent vehicle ownership categories in Locust Grove are males with 2 vehicles (144, accounting for 47.7%) and females with 2 vehicles (91, making up 46.8%).
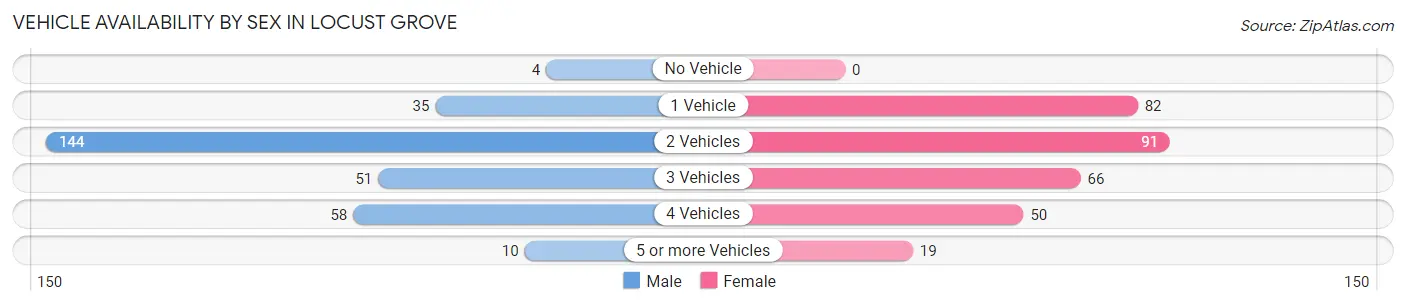
| Vehicles Available | Male | Female |
| No Vehicle | 4 (1.3%) | 0 (0.0%) |
| 1 Vehicle | 35 (11.6%) | 82 (26.6%) |
| 2 Vehicles | 144 (47.7%) | 91 (29.5%) |
| 3 Vehicles | 51 (16.9%) | 66 (21.4%) |
| 4 Vehicles | 58 (19.2%) | 50 (16.2%) |
| 5 or more Vehicles | 10 (3.3%) | 19 (6.2%) |
| Total | 302 (100.0%) | 308 (100.0%) |
Commute Time in Locust Grove
The most frequently occuring commute durations in Locust Grove are less than 5 minutes (108 commuters, 19.1%), 15 to 19 minutes (91 commuters, 16.1%), and 5 to 9 minutes (72 commuters, 12.7%).
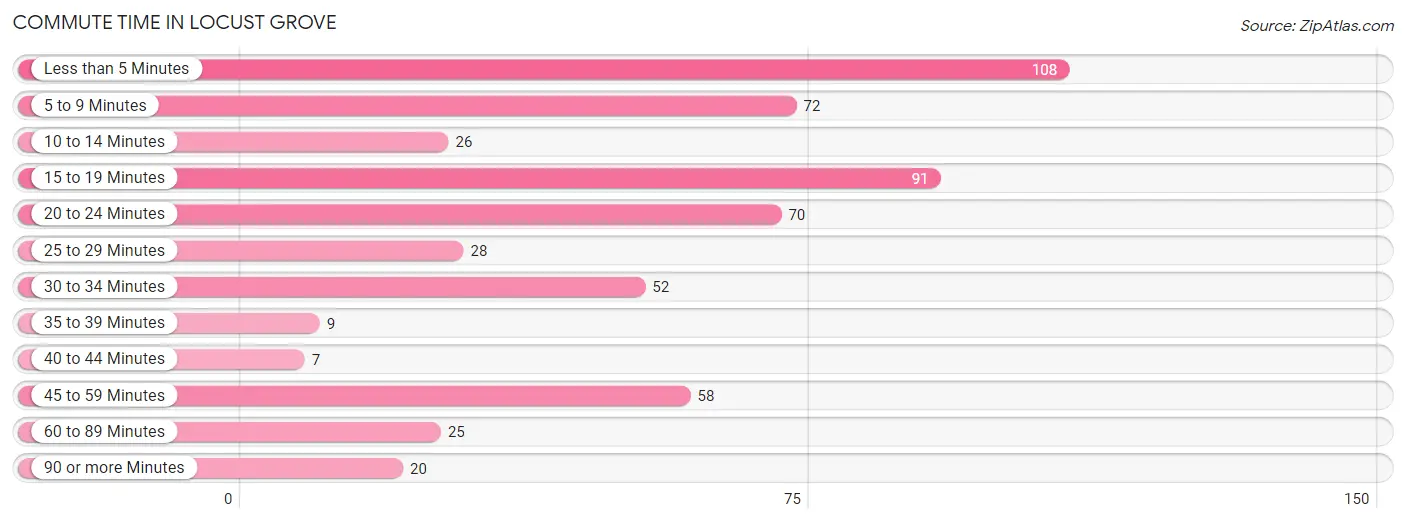
| Commute Time | # Commuters | % Commuters |
| Less than 5 Minutes | 108 | 19.1% |
| 5 to 9 Minutes | 72 | 12.7% |
| 10 to 14 Minutes | 26 | 4.6% |
| 15 to 19 Minutes | 91 | 16.1% |
| 20 to 24 Minutes | 70 | 12.4% |
| 25 to 29 Minutes | 28 | 5.0% |
| 30 to 34 Minutes | 52 | 9.2% |
| 35 to 39 Minutes | 9 | 1.6% |
| 40 to 44 Minutes | 7 | 1.2% |
| 45 to 59 Minutes | 58 | 10.2% |
| 60 to 89 Minutes | 25 | 4.4% |
| 90 or more Minutes | 20 | 3.5% |
Commute Time by Sex in Locust Grove
The most common commute times in Locust Grove are 15 to 19 minutes (50 commuters, 18.1%) for males and less than 5 minutes (65 commuters, 22.4%) for females.
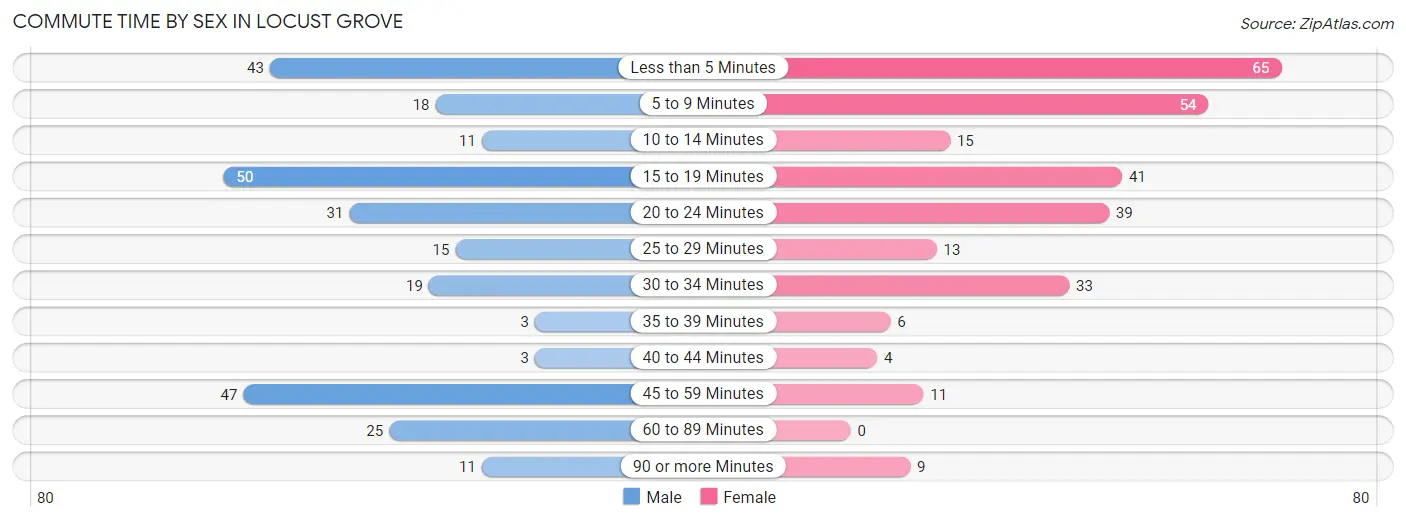
| Commute Time | Male | Female |
| Less than 5 Minutes | 43 (15.6%) | 65 (22.4%) |
| 5 to 9 Minutes | 18 (6.5%) | 54 (18.6%) |
| 10 to 14 Minutes | 11 (4.0%) | 15 (5.2%) |
| 15 to 19 Minutes | 50 (18.1%) | 41 (14.1%) |
| 20 to 24 Minutes | 31 (11.2%) | 39 (13.5%) |
| 25 to 29 Minutes | 15 (5.4%) | 13 (4.5%) |
| 30 to 34 Minutes | 19 (6.9%) | 33 (11.4%) |
| 35 to 39 Minutes | 3 (1.1%) | 6 (2.1%) |
| 40 to 44 Minutes | 3 (1.1%) | 4 (1.4%) |
| 45 to 59 Minutes | 47 (17.0%) | 11 (3.8%) |
| 60 to 89 Minutes | 25 (9.1%) | 0 (0.0%) |
| 90 or more Minutes | 11 (4.0%) | 9 (3.1%) |
Time of Departure to Work by Sex in Locust Grove
The most frequent times of departure to work in Locust Grove are 5:30 AM to 5:59 AM (42, 15.2%) for males and 7:00 AM to 7:29 AM (57, 19.7%) for females.
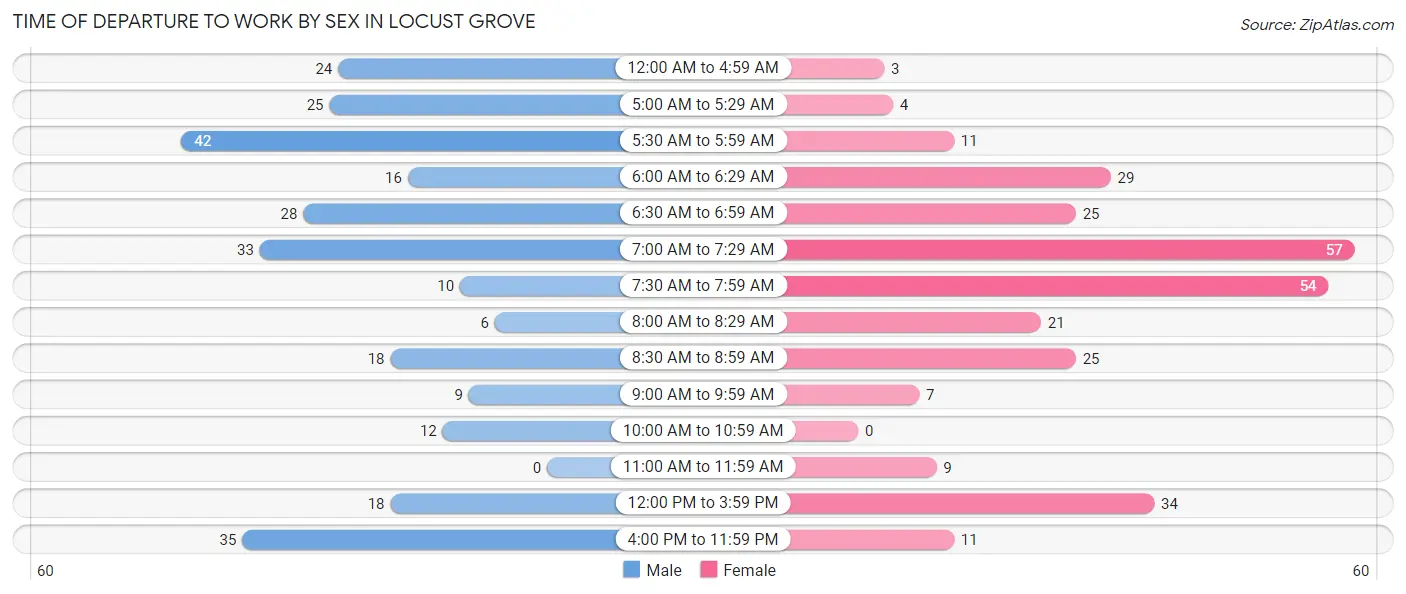
| Time of Departure | Male | Female |
| 12:00 AM to 4:59 AM | 24 (8.7%) | 3 (1.0%) |
| 5:00 AM to 5:29 AM | 25 (9.1%) | 4 (1.4%) |
| 5:30 AM to 5:59 AM | 42 (15.2%) | 11 (3.8%) |
| 6:00 AM to 6:29 AM | 16 (5.8%) | 29 (10.0%) |
| 6:30 AM to 6:59 AM | 28 (10.1%) | 25 (8.6%) |
| 7:00 AM to 7:29 AM | 33 (12.0%) | 57 (19.7%) |
| 7:30 AM to 7:59 AM | 10 (3.6%) | 54 (18.6%) |
| 8:00 AM to 8:29 AM | 6 (2.2%) | 21 (7.2%) |
| 8:30 AM to 8:59 AM | 18 (6.5%) | 25 (8.6%) |
| 9:00 AM to 9:59 AM | 9 (3.3%) | 7 (2.4%) |
| 10:00 AM to 10:59 AM | 12 (4.3%) | 0 (0.0%) |
| 11:00 AM to 11:59 AM | 0 (0.0%) | 9 (3.1%) |
| 12:00 PM to 3:59 PM | 18 (6.5%) | 34 (11.7%) |
| 4:00 PM to 11:59 PM | 35 (12.7%) | 11 (3.8%) |
| Total | 276 (100.0%) | 290 (100.0%) |
Housing Occupancy in Locust Grove
Occupancy by Ownership in Locust Grove
Of the total 557 dwellings in Locust Grove, owner-occupied units account for 320 (57.5%), while renter-occupied units make up 237 (42.5%).
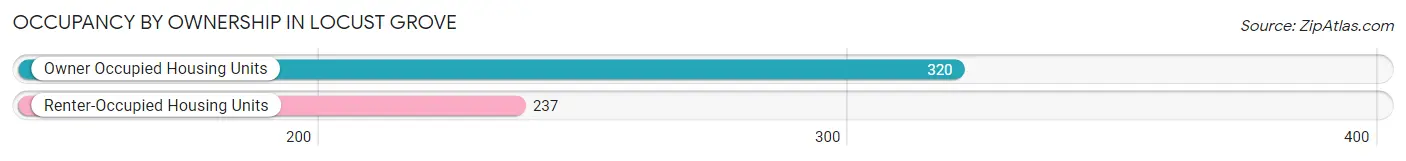
| Occupancy | # Housing Units | % Housing Units |
| Owner Occupied Housing Units | 320 | 57.5% |
| Renter-Occupied Housing Units | 237 | 42.5% |
| Total Occupied Housing Units | 557 | 100.0% |
Occupancy by Household Size in Locust Grove
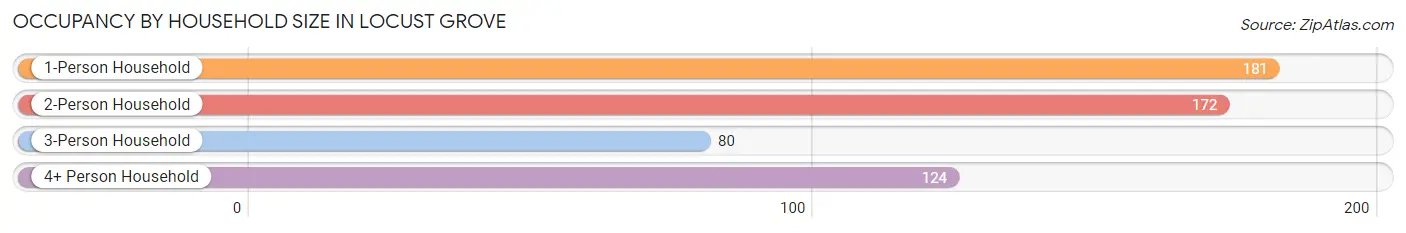
| Household Size | # Housing Units | % Housing Units |
| 1-Person Household | 181 | 32.5% |
| 2-Person Household | 172 | 30.9% |
| 3-Person Household | 80 | 14.4% |
| 4+ Person Household | 124 | 22.3% |
| Total Housing Units | 557 | 100.0% |
Occupancy by Ownership by Household Size in Locust Grove
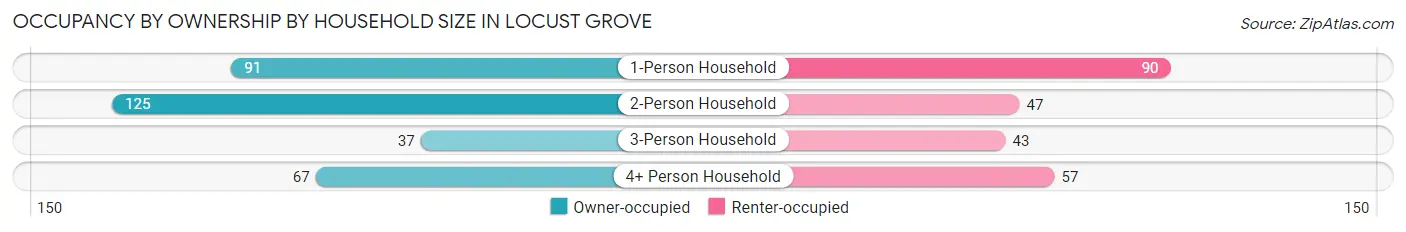
| Household Size | Owner-occupied | Renter-occupied |
| 1-Person Household | 91 (50.3%) | 90 (49.7%) |
| 2-Person Household | 125 (72.7%) | 47 (27.3%) |
| 3-Person Household | 37 (46.3%) | 43 (53.7%) |
| 4+ Person Household | 67 (54.0%) | 57 (46.0%) |
| Total Housing Units | 320 (57.5%) | 237 (42.5%) |
Occupancy by Educational Attainment in Locust Grove
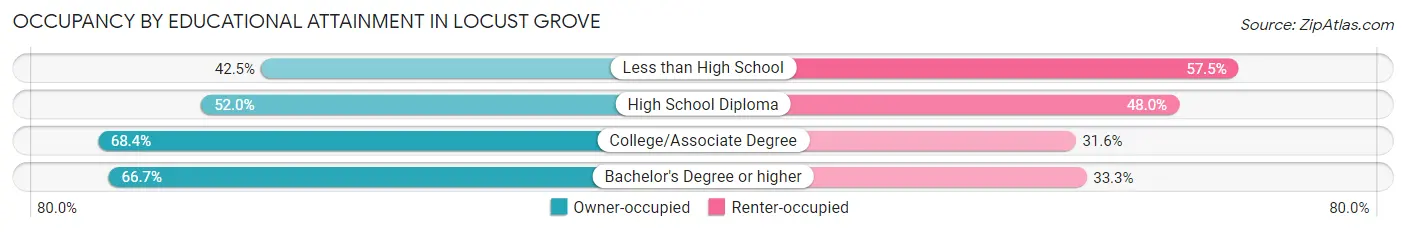
| Household Size | Owner-occupied | Renter-occupied |
| Less than High School | 37 (42.5%) | 50 (57.5%) |
| High School Diploma | 118 (52.0%) | 109 (48.0%) |
| College/Associate Degree | 119 (68.4%) | 55 (31.6%) |
| Bachelor's Degree or higher | 46 (66.7%) | 23 (33.3%) |
Occupancy by Age of Householder in Locust Grove
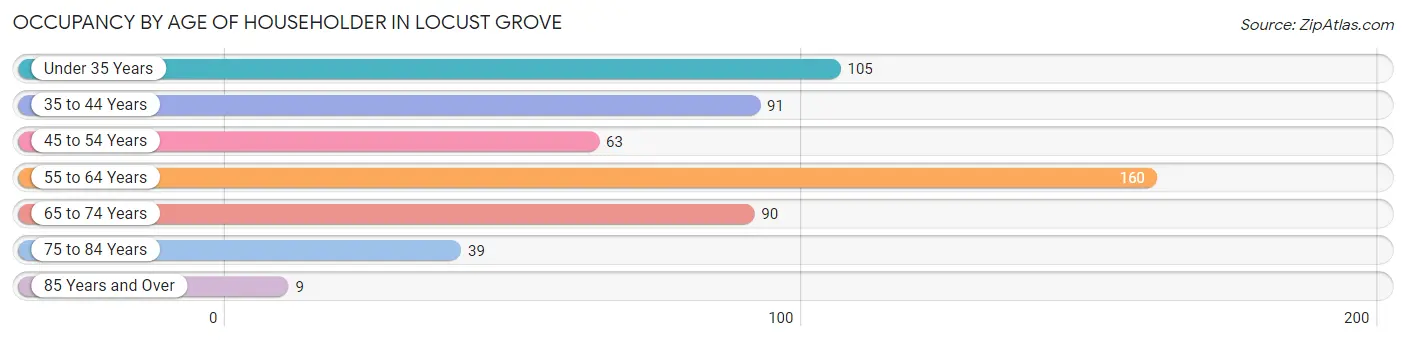
| Age Bracket | # Households | % Households |
| Under 35 Years | 105 | 18.9% |
| 35 to 44 Years | 91 | 16.3% |
| 45 to 54 Years | 63 | 11.3% |
| 55 to 64 Years | 160 | 28.7% |
| 65 to 74 Years | 90 | 16.2% |
| 75 to 84 Years | 39 | 7.0% |
| 85 Years and Over | 9 | 1.6% |
| Total | 557 | 100.0% |
Housing Finances in Locust Grove
Median Income by Occupancy in Locust Grove

| Occupancy Type | # Households | Median Income |
| Owner-Occupied | 320 (57.5%) | $50,921 |
| Renter-Occupied | 237 (42.5%) | $29,018 |
| Average | 557 (100.0%) | $41,313 |
Occupancy by Householder Income Bracket in Locust Grove
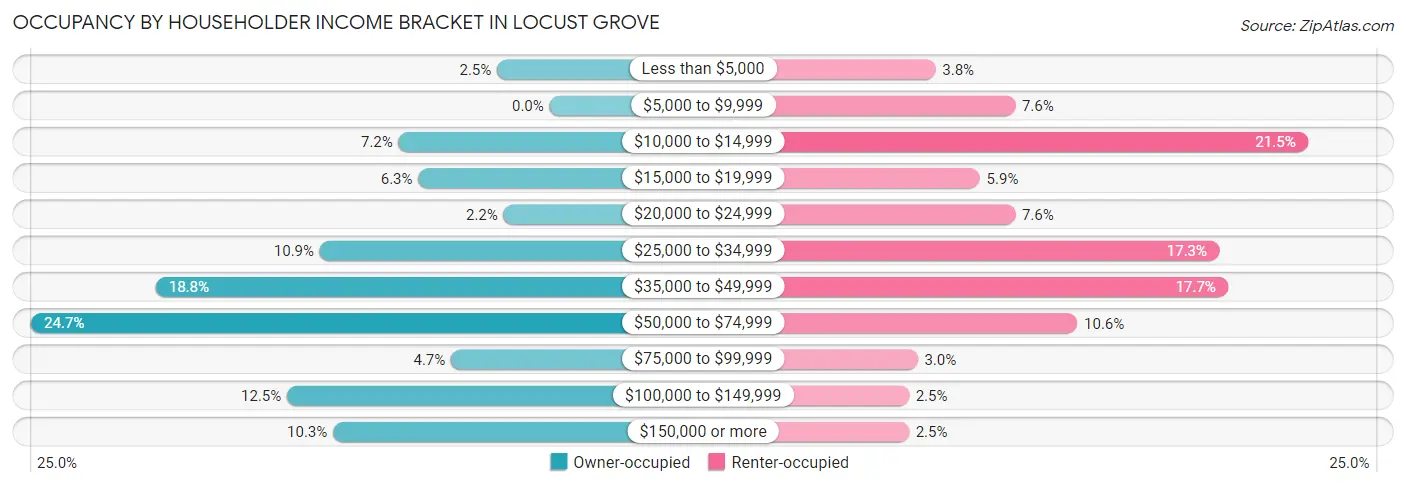
| Income Bracket | Owner-occupied | Renter-occupied |
| Less than $5,000 | 8 (2.5%) | 9 (3.8%) |
| $5,000 to $9,999 | 0 (0.0%) | 18 (7.6%) |
| $10,000 to $14,999 | 23 (7.2%) | 51 (21.5%) |
| $15,000 to $19,999 | 20 (6.2%) | 14 (5.9%) |
| $20,000 to $24,999 | 7 (2.2%) | 18 (7.6%) |
| $25,000 to $34,999 | 35 (10.9%) | 41 (17.3%) |
| $35,000 to $49,999 | 60 (18.8%) | 42 (17.7%) |
| $50,000 to $74,999 | 79 (24.7%) | 25 (10.5%) |
| $75,000 to $99,999 | 15 (4.7%) | 7 (2.9%) |
| $100,000 to $149,999 | 40 (12.5%) | 6 (2.5%) |
| $150,000 or more | 33 (10.3%) | 6 (2.5%) |
| Total | 320 (100.0%) | 237 (100.0%) |
Monthly Housing Cost Tiers in Locust Grove
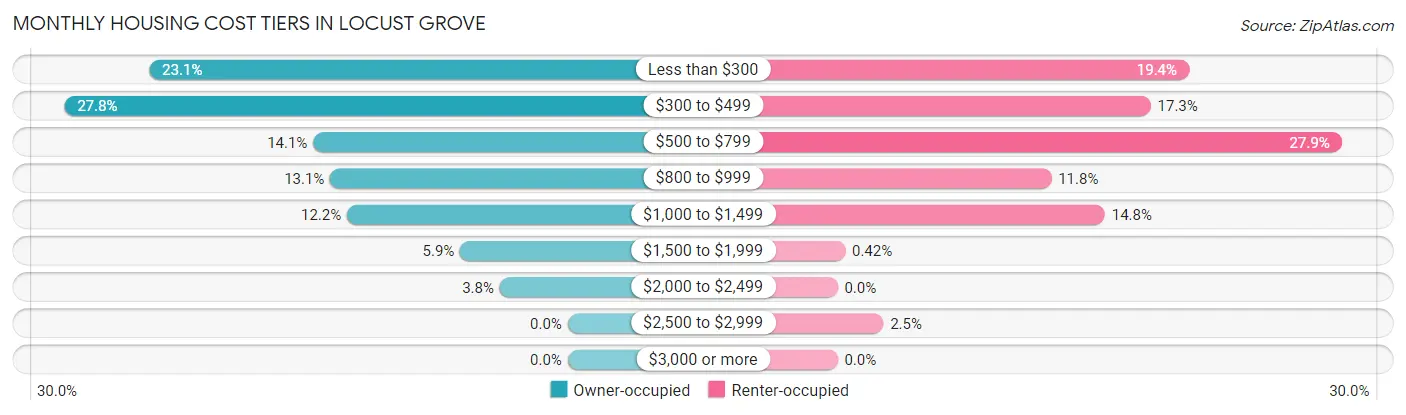
| Monthly Cost | Owner-occupied | Renter-occupied |
| Less than $300 | 74 (23.1%) | 46 (19.4%) |
| $300 to $499 | 89 (27.8%) | 41 (17.3%) |
| $500 to $799 | 45 (14.1%) | 66 (27.9%) |
| $800 to $999 | 42 (13.1%) | 28 (11.8%) |
| $1,000 to $1,499 | 39 (12.2%) | 35 (14.8%) |
| $1,500 to $1,999 | 19 (5.9%) | 1 (0.4%) |
| $2,000 to $2,499 | 12 (3.7%) | 0 (0.0%) |
| $2,500 to $2,999 | 0 (0.0%) | 6 (2.5%) |
| $3,000 or more | 0 (0.0%) | 0 (0.0%) |
| Total | 320 (100.0%) | 237 (100.0%) |
Physical Housing Characteristics in Locust Grove
Housing Structures in Locust Grove
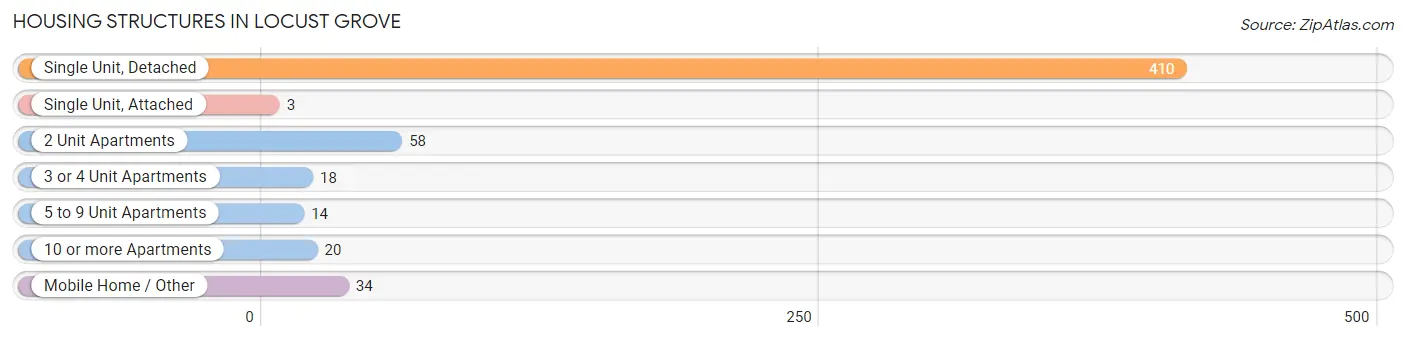
| Structure Type | # Housing Units | % Housing Units |
| Single Unit, Detached | 410 | 73.6% |
| Single Unit, Attached | 3 | 0.5% |
| 2 Unit Apartments | 58 | 10.4% |
| 3 or 4 Unit Apartments | 18 | 3.2% |
| 5 to 9 Unit Apartments | 14 | 2.5% |
| 10 or more Apartments | 20 | 3.6% |
| Mobile Home / Other | 34 | 6.1% |
| Total | 557 | 100.0% |
Housing Structures by Occupancy in Locust Grove
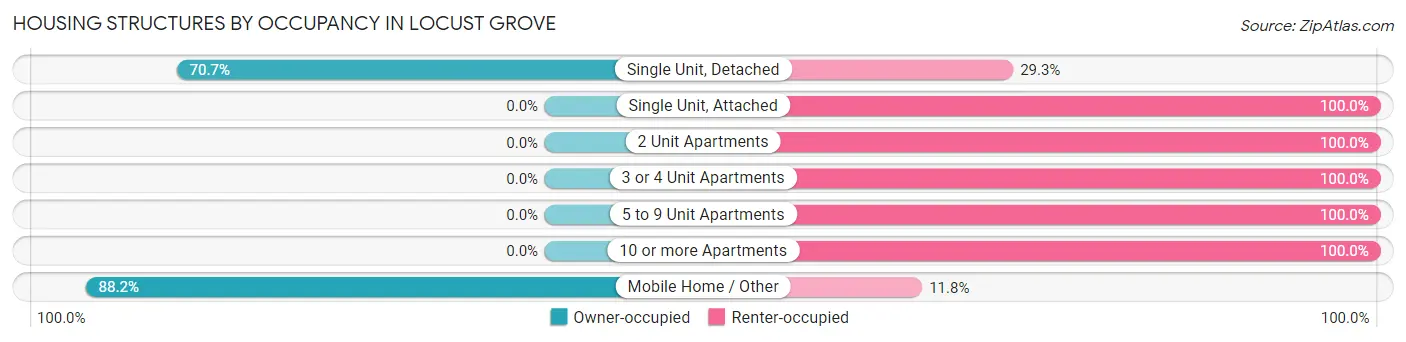
| Structure Type | Owner-occupied | Renter-occupied |
| Single Unit, Detached | 290 (70.7%) | 120 (29.3%) |
| Single Unit, Attached | 0 (0.0%) | 3 (100.0%) |
| 2 Unit Apartments | 0 (0.0%) | 58 (100.0%) |
| 3 or 4 Unit Apartments | 0 (0.0%) | 18 (100.0%) |
| 5 to 9 Unit Apartments | 0 (0.0%) | 14 (100.0%) |
| 10 or more Apartments | 0 (0.0%) | 20 (100.0%) |
| Mobile Home / Other | 30 (88.2%) | 4 (11.8%) |
| Total | 320 (57.5%) | 237 (42.5%) |
Housing Structures by Number of Rooms in Locust Grove
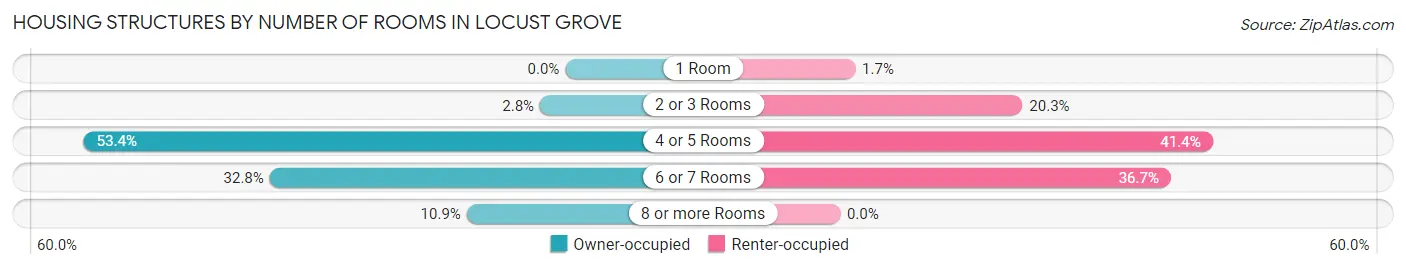
| Number of Rooms | Owner-occupied | Renter-occupied |
| 1 Room | 0 (0.0%) | 4 (1.7%) |
| 2 or 3 Rooms | 9 (2.8%) | 48 (20.3%) |
| 4 or 5 Rooms | 171 (53.4%) | 98 (41.3%) |
| 6 or 7 Rooms | 105 (32.8%) | 87 (36.7%) |
| 8 or more Rooms | 35 (10.9%) | 0 (0.0%) |
| Total | 320 (100.0%) | 237 (100.0%) |
Housing Structure by Heating Type in Locust Grove
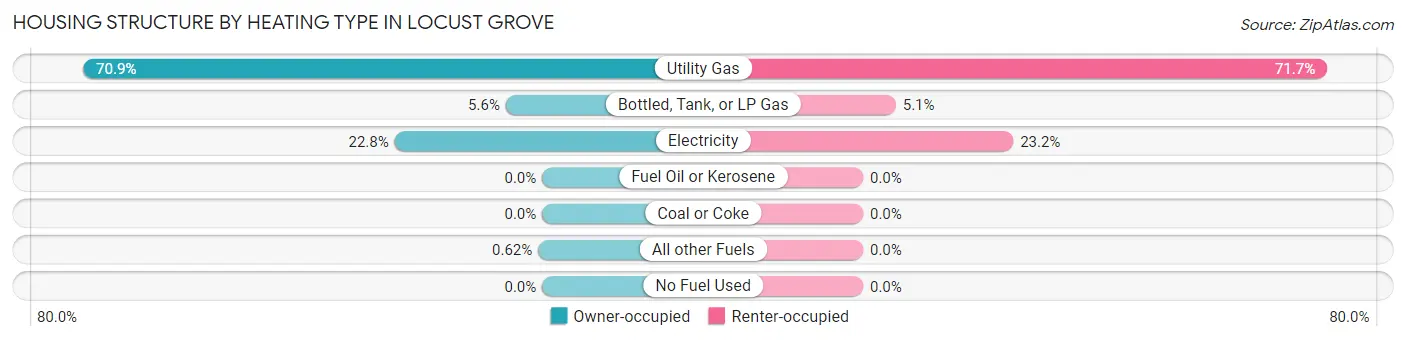
| Heating Type | Owner-occupied | Renter-occupied |
| Utility Gas | 227 (70.9%) | 170 (71.7%) |
| Bottled, Tank, or LP Gas | 18 (5.6%) | 12 (5.1%) |
| Electricity | 73 (22.8%) | 55 (23.2%) |
| Fuel Oil or Kerosene | 0 (0.0%) | 0 (0.0%) |
| Coal or Coke | 0 (0.0%) | 0 (0.0%) |
| All other Fuels | 2 (0.6%) | 0 (0.0%) |
| No Fuel Used | 0 (0.0%) | 0 (0.0%) |
| Total | 320 (100.0%) | 237 (100.0%) |
Household Vehicle Usage in Locust Grove
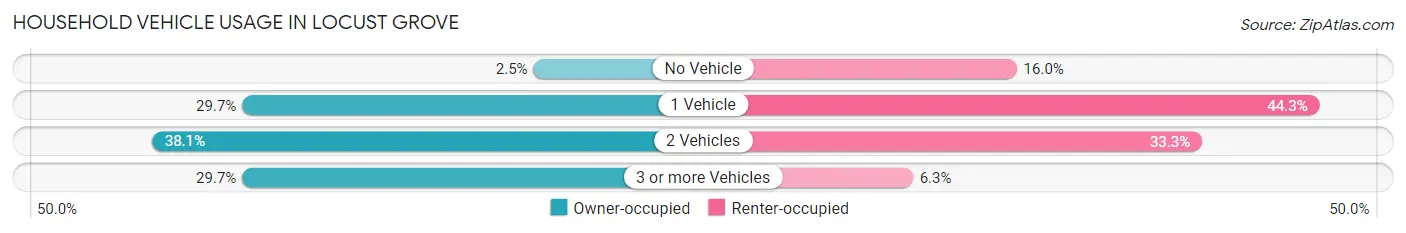
| Vehicles per Household | Owner-occupied | Renter-occupied |
| No Vehicle | 8 (2.5%) | 38 (16.0%) |
| 1 Vehicle | 95 (29.7%) | 105 (44.3%) |
| 2 Vehicles | 122 (38.1%) | 79 (33.3%) |
| 3 or more Vehicles | 95 (29.7%) | 15 (6.3%) |
| Total | 320 (100.0%) | 237 (100.0%) |
Real Estate & Mortgages in Locust Grove
Real Estate and Mortgage Overview in Locust Grove
| Characteristic | Without Mortgage | With Mortgage |
| Housing Units | 197 | 123 |
| Median Property Value | $83,500 | $137,500 |
| Median Household Income | $45,592 | $9 |
| Monthly Housing Costs | $368 | $0 |
| Real Estate Taxes | $545 | $21 |
Property Value by Mortgage Status in Locust Grove
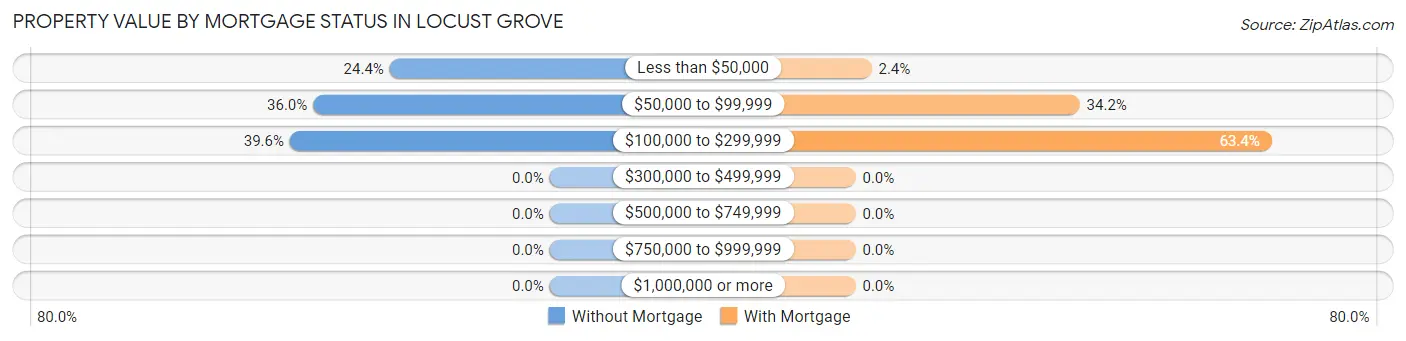
| Property Value | Without Mortgage | With Mortgage |
| Less than $50,000 | 48 (24.4%) | 3 (2.4%) |
| $50,000 to $99,999 | 71 (36.0%) | 42 (34.2%) |
| $100,000 to $299,999 | 78 (39.6%) | 78 (63.4%) |
| $300,000 to $499,999 | 0 (0.0%) | 0 (0.0%) |
| $500,000 to $749,999 | 0 (0.0%) | 0 (0.0%) |
| $750,000 to $999,999 | 0 (0.0%) | 0 (0.0%) |
| $1,000,000 or more | 0 (0.0%) | 0 (0.0%) |
| Total | 197 (100.0%) | 123 (100.0%) |
Household Income by Mortgage Status in Locust Grove
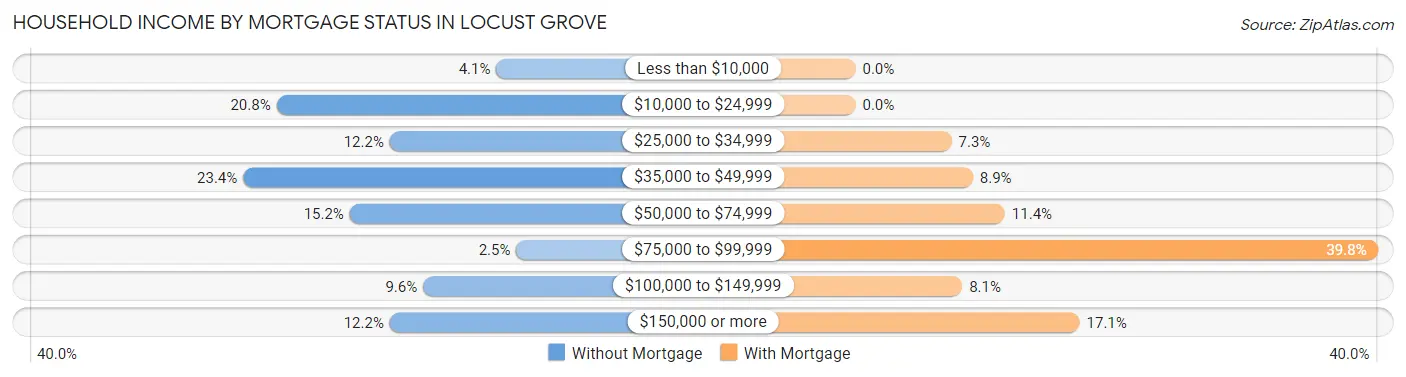
| Household Income | Without Mortgage | With Mortgage |
| Less than $10,000 | 8 (4.1%) | 0 (0.0%) |
| $10,000 to $24,999 | 41 (20.8%) | 0 (0.0%) |
| $25,000 to $34,999 | 24 (12.2%) | 9 (7.3%) |
| $35,000 to $49,999 | 46 (23.4%) | 11 (8.9%) |
| $50,000 to $74,999 | 30 (15.2%) | 14 (11.4%) |
| $75,000 to $99,999 | 5 (2.5%) | 49 (39.8%) |
| $100,000 to $149,999 | 19 (9.6%) | 10 (8.1%) |
| $150,000 or more | 24 (12.2%) | 21 (17.1%) |
| Total | 197 (100.0%) | 123 (100.0%) |
Property Value to Household Income Ratio in Locust Grove
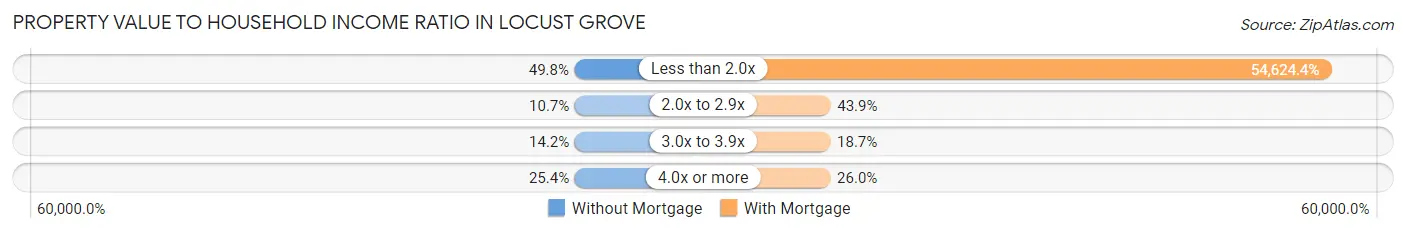
| Value-to-Income Ratio | Without Mortgage | With Mortgage |
| Less than 2.0x | 98 (49.7%) | 67,188 (54,624.4%) |
| 2.0x to 2.9x | 21 (10.7%) | 54 (43.9%) |
| 3.0x to 3.9x | 28 (14.2%) | 23 (18.7%) |
| 4.0x or more | 50 (25.4%) | 32 (26.0%) |
| Total | 197 (100.0%) | 123 (100.0%) |
Real Estate Taxes by Mortgage Status in Locust Grove
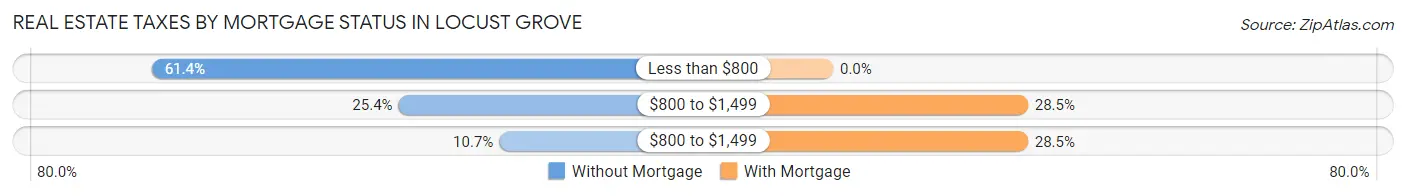
| Property Taxes | Without Mortgage | With Mortgage |
| Less than $800 | 121 (61.4%) | 0 (0.0%) |
| $800 to $1,499 | 50 (25.4%) | 35 (28.5%) |
| $800 to $1,499 | 21 (10.7%) | 35 (28.5%) |
| Total | 197 (100.0%) | 123 (100.0%) |
Health & Disability in Locust Grove
Health Insurance Coverage by Age in Locust Grove
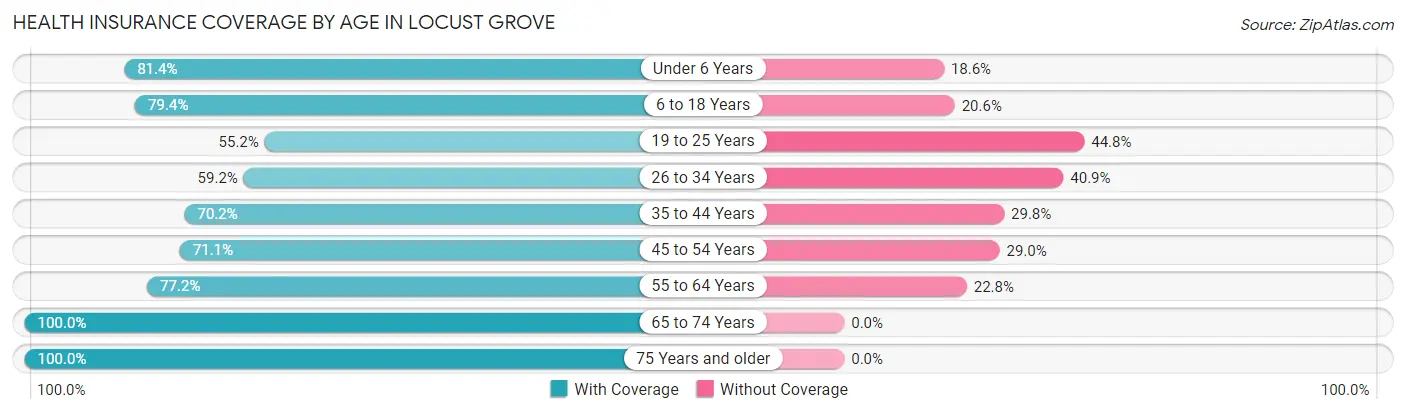
| Age Bracket | With Coverage | Without Coverage |
| Under 6 Years | 92 (81.4%) | 21 (18.6%) |
| 6 to 18 Years | 216 (79.4%) | 56 (20.6%) |
| 19 to 25 Years | 79 (55.2%) | 64 (44.8%) |
| 26 to 34 Years | 84 (59.2%) | 58 (40.8%) |
| 35 to 44 Years | 139 (70.2%) | 59 (29.8%) |
| 45 to 54 Years | 108 (71.1%) | 44 (28.9%) |
| 55 to 64 Years | 152 (77.2%) | 45 (22.8%) |
| 65 to 74 Years | 147 (100.0%) | 0 (0.0%) |
| 75 Years and older | 54 (100.0%) | 0 (0.0%) |
| Total | 1,071 (75.5%) | 347 (24.5%) |
Health Insurance Coverage by Citizenship Status in Locust Grove
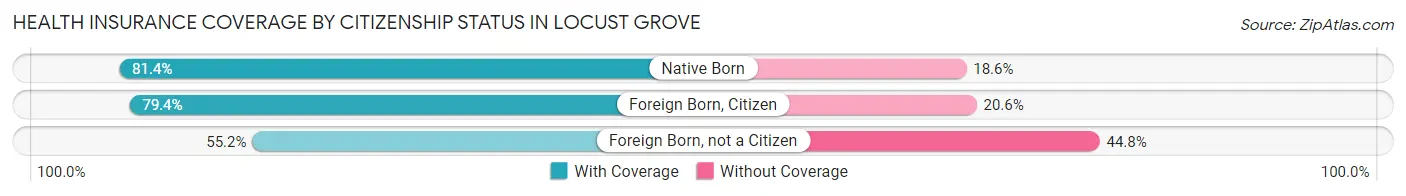
| Citizenship Status | With Coverage | Without Coverage |
| Native Born | 92 (81.4%) | 21 (18.6%) |
| Foreign Born, Citizen | 216 (79.4%) | 56 (20.6%) |
| Foreign Born, not a Citizen | 79 (55.2%) | 64 (44.8%) |
Health Insurance Coverage by Household Income in Locust Grove
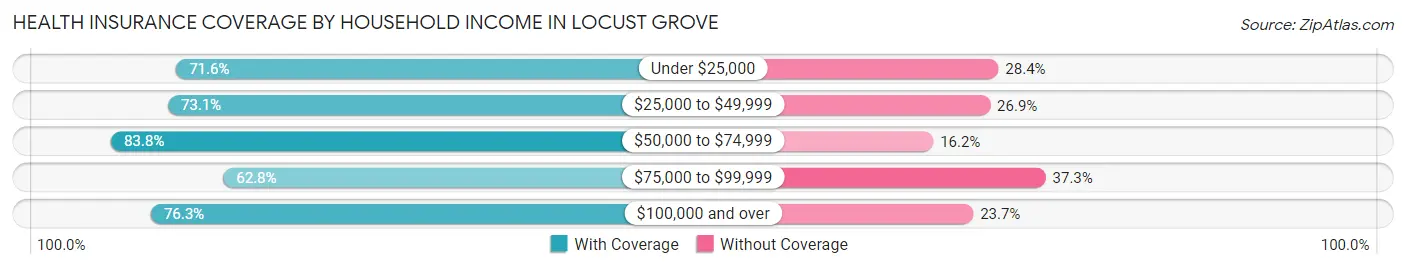
| Household Income | With Coverage | Without Coverage |
| Under $25,000 | 189 (71.6%) | 75 (28.4%) |
| $25,000 to $49,999 | 354 (73.1%) | 130 (26.9%) |
| $50,000 to $74,999 | 264 (83.8%) | 51 (16.2%) |
| $75,000 to $99,999 | 32 (62.7%) | 19 (37.2%) |
| $100,000 and over | 232 (76.3%) | 72 (23.7%) |
Public vs Private Health Insurance Coverage by Age in Locust Grove
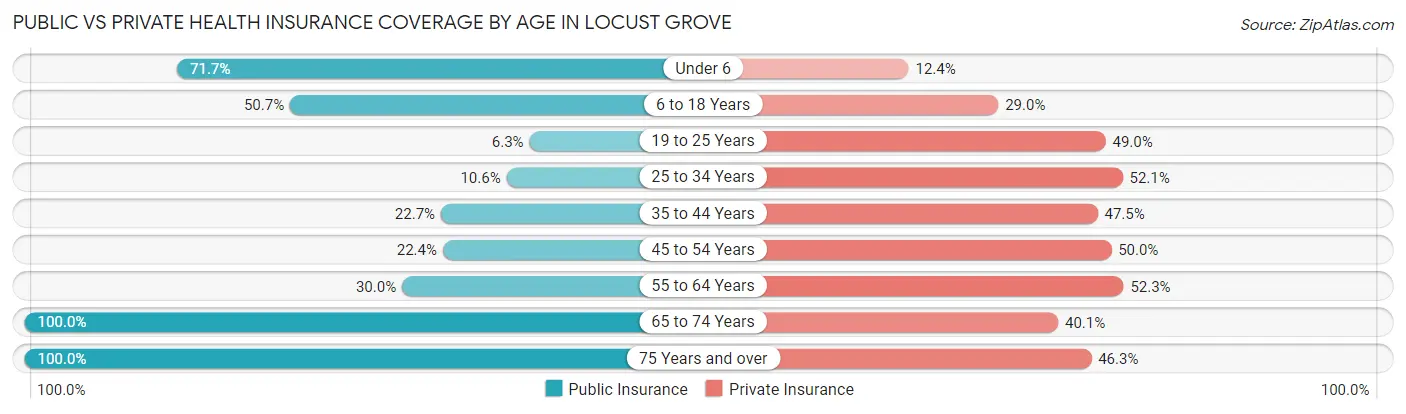
| Age Bracket | Public Insurance | Private Insurance |
| Under 6 | 81 (71.7%) | 14 (12.4%) |
| 6 to 18 Years | 138 (50.7%) | 79 (29.0%) |
| 19 to 25 Years | 9 (6.3%) | 70 (48.9%) |
| 25 to 34 Years | 15 (10.6%) | 74 (52.1%) |
| 35 to 44 Years | 45 (22.7%) | 94 (47.5%) |
| 45 to 54 Years | 34 (22.4%) | 76 (50.0%) |
| 55 to 64 Years | 59 (29.9%) | 103 (52.3%) |
| 65 to 74 Years | 147 (100.0%) | 59 (40.1%) |
| 75 Years and over | 54 (100.0%) | 25 (46.3%) |
| Total | 582 (41.0%) | 594 (41.9%) |
Disability Status by Sex by Age in Locust Grove
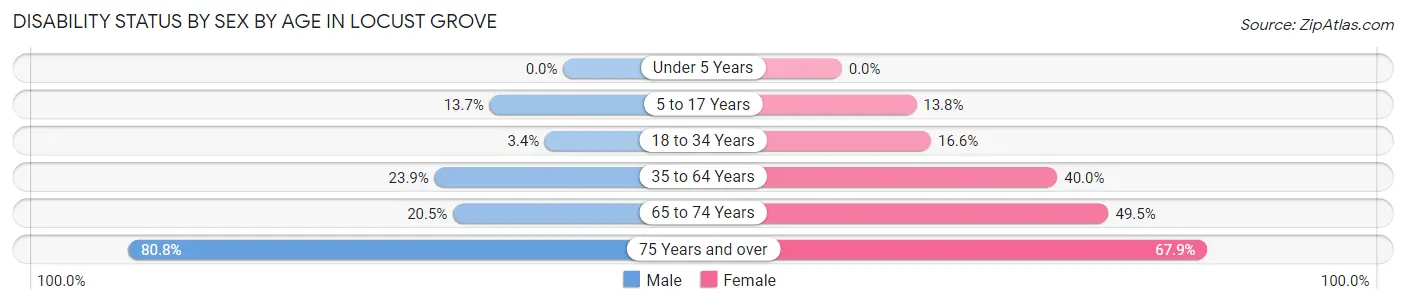
| Age Bracket | Male | Female |
| Under 5 Years | 0 (0.0%) | 0 (0.0%) |
| 5 to 17 Years | 19 (13.7%) | 17 (13.8%) |
| 18 to 34 Years | 5 (3.4%) | 29 (16.6%) |
| 35 to 64 Years | 65 (23.9%) | 110 (40.0%) |
| 65 to 74 Years | 9 (20.4%) | 51 (49.5%) |
| 75 Years and over | 21 (80.8%) | 19 (67.9%) |
Disability Class by Sex by Age in Locust Grove
Disability Class: Hearing Difficulty
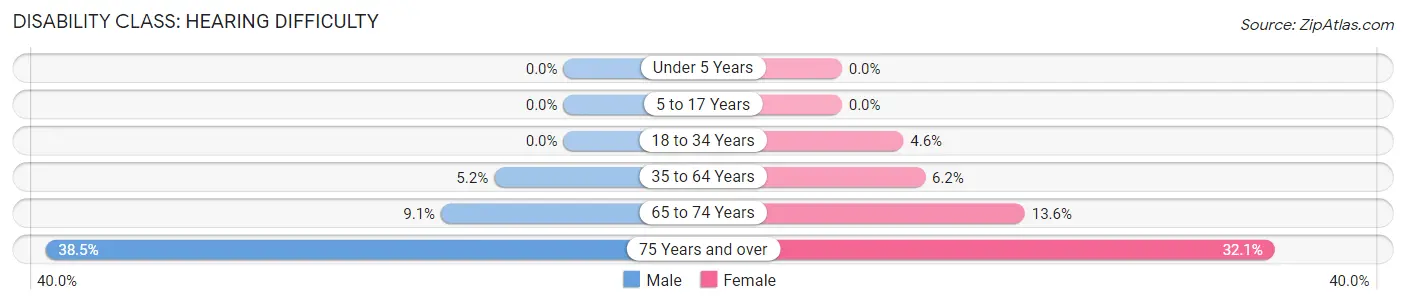
| Age Bracket | Male | Female |
| Under 5 Years | 0 (0.0%) | 0 (0.0%) |
| 5 to 17 Years | 0 (0.0%) | 0 (0.0%) |
| 18 to 34 Years | 0 (0.0%) | 8 (4.6%) |
| 35 to 64 Years | 14 (5.1%) | 17 (6.2%) |
| 65 to 74 Years | 4 (9.1%) | 14 (13.6%) |
| 75 Years and over | 10 (38.5%) | 9 (32.1%) |
Disability Class: Vision Difficulty
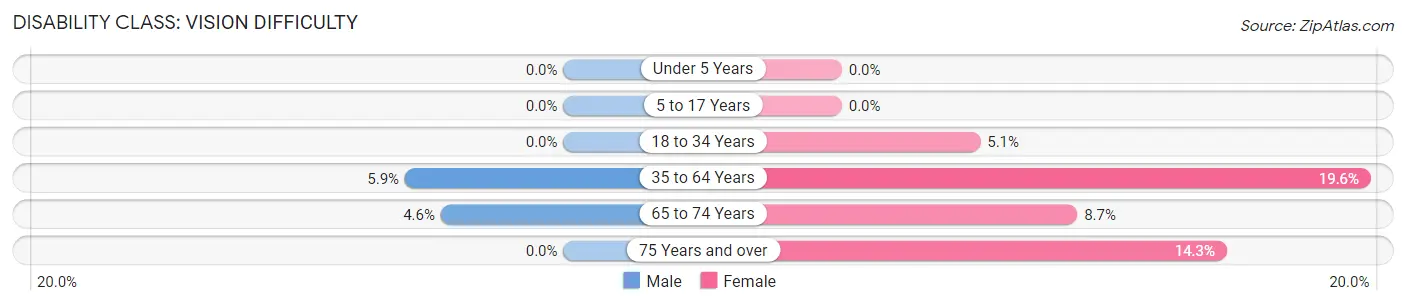
| Age Bracket | Male | Female |
| Under 5 Years | 0 (0.0%) | 0 (0.0%) |
| 5 to 17 Years | 0 (0.0%) | 0 (0.0%) |
| 18 to 34 Years | 0 (0.0%) | 9 (5.1%) |
| 35 to 64 Years | 16 (5.9%) | 54 (19.6%) |
| 65 to 74 Years | 2 (4.5%) | 9 (8.7%) |
| 75 Years and over | 0 (0.0%) | 4 (14.3%) |
Disability Class: Cognitive Difficulty
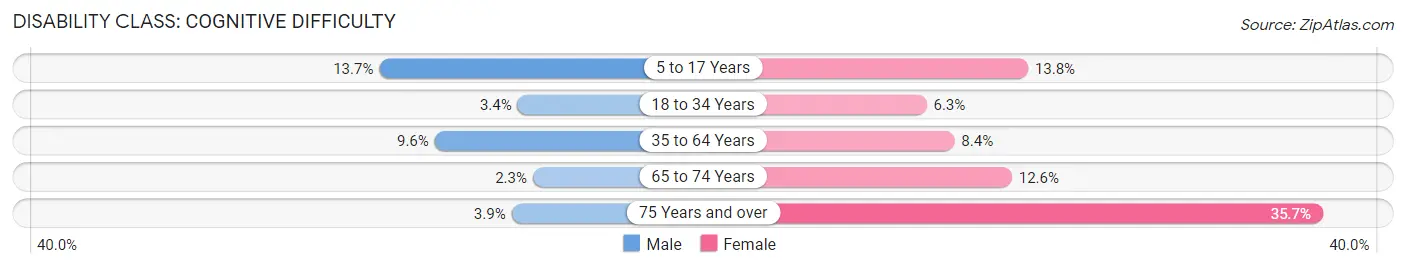
| Age Bracket | Male | Female |
| 5 to 17 Years | 19 (13.7%) | 17 (13.8%) |
| 18 to 34 Years | 5 (3.4%) | 11 (6.3%) |
| 35 to 64 Years | 26 (9.6%) | 23 (8.4%) |
| 65 to 74 Years | 1 (2.3%) | 13 (12.6%) |
| 75 Years and over | 1 (3.8%) | 10 (35.7%) |
Disability Class: Ambulatory Difficulty
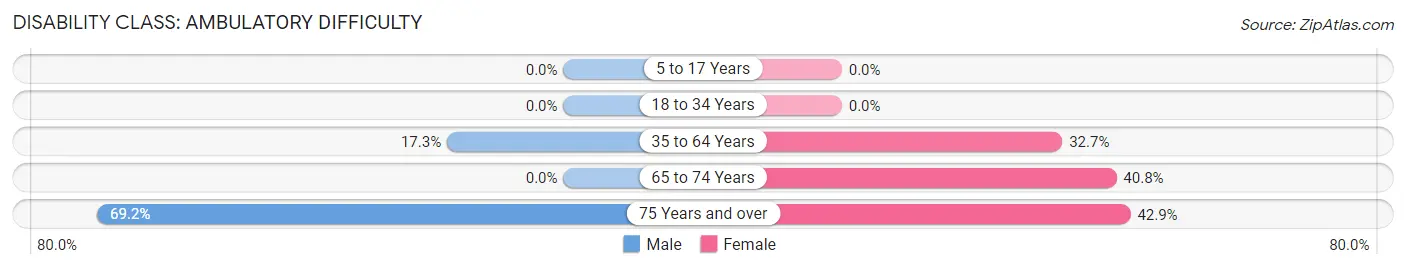
| Age Bracket | Male | Female |
| 5 to 17 Years | 0 (0.0%) | 0 (0.0%) |
| 18 to 34 Years | 0 (0.0%) | 0 (0.0%) |
| 35 to 64 Years | 47 (17.3%) | 90 (32.7%) |
| 65 to 74 Years | 0 (0.0%) | 42 (40.8%) |
| 75 Years and over | 18 (69.2%) | 12 (42.9%) |
Disability Class: Self-Care Difficulty
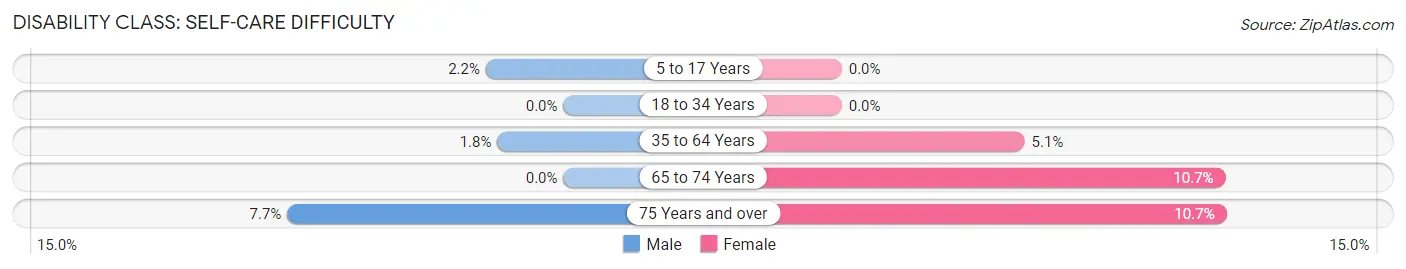
| Age Bracket | Male | Female |
| 5 to 17 Years | 3 (2.2%) | 0 (0.0%) |
| 18 to 34 Years | 0 (0.0%) | 0 (0.0%) |
| 35 to 64 Years | 5 (1.8%) | 14 (5.1%) |
| 65 to 74 Years | 0 (0.0%) | 11 (10.7%) |
| 75 Years and over | 2 (7.7%) | 3 (10.7%) |
Technology Access in Locust Grove
Computing Device Access in Locust Grove
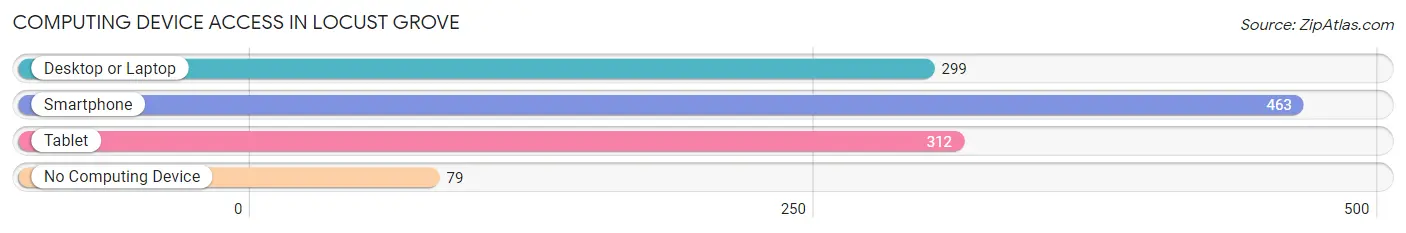
| Device Type | # Households | % Households |
| Desktop or Laptop | 299 | 53.7% |
| Smartphone | 463 | 83.1% |
| Tablet | 312 | 56.0% |
| No Computing Device | 79 | 14.2% |
| Total | 557 | 100.0% |
Internet Access in Locust Grove
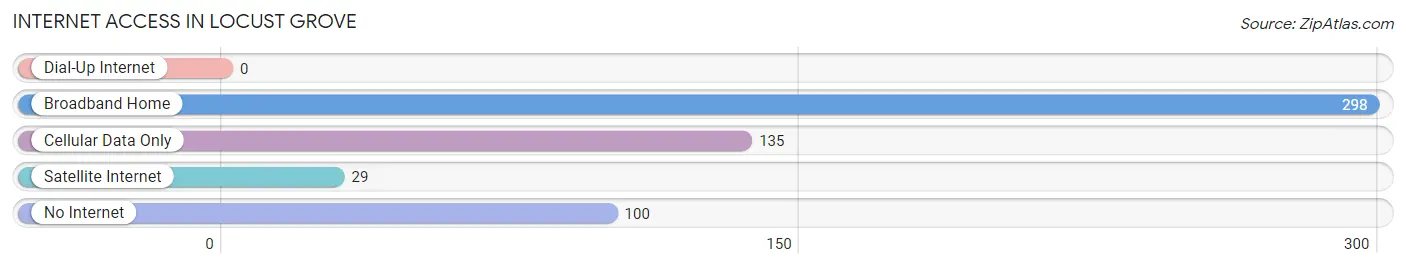
| Internet Type | # Households | % Households |
| Dial-Up Internet | 0 | 0.0% |
| Broadband Home | 298 | 53.5% |
| Cellular Data Only | 135 | 24.2% |
| Satellite Internet | 29 | 5.2% |
| No Internet | 100 | 17.9% |
| Total | 557 | 100.0% |
Locust Grove Summary
Locust Grove is a small town located in Mayes County, Oklahoma. It is situated in the foothills of the Ozark Mountains, about 25 miles east of Tulsa. The town was founded in 1872 and has a population of about 1,400 people.
History
The town of Locust Grove was founded in 1872 by a group of settlers from Missouri. The settlers were attracted to the area by the abundance of timber and the fertile soil. The town was named after the groves of locust trees that grew in the area.
The town grew slowly but steadily over the years, and by the early 1900s, it had become a thriving community. The town was home to several businesses, including a general store, a blacksmith shop, a hotel, and a sawmill.
In the 1920s, the town was connected to the outside world by the Missouri-Pacific Railroad. This allowed the town to become a shipping center for the surrounding area.
The town continued to grow and prosper until the Great Depression hit in the 1930s. The town was hit hard by the economic downturn, and many of the businesses closed. The town was able to recover, however, and by the 1950s, it had become a thriving agricultural center.
Geography
Locust Grove is located in the foothills of the Ozark Mountains in northeastern Oklahoma. The town is situated on the banks of the Grand River, which flows through the area. The town is surrounded by rolling hills and lush forests.
The climate in Locust Grove is mild and temperate. Summers are hot and humid, while winters are cold and wet. The average annual temperature is around 60 degrees Fahrenheit.
Economy
The economy of Locust Grove is largely based on agriculture. The town is home to several farms, which produce a variety of crops, including corn, soybeans, wheat, and hay. The town is also home to several small businesses, including a general store, a hardware store, and a restaurant.
Demographics
As of the 2010 census, the population of Locust Grove was 1,400. The town is predominantly white, with about 95% of the population being Caucasian. The median household income is around $35,000, and the median home value is around $90,000.
The town is served by the Locust Grove Public School District, which includes an elementary school, a middle school, and a high school. The town is also home to a branch of the Mayes County Library.
Conclusion
Locust Grove is a small town located in Mayes County, Oklahoma. It was founded in 1872 and has a population of about 1,400 people. The town is situated in the foothills of the Ozark Mountains and is surrounded by rolling hills and lush forests. The economy of Locust Grove is largely based on agriculture, and the town is served by the Locust Grove Public School District. The town is predominantly white, with about 95% of the population being Caucasian.
Common Questions
What is Per Capita Income in Locust Grove?
Per Capita income in Locust Grove is $23,421.
What is the Median Family Income in Locust Grove?
Median Family Income in Locust Grove is $49,643.
What is the Median Household income in Locust Grove?
Median Household Income in Locust Grove is $41,313.
What is Income or Wage Gap in Locust Grove?
Income or Wage Gap in Locust Grove is 30.7%.
Women in Locust Grove earn 69.3 cents for every dollar earned by a man.
What is Family Income Deficit in Locust Grove?
Family Income Deficit in Locust Grove is $12,927.
Families that are below poverty line in Locust Grove earn $12,927 less on average than the poverty threshold level.
What is Inequality or Gini Index in Locust Grove?
Inequality or Gini Index in Locust Grove is 0.47.
What is the Total Population of Locust Grove?
Total Population of Locust Grove is 1,424.
What is the Total Male Population of Locust Grove?
Total Male Population of Locust Grove is 679.
What is the Total Female Population of Locust Grove?
Total Female Population of Locust Grove is 745.
What is the Ratio of Males per 100 Females in Locust Grove?
There are 91.14 Males per 100 Females in Locust Grove.
What is the Ratio of Females per 100 Males in Locust Grove?
There are 109.72 Females per 100 Males in Locust Grove.
What is the Median Population Age in Locust Grove?
Median Population Age in Locust Grove is 36.6 Years.
What is the Average Family Size in Locust Grove
Average Family Size in Locust Grove is 3.3 People.
What is the Average Household Size in Locust Grove
Average Household Size in Locust Grove is 2.6 People.
How Large is the Labor Force in Locust Grove?
There are 658 People in the Labor Forcein in Locust Grove.
What is the Percentage of People in the Labor Force in Locust Grove?
57.8% of People are in the Labor Force in Locust Grove.
What is the Unemployment Rate in Locust Grove?
Unemployment Rate in Locust Grove is 6.3%.