Zip Codes with the Highest Percentage of Population Employed in Farming, Fishing & Forestry in Roswell, NM
RELATED REPORTS & OPTIONS
Farming, Fishing & Forestry
Roswell
Compare Zip Codes
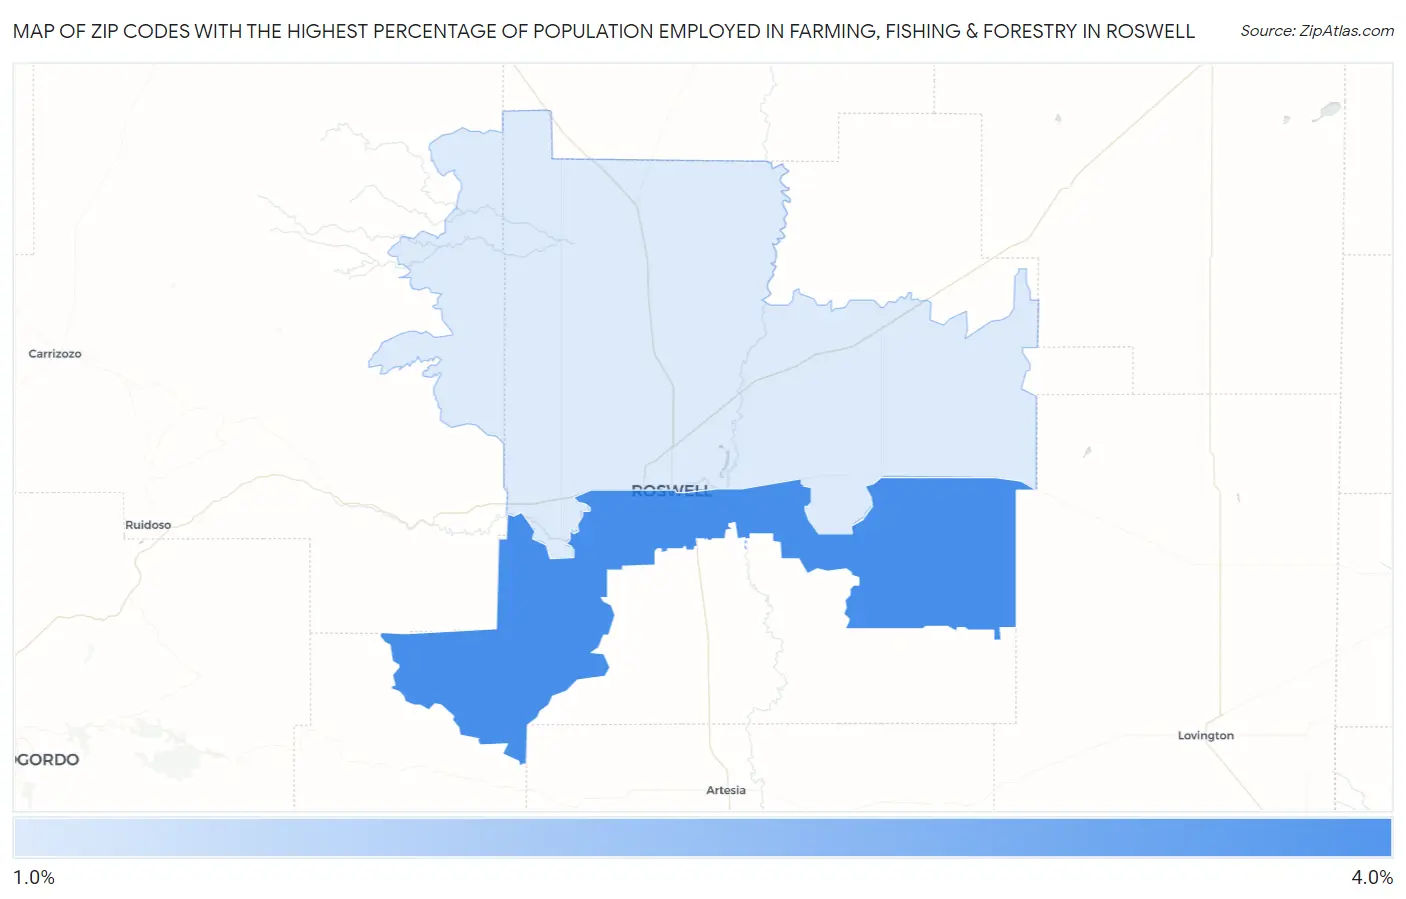
Map of Zip Codes with the Highest Percentage of Population Employed in Farming, Fishing & Forestry in Roswell
1.9%
4.0%
Zip Codes with the Highest Percentage of Population Employed in Farming, Fishing & Forestry in Roswell, NM
| Zip Code | % Employed | vs State | vs National | |
| 1. | 88203 | 4.0% | 0.91%(+3.09)#55 | 0.61%(+3.39)#3,717 |
| 2. | 88201 | 1.9% | 0.91%(+0.960)#78 | 0.61%(+1.26)#6,848 |
1
Common Questions
What are the Top Zip Codes with the Highest Percentage of Population Employed in Farming, Fishing & Forestry in Roswell, NM?
Top Zip Codes with the Highest Percentage of Population Employed in Farming, Fishing & Forestry in Roswell, NM are:
What zip code has the Highest Percentage of Population Employed in Farming, Fishing & Forestry in Roswell, NM?
88203 has the Highest Percentage of Population Employed in Farming, Fishing & Forestry in Roswell, NM with 4.0%.
What is the Percentage of Population Employed in Farming, Fishing & Forestry in Roswell, NM?
Percentage of Population Employed in Farming, Fishing & Forestry in Roswell is 2.7%.
What is the Percentage of Population Employed in Farming, Fishing & Forestry in New Mexico?
Percentage of Population Employed in Farming, Fishing & Forestry in New Mexico is 0.91%.
What is the Percentage of Population Employed in Farming, Fishing & Forestry in the United States?
Percentage of Population Employed in Farming, Fishing & Forestry in the United States is 0.61%.