Zip Codes with the Highest Percentage of Population Employed in Farming, Fishing & Forestry in New Mexico
RELATED REPORTS & OPTIONS
Farming, Fishing & Forestry
New Mexico
Compare Zip Codes
Map of Zip Codes with the Highest Percentage of Population Employed in Farming, Fishing & Forestry in New Mexico
0.0%
100.0%
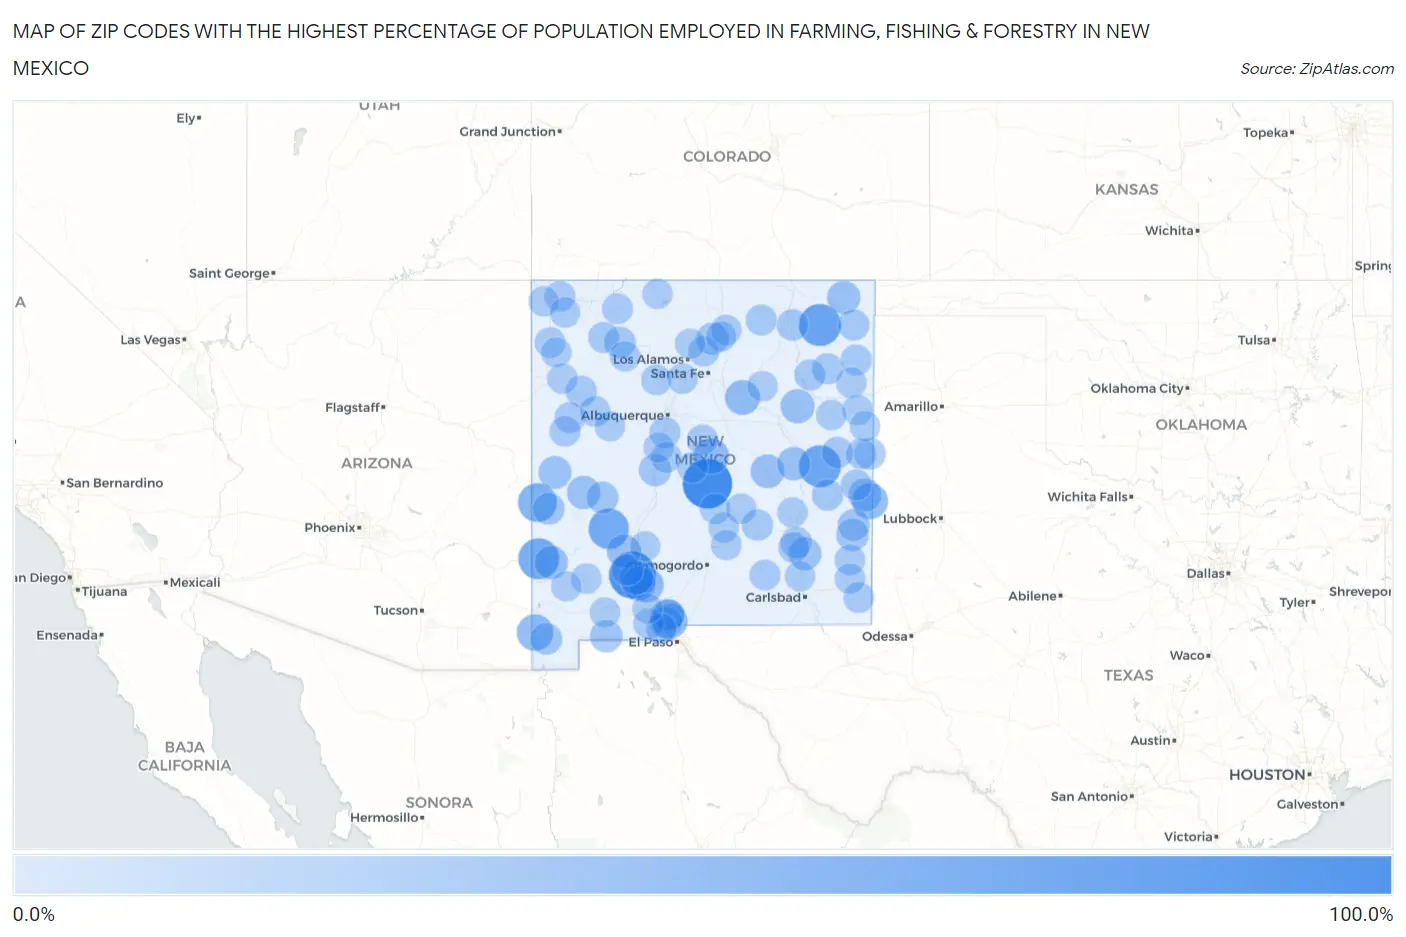
Zip Codes with the Highest Percentage of Population Employed in Farming, Fishing & Forestry in New Mexico
| Zip Code | % Employed | vs State | vs National | |
| 1. | 87011 | 100.0% | 0.91% (+99.1)#1 | 0.61% (+99.4)#15 |
| 2. | 87936 | 86.5% | 0.91% (+85.6)#2 | 0.61% (+85.9)#18 |
| 3. | 88422 | 61.5% | 0.91% (+60.6)#3 | 0.61% (+60.9)#34 |
| 4. | 88134 | 60.6% | 0.91% (+59.7)#4 | 0.61% (+60.0)#35 |
| 5. | 88051 | 54.5% | 0.91% (+53.6)#5 | 0.61% (+53.9)#43 |
| 6. | 87943 | 51.9% | 0.91% (+50.9)#6 | 0.61% (+51.2)#49 |
| 7. | 87824 | 44.4% | 0.91% (+43.5)#7 | 0.61% (+43.8)#73 |
| 8. | 88056 | 32.3% | 0.91% (+31.4)#8 | 0.61% (+31.7)#163 |
| 9. | 88113 | 30.0% | 0.91% (+29.1)#9 | 0.61% (+29.4)#192 |
| 10. | 87063 | 27.7% | 0.91% (+26.8)#10 | 0.61% (+27.1)#231 |
| 11. | 88024 | 24.7% | 0.91% (+23.7)#11 | 0.61% (+24.0)#290 |
| 12. | 87569 | 24.1% | 0.91% (+23.2)#12 | 0.61% (+23.5)#301 |
| 13. | 87940 | 22.5% | 0.91% (+21.6)#13 | 0.61% (+21.9)#330 |
| 14. | 87937 | 20.7% | 0.91% (+19.8)#14 | 0.61% (+20.1)#377 |
| 15. | 87941 | 19.8% | 0.91% (+18.9)#15 | 0.61% (+19.2)#414 |
| 16. | 88431 | 19.2% | 0.91% (+18.3)#16 | 0.61% (+18.6)#438 |
| 17. | 88048 | 19.2% | 0.91% (+18.3)#17 | 0.61% (+18.6)#439 |
| 18. | 88136 | 18.2% | 0.91% (+17.3)#18 | 0.61% (+17.6)#466 |
| 19. | 87942 | 18.1% | 0.91% (+17.2)#19 | 0.61% (+17.5)#472 |
| 20. | 87821 | 16.8% | 0.91% (+15.9)#20 | 0.61% (+16.2)#544 |
| 21. | 88418 | 16.3% | 0.91% (+15.4)#21 | 0.61% (+15.7)#572 |
| 22. | 88119 | 16.2% | 0.91% (+15.3)#22 | 0.61% (+15.6)#577 |
| 23. | 88028 | 16.0% | 0.91% (+15.1)#23 | 0.61% (+15.4)#587 |
| 24. | 88132 | 15.4% | 0.91% (+14.5)#24 | 0.61% (+14.8)#617 |
| 25. | 87829 | 14.0% | 0.91% (+13.1)#25 | 0.61% (+13.4)#718 |
| 26. | 88232 | 13.7% | 0.91% (+12.8)#26 | 0.61% (+13.1)#746 |
| 27. | 88029 | 11.7% | 0.91% (+10.8)#27 | 0.61% (+11.1)#967 |
| 28. | 87831 | 11.4% | 0.91% (+10.5)#28 | 0.61% (+10.8)#1,001 |
| 29. | 87527 | 10.7% | 0.91% (+9.81)#29 | 0.61% (+10.1)#1,090 |
| 30. | 88267 | 10.7% | 0.91% (+9.75)#30 | 0.61% (+10.1)#1,102 |
| 31. | 88027 | 10.3% | 0.91% (+9.36)#31 | 0.61% (+9.66)#1,166 |
| 32. | 87825 | 9.7% | 0.91% (+8.80)#32 | 0.61% (+9.10)#1,260 |
| 33. | 88114 | 9.1% | 0.91% (+8.19)#33 | 0.61% (+8.49)#1,386 |
| 34. | 87830 | 8.5% | 0.91% (+7.64)#34 | 0.61% (+7.94)#1,518 |
| 35. | 88020 | 8.3% | 0.91% (+7.43)#35 | 0.61% (+7.73)#1,556 |
| 36. | 87930 | 7.5% | 0.91% (+6.62)#36 | 0.61% (+6.92)#1,811 |
| 37. | 88135 | 7.5% | 0.91% (+6.62)#37 | 0.61% (+6.92)#1,814 |
| 38. | 87747 | 7.4% | 0.91% (+6.51)#38 | 0.61% (+6.81)#1,847 |
| 39. | 87018 | 7.3% | 0.91% (+6.41)#39 | 0.61% (+6.71)#1,874 |
| 40. | 88072 | 6.9% | 0.91% (+6.04)#40 | 0.61% (+6.34)#2,002 |
| 41. | 88116 | 6.0% | 0.91% (+5.11)#41 | 0.61% (+5.41)#2,384 |
| 42. | 88351 | 5.9% | 0.91% (+4.98)#42 | 0.61% (+5.28)#2,454 |
| 43. | 88230 | 5.9% | 0.91% (+4.97)#43 | 0.61% (+5.27)#2,458 |
| 44. | 88124 | 5.7% | 0.91% (+4.78)#44 | 0.61% (+5.08)#2,557 |
| 45. | 87323 | 5.5% | 0.91% (+4.60)#45 | 0.61% (+4.90)#2,650 |
| 46. | 87042 | 5.5% | 0.91% (+4.56)#46 | 0.61% (+4.86)#2,669 |
| 47. | 88415 | 5.1% | 0.91% (+4.16)#47 | 0.61% (+4.46)#2,881 |
| 48. | 87733 | 5.0% | 0.91% (+4.09)#48 | 0.61% (+4.39)#2,928 |
| 49. | 88130 | 4.9% | 0.91% (+3.96)#49 | 0.61% (+4.26)#3,027 |
| 50. | 87746 | 4.8% | 0.91% (+3.93)#50 | 0.61% (+4.23)#3,045 |
| 51. | 87037 | 4.8% | 0.91% (+3.92)#51 | 0.61% (+4.22)#3,055 |
| 52. | 88410 | 4.7% | 0.91% (+3.78)#52 | 0.61% (+4.08)#3,161 |
| 53. | 87714 | 4.4% | 0.91% (+3.45)#53 | 0.61% (+3.75)#3,406 |
| 54. | 87016 | 4.1% | 0.91% (+3.24)#54 | 0.61% (+3.54)#3,588 |
| 55. | 88203 | 4.0% | 0.91% (+3.09)#55 | 0.61% (+3.39)#3,717 |
| 56. | 87321 | 3.8% | 0.91% (+2.93)#56 | 0.61% (+3.23)#3,870 |
| 57. | 87567 | 3.7% | 0.91% (+2.79)#57 | 0.61% (+3.09)#4,004 |
| 58. | 87357 | 3.6% | 0.91% (+2.74)#58 | 0.61% (+3.04)#4,051 |
| 59. | 87412 | 3.6% | 0.91% (+2.66)#59 | 0.61% (+2.96)#4,132 |
| 60. | 87062 | 3.5% | 0.91% (+2.62)#60 | 0.61% (+2.92)#4,171 |
| 61. | 88231 | 3.5% | 0.91% (+2.55)#61 | 0.61% (+2.85)#4,256 |
| 62. | 88250 | 3.3% | 0.91% (+2.39)#62 | 0.61% (+2.69)#4,449 |
| 63. | 88101 | 3.1% | 0.91% (+2.24)#63 | 0.61% (+2.54)#4,625 |
| 64. | 87421 | 3.1% | 0.91% (+2.17)#64 | 0.61% (+2.47)#4,712 |
| 65. | 88044 | 2.9% | 0.91% (+2.00)#65 | 0.61% (+2.30)#4,956 |
| 66. | 88021 | 2.9% | 0.91% (+1.97)#66 | 0.61% (+2.27)#4,977 |
| 67. | 87020 | 2.8% | 0.91% (+1.89)#67 | 0.61% (+2.19)#5,116 |
| 68. | 87036 | 2.8% | 0.91% (+1.86)#68 | 0.61% (+2.16)#5,161 |
| 69. | 87364 | 2.7% | 0.91% (+1.79)#69 | 0.61% (+2.09)#5,247 |
| 70. | 87053 | 2.5% | 0.91% (+1.55)#70 | 0.61% (+1.85)#5,617 |
| 71. | 88023 | 2.3% | 0.91% (+1.43)#71 | 0.61% (+1.73)#5,838 |
| 72. | 87557 | 2.3% | 0.91% (+1.40)#72 | 0.61% (+1.70)#5,907 |
| 73. | 88260 | 2.2% | 0.91% (+1.27)#73 | 0.61% (+1.57)#6,187 |
| 74. | 87002 | 2.0% | 0.91% (+1.10)#74 | 0.61% (+1.40)#6,549 |
| 75. | 88426 | 2.0% | 0.91% (+1.09)#75 | 0.61% (+1.39)#6,559 |
| 76. | 88301 | 1.9% | 0.91% (+1.00)#76 | 0.61% (+1.30)#6,761 |
| 77. | 87311 | 1.9% | 0.91% (+0.990)#77 | 0.61% (+1.29)#6,786 |
| 78. | 88201 | 1.9% | 0.91% (+0.960)#78 | 0.61% (+1.26)#6,848 |
| 79. | 88210 | 1.9% | 0.91% (+0.956)#79 | 0.61% (+1.26)#6,860 |
| 80. | 88316 | 1.7% | 0.91% (+0.831)#80 | 0.61% (+1.13)#7,202 |
| 81. | 87013 | 1.7% | 0.91% (+0.823)#81 | 0.61% (+1.12)#7,222 |
| 82. | 88030 | 1.7% | 0.91% (+0.819)#82 | 0.61% (+1.12)#7,229 |
| 83. | 88312 | 1.7% | 0.91% (+0.811)#83 | 0.61% (+1.11)#7,246 |
| 84. | 88340 | 1.7% | 0.91% (+0.757)#84 | 0.61% (+1.06)#7,396 |
| 85. | 87420 | 1.5% | 0.91% (+0.605)#85 | 0.61% (+0.905)#7,853 |
| 86. | 88434 | 1.5% | 0.91% (+0.576)#86 | 0.61% (+0.876)#7,940 |
| 87. | 87537 | 1.4% | 0.91% (+0.457)#87 | 0.61% (+0.758)#8,339 |
| 88. | 87325 | 1.3% | 0.91% (+0.441)#88 | 0.61% (+0.741)#8,395 |
| 89. | 87034 | 1.3% | 0.91% (+0.391)#89 | 0.61% (+0.691)#8,581 |
| 90. | 87553 | 1.3% | 0.91% (+0.367)#90 | 0.61% (+0.667)#8,674 |
| 91. | 88401 | 1.3% | 0.91% (+0.352)#91 | 0.61% (+0.653)#8,727 |
| 92. | 87528 | 1.2% | 0.91% (+0.259)#92 | 0.61% (+0.560)#9,058 |
| 93. | 88061 | 1.1% | 0.91% (+0.214)#93 | 0.61% (+0.514)#9,238 |
| 94. | 88240 | 1.1% | 0.91% (+0.204)#94 | 0.61% (+0.505)#9,277 |
| 95. | 87901 | 1.1% | 0.91% (+0.193)#95 | 0.61% (+0.493)#9,316 |
| 96. | 88112 | 1.1% | 0.91% (+0.164)#96 | 0.61% (+0.464)#9,445 |
| 97. | 88005 | 1.1% | 0.91% (+0.162)#97 | 0.61% (+0.462)#9,448 |
| 98. | 87416 | 1.1% | 0.91% (+0.159)#98 | 0.61% (+0.460)#9,463 |
| 99. | 87072 | 1.1% | 0.91% (+0.154)#99 | 0.61% (+0.455)#9,483 |
| 100. | 87701 | 1.0% | 0.91% (+0.132)#100 | 0.61% (+0.432)#9,568 |
Common Questions
What are the Top 10 Zip Codes with the Highest Percentage of Population Employed in Farming, Fishing & Forestry in New Mexico?
Top 10 Zip Codes with the Highest Percentage of Population Employed in Farming, Fishing & Forestry in New Mexico are:
What zip code has the Highest Percentage of Population Employed in Farming, Fishing & Forestry in New Mexico?
87011 has the Highest Percentage of Population Employed in Farming, Fishing & Forestry in New Mexico with 100.0%.
What is the Percentage of Population Employed in Farming, Fishing & Forestry in the State of New Mexico?
Percentage of Population Employed in Farming, Fishing & Forestry in New Mexico is 0.91%.
What is the Percentage of Population Employed in Farming, Fishing & Forestry in the United States?
Percentage of Population Employed in Farming, Fishing & Forestry in the United States is 0.61%.