Zip Codes with the Highest Percentage of Population Employed in Farming, Fishing & Forestry in Santa Fe, NM
RELATED REPORTS & OPTIONS
Farming, Fishing & Forestry
Santa Fe
Compare Zip Codes
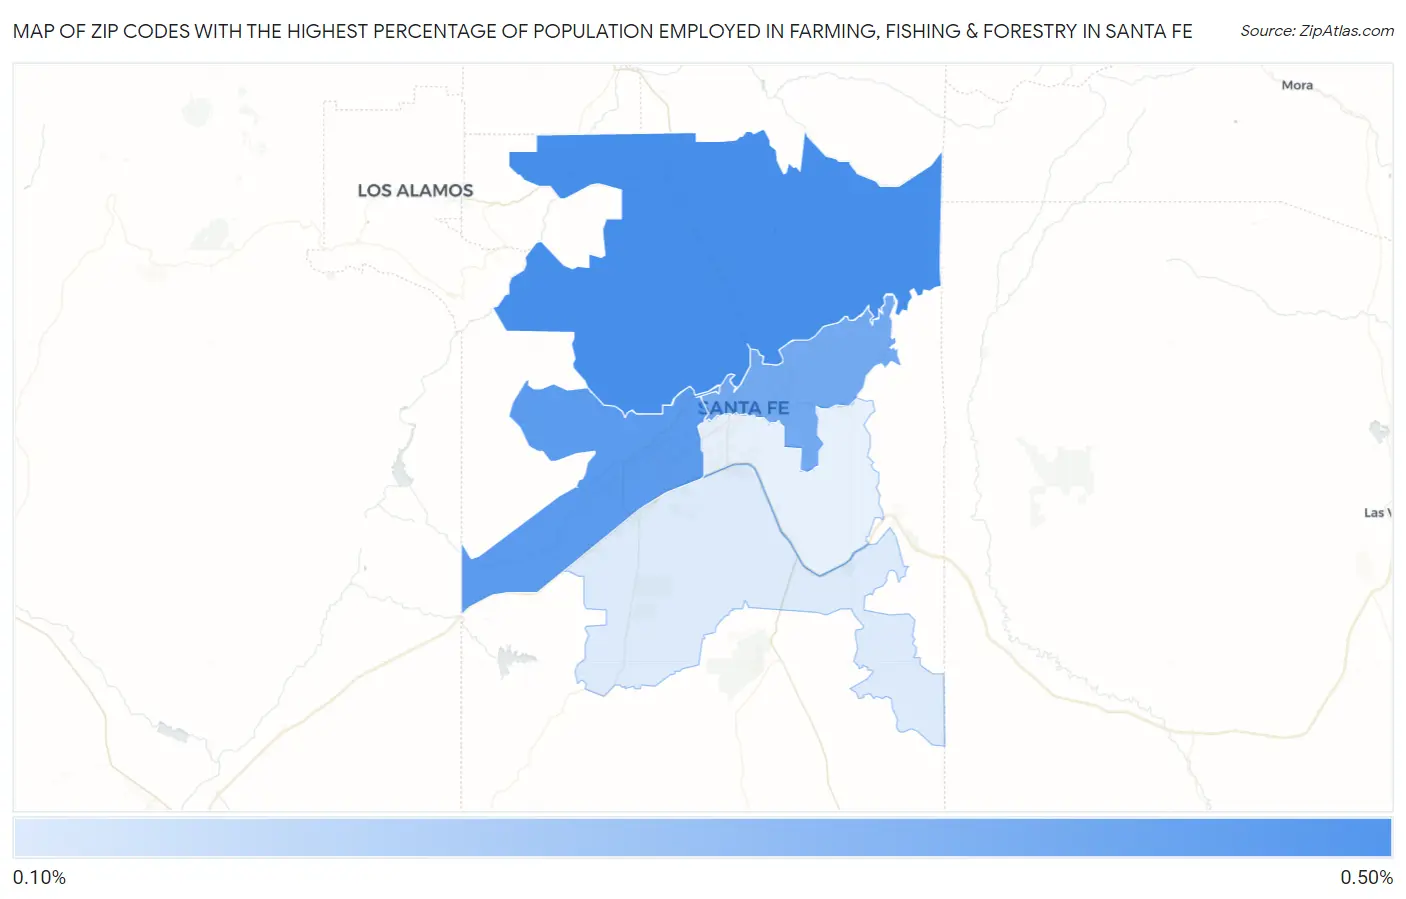
Map of Zip Codes with the Highest Percentage of Population Employed in Farming, Fishing & Forestry in Santa Fe
0.11%
0.48%
Zip Codes with the Highest Percentage of Population Employed in Farming, Fishing & Forestry in Santa Fe, NM
| Zip Code | % Employed | vs State | vs National | |
| 1. | 87506 | 0.48% | 0.91%(-0.431)#124 | 0.61%(-0.130)#13,068 |
| 2. | 87507 | 0.43% | 0.91%(-0.479)#128 | 0.61%(-0.179)#13,527 |
| 3. | 87501 | 0.37% | 0.91%(-0.540)#133 | 0.61%(-0.240)#14,095 |
| 4. | 87508 | 0.11% | 0.91%(-0.801)#149 | 0.61%(-0.500)#17,661 |
1
Common Questions
What are the Top 3 Zip Codes with the Highest Percentage of Population Employed in Farming, Fishing & Forestry in Santa Fe, NM?
Top 3 Zip Codes with the Highest Percentage of Population Employed in Farming, Fishing & Forestry in Santa Fe, NM are:
What zip code has the Highest Percentage of Population Employed in Farming, Fishing & Forestry in Santa Fe, NM?
87506 has the Highest Percentage of Population Employed in Farming, Fishing & Forestry in Santa Fe, NM with 0.48%.
What is the Percentage of Population Employed in Farming, Fishing & Forestry in Santa Fe, NM?
Percentage of Population Employed in Farming, Fishing & Forestry in Santa Fe is 0.21%.
What is the Percentage of Population Employed in Farming, Fishing & Forestry in New Mexico?
Percentage of Population Employed in Farming, Fishing & Forestry in New Mexico is 0.91%.
What is the Percentage of Population Employed in Farming, Fishing & Forestry in the United States?
Percentage of Population Employed in Farming, Fishing & Forestry in the United States is 0.61%.