Zimmerman, MN Map & Demographics
Zimmerman Map
Zimmerman Overview
$30,917
PER CAPITA INCOME
$80,625
AVG FAMILY INCOME
$79,720
AVG HOUSEHOLD INCOME
16.9%
WAGE / INCOME GAP [ % ]
83.1¢/ $1
WAGE / INCOME GAP [ $ ]
$9,456
FAMILY INCOME DEFICIT
0.37
INEQUALITY / GINI INDEX
6,243
TOTAL POPULATION
2,831
MALE POPULATION
3,412
FEMALE POPULATION
82.97
MALES / 100 FEMALES
120.52
FEMALES / 100 MALES
32.3
MEDIAN AGE
3.3
AVG FAMILY SIZE
3.0
AVG HOUSEHOLD SIZE
3,526
LABOR FORCE [ PEOPLE ]
80.6%
PERCENT IN LABOR FORCE
0.3%
UNEMPLOYMENT RATE
Zimmerman Zip Codes
Zimmerman Area Codes
Income in Zimmerman
Income Overview in Zimmerman
Per Capita Income in Zimmerman is $30,917, while median incomes of families and households are $80,625 and $79,720 respectively.
| Characteristic | Number | Measure |
| Per Capita Income | 6,243 | $30,917 |
| Median Family Income | 1,472 | $80,625 |
| Mean Family Income | 1,472 | $91,927 |
| Median Household Income | 2,075 | $79,720 |
| Mean Household Income | 2,075 | $87,566 |
| Income Deficit | 1,472 | $9,456 |
| Wage / Income Gap (%) | 6,243 | 16.92% |
| Wage / Income Gap ($) | 6,243 | 83.08¢ per $1 |
| Gini / Inequality Index | 6,243 | 0.37 |
Earnings by Sex in Zimmerman
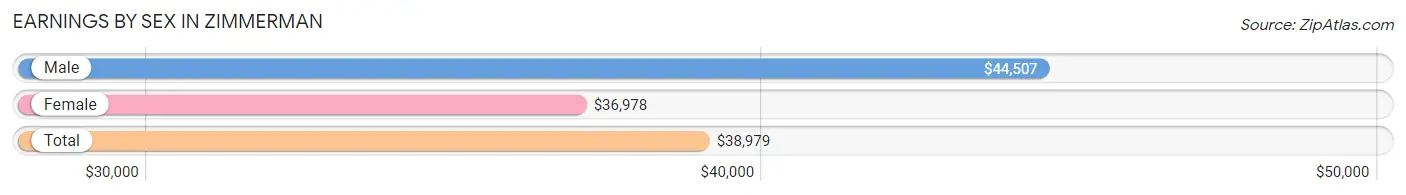
Average Earnings in Zimmerman are $38,979, $44,507 for men and $36,978 for women, a difference of 16.9%.
| Sex | Number | Average Earnings |
| Male | 1,865 (50.7%) | $44,507 |
| Female | 1,814 (49.3%) | $36,978 |
| Total | 3,679 (100.0%) | $38,979 |
Earnings by Sex by Income Bracket in Zimmerman
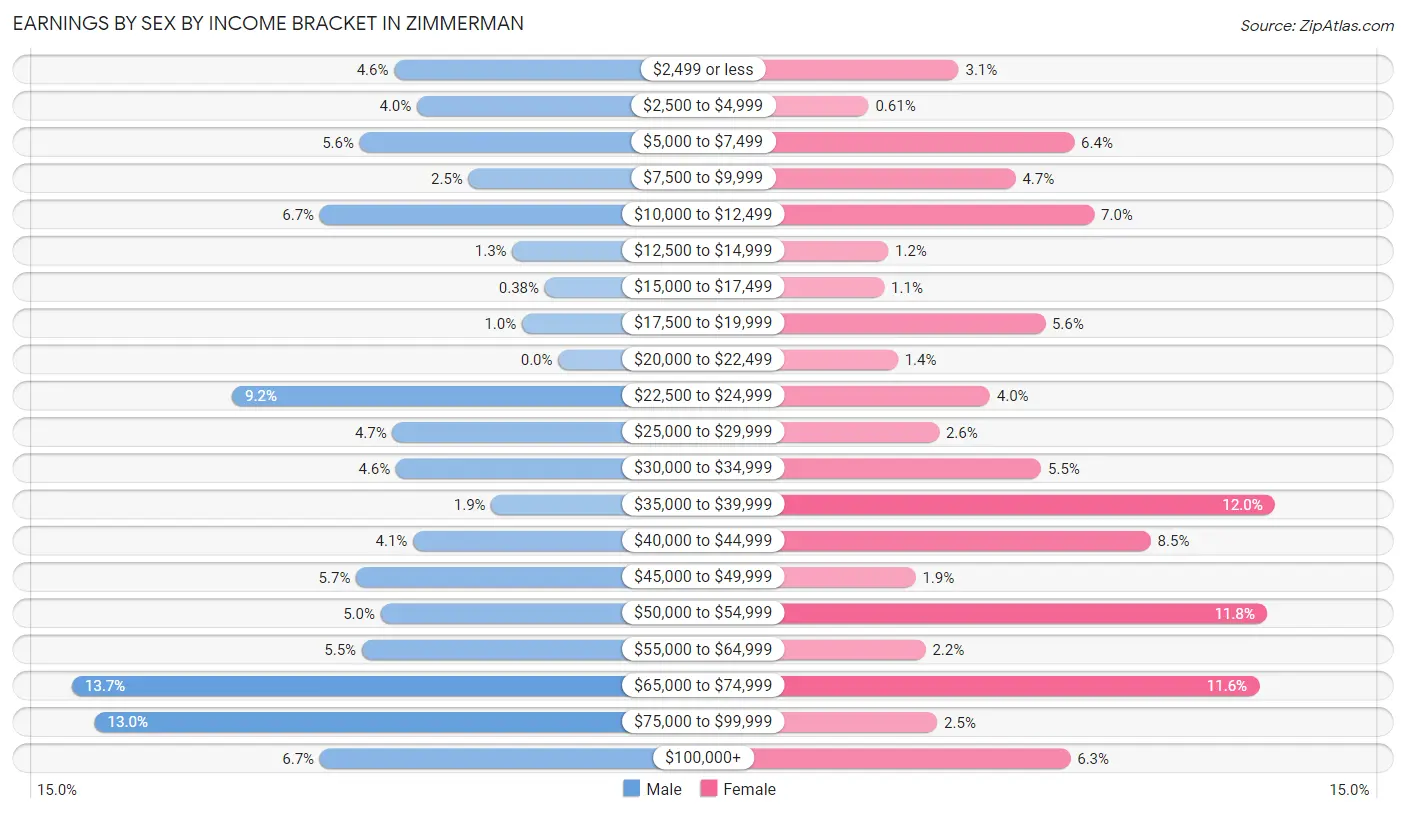
The most common earnings brackets in Zimmerman are $65,000 to $74,999 for men (255 | 13.7%) and $35,000 to $39,999 for women (218 | 12.0%).
| Income | Male | Female |
| $2,499 or less | 86 (4.6%) | 57 (3.1%) |
| $2,500 to $4,999 | 74 (4.0%) | 11 (0.6%) |
| $5,000 to $7,499 | 104 (5.6%) | 116 (6.4%) |
| $7,500 to $9,999 | 47 (2.5%) | 86 (4.7%) |
| $10,000 to $12,499 | 125 (6.7%) | 126 (7.0%) |
| $12,500 to $14,999 | 24 (1.3%) | 21 (1.2%) |
| $15,000 to $17,499 | 7 (0.4%) | 19 (1.1%) |
| $17,500 to $19,999 | 19 (1.0%) | 101 (5.6%) |
| $20,000 to $22,499 | 0 (0.0%) | 26 (1.4%) |
| $22,500 to $24,999 | 171 (9.2%) | 73 (4.0%) |
| $25,000 to $29,999 | 87 (4.7%) | 47 (2.6%) |
| $30,000 to $34,999 | 85 (4.6%) | 99 (5.5%) |
| $35,000 to $39,999 | 35 (1.9%) | 218 (12.0%) |
| $40,000 to $44,999 | 76 (4.1%) | 155 (8.5%) |
| $45,000 to $49,999 | 106 (5.7%) | 35 (1.9%) |
| $50,000 to $54,999 | 93 (5.0%) | 214 (11.8%) |
| $55,000 to $64,999 | 103 (5.5%) | 40 (2.2%) |
| $65,000 to $74,999 | 255 (13.7%) | 210 (11.6%) |
| $75,000 to $99,999 | 243 (13.0%) | 46 (2.5%) |
| $100,000+ | 125 (6.7%) | 114 (6.3%) |
| Total | 1,865 (100.0%) | 1,814 (100.0%) |
Earnings by Sex by Educational Attainment in Zimmerman
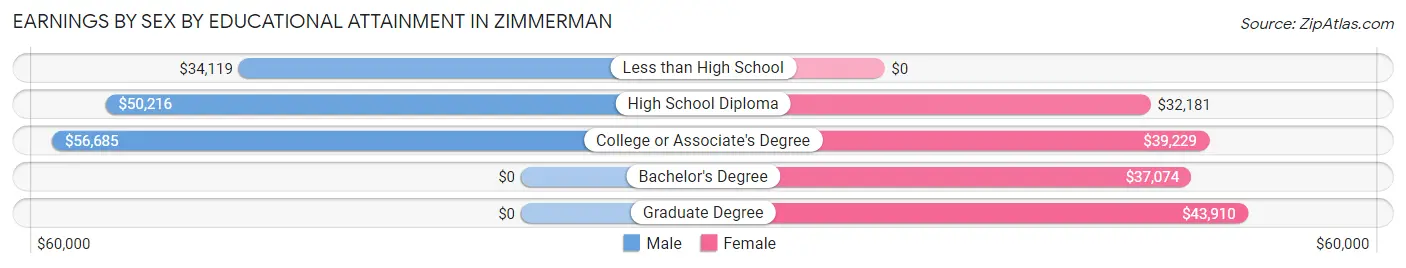
Average earnings in Zimmerman are $50,763 for men and $38,542 for women, a difference of 24.1%. Men with an educational attainment of college or associate's degree enjoy the highest average annual earnings of $56,685, while those with less than high school education earn the least with $34,119. Women with an educational attainment of graduate degree earn the most with the average annual earnings of $43,910, while those with high school diploma education have the smallest earnings of $32,181.
| Educational Attainment | Male Income | Female Income |
| Less than High School | $34,119 | $0 |
| High School Diploma | $50,216 | $32,181 |
| College or Associate's Degree | $56,685 | $39,229 |
| Bachelor's Degree | - | - |
| Graduate Degree | - | - |
| Total | $50,763 | $38,542 |
Family Income in Zimmerman
Family Income Brackets in Zimmerman
According to the Zimmerman family income data, there are 291 families falling into the $75,000 to $99,999 income range, which is the most common income bracket and makes up 19.8% of all families. Conversely, the $10,000 to $14,999 income bracket is the least frequent group with only 10 families (0.7%) belonging to this category.
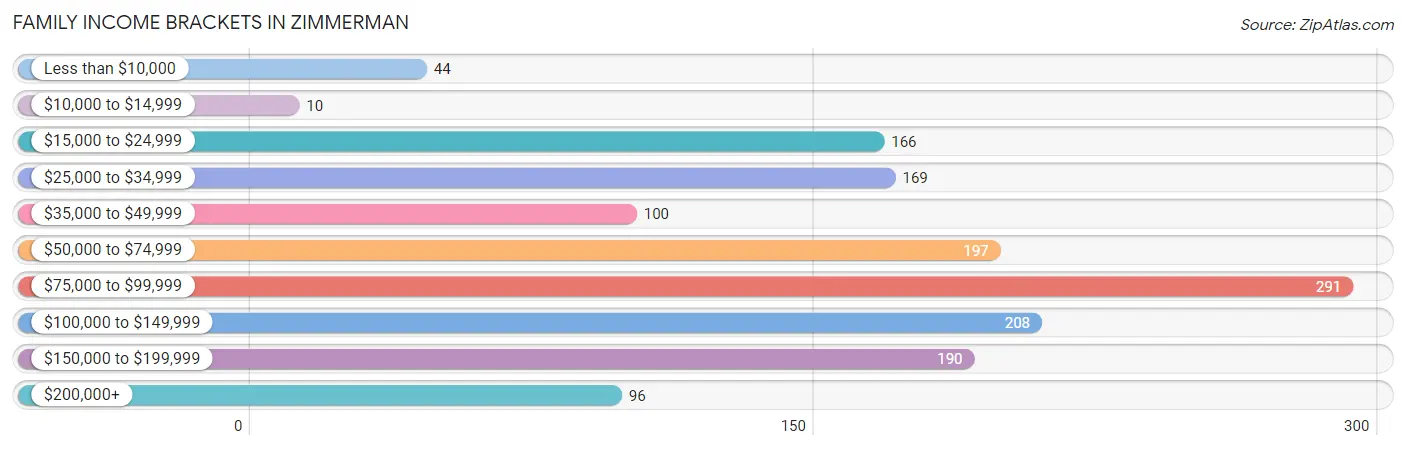
| Income Bracket | # Families | % Families |
| Less than $10,000 | 44 | 3.0% |
| $10,000 to $14,999 | 10 | 0.7% |
| $15,000 to $24,999 | 166 | 11.3% |
| $25,000 to $34,999 | 169 | 11.5% |
| $35,000 to $49,999 | 100 | 6.8% |
| $50,000 to $74,999 | 197 | 13.4% |
| $75,000 to $99,999 | 291 | 19.8% |
| $100,000 to $149,999 | 208 | 14.1% |
| $150,000 to $199,999 | 190 | 12.9% |
| $200,000+ | 96 | 6.5% |
Family Income by Famaliy Size in Zimmerman
5-person families (77 | 5.2%) account for the highest median family income in Zimmerman with $117,589 per family, while 2-person families (543 | 36.9%) have the highest median income of $32,268 per family member.
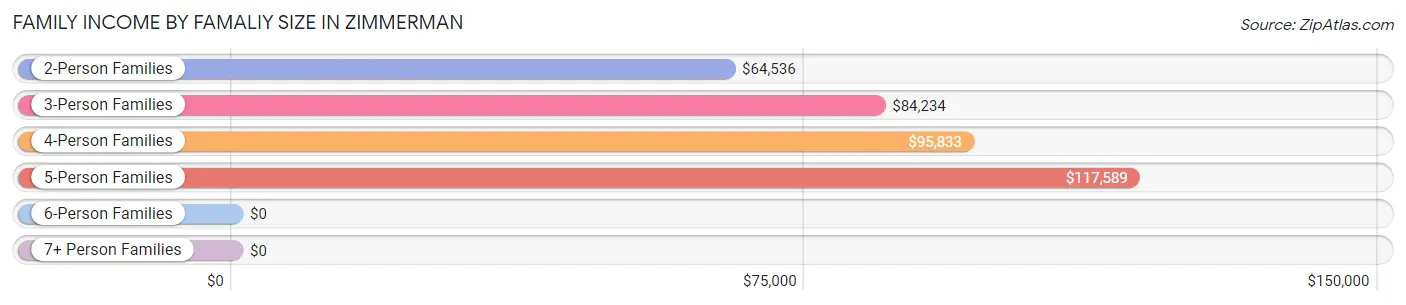
| Income Bracket | # Families | Median Income |
| 2-Person Families | 543 (36.9%) | $64,536 |
| 3-Person Families | 336 (22.8%) | $84,234 |
| 4-Person Families | 516 (35.0%) | $95,833 |
| 5-Person Families | 77 (5.2%) | $117,589 |
| 6-Person Families | 0 (0.0%) | $0 |
| 7+ Person Families | 0 (0.0%) | $0 |
| Total | 1,472 (100.0%) | $80,625 |
Family Income by Number of Earners in Zimmerman
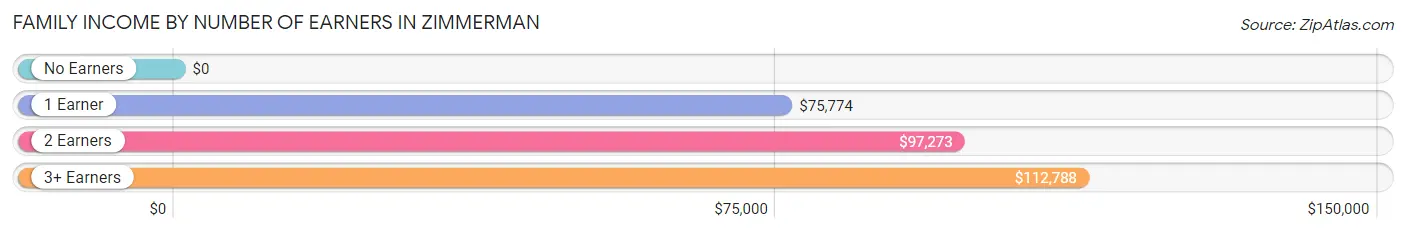
| Number of Earners | # Families | Median Income |
| No Earners | 109 (7.4%) | $0 |
| 1 Earner | 439 (29.8%) | $75,774 |
| 2 Earners | 780 (53.0%) | $97,273 |
| 3+ Earners | 144 (9.8%) | $112,788 |
| Total | 1,472 (100.0%) | $80,625 |
Household Income in Zimmerman
Household Income Brackets in Zimmerman
With 479 households falling in the category, the $75,000 to $99,999 income range is the most frequent in Zimmerman, accounting for 23.1% of all households. In contrast, only 31 households (1.5%) fall into the $10,000 to $14,999 income bracket, making it the least populous group.
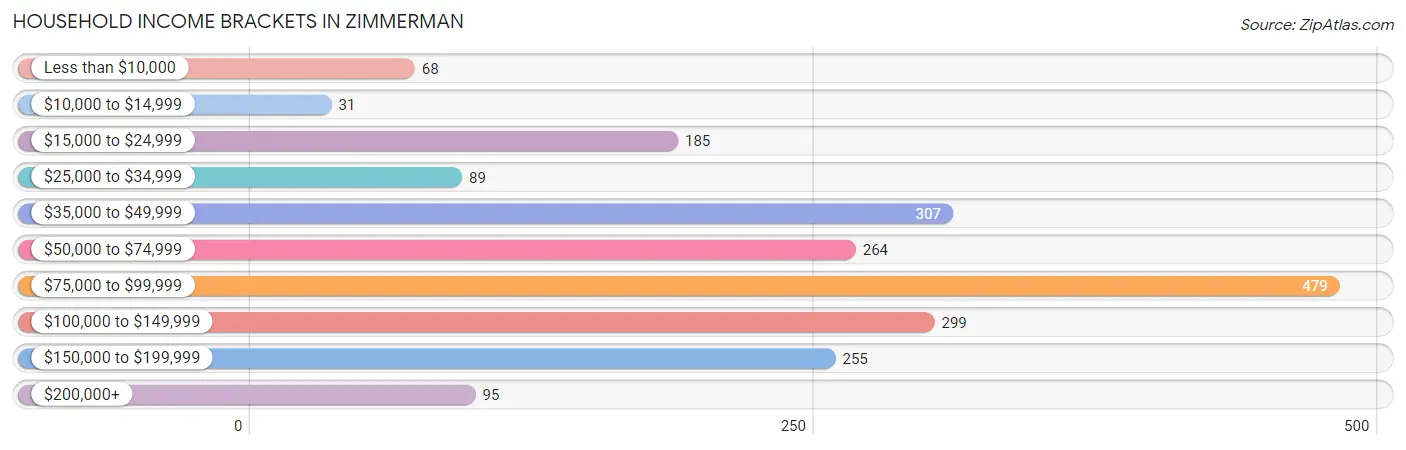
| Income Bracket | # Households | % Households |
| Less than $10,000 | 68 | 3.3% |
| $10,000 to $14,999 | 31 | 1.5% |
| $15,000 to $24,999 | 185 | 8.9% |
| $25,000 to $34,999 | 89 | 4.3% |
| $35,000 to $49,999 | 307 | 14.8% |
| $50,000 to $74,999 | 264 | 12.7% |
| $75,000 to $99,999 | 479 | 23.1% |
| $100,000 to $149,999 | 299 | 14.4% |
| $150,000 to $199,999 | 255 | 12.3% |
| $200,000+ | 95 | 4.6% |
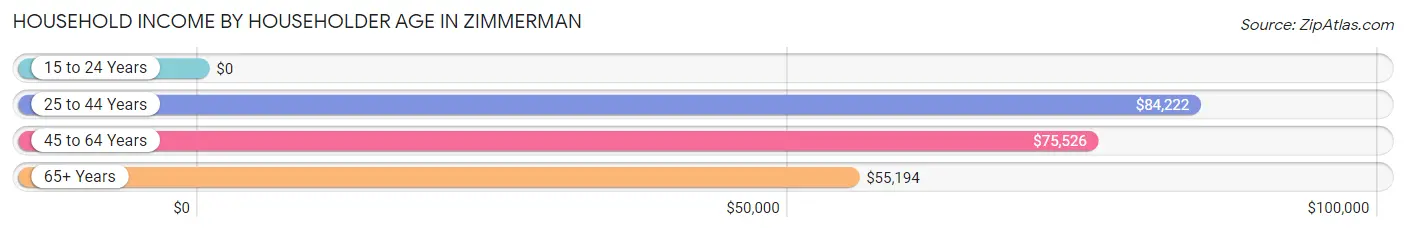
Household Income by Householder Age in Zimmerman
The median household income in Zimmerman is $79,720, with the highest median household income of $84,222 found in the 25 to 44 years age bracket for the primary householder. A total of 1,031 households (49.7%) fall into this category. Meanwhile, the 15 to 24 years age bracket for the primary householder has the lowest median household income of $0, with 19 households (0.9%) in this group.
| Income Bracket | # Households | Median Income |
| 15 to 24 Years | 19 (0.9%) | $0 |
| 25 to 44 Years | 1,031 (49.7%) | $84,222 |
| 45 to 64 Years | 738 (35.6%) | $75,526 |
| 65+ Years | 287 (13.8%) | $55,194 |
| Total | 2,075 (100.0%) | $79,720 |
Poverty in Zimmerman
Income Below Poverty by Sex and Age in Zimmerman
With 15.2% poverty level for males and 14.3% for females among the residents of Zimmerman, 12 to 14 year old males and 35 to 44 year old females are the most vulnerable to poverty, with 127 males (94.1%) and 128 females (40.4%) in their respective age groups living below the poverty level.
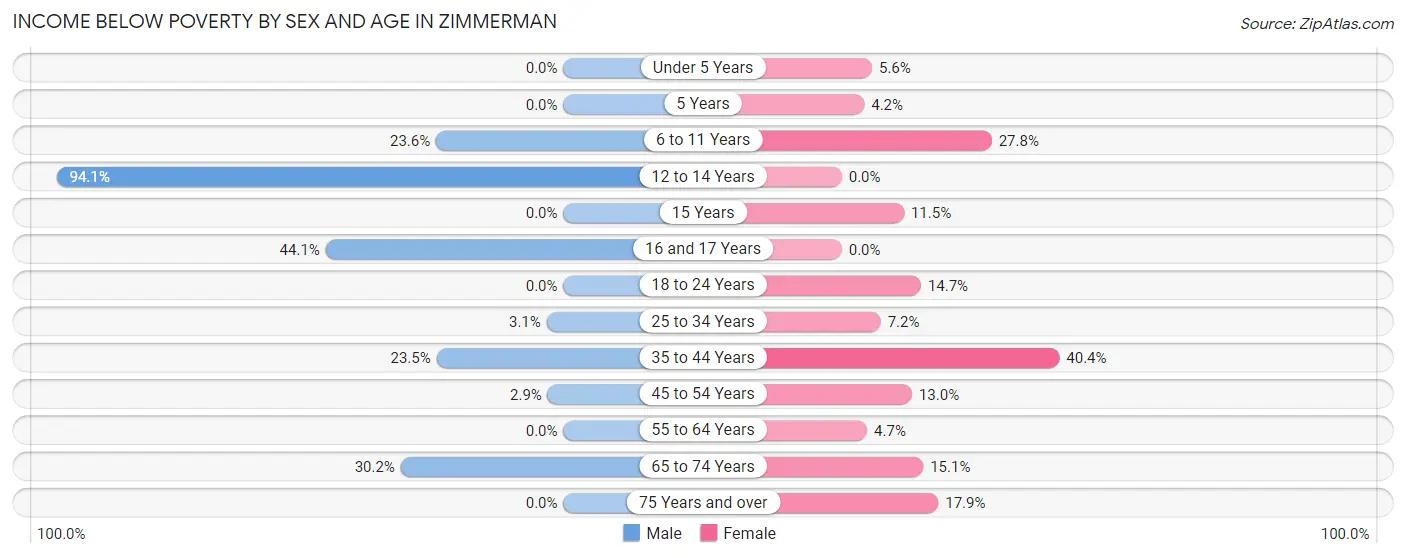
| Age Bracket | Male | Female |
| Under 5 Years | 0 (0.0%) | 18 (5.6%) |
| 5 Years | 0 (0.0%) | 3 (4.2%) |
| 6 to 11 Years | 69 (23.6%) | 128 (27.8%) |
| 12 to 14 Years | 127 (94.1%) | 0 (0.0%) |
| 15 Years | 0 (0.0%) | 18 (11.5%) |
| 16 and 17 Years | 45 (44.1%) | 0 (0.0%) |
| 18 to 24 Years | 0 (0.0%) | 21 (14.7%) |
| 25 to 34 Years | 14 (3.1%) | 61 (7.2%) |
| 35 to 44 Years | 108 (23.5%) | 128 (40.4%) |
| 45 to 54 Years | 13 (2.9%) | 40 (13.0%) |
| 55 to 64 Years | 0 (0.0%) | 14 (4.7%) |
| 65 to 74 Years | 48 (30.2%) | 39 (15.1%) |
| 75 Years and over | 0 (0.0%) | 12 (17.9%) |
| Total | 424 (15.2%) | 482 (14.3%) |
Income Above Poverty by Sex and Age in Zimmerman
According to the poverty statistics in Zimmerman, males aged under 5 years and females aged 12 to 14 years are the age groups that are most secure financially, with 100.0% of males and 100.0% of females in these age groups living above the poverty line.
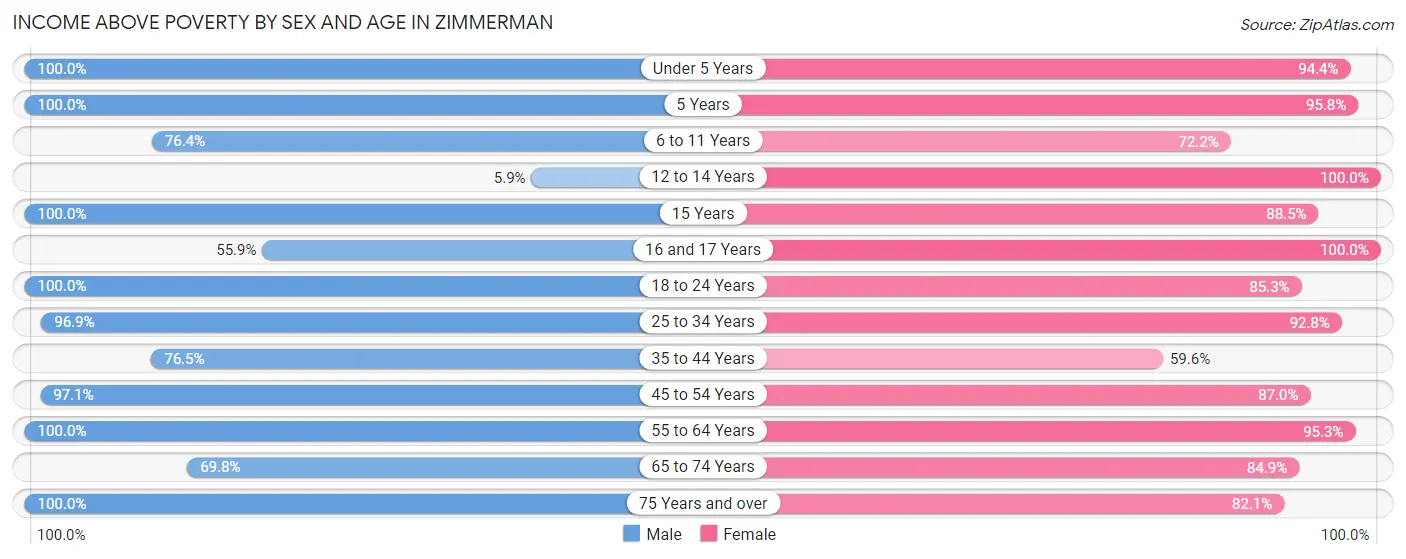
| Age Bracket | Male | Female |
| Under 5 Years | 142 (100.0%) | 303 (94.4%) |
| 5 Years | 80 (100.0%) | 69 (95.8%) |
| 6 to 11 Years | 223 (76.4%) | 332 (72.2%) |
| 12 to 14 Years | 8 (5.9%) | 87 (100.0%) |
| 15 Years | 29 (100.0%) | 138 (88.5%) |
| 16 and 17 Years | 57 (55.9%) | 38 (100.0%) |
| 18 to 24 Years | 214 (100.0%) | 122 (85.3%) |
| 25 to 34 Years | 436 (96.9%) | 784 (92.8%) |
| 35 to 44 Years | 351 (76.5%) | 189 (59.6%) |
| 45 to 54 Years | 433 (97.1%) | 267 (87.0%) |
| 55 to 64 Years | 254 (100.0%) | 283 (95.3%) |
| 65 to 74 Years | 111 (69.8%) | 219 (84.9%) |
| 75 Years and over | 19 (100.0%) | 55 (82.1%) |
| Total | 2,357 (84.8%) | 2,886 (85.7%) |
Income Below Poverty Among Married-Couple Families in Zimmerman
The poverty statistics for married-couple families in Zimmerman show that 15.4% or 153 of the total 996 families live below the poverty line. Families with 1 or 2 children have the highest poverty rate of 21.8%, comprising of 121 families. On the other hand, families with 3 or 4 children have the lowest poverty rate of 0.0%, which includes 0 families.
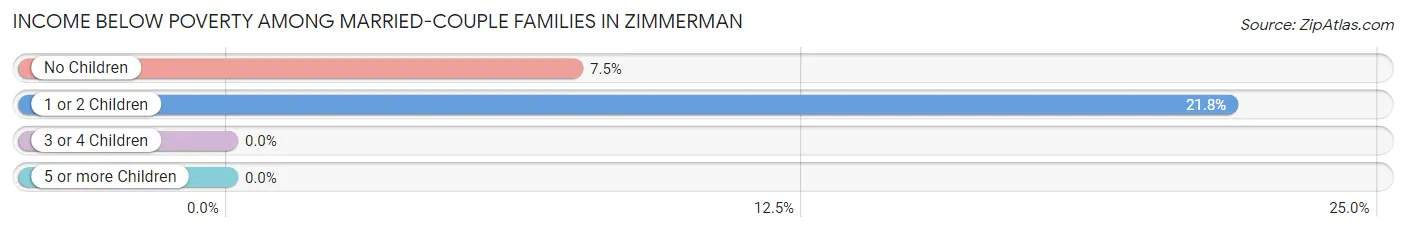
| Children | Above Poverty | Below Poverty |
| No Children | 394 (92.5%) | 32 (7.5%) |
| 1 or 2 Children | 435 (78.2%) | 121 (21.8%) |
| 3 or 4 Children | 14 (100.0%) | 0 (0.0%) |
| 5 or more Children | 0 (0.0%) | 0 (0.0%) |
| Total | 843 (84.6%) | 153 (15.4%) |
Income Below Poverty Among Single-Parent Households in Zimmerman
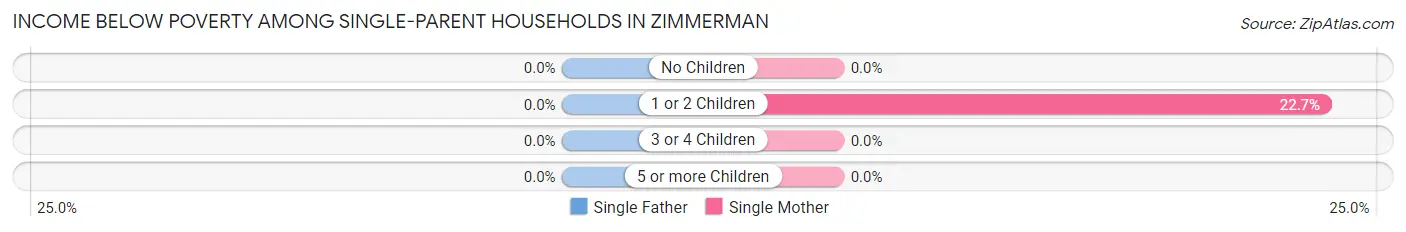
| Children | Single Father | Single Mother |
| No Children | 0 (0.0%) | 0 (0.0%) |
| 1 or 2 Children | 0 (0.0%) | 40 (22.7%) |
| 3 or 4 Children | 0 (0.0%) | 0 (0.0%) |
| 5 or more Children | 0 (0.0%) | 0 (0.0%) |
| Total | 0 (0.0%) | 40 (13.6%) |
Income Below Poverty Among Married-Couple vs Single-Parent Households in Zimmerman
The poverty data for Zimmerman shows that 153 of the married-couple family households (15.4%) and 40 of the single-parent households (8.4%) are living below the poverty level. Within the married-couple family households, those with 1 or 2 children have the highest poverty rate, with 121 households (21.8%) falling below the poverty line. Among the single-parent households, those with 1 or 2 children have the highest poverty rate, with 40 household (20.2%) living below poverty.
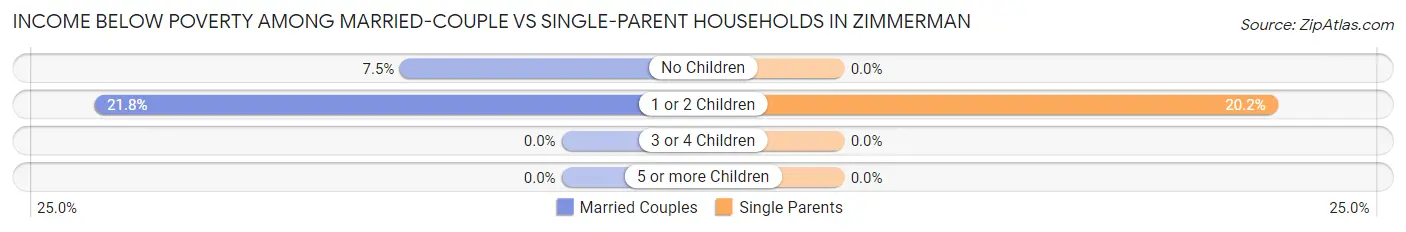
| Children | Married-Couple Families | Single-Parent Households |
| No Children | 32 (7.5%) | 0 (0.0%) |
| 1 or 2 Children | 121 (21.8%) | 40 (20.2%) |
| 3 or 4 Children | 0 (0.0%) | 0 (0.0%) |
| 5 or more Children | 0 (0.0%) | 0 (0.0%) |
| Total | 153 (15.4%) | 40 (8.4%) |
Race in Zimmerman
The most populous races in Zimmerman are White / Caucasian (5,211 | 83.5%), Two or more Races (687 | 11.0%), and Hispanic or Latino (409 | 6.6%).
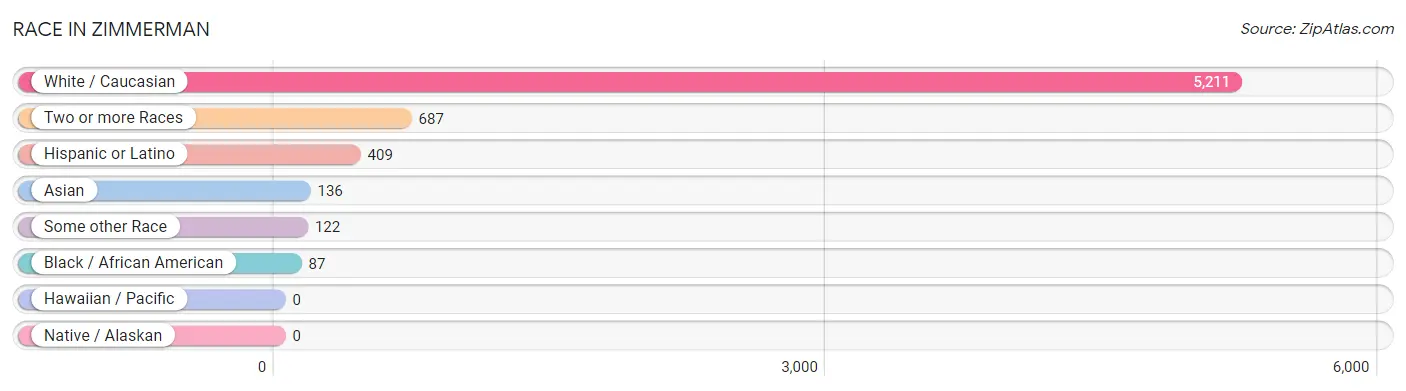
| Race | # Population | % Population |
| Asian | 136 | 2.2% |
| Black / African American | 87 | 1.4% |
| Hawaiian / Pacific | 0 | 0.0% |
| Hispanic or Latino | 409 | 6.6% |
| Native / Alaskan | 0 | 0.0% |
| White / Caucasian | 5,211 | 83.5% |
| Two or more Races | 687 | 11.0% |
| Some other Race | 122 | 1.9% |
| Total | 6,243 | 100.0% |
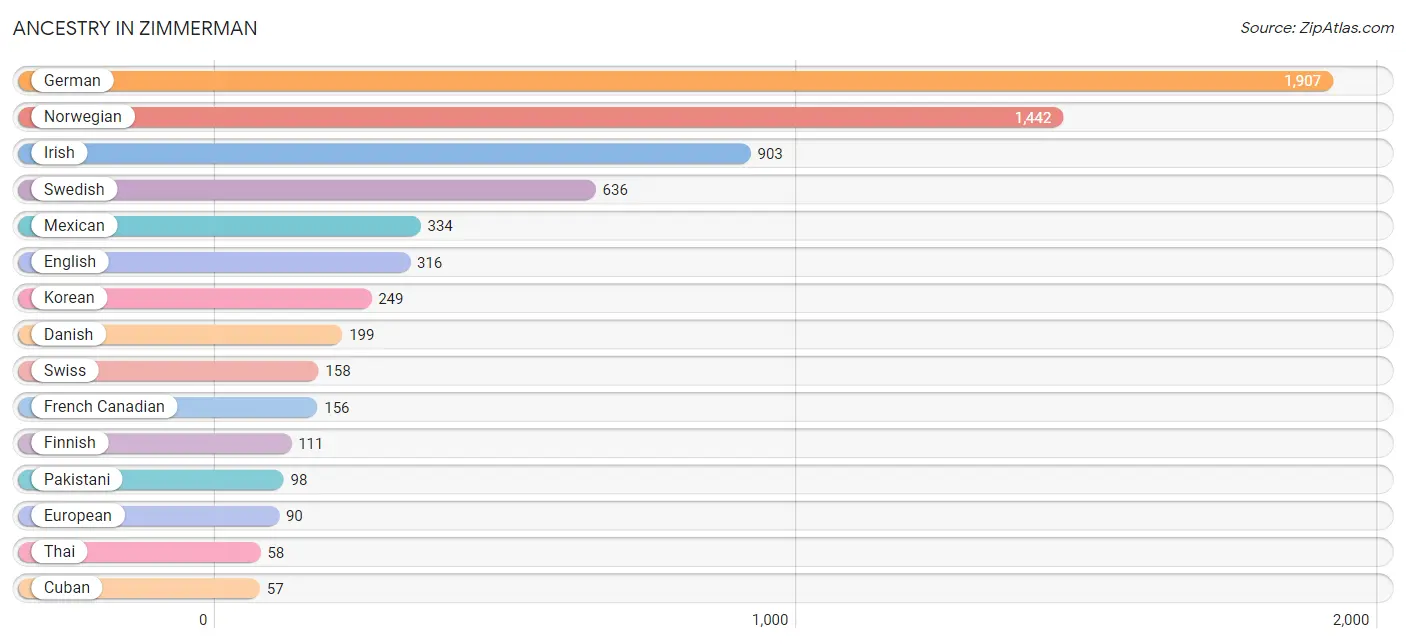
Ancestry in Zimmerman
The most populous ancestries reported in Zimmerman are German (1,907 | 30.5%), Norwegian (1,442 | 23.1%), Irish (903 | 14.5%), Swedish (636 | 10.2%), and Mexican (334 | 5.3%), together accounting for 83.7% of all Zimmerman residents.
| Ancestry | # Population | % Population |
| Alaska Native | 9 | 0.1% |
| American | 13 | 0.2% |
| Belgian | 15 | 0.2% |
| Bhutanese | 33 | 0.5% |
| Blackfeet | 36 | 0.6% |
| Central American | 18 | 0.3% |
| Cherokee | 8 | 0.1% |
| Chippewa | 12 | 0.2% |
| Cuban | 57 | 0.9% |
| Czech | 9 | 0.1% |
| Czechoslovakian | 9 | 0.1% |
| Danish | 199 | 3.2% |
| Dutch | 35 | 0.6% |
| English | 316 | 5.1% |
| European | 90 | 1.4% |
| Finnish | 111 | 1.8% |
| French | 35 | 0.6% |
| French Canadian | 156 | 2.5% |
| German | 1,907 | 30.5% |
| Irish | 903 | 14.5% |
| Italian | 22 | 0.4% |
| Korean | 249 | 4.0% |
| Mexican | 334 | 5.3% |
| Native Hawaiian | 23 | 0.4% |
| Nicaraguan | 18 | 0.3% |
| Norwegian | 1,442 | 23.1% |
| Pakistani | 98 | 1.6% |
| Polish | 56 | 0.9% |
| Russian | 49 | 0.8% |
| Scandinavian | 27 | 0.4% |
| Scotch-Irish | 30 | 0.5% |
| Sioux | 13 | 0.2% |
| Sri Lankan | 8 | 0.1% |
| Swedish | 636 | 10.2% |
| Swiss | 158 | 2.5% |
| Thai | 58 | 0.9% | View All 36 Rows |
Immigrants in Zimmerman
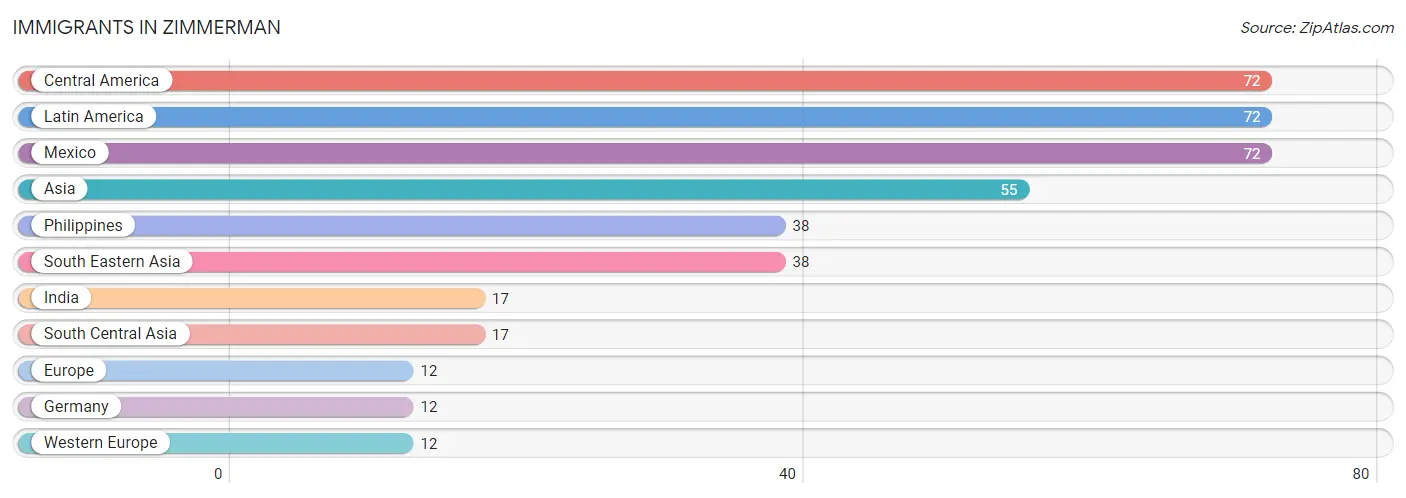
The most numerous immigrant groups reported in Zimmerman came from Central America (72 | 1.1%), Latin America (72 | 1.1%), Mexico (72 | 1.1%), Asia (55 | 0.9%), and Philippines (38 | 0.6%), together accounting for 4.9% of all Zimmerman residents.
| Immigration Origin | # Population | % Population |
| Asia | 55 | 0.9% |
| Central America | 72 | 1.1% |
| Europe | 12 | 0.2% |
| Germany | 12 | 0.2% |
| India | 17 | 0.3% |
| Latin America | 72 | 1.1% |
| Mexico | 72 | 1.1% |
| Philippines | 38 | 0.6% |
| South Central Asia | 17 | 0.3% |
| South Eastern Asia | 38 | 0.6% |
| Western Europe | 12 | 0.2% | View All 11 Rows |
Sex and Age in Zimmerman
Sex and Age in Zimmerman
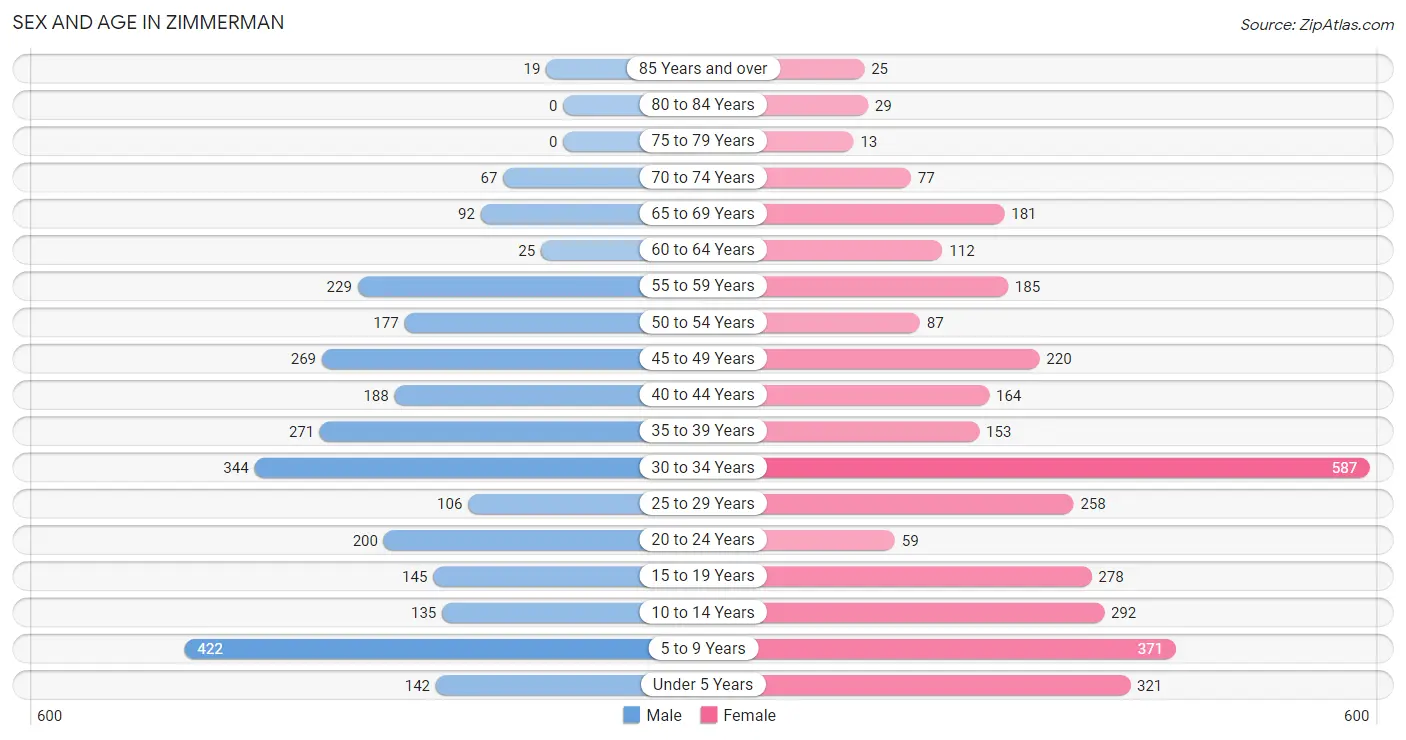
The most populous age groups in Zimmerman are 5 to 9 Years (422 | 14.9%) for men and 30 to 34 Years (587 | 17.2%) for women.
| Age Bracket | Male | Female |
| Under 5 Years | 142 (5.0%) | 321 (9.4%) |
| 5 to 9 Years | 422 (14.9%) | 371 (10.9%) |
| 10 to 14 Years | 135 (4.8%) | 292 (8.6%) |
| 15 to 19 Years | 145 (5.1%) | 278 (8.2%) |
| 20 to 24 Years | 200 (7.1%) | 59 (1.7%) |
| 25 to 29 Years | 106 (3.7%) | 258 (7.6%) |
| 30 to 34 Years | 344 (12.1%) | 587 (17.2%) |
| 35 to 39 Years | 271 (9.6%) | 153 (4.5%) |
| 40 to 44 Years | 188 (6.6%) | 164 (4.8%) |
| 45 to 49 Years | 269 (9.5%) | 220 (6.5%) |
| 50 to 54 Years | 177 (6.2%) | 87 (2.5%) |
| 55 to 59 Years | 229 (8.1%) | 185 (5.4%) |
| 60 to 64 Years | 25 (0.9%) | 112 (3.3%) |
| 65 to 69 Years | 92 (3.3%) | 181 (5.3%) |
| 70 to 74 Years | 67 (2.4%) | 77 (2.3%) |
| 75 to 79 Years | 0 (0.0%) | 13 (0.4%) |
| 80 to 84 Years | 0 (0.0%) | 29 (0.9%) |
| 85 Years and over | 19 (0.7%) | 25 (0.7%) |
| Total | 2,831 (100.0%) | 3,412 (100.0%) |
Families and Households in Zimmerman
Median Family Size in Zimmerman
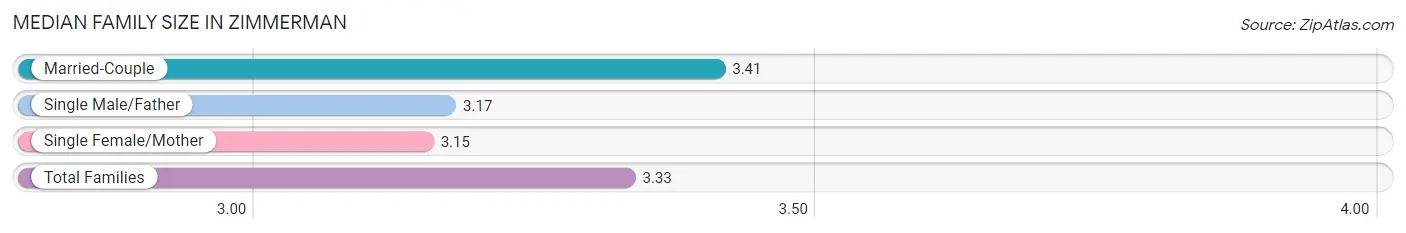
The median family size in Zimmerman is 3.33 persons per family, with married-couple families (996 | 67.7%) accounting for the largest median family size of 3.41 persons per family. On the other hand, single female/mother families (295 | 20.0%) represent the smallest median family size with 3.15 persons per family.
| Family Type | # Families | Family Size |
| Married-Couple | 996 (67.7%) | 3.41 |
| Single Male/Father | 181 (12.3%) | 3.17 |
| Single Female/Mother | 295 (20.0%) | 3.15 |
| Total Families | 1,472 (100.0%) | 3.33 |
Median Household Size in Zimmerman
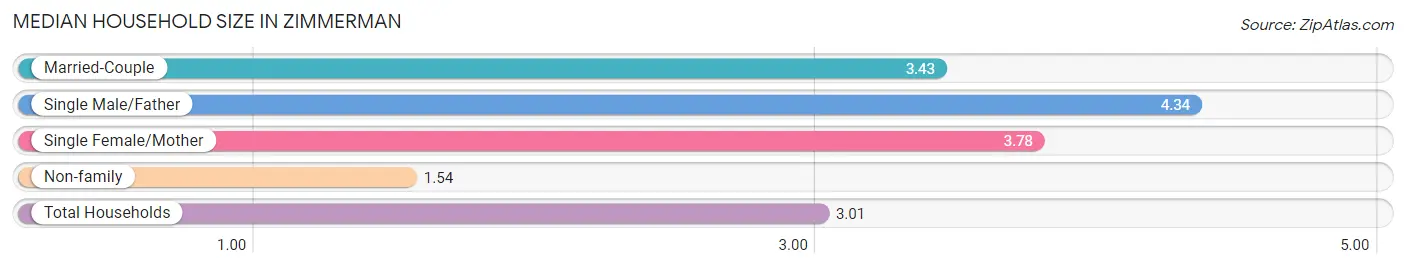
The median household size in Zimmerman is 3.01 persons per household, with single male/father households (181 | 8.7%) accounting for the largest median household size of 4.34 persons per household. non-family households (603 | 29.1%) represent the smallest median household size with 1.54 persons per household.
| Household Type | # Households | Household Size |
| Married-Couple | 996 (48.0%) | 3.43 |
| Single Male/Father | 181 (8.7%) | 4.34 |
| Single Female/Mother | 295 (14.2%) | 3.78 |
| Non-family | 603 (29.1%) | 1.54 |
| Total Households | 2,075 (100.0%) | 3.01 |
Household Size by Marriage Status in Zimmerman
Out of a total of 2,075 households in Zimmerman, 1,472 (70.9%) are family households, while 603 (29.1%) are nonfamily households. The most numerous type of family households are 4-person households, comprising 532, and the most common type of nonfamily households are 1-person households, comprising 416.
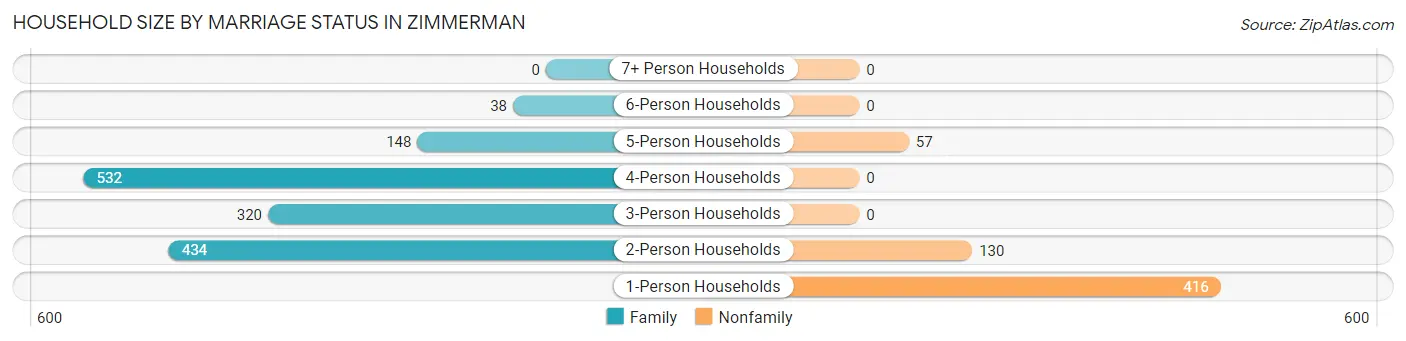
| Household Size | Family Households | Nonfamily Households |
| 1-Person Households | - | 416 (20.1%) |
| 2-Person Households | 434 (20.9%) | 130 (6.3%) |
| 3-Person Households | 320 (15.4%) | 0 (0.0%) |
| 4-Person Households | 532 (25.6%) | 0 (0.0%) |
| 5-Person Households | 148 (7.1%) | 57 (2.8%) |
| 6-Person Households | 38 (1.8%) | 0 (0.0%) |
| 7+ Person Households | 0 (0.0%) | 0 (0.0%) |
| Total | 1,472 (70.9%) | 603 (29.1%) |
Female Fertility in Zimmerman
Fertility by Age in Zimmerman
Average fertility rate in Zimmerman is 124.0 births per 1,000 women. Women in the age bracket of 20 to 34 years have the highest fertility rate with 237.0 births per 1,000 women. Women in the age bracket of 20 to 34 years acount for 100.0% of all women with births.
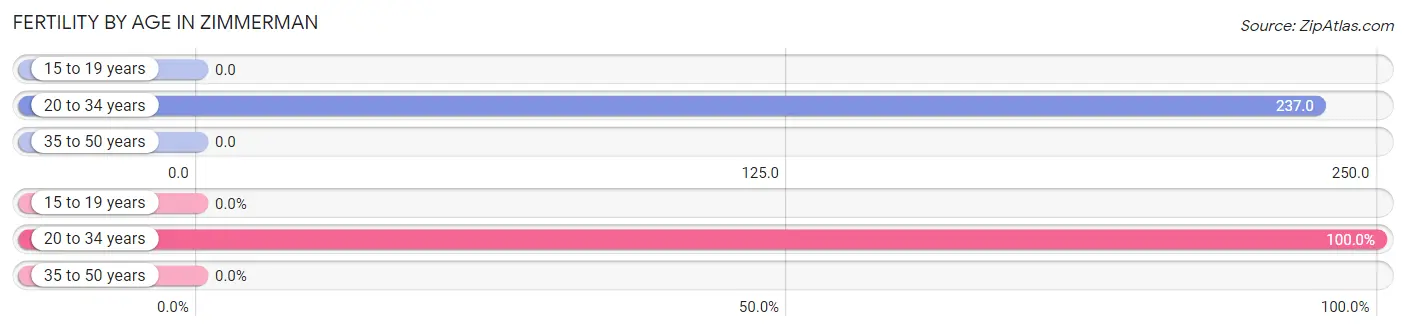
| Age Bracket | Women with Births | Births / 1,000 Women |
| 15 to 19 years | 0 (0.0%) | 0.0 |
| 20 to 34 years | 214 (100.0%) | 237.0 |
| 35 to 50 years | 0 (0.0%) | 0.0 |
| Total | 214 (100.0%) | 124.0 |
Fertility by Age by Marriage Status in Zimmerman
6.1% of women with births (214) in Zimmerman are married. The highest percentage of unmarried women with births falls into 20 to 34 years age bracket with 93.9% of them unmarried at the time of birth, while the lowest percentage of unmarried women with births belong to 20 to 34 years age bracket with 93.9% of them unmarried.
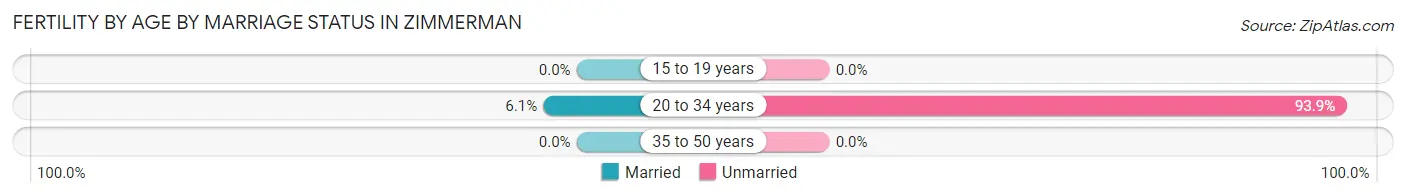
| Age Bracket | Married | Unmarried |
| 15 to 19 years | 0 (0.0%) | 0 (0.0%) |
| 20 to 34 years | 13 (6.1%) | 201 (93.9%) |
| 35 to 50 years | 0 (0.0%) | 0 (0.0%) |
| Total | 13 (6.1%) | 201 (93.9%) |
Fertility by Education in Zimmerman
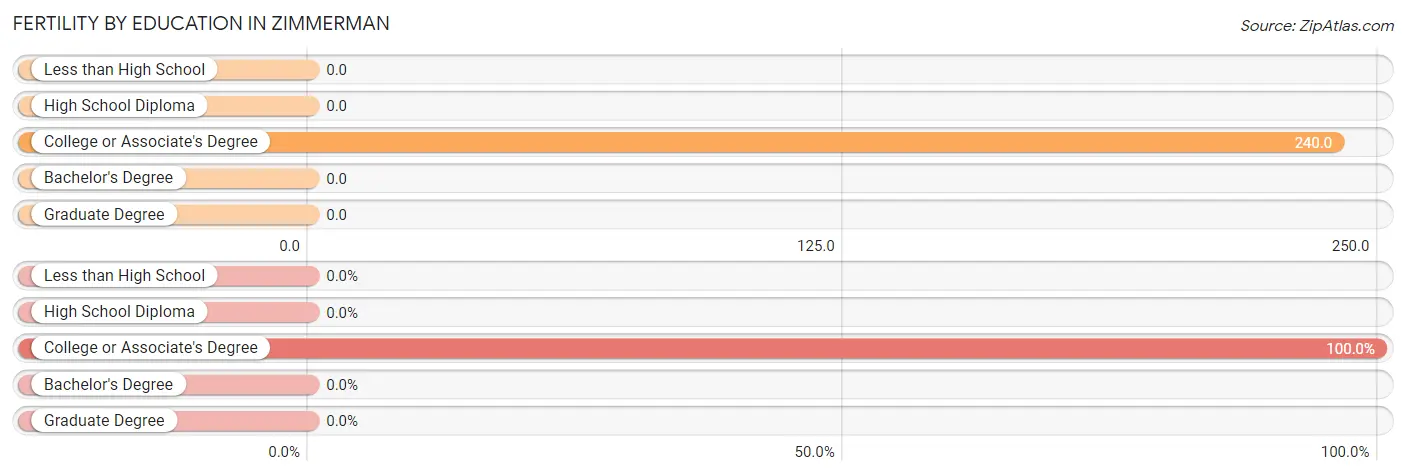
| Educational Attainment | Women with Births | Births / 1,000 Women |
| Less than High School | 0 (0.0%) | 0.0 |
| High School Diploma | 0 (0.0%) | 0.0 |
| College or Associate's Degree | 214 (100.0%) | 240.0 |
| Bachelor's Degree | 0 (0.0%) | 0.0 |
| Graduate Degree | 0 (0.0%) | 0.0 |
| Total | 214 (100.0%) | 124.0 |
Fertility by Education by Marriage Status in Zimmerman
93.9% of women with births in Zimmerman are unmarried. Women with the educational attainment of college or associate's degree are most likely to be married with 6.1% of them married at childbirth, while women with the educational attainment of college or associate's degree are least likely to be married with 93.9% of them unmarried at childbirth.
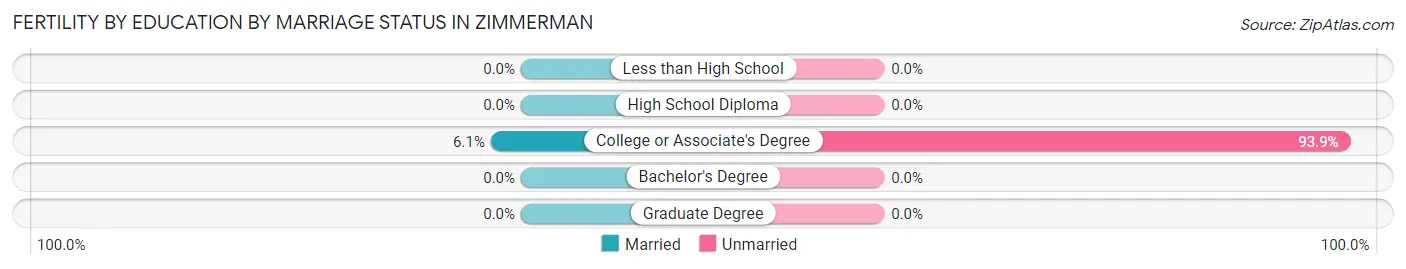
| Educational Attainment | Married | Unmarried |
| Less than High School | 0 (0.0%) | 0 (0.0%) |
| High School Diploma | 0 (0.0%) | 0 (0.0%) |
| College or Associate's Degree | 13 (6.1%) | 201 (93.9%) |
| Bachelor's Degree | 0 (0.0%) | 0 (0.0%) |
| Graduate Degree | 0 (0.0%) | 0 (0.0%) |
| Total | 13 (6.1%) | 201 (93.9%) |
Employment Characteristics in Zimmerman
Employment by Class of Employer in Zimmerman
Among the 3,508 employed individuals in Zimmerman, private company employees (2,427 | 69.2%), not-for-profit organizations (269 | 7.7%), and self-employed (incorporated) (238 | 6.8%) make up the most common classes of employment.
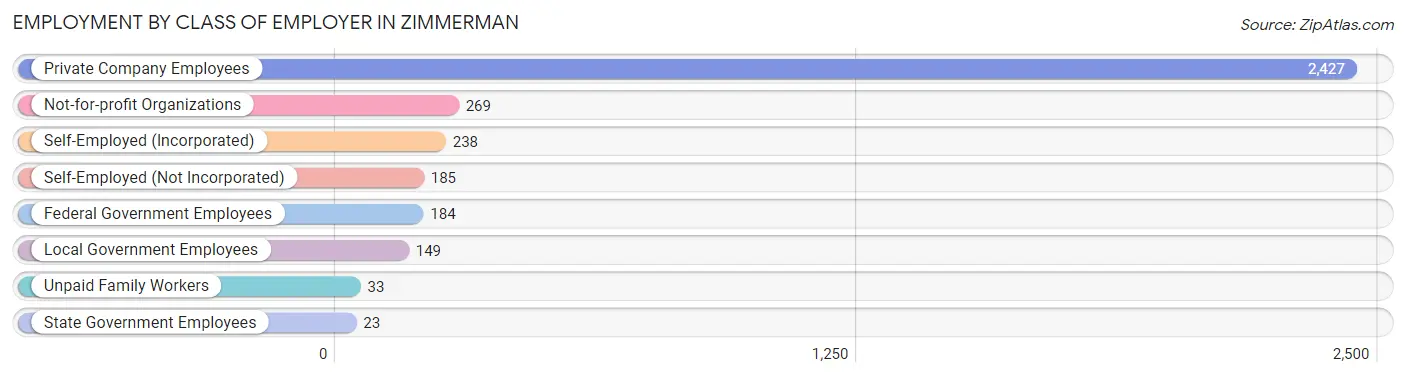
| Employer Class | # Employees | % Employees |
| Private Company Employees | 2,427 | 69.2% |
| Self-Employed (Incorporated) | 238 | 6.8% |
| Self-Employed (Not Incorporated) | 185 | 5.3% |
| Not-for-profit Organizations | 269 | 7.7% |
| Local Government Employees | 149 | 4.3% |
| State Government Employees | 23 | 0.7% |
| Federal Government Employees | 184 | 5.2% |
| Unpaid Family Workers | 33 | 0.9% |
| Total | 3,508 | 100.0% |
Employment Status by Age in Zimmerman
According to the labor force statistics for Zimmerman, out of the total population over 16 years of age (4,375), 80.6% or 3,526 individuals are in the labor force, with 0.3% or 11 of them unemployed. The age group with the highest labor force participation rate is 20 to 24 years, with 100.0% or 259 individuals in the labor force. Within the labor force, the 25 to 29 years age range has the highest percentage of unemployed individuals, with 3.0% or 11 of them being unemployed.
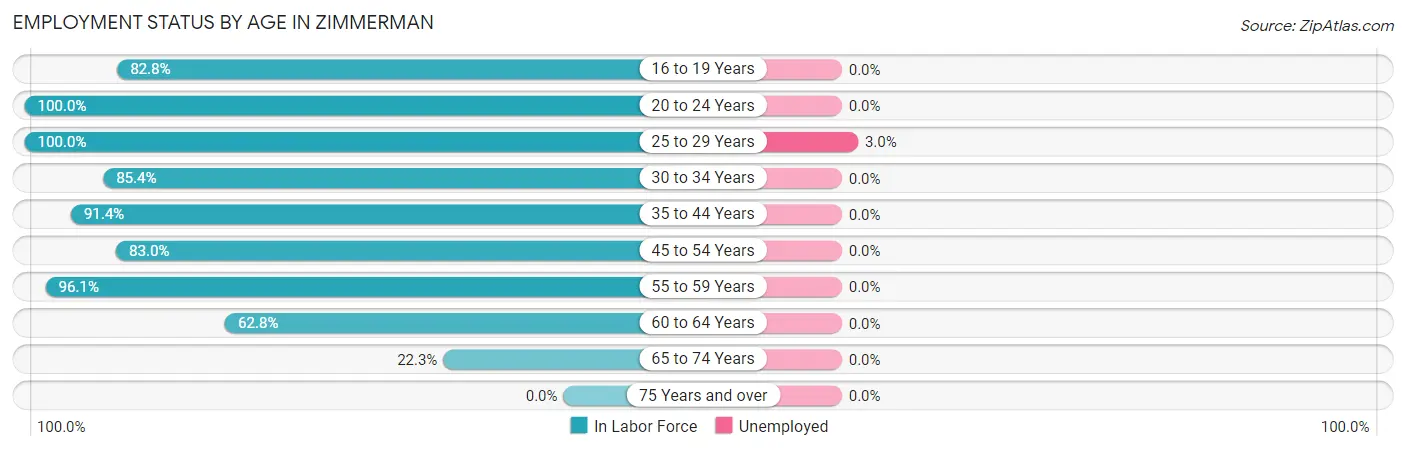
| Age Bracket | In Labor Force | Unemployed |
| 16 to 19 Years | 197 (82.8%) | 0 (0.0%) |
| 20 to 24 Years | 259 (100.0%) | 0 (0.0%) |
| 25 to 29 Years | 364 (100.0%) | 11 (3.0%) |
| 30 to 34 Years | 795 (85.4%) | 0 (0.0%) |
| 35 to 44 Years | 709 (91.4%) | 0 (0.0%) |
| 45 to 54 Years | 625 (83.0%) | 0 (0.0%) |
| 55 to 59 Years | 398 (96.1%) | 0 (0.0%) |
| 60 to 64 Years | 86 (62.8%) | 0 (0.0%) |
| 65 to 74 Years | 93 (22.3%) | 0 (0.0%) |
| 75 Years and over | 0 (0.0%) | 0 (0.0%) |
| Total | 3,526 (80.6%) | 11 (0.3%) |
Employment Status by Educational Attainment in Zimmerman
According to labor force statistics for Zimmerman, 88.2% of individuals (2,977) out of the total population between 25 and 64 years of age (3,375) are in the labor force, with 0.4% or 12 of them being unemployed. The group with the highest labor force participation rate are those with the educational attainment of bachelor's degree or higher, with 100.0% or 499 individuals in the labor force. Within the labor force, individuals with college / associate degree education have the highest percentage of unemployment, with 0.7% or 12 of them being unemployed.
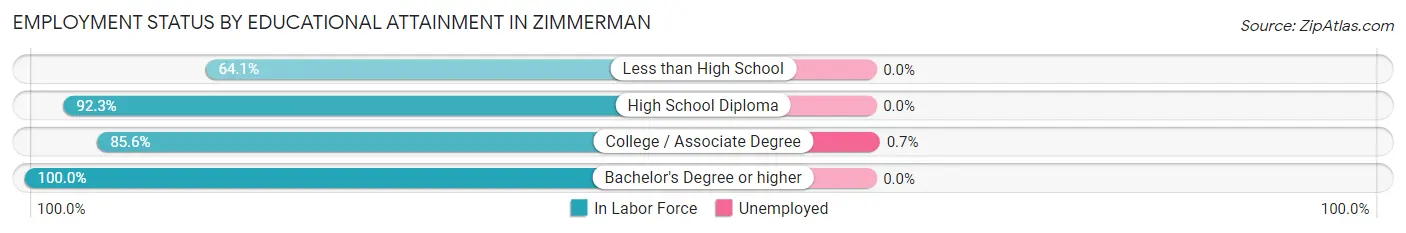
| Educational Attainment | In Labor Force | Unemployed |
| Less than High School | 107 (64.1%) | 0 (0.0%) |
| High School Diploma | 728 (92.3%) | 0 (0.0%) |
| College / Associate Degree | 1,644 (85.6%) | 13 (0.7%) |
| Bachelor's Degree or higher | 499 (100.0%) | 0 (0.0%) |
| Total | 2,977 (88.2%) | 14 (0.4%) |
Employment Occupations by Sex in Zimmerman
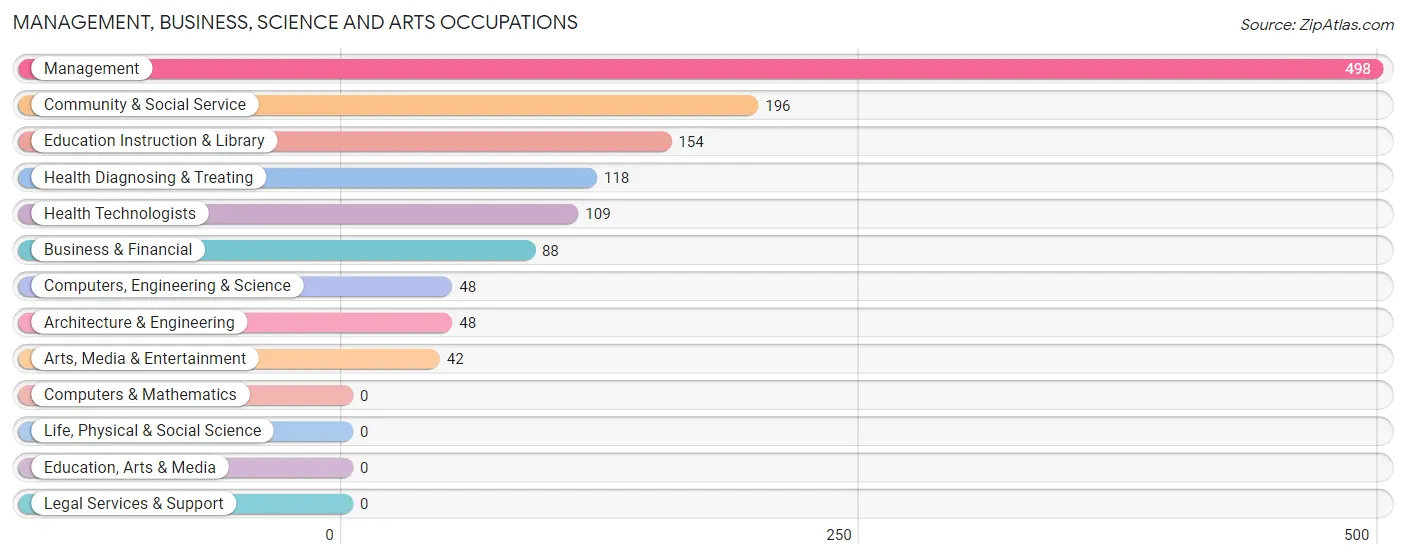
Management, Business, Science and Arts Occupations
The most common Management, Business, Science and Arts occupations in Zimmerman are Management (498 | 14.8%), Community & Social Service (196 | 5.8%), Education Instruction & Library (154 | 4.6%), Health Diagnosing & Treating (118 | 3.5%), and Health Technologists (109 | 3.3%).
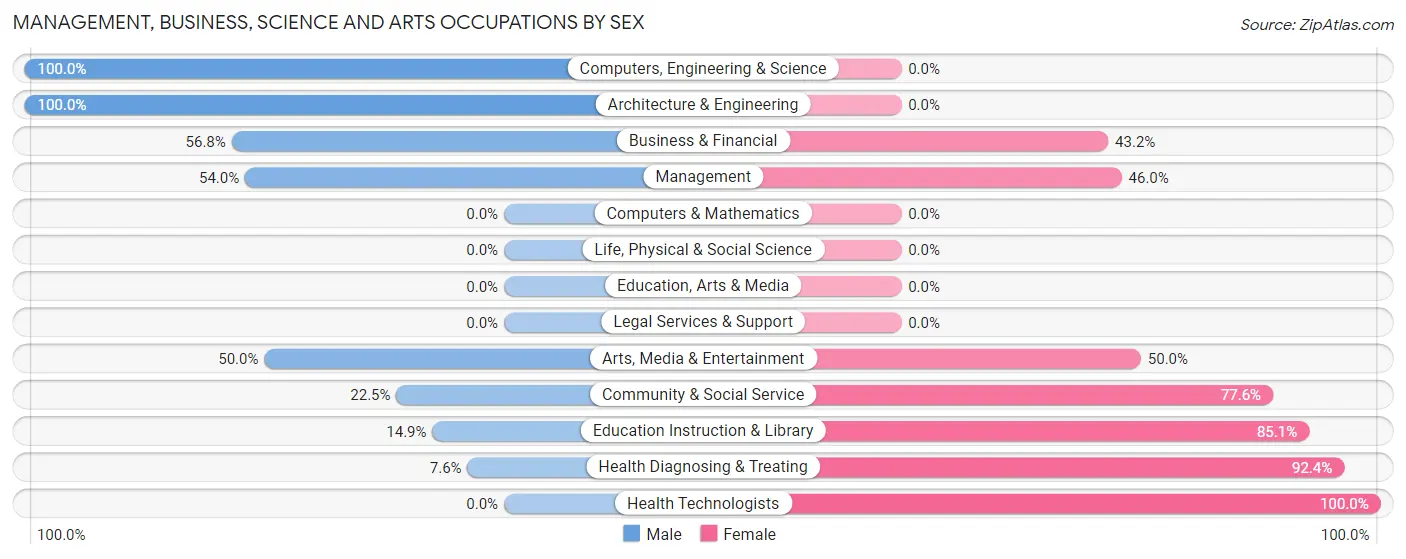
Management, Business, Science and Arts Occupations by Sex
Within the Management, Business, Science and Arts occupations in Zimmerman, the most male-oriented occupations are Computers, Engineering & Science (100.0%), Architecture & Engineering (100.0%), and Business & Financial (56.8%), while the most female-oriented occupations are Health Technologists (100.0%), Health Diagnosing & Treating (92.4%), and Education Instruction & Library (85.1%).
| Occupation | Male | Female |
| Management | 269 (54.0%) | 229 (46.0%) |
| Business & Financial | 50 (56.8%) | 38 (43.2%) |
| Computers, Engineering & Science | 48 (100.0%) | 0 (0.0%) |
| Computers & Mathematics | 0 (0.0%) | 0 (0.0%) |
| Architecture & Engineering | 48 (100.0%) | 0 (0.0%) |
| Life, Physical & Social Science | 0 (0.0%) | 0 (0.0%) |
| Community & Social Service | 44 (22.5%) | 152 (77.5%) |
| Education, Arts & Media | 0 (0.0%) | 0 (0.0%) |
| Legal Services & Support | 0 (0.0%) | 0 (0.0%) |
| Education Instruction & Library | 23 (14.9%) | 131 (85.1%) |
| Arts, Media & Entertainment | 21 (50.0%) | 21 (50.0%) |
| Health Diagnosing & Treating | 9 (7.6%) | 109 (92.4%) |
| Health Technologists | 0 (0.0%) | 109 (100.0%) |
| Total (Category) | 420 (44.3%) | 528 (55.7%) |
| Total (Overall) | 1,789 (53.3%) | 1,569 (46.7%) |
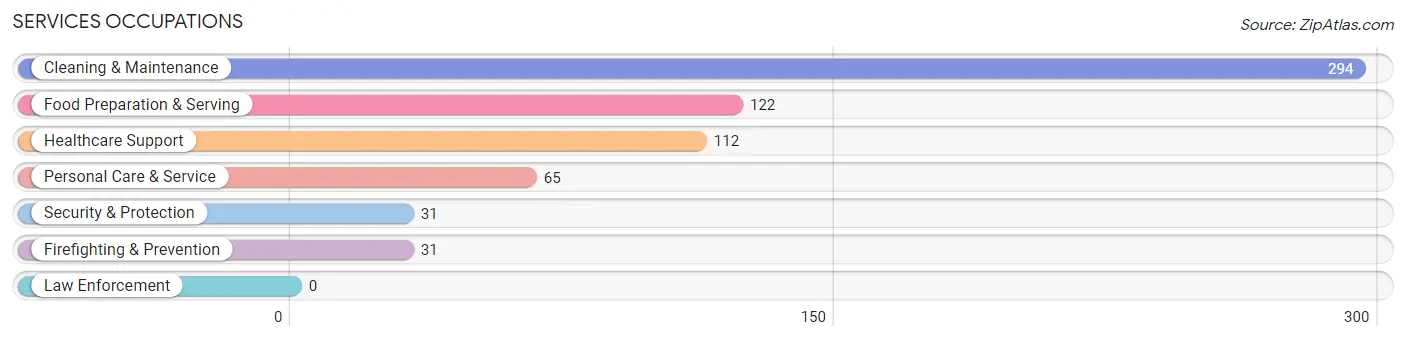
Services Occupations
The most common Services occupations in Zimmerman are Cleaning & Maintenance (294 | 8.8%), Food Preparation & Serving (122 | 3.6%), Healthcare Support (112 | 3.3%), Personal Care & Service (65 | 1.9%), and Security & Protection (31 | 0.9%).
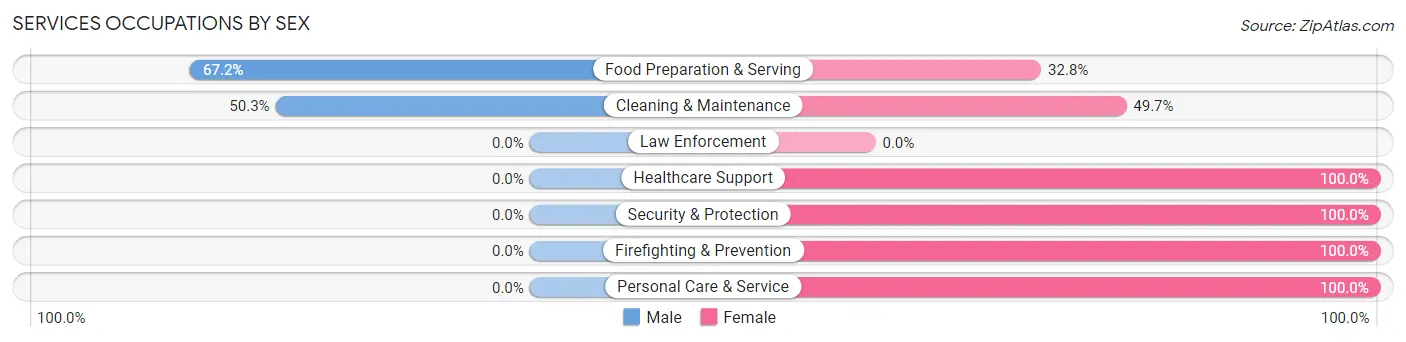
Services Occupations by Sex
Within the Services occupations in Zimmerman, the most male-oriented occupations are Food Preparation & Serving (67.2%), and Cleaning & Maintenance (50.3%), while the most female-oriented occupations are Healthcare Support (100.0%), Security & Protection (100.0%), and Firefighting & Prevention (100.0%).
| Occupation | Male | Female |
| Healthcare Support | 0 (0.0%) | 112 (100.0%) |
| Security & Protection | 0 (0.0%) | 31 (100.0%) |
| Firefighting & Prevention | 0 (0.0%) | 31 (100.0%) |
| Law Enforcement | 0 (0.0%) | 0 (0.0%) |
| Food Preparation & Serving | 82 (67.2%) | 40 (32.8%) |
| Cleaning & Maintenance | 148 (50.3%) | 146 (49.7%) |
| Personal Care & Service | 0 (0.0%) | 65 (100.0%) |
| Total (Category) | 230 (36.9%) | 394 (63.1%) |
| Total (Overall) | 1,789 (53.3%) | 1,569 (46.7%) |
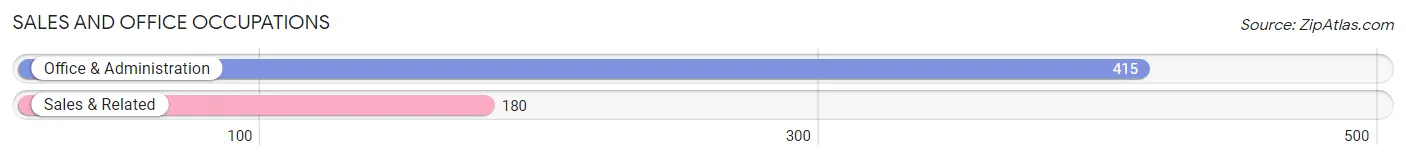
Sales and Office Occupations
The most common Sales and Office occupations in Zimmerman are Office & Administration (415 | 12.4%), and Sales & Related (180 | 5.4%).
Sales and Office Occupations by Sex
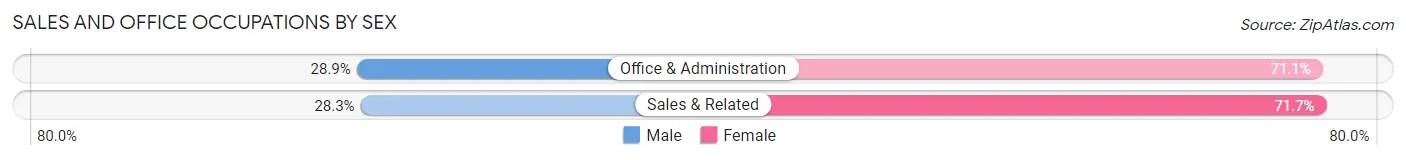
| Occupation | Male | Female |
| Sales & Related | 51 (28.3%) | 129 (71.7%) |
| Office & Administration | 120 (28.9%) | 295 (71.1%) |
| Total (Category) | 171 (28.7%) | 424 (71.3%) |
| Total (Overall) | 1,789 (53.3%) | 1,569 (46.7%) |
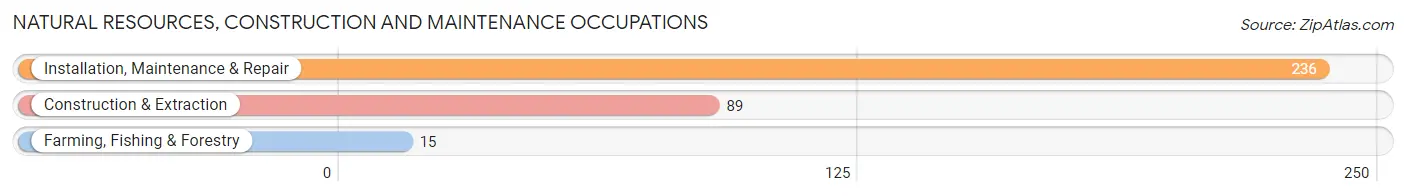
Natural Resources, Construction and Maintenance Occupations
The most common Natural Resources, Construction and Maintenance occupations in Zimmerman are Installation, Maintenance & Repair (236 | 7.0%), Construction & Extraction (89 | 2.6%), and Farming, Fishing & Forestry (15 | 0.4%).
Natural Resources, Construction and Maintenance Occupations by Sex
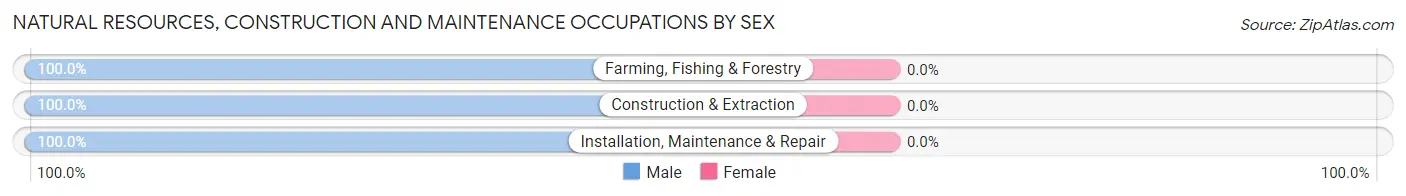
| Occupation | Male | Female |
| Farming, Fishing & Forestry | 15 (100.0%) | 0 (0.0%) |
| Construction & Extraction | 89 (100.0%) | 0 (0.0%) |
| Installation, Maintenance & Repair | 236 (100.0%) | 0 (0.0%) |
| Total (Category) | 340 (100.0%) | 0 (0.0%) |
| Total (Overall) | 1,789 (53.3%) | 1,569 (46.7%) |
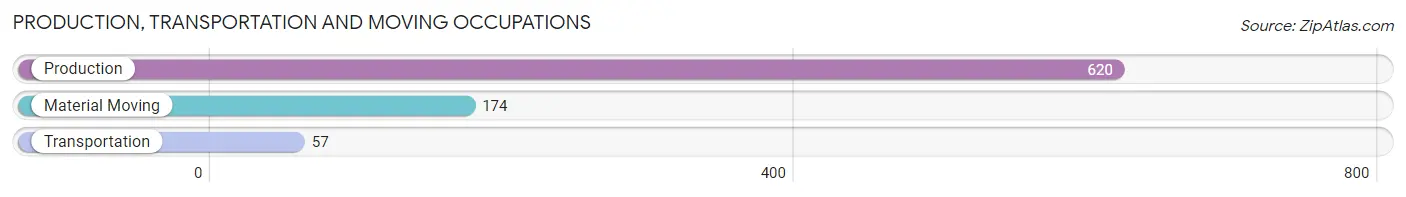
Production, Transportation and Moving Occupations
The most common Production, Transportation and Moving occupations in Zimmerman are Production (620 | 18.5%), Material Moving (174 | 5.2%), and Transportation (57 | 1.7%).
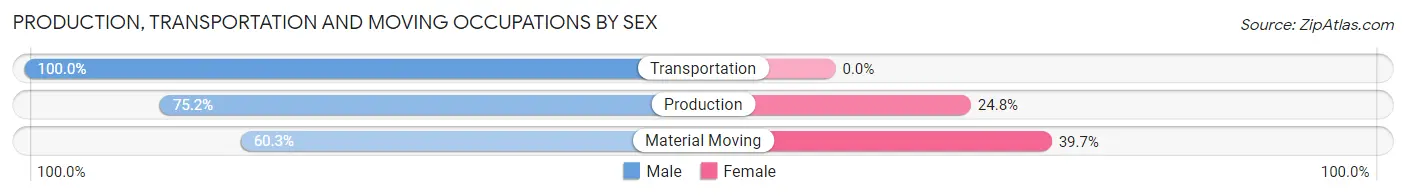
Production, Transportation and Moving Occupations by Sex
| Occupation | Male | Female |
| Production | 466 (75.2%) | 154 (24.8%) |
| Transportation | 57 (100.0%) | 0 (0.0%) |
| Material Moving | 105 (60.3%) | 69 (39.7%) |
| Total (Category) | 628 (73.8%) | 223 (26.2%) |
| Total (Overall) | 1,789 (53.3%) | 1,569 (46.7%) |
Employment Industries by Sex in Zimmerman
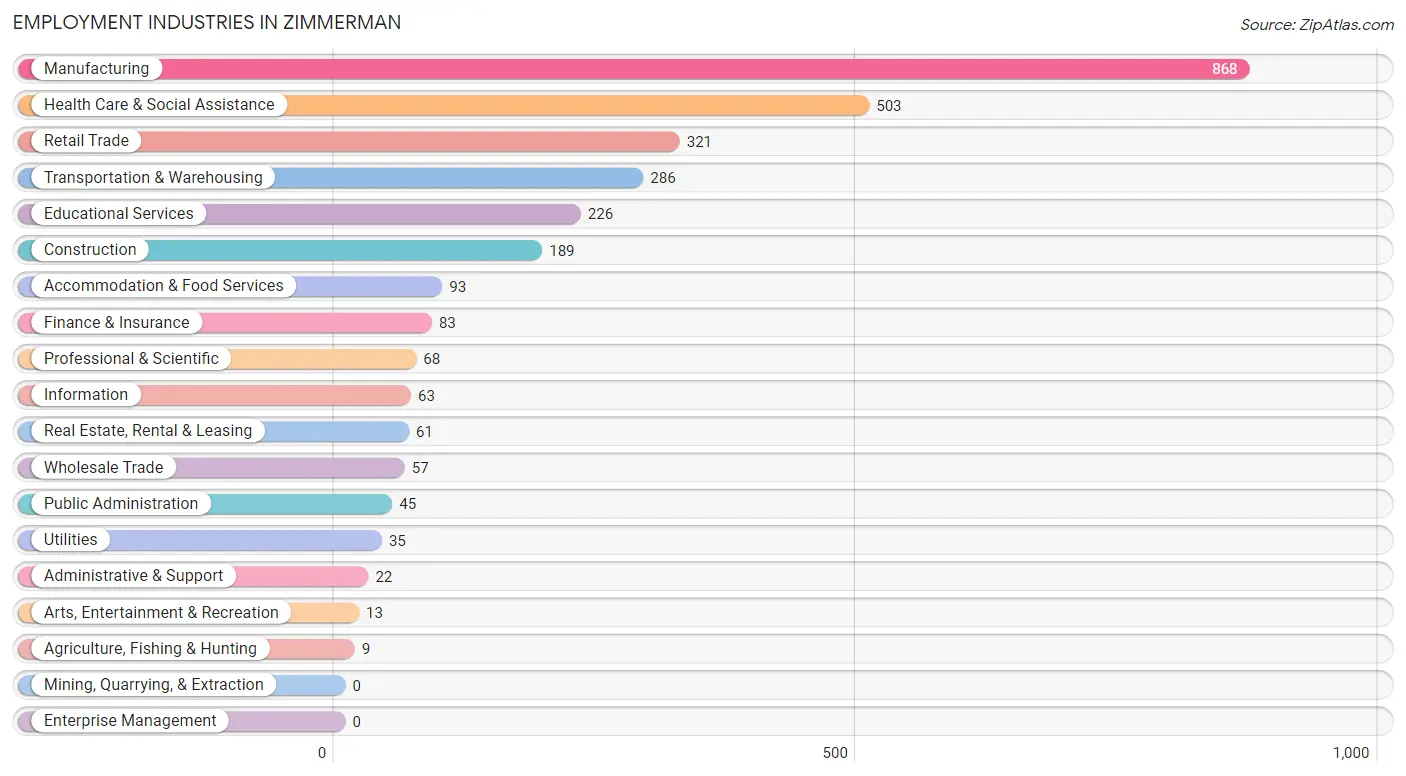
Employment Industries in Zimmerman
The major employment industries in Zimmerman include Manufacturing (868 | 25.9%), Health Care & Social Assistance (503 | 15.0%), Retail Trade (321 | 9.6%), Transportation & Warehousing (286 | 8.5%), and Educational Services (226 | 6.7%).
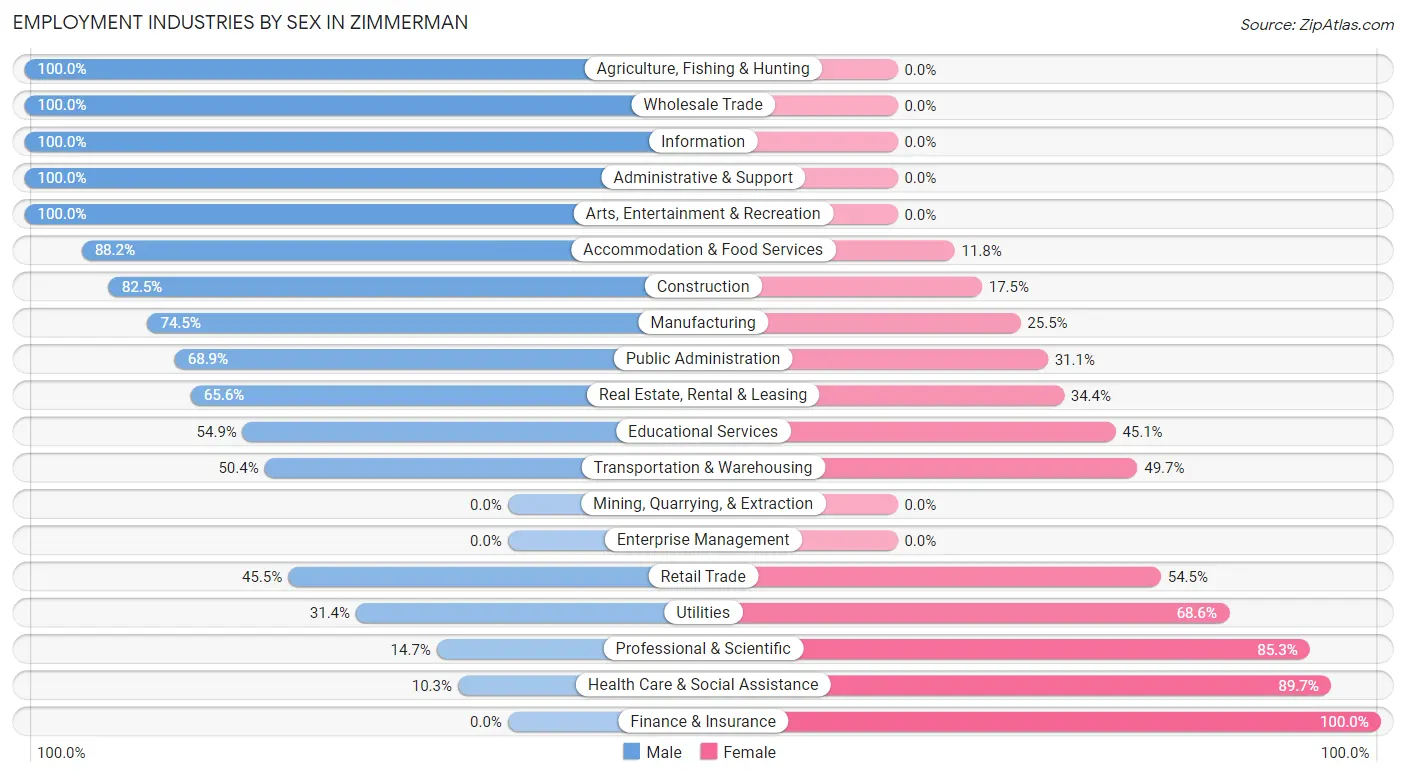
Employment Industries by Sex in Zimmerman
The Zimmerman industries that see more men than women are Agriculture, Fishing & Hunting (100.0%), Wholesale Trade (100.0%), and Information (100.0%), whereas the industries that tend to have a higher number of women are Finance & Insurance (100.0%), Health Care & Social Assistance (89.7%), and Professional & Scientific (85.3%).
| Industry | Male | Female |
| Agriculture, Fishing & Hunting | 9 (100.0%) | 0 (0.0%) |
| Mining, Quarrying, & Extraction | 0 (0.0%) | 0 (0.0%) |
| Construction | 156 (82.5%) | 33 (17.5%) |
| Manufacturing | 647 (74.5%) | 221 (25.5%) |
| Wholesale Trade | 57 (100.0%) | 0 (0.0%) |
| Retail Trade | 146 (45.5%) | 175 (54.5%) |
| Transportation & Warehousing | 144 (50.3%) | 142 (49.6%) |
| Utilities | 11 (31.4%) | 24 (68.6%) |
| Information | 63 (100.0%) | 0 (0.0%) |
| Finance & Insurance | 0 (0.0%) | 83 (100.0%) |
| Real Estate, Rental & Leasing | 40 (65.6%) | 21 (34.4%) |
| Professional & Scientific | 10 (14.7%) | 58 (85.3%) |
| Enterprise Management | 0 (0.0%) | 0 (0.0%) |
| Administrative & Support | 22 (100.0%) | 0 (0.0%) |
| Educational Services | 124 (54.9%) | 102 (45.1%) |
| Health Care & Social Assistance | 52 (10.3%) | 451 (89.7%) |
| Arts, Entertainment & Recreation | 13 (100.0%) | 0 (0.0%) |
| Accommodation & Food Services | 82 (88.2%) | 11 (11.8%) |
| Public Administration | 31 (68.9%) | 14 (31.1%) |
| Total | 1,789 (53.3%) | 1,569 (46.7%) |
Education in Zimmerman
School Enrollment in Zimmerman
The most common levels of schooling among the 1,672 students in Zimmerman are elementary school (663 | 39.7%), high school (301 | 18.0%), and middle school (251 | 15.0%).
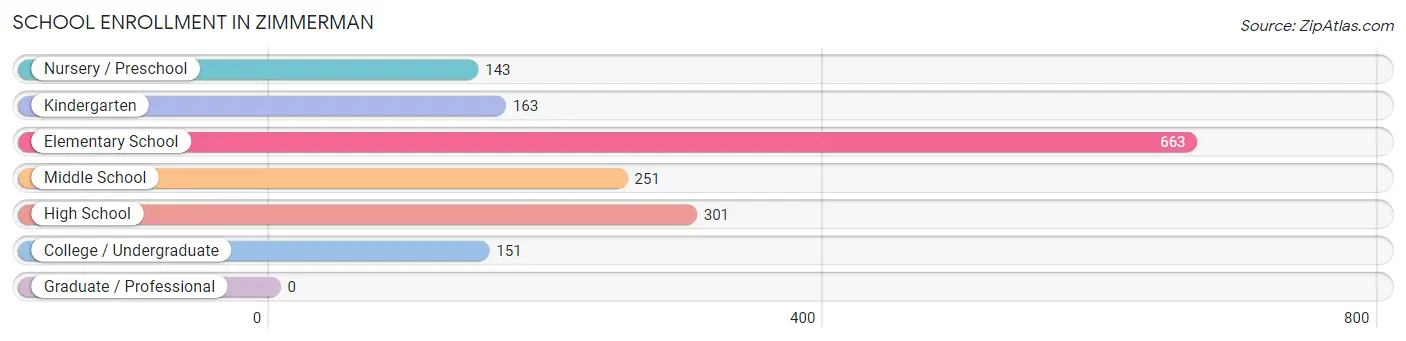
| School Level | # Students | % Students |
| Nursery / Preschool | 143 | 8.6% |
| Kindergarten | 163 | 9.8% |
| Elementary School | 663 | 39.7% |
| Middle School | 251 | 15.0% |
| High School | 301 | 18.0% |
| College / Undergraduate | 151 | 9.0% |
| Graduate / Professional | 0 | 0.0% |
| Total | 1,672 | 100.0% |
School Enrollment by Age by Funding Source in Zimmerman
Out of a total of 1,672 students who are enrolled in schools in Zimmerman, 3 (0.2%) attend a private institution, while the remaining 1,669 (99.8%) are enrolled in public schools. The age group of 10 to 14 year olds has the highest likelihood of being enrolled in private schools, with 3 (0.7% in the age bracket) enrolled. Conversely, the age group of 3 to 4 year olds has the lowest likelihood of being enrolled in a private school, with 105 (100.0% in the age bracket) attending a public institution.
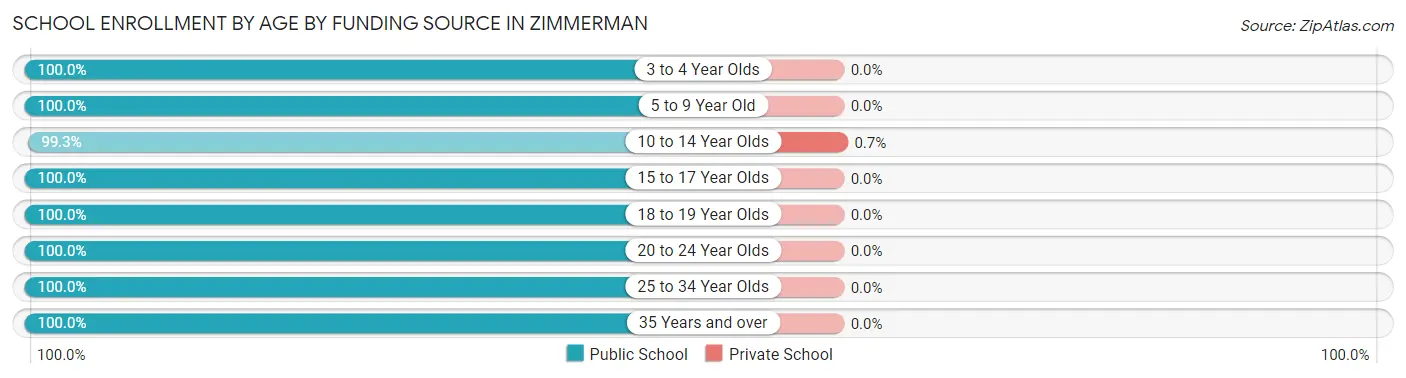
| Age Bracket | Public School | Private School |
| 3 to 4 Year Olds | 105 (100.0%) | 0 (0.0%) |
| 5 to 9 Year Old | 709 (100.0%) | 0 (0.0%) |
| 10 to 14 Year Olds | 424 (99.3%) | 3 (0.7%) |
| 15 to 17 Year Olds | 280 (100.0%) | 0 (0.0%) |
| 18 to 19 Year Olds | 14 (100.0%) | 0 (0.0%) |
| 20 to 24 Year Olds | 19 (100.0%) | 0 (0.0%) |
| 25 to 34 Year Olds | 86 (100.0%) | 0 (0.0%) |
| 35 Years and over | 32 (100.0%) | 0 (0.0%) |
| Total | 1,669 (99.8%) | 3 (0.2%) |
Educational Attainment by Field of Study in Zimmerman
Arts & humanities (137 | 17.7%), literature & languages (112 | 14.4%), bio, nature & agricultural (107 | 13.8%), social sciences (98 | 12.7%), and business (95 | 12.3%) are the most common fields of study among 775 individuals in Zimmerman who have obtained a bachelor's degree or higher.
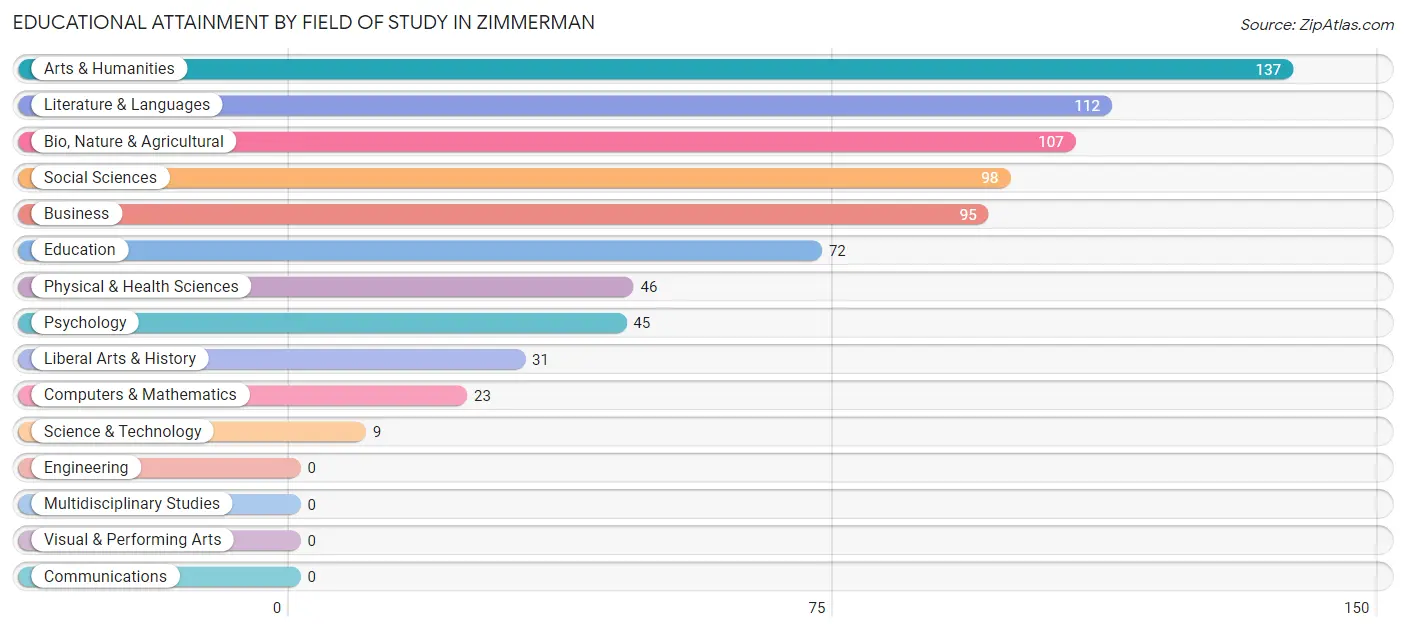
| Field of Study | # Graduates | % Graduates |
| Computers & Mathematics | 23 | 3.0% |
| Bio, Nature & Agricultural | 107 | 13.8% |
| Physical & Health Sciences | 46 | 5.9% |
| Psychology | 45 | 5.8% |
| Social Sciences | 98 | 12.7% |
| Engineering | 0 | 0.0% |
| Multidisciplinary Studies | 0 | 0.0% |
| Science & Technology | 9 | 1.2% |
| Business | 95 | 12.3% |
| Education | 72 | 9.3% |
| Literature & Languages | 112 | 14.4% |
| Liberal Arts & History | 31 | 4.0% |
| Visual & Performing Arts | 0 | 0.0% |
| Communications | 0 | 0.0% |
| Arts & Humanities | 137 | 17.7% |
| Total | 775 | 100.0% |
Transportation & Commute in Zimmerman
Vehicle Availability by Sex in Zimmerman
The most prevalent vehicle ownership categories in Zimmerman are males with 2 vehicles (923, accounting for 51.3%) and females with 2 vehicles (898, making up 54.0%).
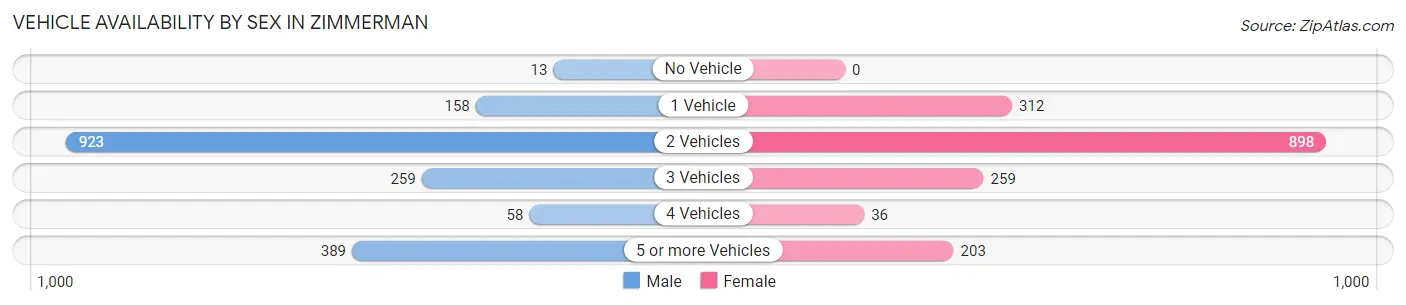
| Vehicles Available | Male | Female |
| No Vehicle | 13 (0.7%) | 0 (0.0%) |
| 1 Vehicle | 158 (8.8%) | 312 (18.3%) |
| 2 Vehicles | 923 (51.3%) | 898 (52.6%) |
| 3 Vehicles | 259 (14.4%) | 259 (15.2%) |
| 4 Vehicles | 58 (3.2%) | 36 (2.1%) |
| 5 or more Vehicles | 389 (21.6%) | 203 (11.9%) |
| Total | 1,800 (100.0%) | 1,708 (100.0%) |
Commute Time in Zimmerman
The most frequently occuring commute durations in Zimmerman are 20 to 24 minutes (586 commuters, 19.0%), 60 to 89 minutes (442 commuters, 14.3%), and 45 to 59 minutes (398 commuters, 12.9%).
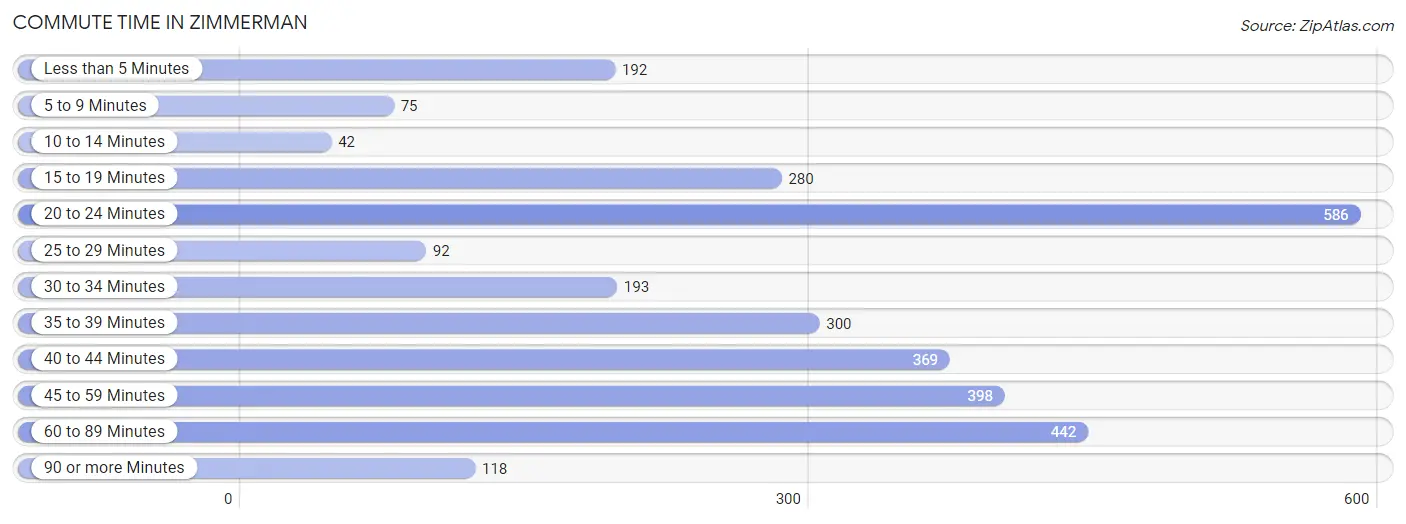
| Commute Time | # Commuters | % Commuters |
| Less than 5 Minutes | 192 | 6.2% |
| 5 to 9 Minutes | 75 | 2.4% |
| 10 to 14 Minutes | 42 | 1.4% |
| 15 to 19 Minutes | 280 | 9.1% |
| 20 to 24 Minutes | 586 | 19.0% |
| 25 to 29 Minutes | 92 | 3.0% |
| 30 to 34 Minutes | 193 | 6.2% |
| 35 to 39 Minutes | 300 | 9.7% |
| 40 to 44 Minutes | 369 | 11.9% |
| 45 to 59 Minutes | 398 | 12.9% |
| 60 to 89 Minutes | 442 | 14.3% |
| 90 or more Minutes | 118 | 3.8% |
Commute Time by Sex in Zimmerman
The most common commute times in Zimmerman are 35 to 39 minutes (286 commuters, 16.4%) for males and 20 to 24 minutes (406 commuters, 30.2%) for females.
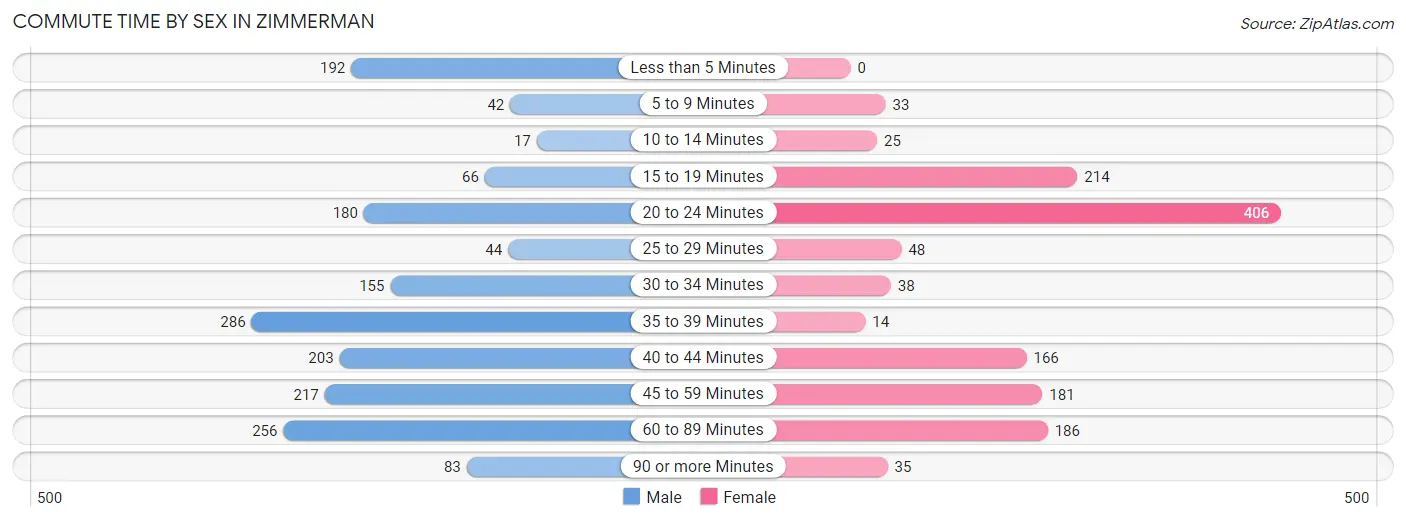
| Commute Time | Male | Female |
| Less than 5 Minutes | 192 (11.0%) | 0 (0.0%) |
| 5 to 9 Minutes | 42 (2.4%) | 33 (2.5%) |
| 10 to 14 Minutes | 17 (1.0%) | 25 (1.9%) |
| 15 to 19 Minutes | 66 (3.8%) | 214 (15.9%) |
| 20 to 24 Minutes | 180 (10.3%) | 406 (30.2%) |
| 25 to 29 Minutes | 44 (2.5%) | 48 (3.6%) |
| 30 to 34 Minutes | 155 (8.9%) | 38 (2.8%) |
| 35 to 39 Minutes | 286 (16.4%) | 14 (1.0%) |
| 40 to 44 Minutes | 203 (11.7%) | 166 (12.3%) |
| 45 to 59 Minutes | 217 (12.5%) | 181 (13.5%) |
| 60 to 89 Minutes | 256 (14.7%) | 186 (13.8%) |
| 90 or more Minutes | 83 (4.8%) | 35 (2.6%) |
Time of Departure to Work by Sex in Zimmerman
The most frequent times of departure to work in Zimmerman are 5:00 AM to 5:29 AM (332, 19.1%) for males and 8:00 AM to 8:29 AM (277, 20.6%) for females.
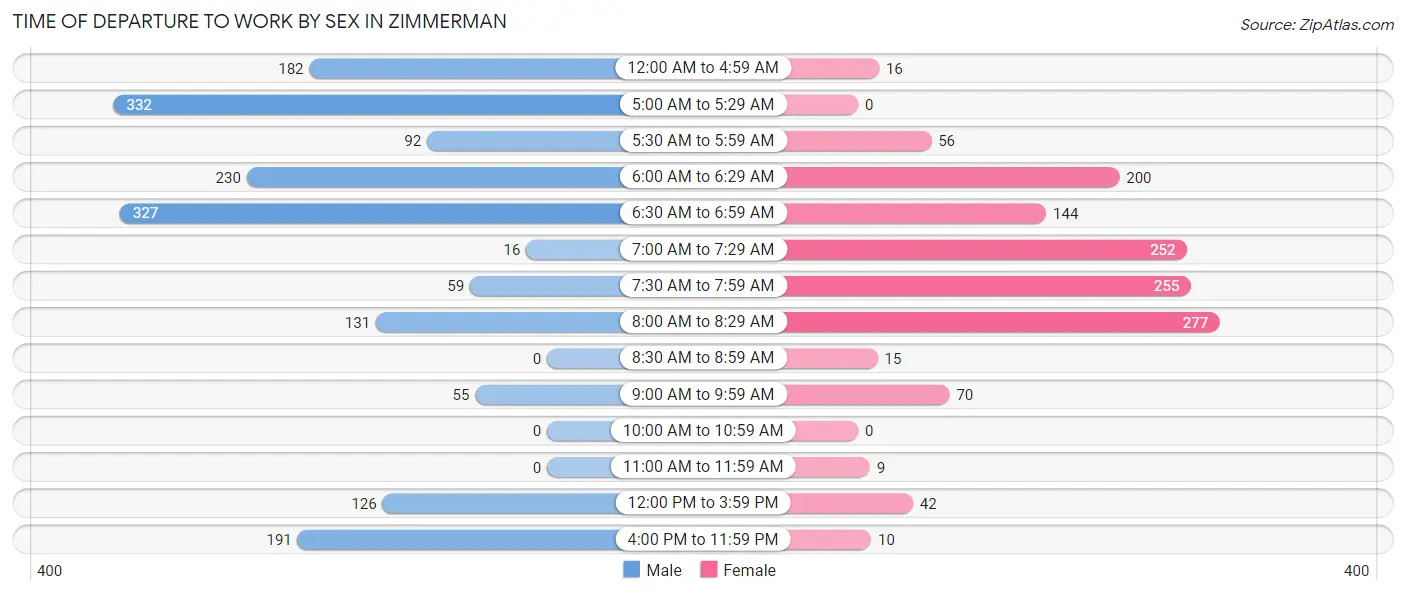
| Time of Departure | Male | Female |
| 12:00 AM to 4:59 AM | 182 (10.4%) | 16 (1.2%) |
| 5:00 AM to 5:29 AM | 332 (19.1%) | 0 (0.0%) |
| 5:30 AM to 5:59 AM | 92 (5.3%) | 56 (4.2%) |
| 6:00 AM to 6:29 AM | 230 (13.2%) | 200 (14.9%) |
| 6:30 AM to 6:59 AM | 327 (18.8%) | 144 (10.7%) |
| 7:00 AM to 7:29 AM | 16 (0.9%) | 252 (18.7%) |
| 7:30 AM to 7:59 AM | 59 (3.4%) | 255 (19.0%) |
| 8:00 AM to 8:29 AM | 131 (7.5%) | 277 (20.6%) |
| 8:30 AM to 8:59 AM | 0 (0.0%) | 15 (1.1%) |
| 9:00 AM to 9:59 AM | 55 (3.2%) | 70 (5.2%) |
| 10:00 AM to 10:59 AM | 0 (0.0%) | 0 (0.0%) |
| 11:00 AM to 11:59 AM | 0 (0.0%) | 9 (0.7%) |
| 12:00 PM to 3:59 PM | 126 (7.2%) | 42 (3.1%) |
| 4:00 PM to 11:59 PM | 191 (11.0%) | 10 (0.7%) |
| Total | 1,741 (100.0%) | 1,346 (100.0%) |
Housing Occupancy in Zimmerman
Occupancy by Ownership in Zimmerman
Of the total 2,075 dwellings in Zimmerman, owner-occupied units account for 1,757 (84.7%), while renter-occupied units make up 318 (15.3%).
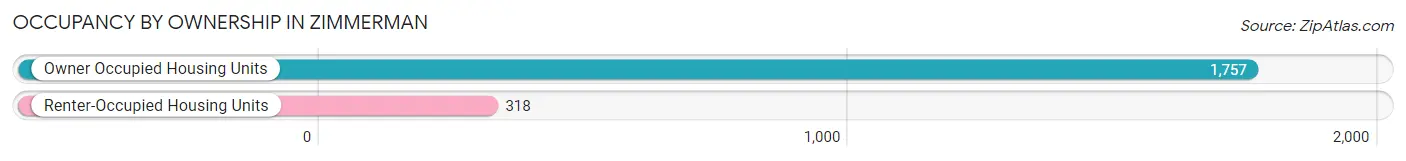
| Occupancy | # Housing Units | % Housing Units |
| Owner Occupied Housing Units | 1,757 | 84.7% |
| Renter-Occupied Housing Units | 318 | 15.3% |
| Total Occupied Housing Units | 2,075 | 100.0% |
Occupancy by Household Size in Zimmerman
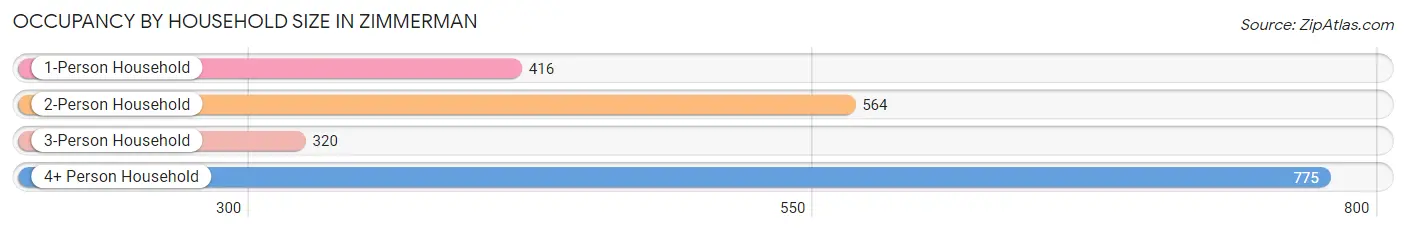
| Household Size | # Housing Units | % Housing Units |
| 1-Person Household | 416 | 20.1% |
| 2-Person Household | 564 | 27.2% |
| 3-Person Household | 320 | 15.4% |
| 4+ Person Household | 775 | 37.3% |
| Total Housing Units | 2,075 | 100.0% |
Occupancy by Ownership by Household Size in Zimmerman
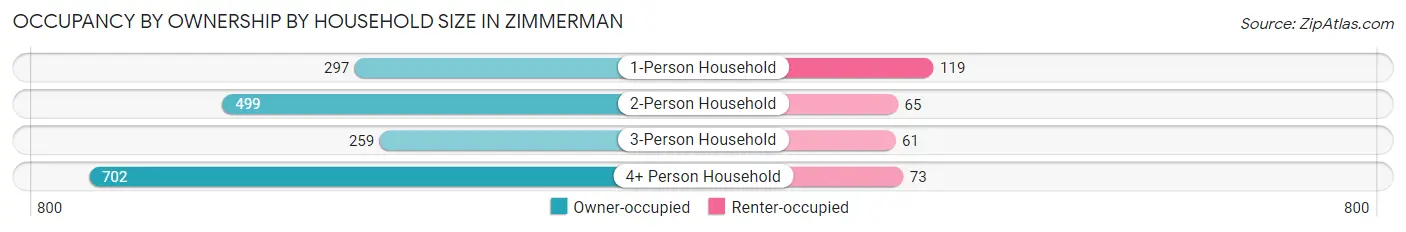
| Household Size | Owner-occupied | Renter-occupied |
| 1-Person Household | 297 (71.4%) | 119 (28.6%) |
| 2-Person Household | 499 (88.5%) | 65 (11.5%) |
| 3-Person Household | 259 (80.9%) | 61 (19.1%) |
| 4+ Person Household | 702 (90.6%) | 73 (9.4%) |
| Total Housing Units | 1,757 (84.7%) | 318 (15.3%) |
Occupancy by Educational Attainment in Zimmerman
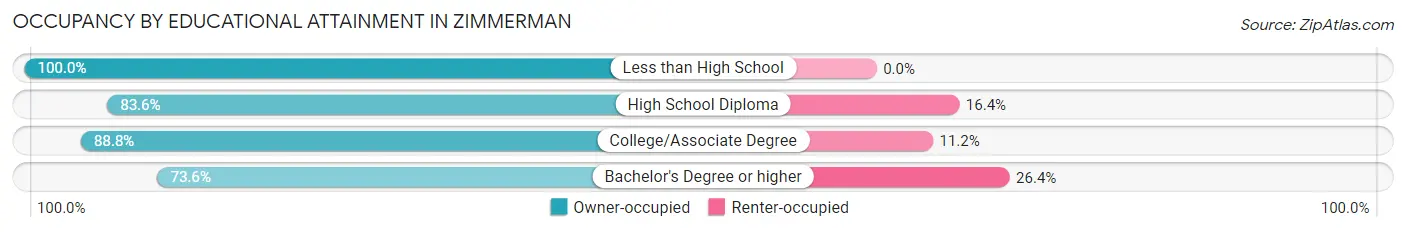
| Household Size | Owner-occupied | Renter-occupied |
| Less than High School | 79 (100.0%) | 0 (0.0%) |
| High School Diploma | 413 (83.6%) | 81 (16.4%) |
| College/Associate Degree | 930 (88.8%) | 117 (11.2%) |
| Bachelor's Degree or higher | 335 (73.6%) | 120 (26.4%) |
Occupancy by Age of Householder in Zimmerman
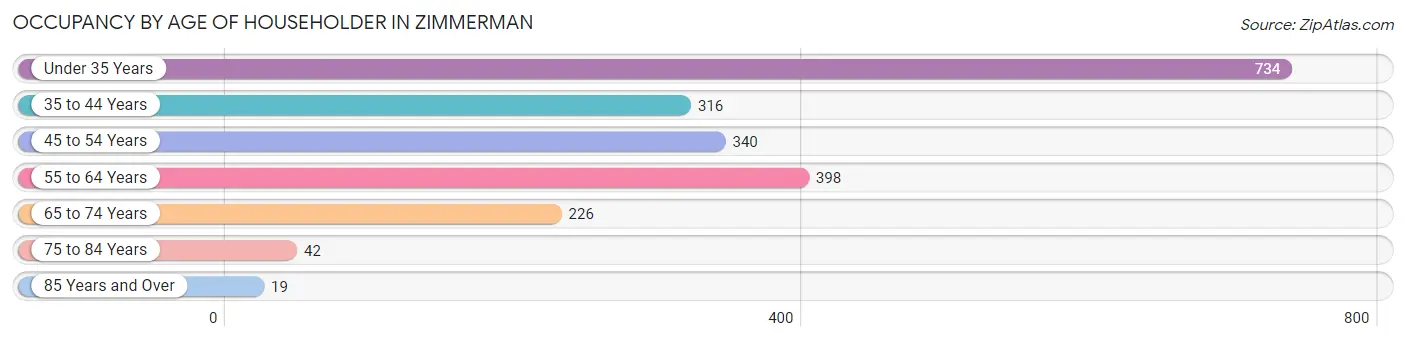
| Age Bracket | # Households | % Households |
| Under 35 Years | 734 | 35.4% |
| 35 to 44 Years | 316 | 15.2% |
| 45 to 54 Years | 340 | 16.4% |
| 55 to 64 Years | 398 | 19.2% |
| 65 to 74 Years | 226 | 10.9% |
| 75 to 84 Years | 42 | 2.0% |
| 85 Years and Over | 19 | 0.9% |
| Total | 2,075 | 100.0% |
Housing Finances in Zimmerman
Median Income by Occupancy in Zimmerman
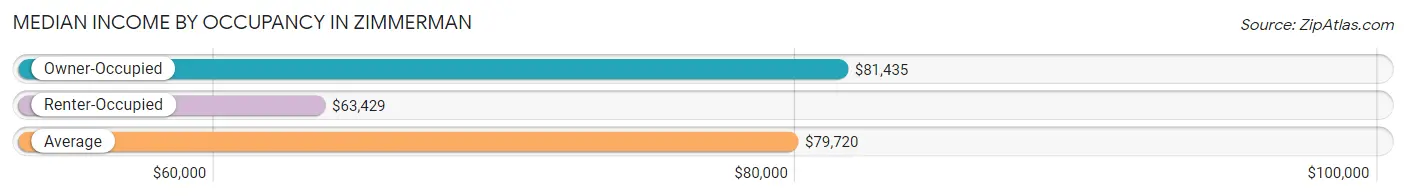
| Occupancy Type | # Households | Median Income |
| Owner-Occupied | 1,757 (84.7%) | $81,435 |
| Renter-Occupied | 318 (15.3%) | $63,429 |
| Average | 2,075 (100.0%) | $79,720 |
Occupancy by Householder Income Bracket in Zimmerman
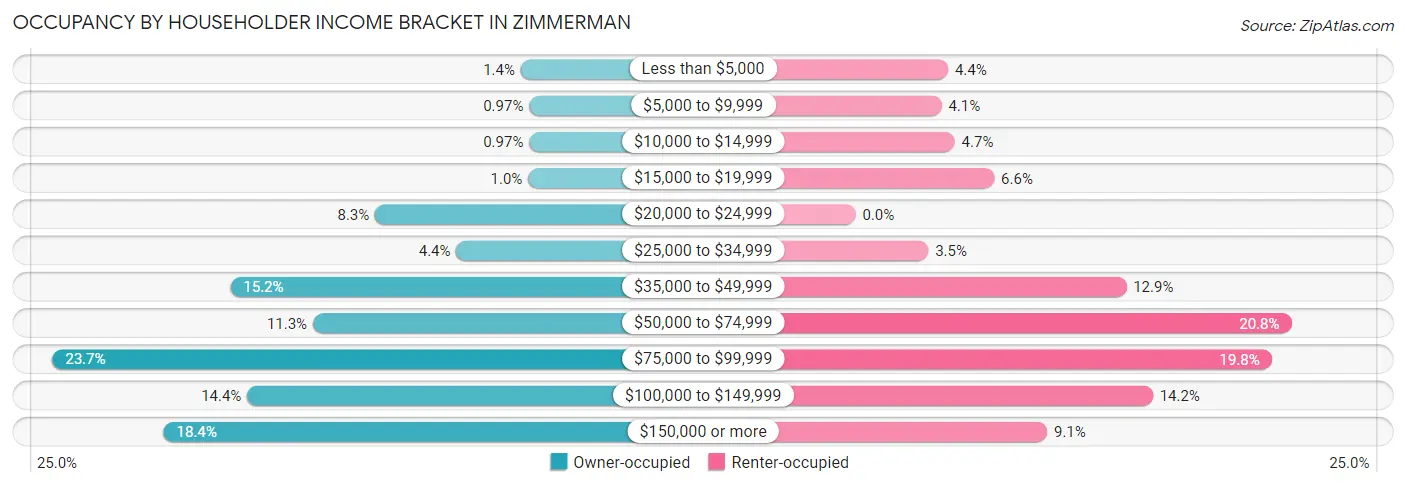
| Income Bracket | Owner-occupied | Renter-occupied |
| Less than $5,000 | 24 (1.4%) | 14 (4.4%) |
| $5,000 to $9,999 | 17 (1.0%) | 13 (4.1%) |
| $10,000 to $14,999 | 17 (1.0%) | 15 (4.7%) |
| $15,000 to $19,999 | 18 (1.0%) | 21 (6.6%) |
| $20,000 to $24,999 | 146 (8.3%) | 0 (0.0%) |
| $25,000 to $34,999 | 78 (4.4%) | 11 (3.5%) |
| $35,000 to $49,999 | 267 (15.2%) | 41 (12.9%) |
| $50,000 to $74,999 | 198 (11.3%) | 66 (20.7%) |
| $75,000 to $99,999 | 416 (23.7%) | 63 (19.8%) |
| $100,000 to $149,999 | 253 (14.4%) | 45 (14.1%) |
| $150,000 or more | 323 (18.4%) | 29 (9.1%) |
| Total | 1,757 (100.0%) | 318 (100.0%) |
Monthly Housing Cost Tiers in Zimmerman
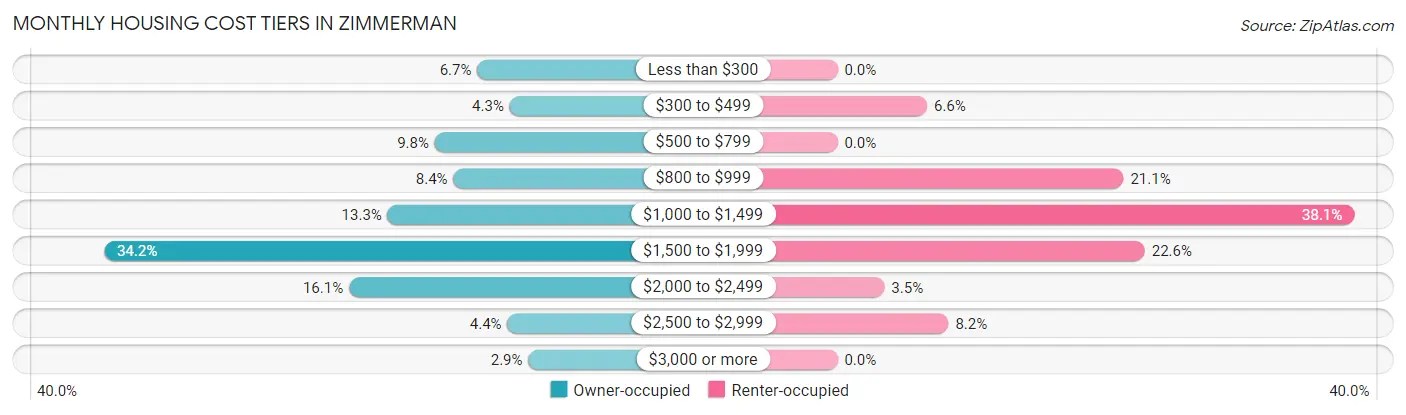
| Monthly Cost | Owner-occupied | Renter-occupied |
| Less than $300 | 117 (6.7%) | 0 (0.0%) |
| $300 to $499 | 75 (4.3%) | 21 (6.6%) |
| $500 to $799 | 172 (9.8%) | 0 (0.0%) |
| $800 to $999 | 148 (8.4%) | 67 (21.1%) |
| $1,000 to $1,499 | 233 (13.3%) | 121 (38.1%) |
| $1,500 to $1,999 | 600 (34.2%) | 72 (22.6%) |
| $2,000 to $2,499 | 283 (16.1%) | 11 (3.5%) |
| $2,500 to $2,999 | 78 (4.4%) | 26 (8.2%) |
| $3,000 or more | 51 (2.9%) | 0 (0.0%) |
| Total | 1,757 (100.0%) | 318 (100.0%) |
Physical Housing Characteristics in Zimmerman
Housing Structures in Zimmerman
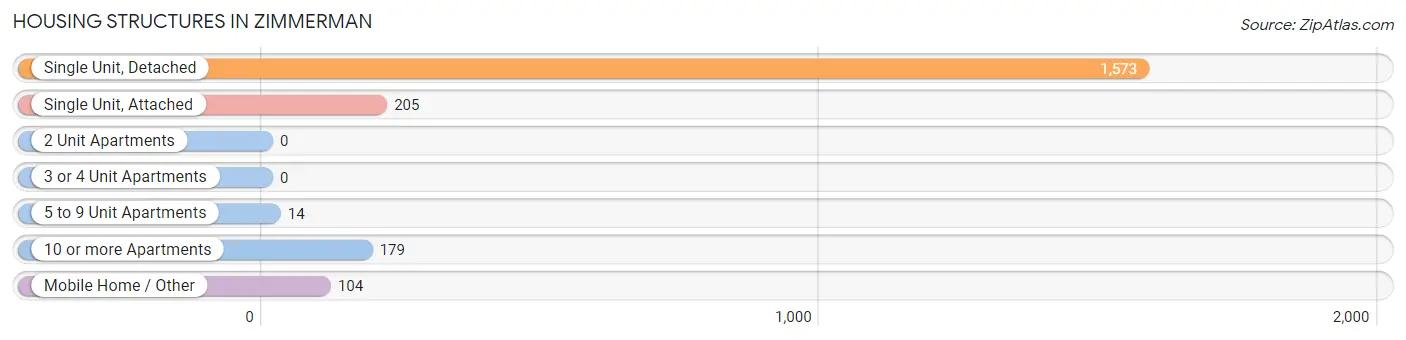
| Structure Type | # Housing Units | % Housing Units |
| Single Unit, Detached | 1,573 | 75.8% |
| Single Unit, Attached | 205 | 9.9% |
| 2 Unit Apartments | 0 | 0.0% |
| 3 or 4 Unit Apartments | 0 | 0.0% |
| 5 to 9 Unit Apartments | 14 | 0.7% |
| 10 or more Apartments | 179 | 8.6% |
| Mobile Home / Other | 104 | 5.0% |
| Total | 2,075 | 100.0% |
Housing Structures by Occupancy in Zimmerman
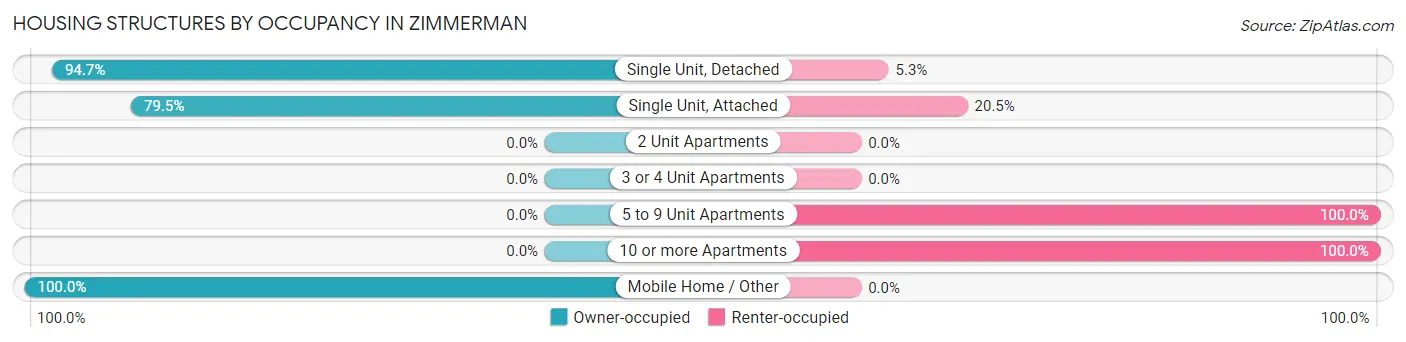
| Structure Type | Owner-occupied | Renter-occupied |
| Single Unit, Detached | 1,490 (94.7%) | 83 (5.3%) |
| Single Unit, Attached | 163 (79.5%) | 42 (20.5%) |
| 2 Unit Apartments | 0 (0.0%) | 0 (0.0%) |
| 3 or 4 Unit Apartments | 0 (0.0%) | 0 (0.0%) |
| 5 to 9 Unit Apartments | 0 (0.0%) | 14 (100.0%) |
| 10 or more Apartments | 0 (0.0%) | 179 (100.0%) |
| Mobile Home / Other | 104 (100.0%) | 0 (0.0%) |
| Total | 1,757 (84.7%) | 318 (15.3%) |
Housing Structures by Number of Rooms in Zimmerman
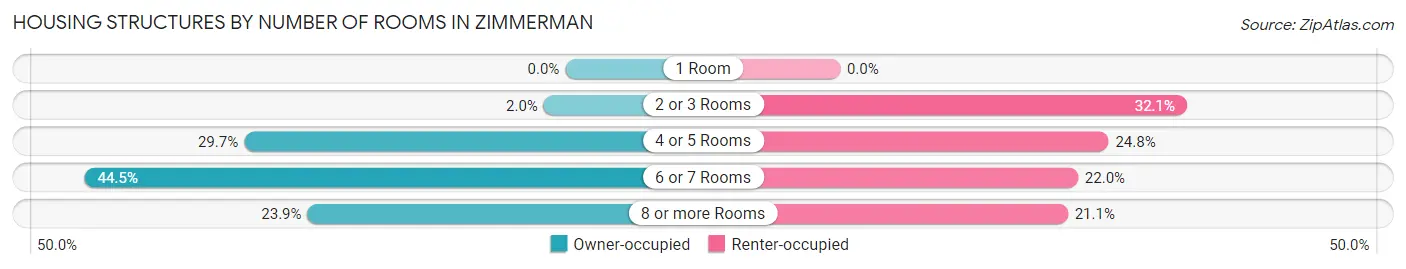
| Number of Rooms | Owner-occupied | Renter-occupied |
| 1 Room | 0 (0.0%) | 0 (0.0%) |
| 2 or 3 Rooms | 35 (2.0%) | 102 (32.1%) |
| 4 or 5 Rooms | 522 (29.7%) | 79 (24.8%) |
| 6 or 7 Rooms | 781 (44.5%) | 70 (22.0%) |
| 8 or more Rooms | 419 (23.8%) | 67 (21.1%) |
| Total | 1,757 (100.0%) | 318 (100.0%) |
Housing Structure by Heating Type in Zimmerman
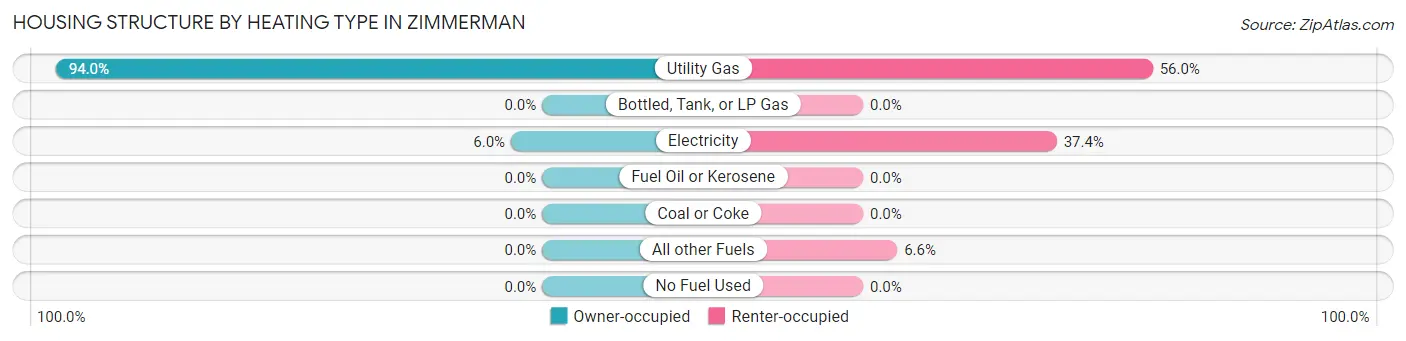
| Heating Type | Owner-occupied | Renter-occupied |
| Utility Gas | 1,651 (94.0%) | 178 (56.0%) |
| Bottled, Tank, or LP Gas | 0 (0.0%) | 0 (0.0%) |
| Electricity | 106 (6.0%) | 119 (37.4%) |
| Fuel Oil or Kerosene | 0 (0.0%) | 0 (0.0%) |
| Coal or Coke | 0 (0.0%) | 0 (0.0%) |
| All other Fuels | 0 (0.0%) | 21 (6.6%) |
| No Fuel Used | 0 (0.0%) | 0 (0.0%) |
| Total | 1,757 (100.0%) | 318 (100.0%) |
Household Vehicle Usage in Zimmerman
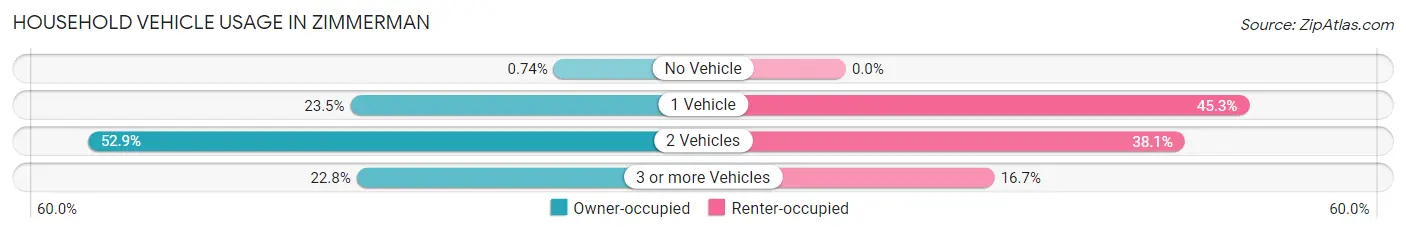
| Vehicles per Household | Owner-occupied | Renter-occupied |
| No Vehicle | 13 (0.7%) | 0 (0.0%) |
| 1 Vehicle | 413 (23.5%) | 144 (45.3%) |
| 2 Vehicles | 930 (52.9%) | 121 (38.1%) |
| 3 or more Vehicles | 401 (22.8%) | 53 (16.7%) |
| Total | 1,757 (100.0%) | 318 (100.0%) |
Real Estate & Mortgages in Zimmerman
Real Estate and Mortgage Overview in Zimmerman
| Characteristic | Without Mortgage | With Mortgage |
| Housing Units | 351 | 1,406 |
| Median Property Value | $219,800 | $272,200 |
| Median Household Income | $57,098 | $248 |
| Monthly Housing Costs | $525 | $51 |
| Real Estate Taxes | $2,179 | $22 |
Property Value by Mortgage Status in Zimmerman
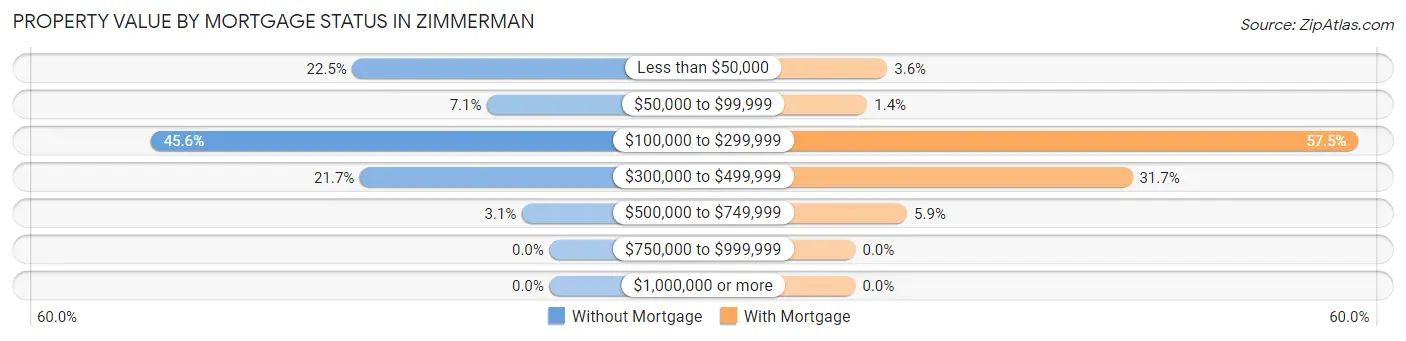
| Property Value | Without Mortgage | With Mortgage |
| Less than $50,000 | 79 (22.5%) | 51 (3.6%) |
| $50,000 to $99,999 | 25 (7.1%) | 19 (1.3%) |
| $100,000 to $299,999 | 160 (45.6%) | 808 (57.5%) |
| $300,000 to $499,999 | 76 (21.6%) | 445 (31.7%) |
| $500,000 to $749,999 | 11 (3.1%) | 83 (5.9%) |
| $750,000 to $999,999 | 0 (0.0%) | 0 (0.0%) |
| $1,000,000 or more | 0 (0.0%) | 0 (0.0%) |
| Total | 351 (100.0%) | 1,406 (100.0%) |
Household Income by Mortgage Status in Zimmerman
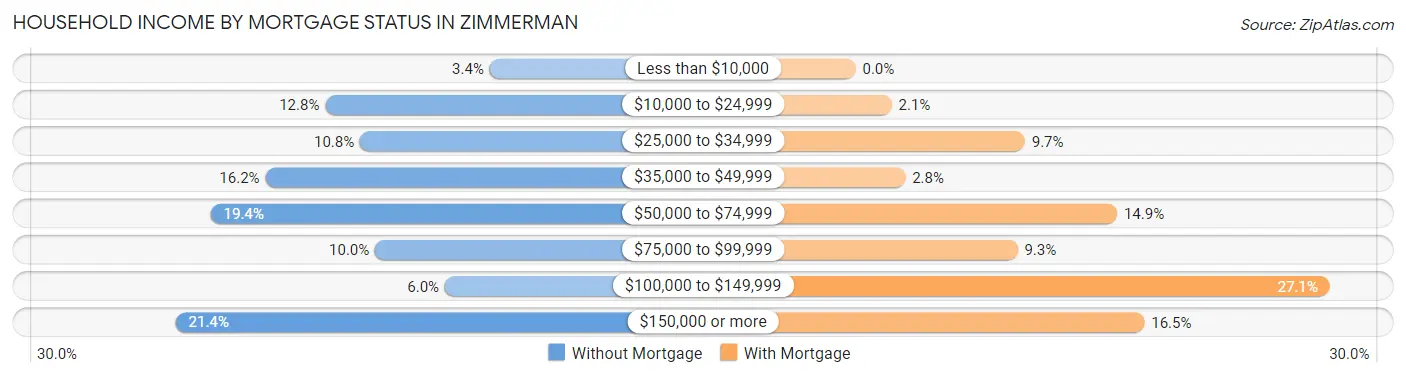
| Household Income | Without Mortgage | With Mortgage |
| Less than $10,000 | 12 (3.4%) | 0 (0.0%) |
| $10,000 to $24,999 | 45 (12.8%) | 29 (2.1%) |
| $25,000 to $34,999 | 38 (10.8%) | 136 (9.7%) |
| $35,000 to $49,999 | 57 (16.2%) | 40 (2.8%) |
| $50,000 to $74,999 | 68 (19.4%) | 210 (14.9%) |
| $75,000 to $99,999 | 35 (10.0%) | 130 (9.2%) |
| $100,000 to $149,999 | 21 (6.0%) | 381 (27.1%) |
| $150,000 or more | 75 (21.4%) | 232 (16.5%) |
| Total | 351 (100.0%) | 1,406 (100.0%) |
Property Value to Household Income Ratio in Zimmerman
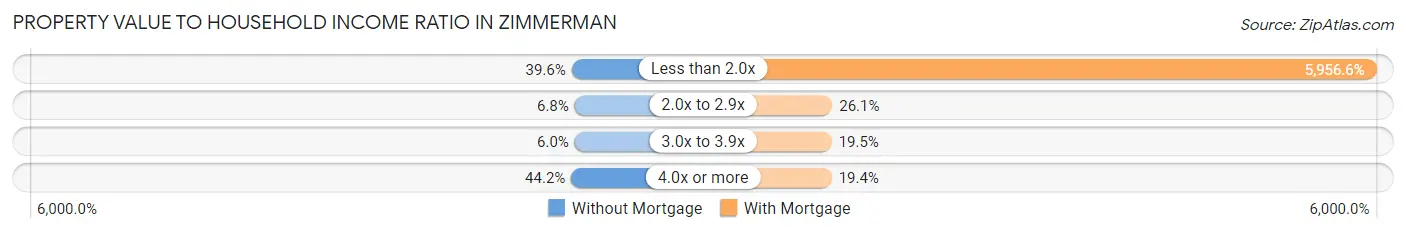
| Value-to-Income Ratio | Without Mortgage | With Mortgage |
| Less than 2.0x | 139 (39.6%) | 83,750 (5,956.6%) |
| 2.0x to 2.9x | 24 (6.8%) | 367 (26.1%) |
| 3.0x to 3.9x | 21 (6.0%) | 274 (19.5%) |
| 4.0x or more | 155 (44.2%) | 273 (19.4%) |
| Total | 351 (100.0%) | 1,406 (100.0%) |
Real Estate Taxes by Mortgage Status in Zimmerman
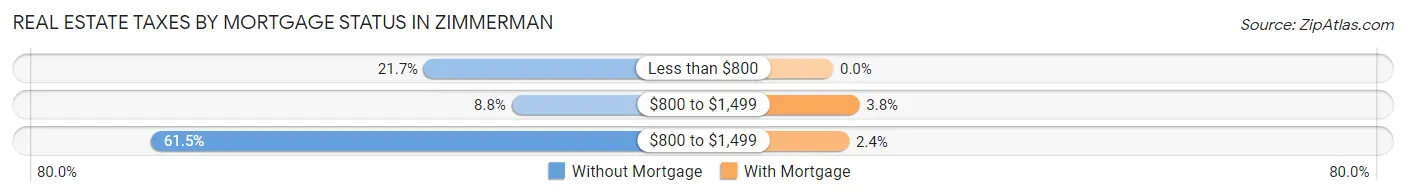
| Property Taxes | Without Mortgage | With Mortgage |
| Less than $800 | 76 (21.6%) | 0 (0.0%) |
| $800 to $1,499 | 31 (8.8%) | 54 (3.8%) |
| $800 to $1,499 | 216 (61.5%) | 33 (2.4%) |
| Total | 351 (100.0%) | 1,406 (100.0%) |
Health & Disability in Zimmerman
Health Insurance Coverage by Age in Zimmerman
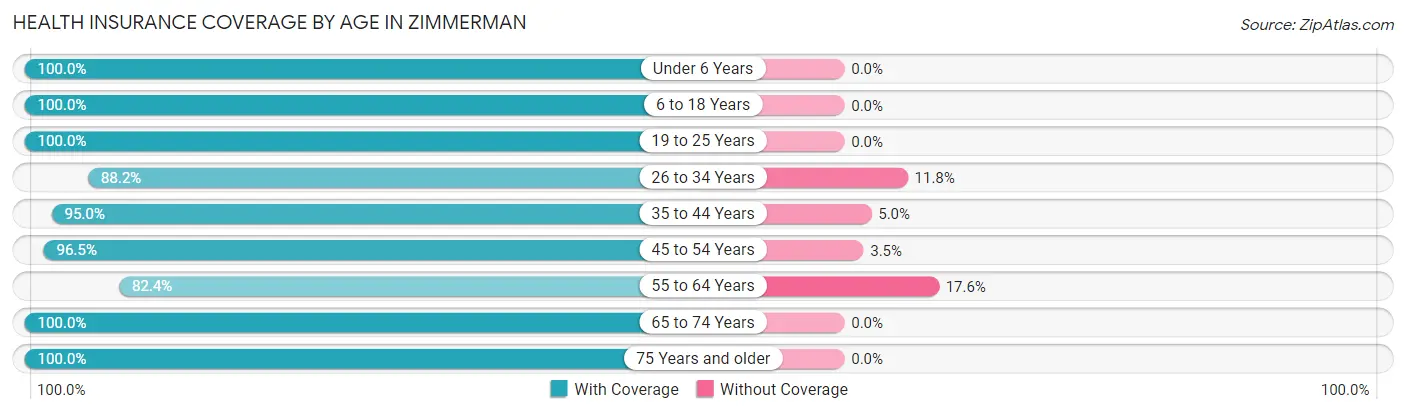
| Age Bracket | With Coverage | Without Coverage |
| Under 6 Years | 615 (100.0%) | 0 (0.0%) |
| 6 to 18 Years | 1,441 (100.0%) | 0 (0.0%) |
| 19 to 25 Years | 356 (100.0%) | 0 (0.0%) |
| 26 to 34 Years | 978 (88.2%) | 131 (11.8%) |
| 35 to 44 Years | 737 (95.0%) | 39 (5.0%) |
| 45 to 54 Years | 709 (96.5%) | 26 (3.5%) |
| 55 to 64 Years | 454 (82.4%) | 97 (17.6%) |
| 65 to 74 Years | 417 (100.0%) | 0 (0.0%) |
| 75 Years and older | 86 (100.0%) | 0 (0.0%) |
| Total | 5,793 (95.2%) | 293 (4.8%) |
Health Insurance Coverage by Citizenship Status in Zimmerman
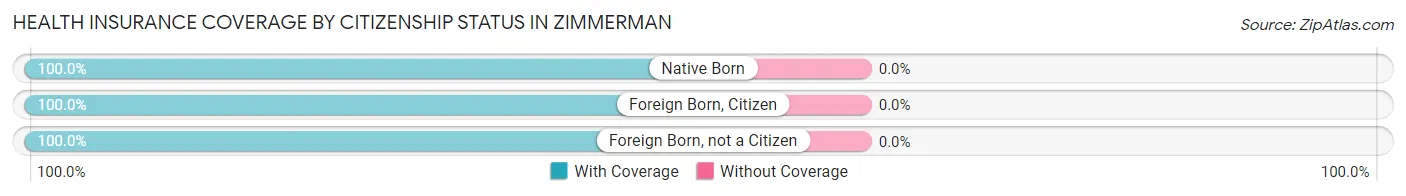
| Citizenship Status | With Coverage | Without Coverage |
| Native Born | 615 (100.0%) | 0 (0.0%) |
| Foreign Born, Citizen | 1,441 (100.0%) | 0 (0.0%) |
| Foreign Born, not a Citizen | 356 (100.0%) | 0 (0.0%) |
Health Insurance Coverage by Household Income in Zimmerman
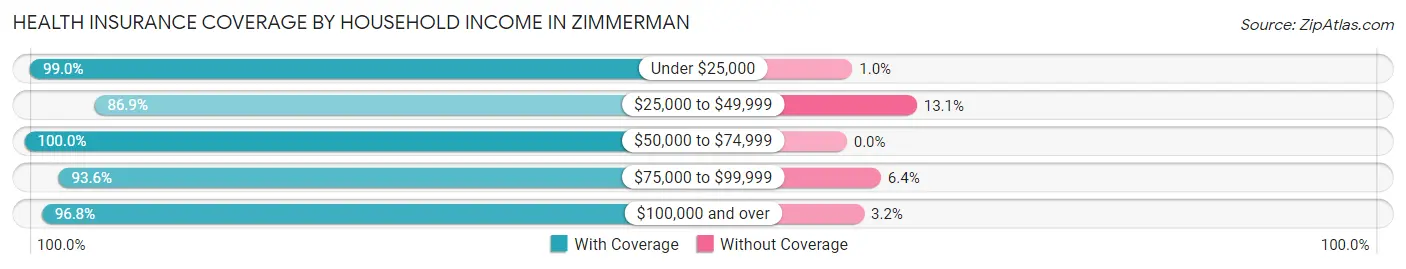
| Household Income | With Coverage | Without Coverage |
| Under $25,000 | 764 (99.0%) | 8 (1.0%) |
| $25,000 to $49,999 | 742 (86.9%) | 112 (13.1%) |
| $50,000 to $74,999 | 654 (100.0%) | 0 (0.0%) |
| $75,000 to $99,999 | 1,480 (93.6%) | 101 (6.4%) |
| $100,000 and over | 2,153 (96.8%) | 72 (3.2%) |
Public vs Private Health Insurance Coverage by Age in Zimmerman
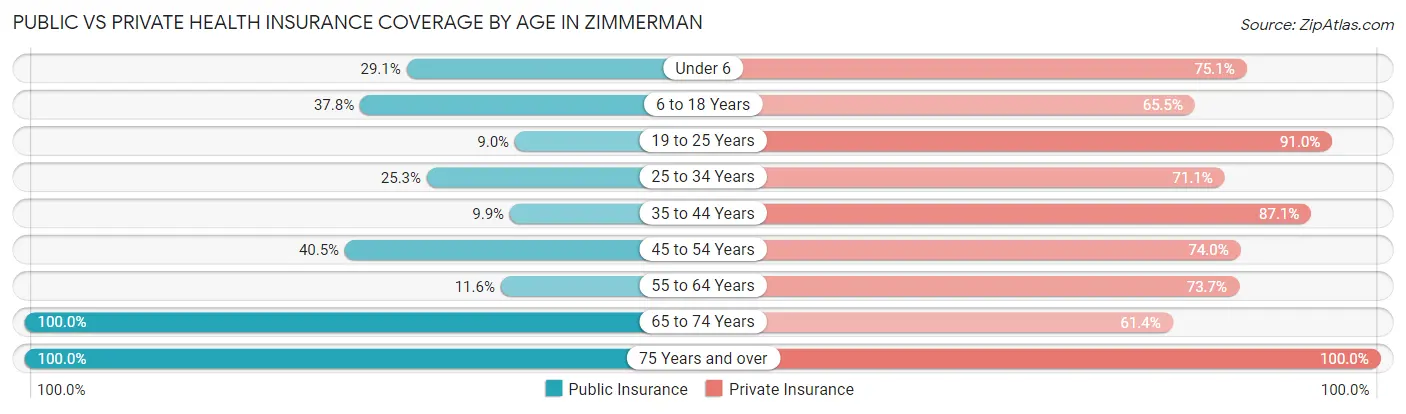
| Age Bracket | Public Insurance | Private Insurance |
| Under 6 | 179 (29.1%) | 462 (75.1%) |
| 6 to 18 Years | 544 (37.8%) | 944 (65.5%) |
| 19 to 25 Years | 32 (9.0%) | 324 (91.0%) |
| 25 to 34 Years | 281 (25.3%) | 788 (71.1%) |
| 35 to 44 Years | 77 (9.9%) | 676 (87.1%) |
| 45 to 54 Years | 298 (40.5%) | 544 (74.0%) |
| 55 to 64 Years | 64 (11.6%) | 406 (73.7%) |
| 65 to 74 Years | 417 (100.0%) | 256 (61.4%) |
| 75 Years and over | 86 (100.0%) | 86 (100.0%) |
| Total | 1,978 (32.5%) | 4,486 (73.7%) |
Disability Status by Sex by Age in Zimmerman
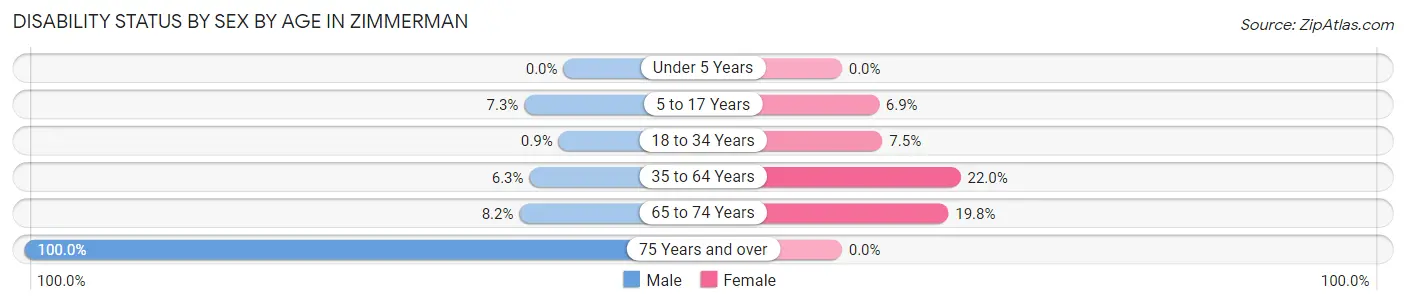
| Age Bracket | Male | Female |
| Under 5 Years | 0 (0.0%) | 0 (0.0%) |
| 5 to 17 Years | 50 (7.3%) | 59 (6.9%) |
| 18 to 34 Years | 6 (0.9%) | 64 (7.5%) |
| 35 to 64 Years | 72 (6.3%) | 203 (22.0%) |
| 65 to 74 Years | 13 (8.2%) | 51 (19.8%) |
| 75 Years and over | 19 (100.0%) | 0 (0.0%) |
Disability Class by Sex by Age in Zimmerman
Disability Class: Hearing Difficulty
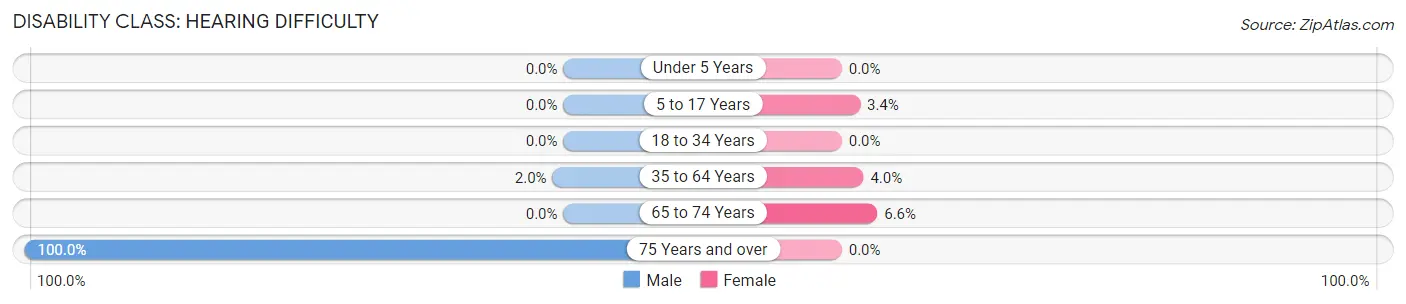
| Age Bracket | Male | Female |
| Under 5 Years | 0 (0.0%) | 0 (0.0%) |
| 5 to 17 Years | 0 (0.0%) | 29 (3.4%) |
| 18 to 34 Years | 0 (0.0%) | 0 (0.0%) |
| 35 to 64 Years | 23 (2.0%) | 37 (4.0%) |
| 65 to 74 Years | 0 (0.0%) | 17 (6.6%) |
| 75 Years and over | 19 (100.0%) | 0 (0.0%) |
Disability Class: Vision Difficulty
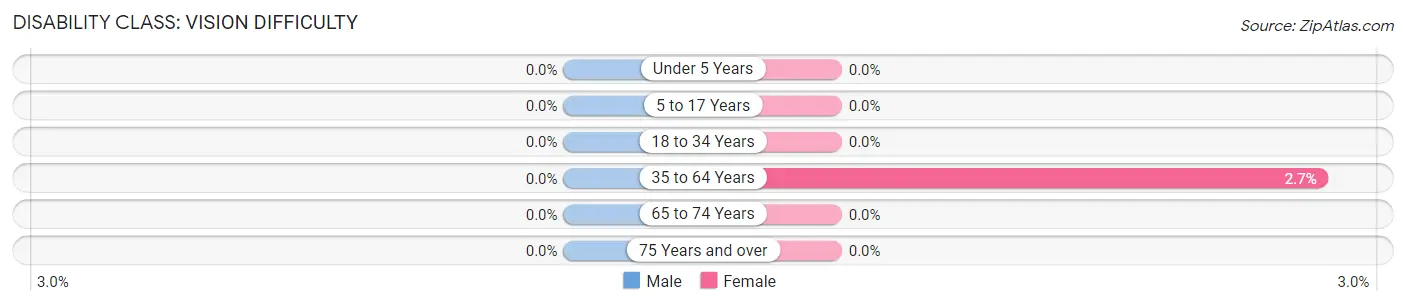
| Age Bracket | Male | Female |
| Under 5 Years | 0 (0.0%) | 0 (0.0%) |
| 5 to 17 Years | 0 (0.0%) | 0 (0.0%) |
| 18 to 34 Years | 0 (0.0%) | 0 (0.0%) |
| 35 to 64 Years | 0 (0.0%) | 25 (2.7%) |
| 65 to 74 Years | 0 (0.0%) | 0 (0.0%) |
| 75 Years and over | 0 (0.0%) | 0 (0.0%) |
Disability Class: Cognitive Difficulty
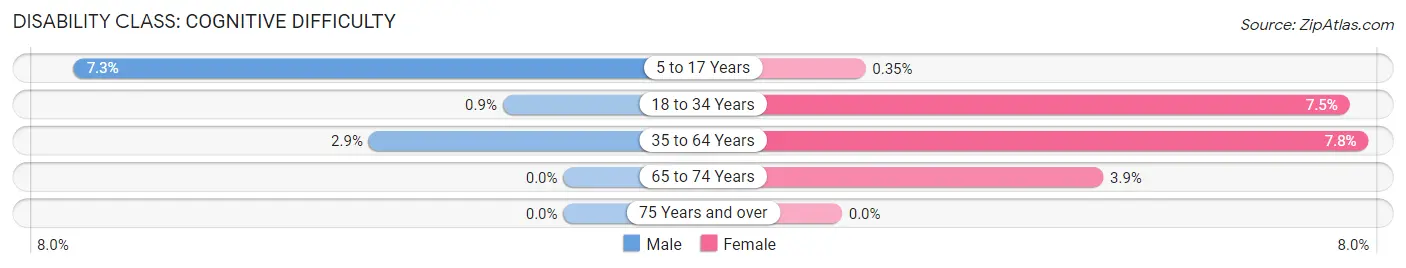
| Age Bracket | Male | Female |
| 5 to 17 Years | 50 (7.3%) | 3 (0.4%) |
| 18 to 34 Years | 6 (0.9%) | 64 (7.5%) |
| 35 to 64 Years | 33 (2.9%) | 72 (7.8%) |
| 65 to 74 Years | 0 (0.0%) | 10 (3.9%) |
| 75 Years and over | 0 (0.0%) | 0 (0.0%) |
Disability Class: Ambulatory Difficulty
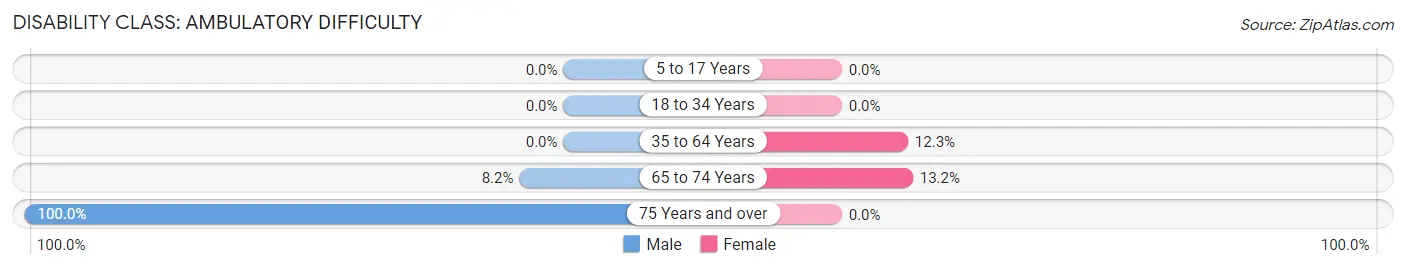
| Age Bracket | Male | Female |
| 5 to 17 Years | 0 (0.0%) | 0 (0.0%) |
| 18 to 34 Years | 0 (0.0%) | 0 (0.0%) |
| 35 to 64 Years | 0 (0.0%) | 113 (12.3%) |
| 65 to 74 Years | 13 (8.2%) | 34 (13.2%) |
| 75 Years and over | 19 (100.0%) | 0 (0.0%) |
Disability Class: Self-Care Difficulty
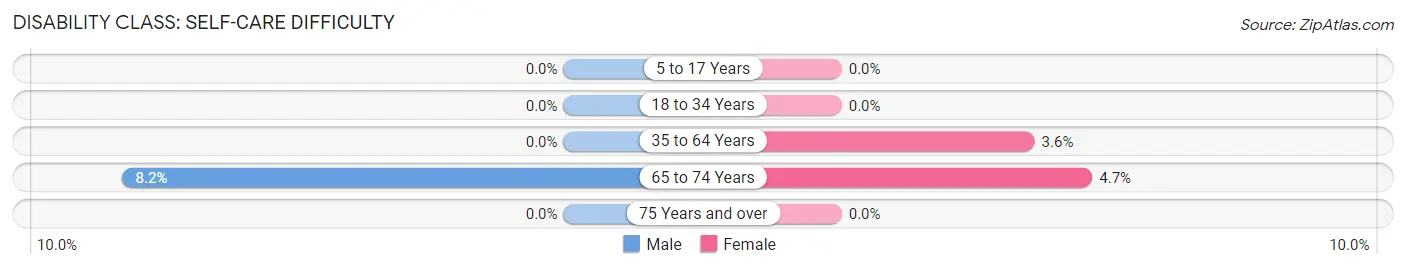
| Age Bracket | Male | Female |
| 5 to 17 Years | 0 (0.0%) | 0 (0.0%) |
| 18 to 34 Years | 0 (0.0%) | 0 (0.0%) |
| 35 to 64 Years | 0 (0.0%) | 33 (3.6%) |
| 65 to 74 Years | 13 (8.2%) | 12 (4.6%) |
| 75 Years and over | 0 (0.0%) | 0 (0.0%) |
Technology Access in Zimmerman
Computing Device Access in Zimmerman
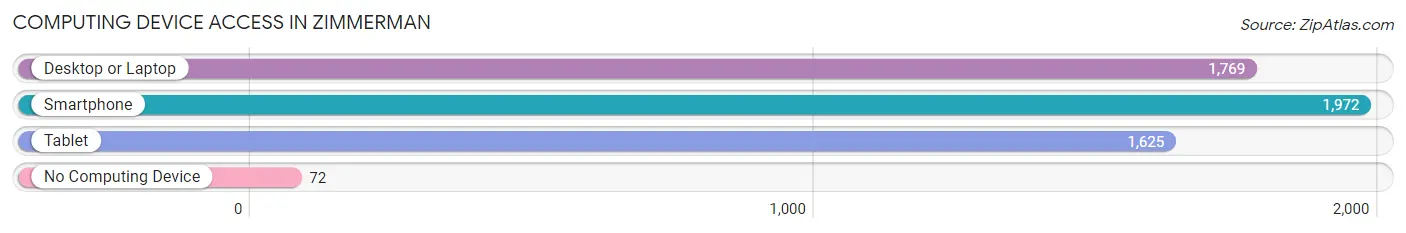
| Device Type | # Households | % Households |
| Desktop or Laptop | 1,769 | 85.3% |
| Smartphone | 1,972 | 95.0% |
| Tablet | 1,625 | 78.3% |
| No Computing Device | 72 | 3.5% |
| Total | 2,075 | 100.0% |
Internet Access in Zimmerman
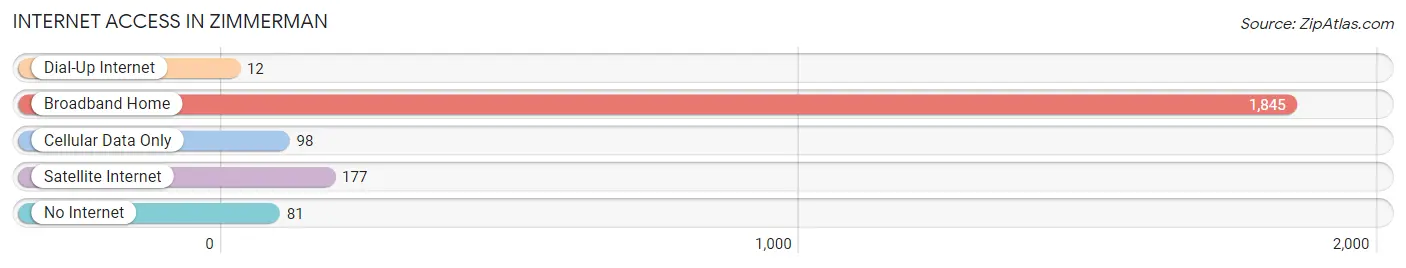
| Internet Type | # Households | % Households |
| Dial-Up Internet | 12 | 0.6% |
| Broadband Home | 1,845 | 88.9% |
| Cellular Data Only | 98 | 4.7% |
| Satellite Internet | 177 | 8.5% |
| No Internet | 81 | 3.9% |
| Total | 2,075 | 100.0% |
Zimmerman Summary
Zimmerman, Minnesota is a small city located in Sherburne County, approximately 40 miles northwest of Minneapolis. The city is situated on the banks of the Mississippi River and is home to a population of approximately 5,000 people.
History
The area that is now Zimmerman was first settled in 1855 by a group of German immigrants. The town was originally named “Zimmerman’s Station” after the first settler, John Zimmerman. The town was officially incorporated in 1887 and was named after the Zimmerman family.
In the early 1900s, Zimmerman was a thriving agricultural community. The town was home to several grain elevators, a creamery, and a cheese factory. The town also had a sawmill, a flour mill, and a brickyard.
In the 1950s, Zimmerman began to experience a population boom as people moved to the area for jobs in the growing manufacturing industry. The town was home to several factories, including a paper mill, a furniture factory, and a canning factory.
Geography
Zimmerman is located in the northern part of Sherburne County, approximately 40 miles northwest of Minneapolis. The city is situated on the banks of the Mississippi River and is surrounded by rolling hills and farmland. The city is located in the St. Croix River Valley, which is known for its scenic beauty.
The climate in Zimmerman is typical of the Upper Midwest, with cold winters and hot summers. The average annual temperature is around 40 degrees Fahrenheit. The area receives an average of 30 inches of precipitation each year.
Economy
The economy of Zimmerman is largely based on agriculture and manufacturing. The city is home to several large farms, which produce a variety of crops, including corn, soybeans, and wheat. The city is also home to several factories, including a paper mill, a furniture factory, and a canning factory.
The city is also home to several small businesses, including restaurants, retail stores, and service providers. The city is also home to a number of tourist attractions, including the Sherburne National Wildlife Refuge and the Mississippi River.
Demographics
As of the 2010 census, the population of Zimmerman was 5,074. The racial makeup of the city was 94.3% White, 1.2% African American, 0.4% Native American, 0.7% Asian, 0.1% Pacific Islander, and 2.3% from other races. The median household income was $50,945, and the median family income was $60,945.
The population of Zimmerman is largely made up of families. The city is home to several schools, including a public elementary school, a public middle school, and a public high school. The city is also home to a number of churches, including the First Lutheran Church and the United Methodist Church.
Conclusion
Zimmerman, Minnesota is a small city located in Sherburne County, approximately 40 miles northwest of Minneapolis. The city is situated on the banks of the Mississippi River and is home to a population of approximately 5,000 people. The economy of Zimmerman is largely based on agriculture and manufacturing, and the city is home to several small businesses, including restaurants, retail stores, and service providers. The population of Zimmerman is largely made up of families, and the city is home to several schools and churches.
Common Questions
What is Per Capita Income in Zimmerman?
Per Capita income in Zimmerman is $30,917.
What is the Median Family Income in Zimmerman?
Median Family Income in Zimmerman is $80,625.
What is the Median Household income in Zimmerman?
Median Household Income in Zimmerman is $79,720.
What is Income or Wage Gap in Zimmerman?
Income or Wage Gap in Zimmerman is 16.9%.
Women in Zimmerman earn 83.1 cents for every dollar earned by a man.
What is Family Income Deficit in Zimmerman?
Family Income Deficit in Zimmerman is $9,456.
Families that are below poverty line in Zimmerman earn $9,456 less on average than the poverty threshold level.
What is Inequality or Gini Index in Zimmerman?
Inequality or Gini Index in Zimmerman is 0.37.
What is the Total Population of Zimmerman?
Total Population of Zimmerman is 6,243.
What is the Total Male Population of Zimmerman?
Total Male Population of Zimmerman is 2,831.
What is the Total Female Population of Zimmerman?
Total Female Population of Zimmerman is 3,412.
What is the Ratio of Males per 100 Females in Zimmerman?
There are 82.97 Males per 100 Females in Zimmerman.
What is the Ratio of Females per 100 Males in Zimmerman?
There are 120.52 Females per 100 Males in Zimmerman.
What is the Median Population Age in Zimmerman?
Median Population Age in Zimmerman is 32.3 Years.
What is the Average Family Size in Zimmerman
Average Family Size in Zimmerman is 3.3 People.
What is the Average Household Size in Zimmerman
Average Household Size in Zimmerman is 3.0 People.
How Large is the Labor Force in Zimmerman?
There are 3,526 People in the Labor Forcein in Zimmerman.
What is the Percentage of People in the Labor Force in Zimmerman?
80.6% of People are in the Labor Force in Zimmerman.
What is the Unemployment Rate in Zimmerman?
Unemployment Rate in Zimmerman is 0.3%.