Grand Mound, IA Map & Demographics
Grand Mound Map
Grand Mound Overview
$30,791
PER CAPITA INCOME
$87,000
AVG FAMILY INCOME
$76,000
AVG HOUSEHOLD INCOME
45.3%
WAGE / INCOME GAP [ % ]
54.7¢/ $1
WAGE / INCOME GAP [ $ ]
0.36
INEQUALITY / GINI INDEX
501
TOTAL POPULATION
248
MALE POPULATION
253
FEMALE POPULATION
98.02
MALES / 100 FEMALES
102.02
FEMALES / 100 MALES
37.1
MEDIAN AGE
3.1
AVG FAMILY SIZE
2.5
AVG HOUSEHOLD SIZE
235
LABOR FORCE [ PEOPLE ]
61.8%
PERCENT IN LABOR FORCE
3.8%
UNEMPLOYMENT RATE
Grand Mound Zip Codes
Grand Mound Area Codes
Income in Grand Mound
Income Overview in Grand Mound
Per Capita Income in Grand Mound is $30,791, while median incomes of families and households are $87,000 and $76,000 respectively.
| Characteristic | Number | Measure |
| Per Capita Income | 501 | $30,791 |
| Median Family Income | 138 | $87,000 |
| Mean Family Income | 138 | $88,613 |
| Median Household Income | 198 | $76,000 |
| Mean Household Income | 198 | $73,993 |
| Income Deficit | 138 | $0 |
| Wage / Income Gap (%) | 501 | 45.29% |
| Wage / Income Gap ($) | 501 | 54.71¢ per $1 |
| Gini / Inequality Index | 501 | 0.36 |
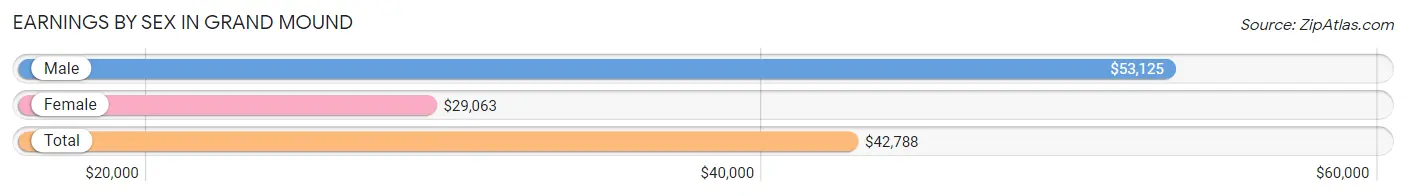
Earnings by Sex in Grand Mound
Average Earnings in Grand Mound are $42,788, $53,125 for men and $29,063 for women, a difference of 45.3%.
| Sex | Number | Average Earnings |
| Male | 120 (50.6%) | $53,125 |
| Female | 117 (49.4%) | $29,063 |
| Total | 237 (100.0%) | $42,788 |
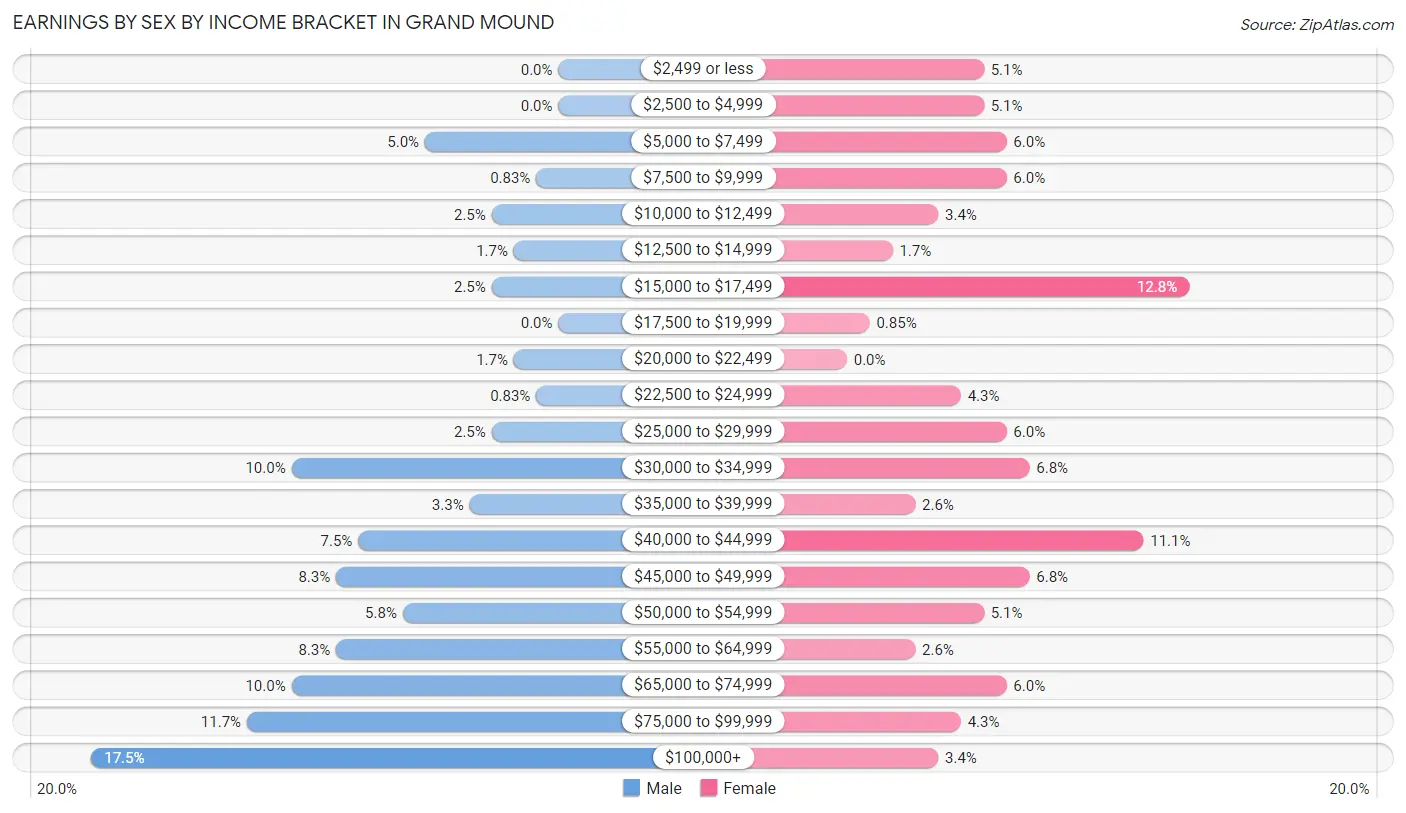
Earnings by Sex by Income Bracket in Grand Mound
The most common earnings brackets in Grand Mound are $100,000+ for men (21 | 17.5%) and $15,000 to $17,499 for women (15 | 12.8%).
| Income | Male | Female |
| $2,499 or less | 0 (0.0%) | 6 (5.1%) |
| $2,500 to $4,999 | 0 (0.0%) | 6 (5.1%) |
| $5,000 to $7,499 | 6 (5.0%) | 7 (6.0%) |
| $7,500 to $9,999 | 1 (0.8%) | 7 (6.0%) |
| $10,000 to $12,499 | 3 (2.5%) | 4 (3.4%) |
| $12,500 to $14,999 | 2 (1.7%) | 2 (1.7%) |
| $15,000 to $17,499 | 3 (2.5%) | 15 (12.8%) |
| $17,500 to $19,999 | 0 (0.0%) | 1 (0.9%) |
| $20,000 to $22,499 | 2 (1.7%) | 0 (0.0%) |
| $22,500 to $24,999 | 1 (0.8%) | 5 (4.3%) |
| $25,000 to $29,999 | 3 (2.5%) | 7 (6.0%) |
| $30,000 to $34,999 | 12 (10.0%) | 8 (6.8%) |
| $35,000 to $39,999 | 4 (3.3%) | 3 (2.6%) |
| $40,000 to $44,999 | 9 (7.5%) | 13 (11.1%) |
| $45,000 to $49,999 | 10 (8.3%) | 8 (6.8%) |
| $50,000 to $54,999 | 7 (5.8%) | 6 (5.1%) |
| $55,000 to $64,999 | 10 (8.3%) | 3 (2.6%) |
| $65,000 to $74,999 | 12 (10.0%) | 7 (6.0%) |
| $75,000 to $99,999 | 14 (11.7%) | 5 (4.3%) |
| $100,000+ | 21 (17.5%) | 4 (3.4%) |
| Total | 120 (100.0%) | 117 (100.0%) |
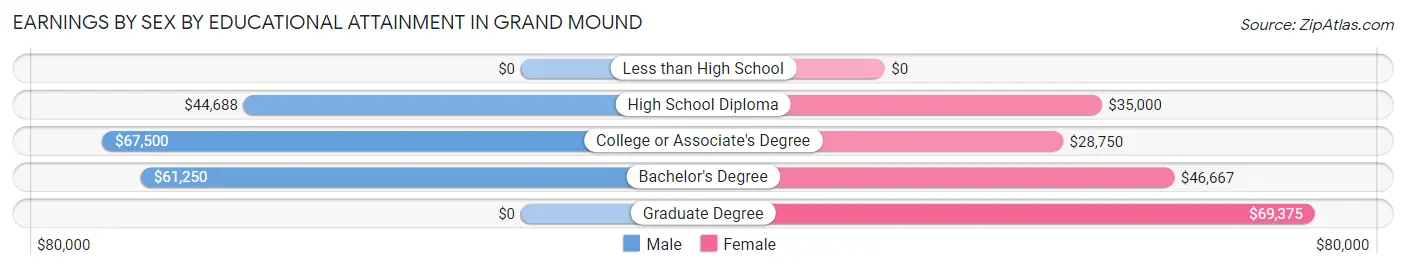
Earnings by Sex by Educational Attainment in Grand Mound
Average earnings in Grand Mound are $57,813 for men and $35,000 for women, a difference of 39.5%. Men with an educational attainment of college or associate's degree enjoy the highest average annual earnings of $67,500, while those with high school diploma education earn the least with $44,688. Women with an educational attainment of graduate degree earn the most with the average annual earnings of $69,375, while those with college or associate's degree education have the smallest earnings of $28,750.
| Educational Attainment | Male Income | Female Income |
| Less than High School | - | - |
| High School Diploma | $44,688 | $35,000 |
| College or Associate's Degree | $67,500 | $28,750 |
| Bachelor's Degree | $61,250 | $46,667 |
| Graduate Degree | - | - |
| Total | $57,813 | $35,000 |
Family Income in Grand Mound
Family Income Brackets in Grand Mound
According to the Grand Mound family income data, there are 40 families falling into the $75,000 to $99,999 income range, which is the most common income bracket and makes up 29.0% of all families.
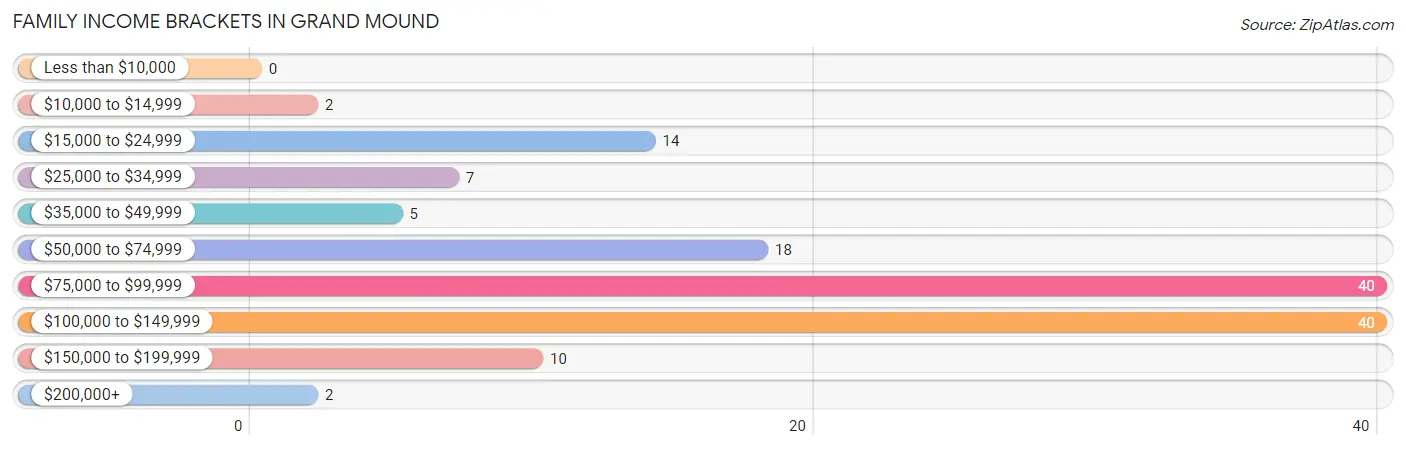
| Income Bracket | # Families | % Families |
| Less than $10,000 | 0 | 0.0% |
| $10,000 to $14,999 | 2 | 1.4% |
| $15,000 to $24,999 | 14 | 10.1% |
| $25,000 to $34,999 | 7 | 5.1% |
| $35,000 to $49,999 | 5 | 3.6% |
| $50,000 to $74,999 | 18 | 13.0% |
| $75,000 to $99,999 | 40 | 29.0% |
| $100,000 to $149,999 | 40 | 29.0% |
| $150,000 to $199,999 | 10 | 7.2% |
| $200,000+ | 2 | 1.4% |
Family Income by Famaliy Size in Grand Mound
5-person families (6 | 4.3%) account for the highest median family income in Grand Mound with $109,167 per family, while 2-person families (69 | 50.0%) have the highest median income of $43,438 per family member.
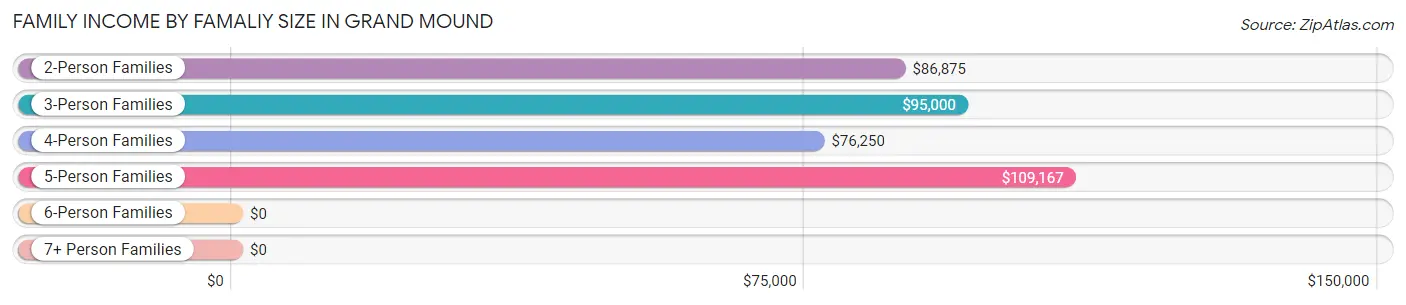
| Income Bracket | # Families | Median Income |
| 2-Person Families | 69 (50.0%) | $86,875 |
| 3-Person Families | 30 (21.7%) | $95,000 |
| 4-Person Families | 31 (22.5%) | $76,250 |
| 5-Person Families | 6 (4.3%) | $109,167 |
| 6-Person Families | 2 (1.5%) | $0 |
| 7+ Person Families | 0 (0.0%) | $0 |
| Total | 138 (100.0%) | $87,000 |
Family Income by Number of Earners in Grand Mound
The median family income in Grand Mound is $87,000, with families comprising 3+ earners (7) having the highest median family income of $104,375, while families with no earners (19) have the lowest median family income of $51,250, accounting for 5.1% and 13.8% of families, respectively.
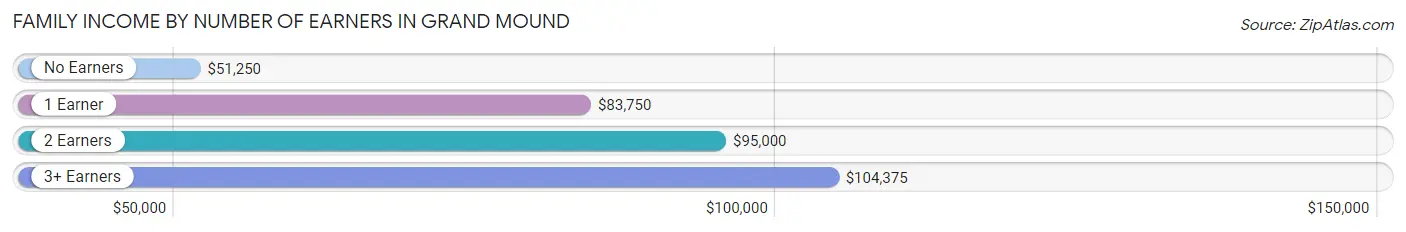
| Number of Earners | # Families | Median Income |
| No Earners | 19 (13.8%) | $51,250 |
| 1 Earner | 52 (37.7%) | $83,750 |
| 2 Earners | 60 (43.5%) | $95,000 |
| 3+ Earners | 7 (5.1%) | $104,375 |
| Total | 138 (100.0%) | $87,000 |
Household Income in Grand Mound
Household Income Brackets in Grand Mound
With 47 households falling in the category, the $75,000 to $99,999 income range is the most frequent in Grand Mound, accounting for 23.7% of all households. In contrast, only 2 households (1.0%) fall into the $200,000+ income bracket, making it the least populous group.
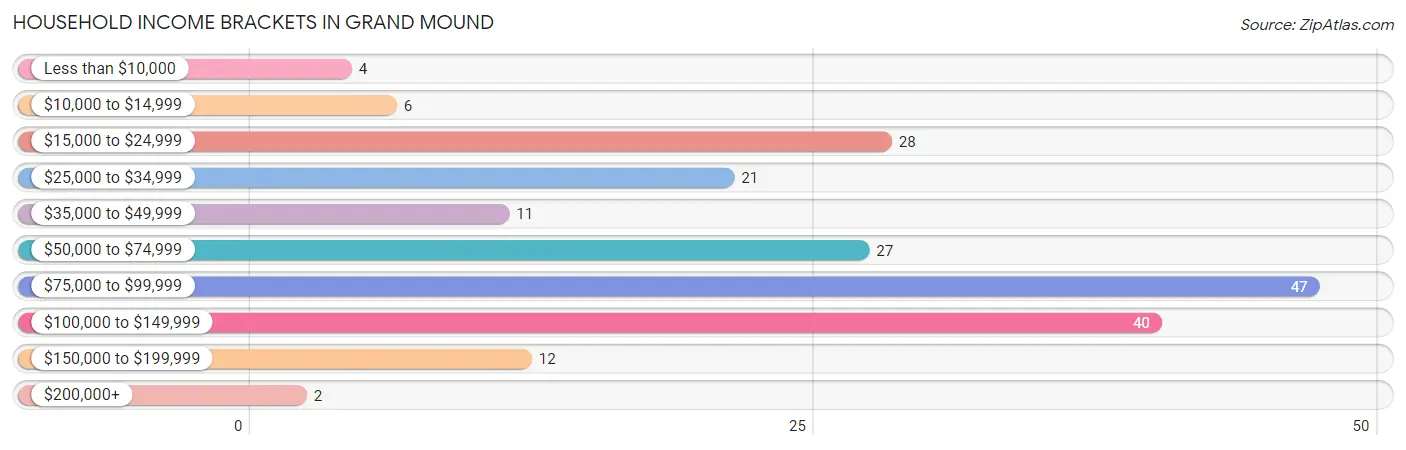
| Income Bracket | # Households | % Households |
| Less than $10,000 | 4 | 2.0% |
| $10,000 to $14,999 | 6 | 3.0% |
| $15,000 to $24,999 | 28 | 14.1% |
| $25,000 to $34,999 | 21 | 10.6% |
| $35,000 to $49,999 | 11 | 5.6% |
| $50,000 to $74,999 | 27 | 13.6% |
| $75,000 to $99,999 | 47 | 23.7% |
| $100,000 to $149,999 | 40 | 20.2% |
| $150,000 to $199,999 | 12 | 6.1% |
| $200,000+ | 2 | 1.0% |
Household Income by Householder Age in Grand Mound
The median household income in Grand Mound is $76,000, with the highest median household income of $85,625 found in the 45 to 64 years age bracket for the primary householder. A total of 64 households (32.3%) fall into this category. Meanwhile, the 15 to 24 years age bracket for the primary householder has the lowest median household income of $0, with 4 households (2.0%) in this group.
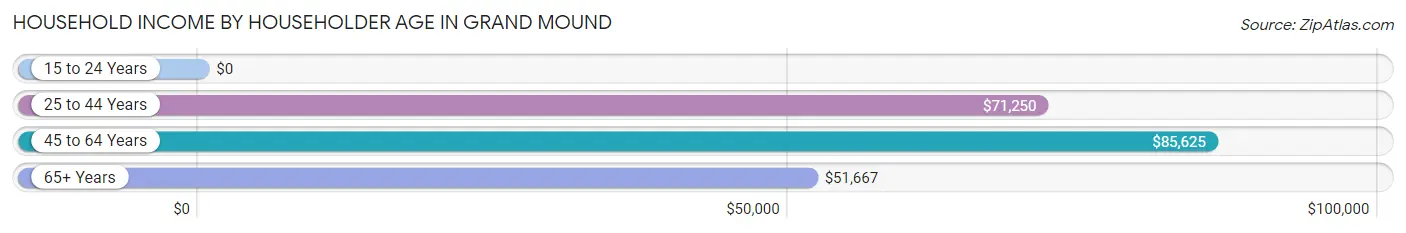
| Income Bracket | # Households | Median Income |
| 15 to 24 Years | 4 (2.0%) | $0 |
| 25 to 44 Years | 56 (28.3%) | $71,250 |
| 45 to 64 Years | 64 (32.3%) | $85,625 |
| 65+ Years | 74 (37.4%) | $51,667 |
| Total | 198 (100.0%) | $76,000 |
Poverty in Grand Mound
Income Below Poverty by Sex and Age in Grand Mound
With 6.5% poverty level for males and 19.8% for females among the residents of Grand Mound, 35 to 44 year old males and 5 year old females are the most vulnerable to poverty, with 3 males (20.0%) and 2 females (66.7%) in their respective age groups living below the poverty level.
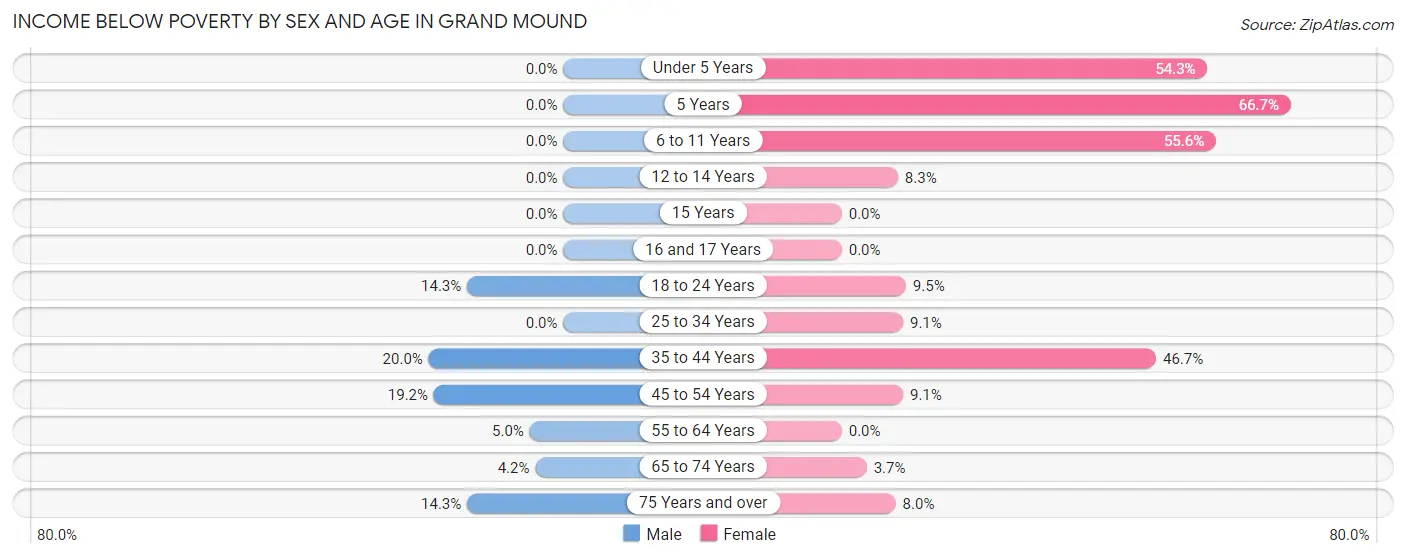
| Age Bracket | Male | Female |
| Under 5 Years | 0 (0.0%) | 19 (54.3%) |
| 5 Years | 0 (0.0%) | 2 (66.7%) |
| 6 to 11 Years | 0 (0.0%) | 10 (55.6%) |
| 12 to 14 Years | 0 (0.0%) | 1 (8.3%) |
| 15 Years | 0 (0.0%) | 0 (0.0%) |
| 16 and 17 Years | 0 (0.0%) | 0 (0.0%) |
| 18 to 24 Years | 2 (14.3%) | 2 (9.5%) |
| 25 to 34 Years | 0 (0.0%) | 4 (9.1%) |
| 35 to 44 Years | 3 (20.0%) | 7 (46.7%) |
| 45 to 54 Years | 5 (19.2%) | 2 (9.1%) |
| 55 to 64 Years | 2 (5.0%) | 0 (0.0%) |
| 65 to 74 Years | 2 (4.2%) | 1 (3.7%) |
| 75 Years and over | 2 (14.3%) | 2 (8.0%) |
| Total | 16 (6.5%) | 50 (19.8%) |
Income Above Poverty by Sex and Age in Grand Mound
According to the poverty statistics in Grand Mound, males aged under 5 years and females aged 16 and 17 years are the age groups that are most secure financially, with 100.0% of males and 100.0% of females in these age groups living above the poverty line.
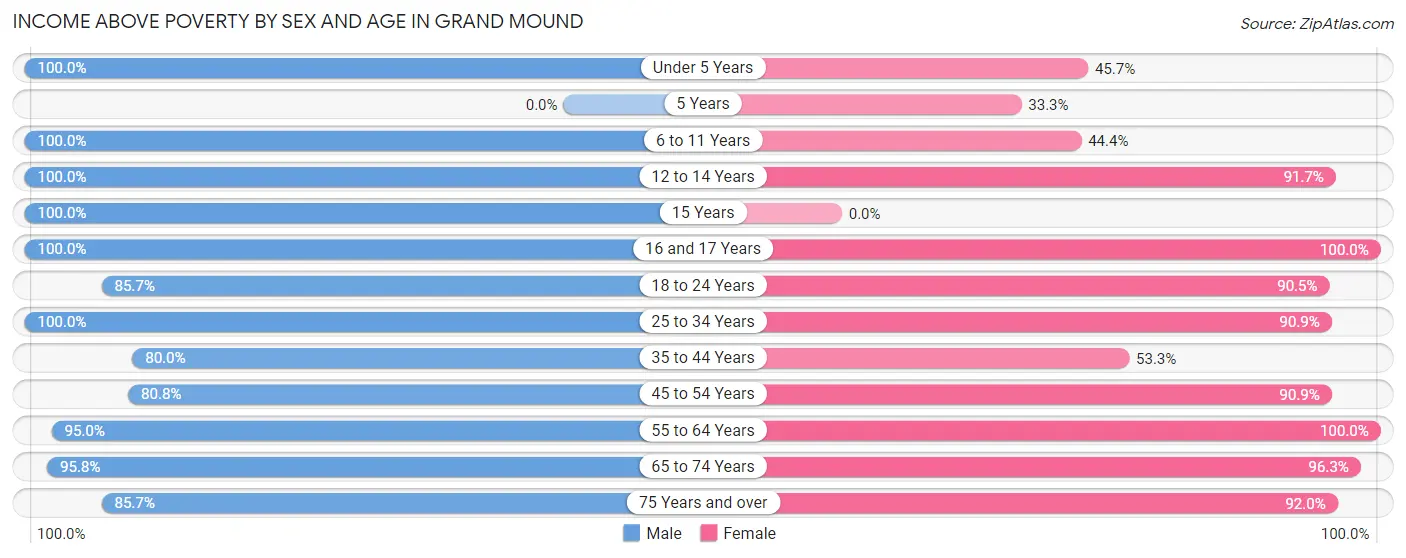
| Age Bracket | Male | Female |
| Under 5 Years | 17 (100.0%) | 16 (45.7%) |
| 5 Years | 0 (0.0%) | 1 (33.3%) |
| 6 to 11 Years | 23 (100.0%) | 8 (44.4%) |
| 12 to 14 Years | 8 (100.0%) | 11 (91.7%) |
| 15 Years | 5 (100.0%) | 0 (0.0%) |
| 16 and 17 Years | 2 (100.0%) | 3 (100.0%) |
| 18 to 24 Years | 12 (85.7%) | 19 (90.5%) |
| 25 to 34 Years | 36 (100.0%) | 40 (90.9%) |
| 35 to 44 Years | 12 (80.0%) | 8 (53.3%) |
| 45 to 54 Years | 21 (80.8%) | 20 (90.9%) |
| 55 to 64 Years | 38 (95.0%) | 28 (100.0%) |
| 65 to 74 Years | 46 (95.8%) | 26 (96.3%) |
| 75 Years and over | 12 (85.7%) | 23 (92.0%) |
| Total | 232 (93.5%) | 203 (80.2%) |
Income Below Poverty Among Married-Couple Families in Grand Mound
The poverty statistics for married-couple families in Grand Mound show that 2.9% or 3 of the total 103 families live below the poverty line. Families with 3 or 4 children have the highest poverty rate of 20.0%, comprising of 1 families. On the other hand, families with 1 or 2 children have the lowest poverty rate of 0.0%, which includes 0 families.
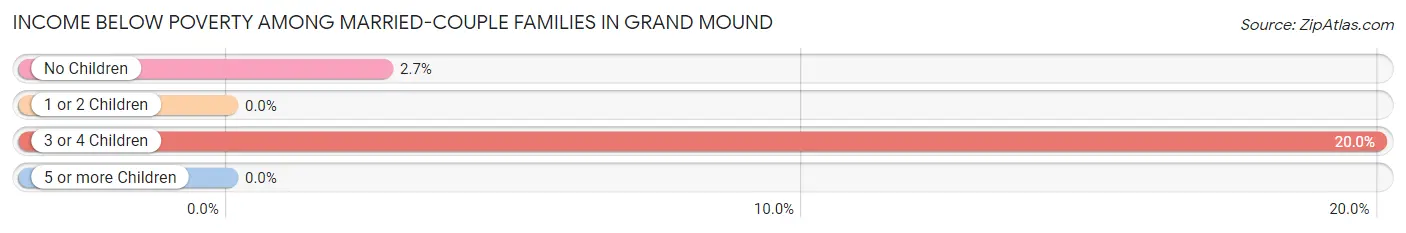
| Children | Above Poverty | Below Poverty |
| No Children | 72 (97.3%) | 2 (2.7%) |
| 1 or 2 Children | 24 (100.0%) | 0 (0.0%) |
| 3 or 4 Children | 4 (80.0%) | 1 (20.0%) |
| 5 or more Children | 0 (0.0%) | 0 (0.0%) |
| Total | 100 (97.1%) | 3 (2.9%) |
Income Below Poverty Among Single-Parent Households in Grand Mound
According to the poverty data in Grand Mound, 21.0% or 4 single-father households and 43.8% or 7 single-mother households are living below the poverty line. Among single-father households, those with no children have the highest poverty rate, with 4 households (30.8%) experiencing poverty. Likewise, among single-mother households, those with 3 or 4 children have the highest poverty rate, with 7 households (58.3%) falling below the poverty line.
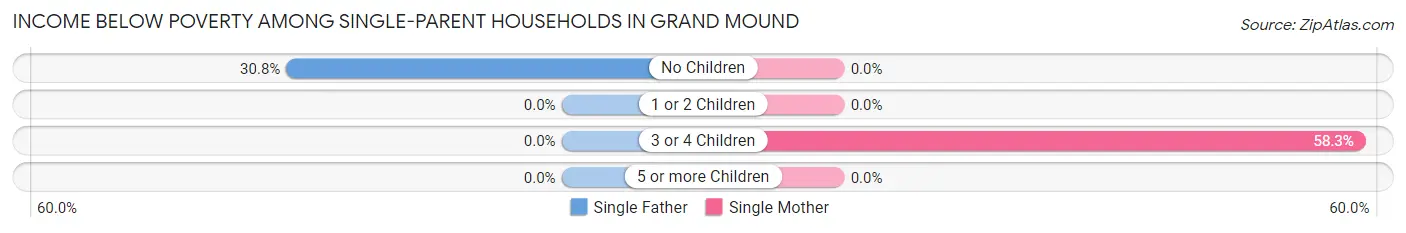
| Children | Single Father | Single Mother |
| No Children | 4 (30.8%) | 0 (0.0%) |
| 1 or 2 Children | 0 (0.0%) | 0 (0.0%) |
| 3 or 4 Children | 0 (0.0%) | 7 (58.3%) |
| 5 or more Children | 0 (0.0%) | 0 (0.0%) |
| Total | 4 (21.0%) | 7 (43.8%) |
Income Below Poverty Among Married-Couple vs Single-Parent Households in Grand Mound
The poverty data for Grand Mound shows that 3 of the married-couple family households (2.9%) and 11 of the single-parent households (31.4%) are living below the poverty level. Within the married-couple family households, those with 3 or 4 children have the highest poverty rate, with 1 households (20.0%) falling below the poverty line. Among the single-parent households, those with 3 or 4 children have the highest poverty rate, with 7 household (38.9%) living below poverty.
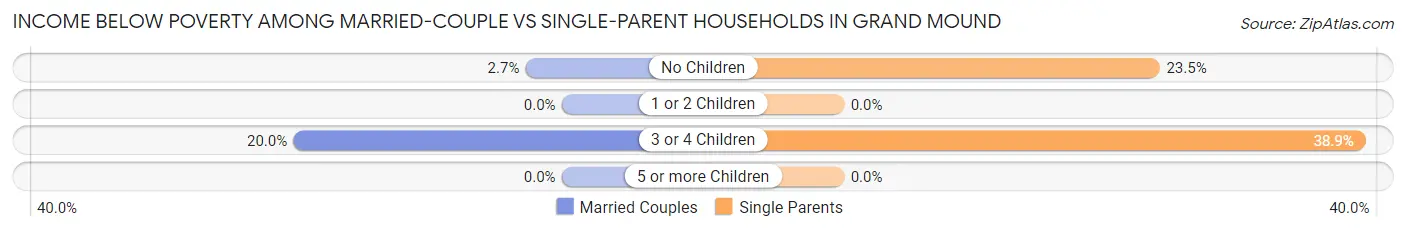
| Children | Married-Couple Families | Single-Parent Households |
| No Children | 2 (2.7%) | 4 (23.5%) |
| 1 or 2 Children | 0 (0.0%) | 0 (0.0%) |
| 3 or 4 Children | 1 (20.0%) | 7 (38.9%) |
| 5 or more Children | 0 (0.0%) | 0 (0.0%) |
| Total | 3 (2.9%) | 11 (31.4%) |
Race in Grand Mound
The most populous races in Grand Mound are White / Caucasian (474 | 94.6%), Two or more Races (25 | 5.0%), and Hispanic or Latino (19 | 3.8%).
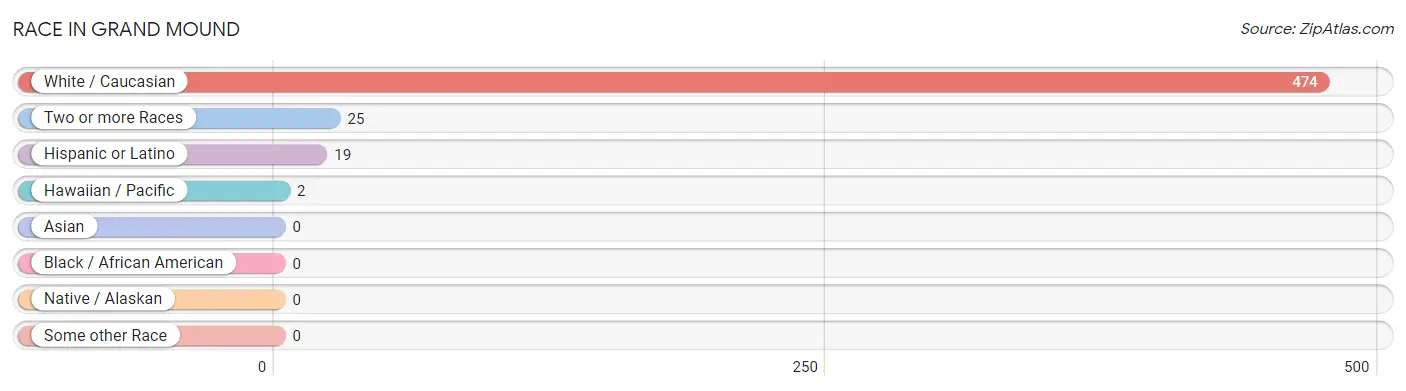
| Race | # Population | % Population |
| Asian | 0 | 0.0% |
| Black / African American | 0 | 0.0% |
| Hawaiian / Pacific | 2 | 0.4% |
| Hispanic or Latino | 19 | 3.8% |
| Native / Alaskan | 0 | 0.0% |
| White / Caucasian | 474 | 94.6% |
| Two or more Races | 25 | 5.0% |
| Some other Race | 0 | 0.0% |
| Total | 501 | 100.0% |
Ancestry in Grand Mound
The most populous ancestries reported in Grand Mound are German (200 | 39.9%), Irish (91 | 18.2%), English (70 | 14.0%), French (22 | 4.4%), and Mexican (19 | 3.8%), together accounting for 80.2% of all Grand Mound residents.
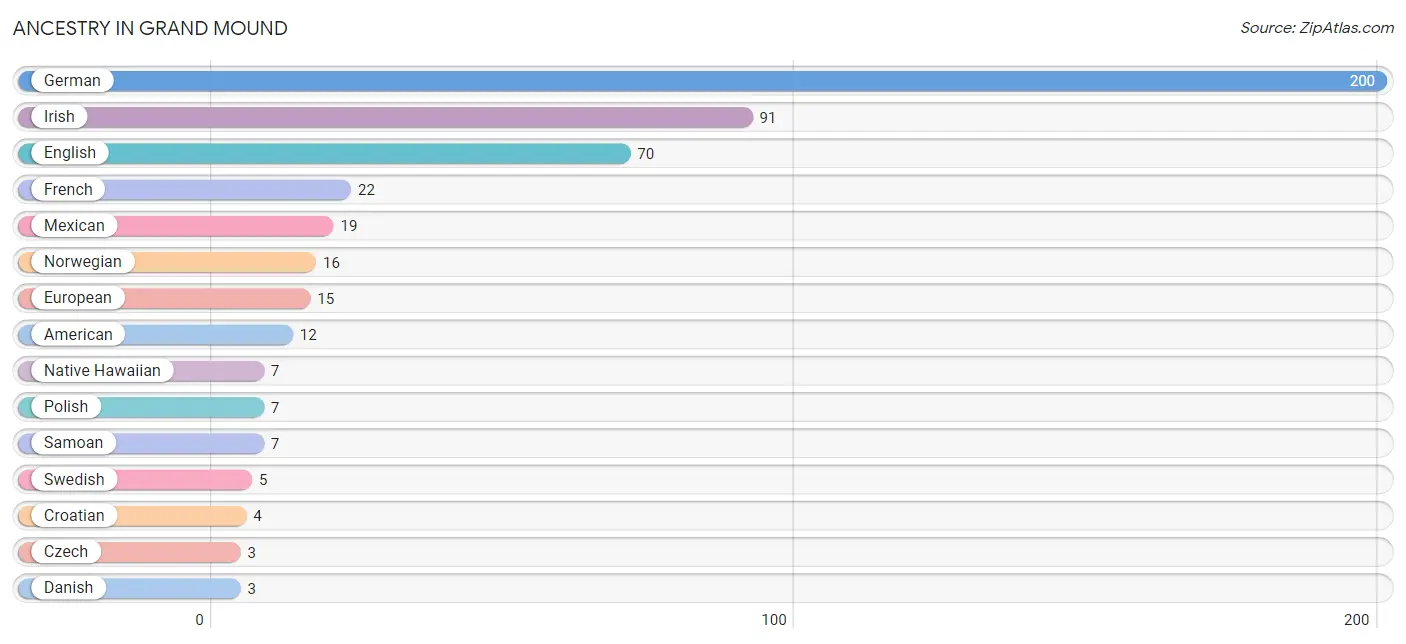
| Ancestry | # Population | % Population |
| American | 12 | 2.4% |
| British | 2 | 0.4% |
| Cherokee | 2 | 0.4% |
| Croatian | 4 | 0.8% |
| Czech | 3 | 0.6% |
| Danish | 3 | 0.6% |
| Dutch | 2 | 0.4% |
| English | 70 | 14.0% |
| European | 15 | 3.0% |
| Finnish | 2 | 0.4% |
| French | 22 | 4.4% |
| German | 200 | 39.9% |
| Irish | 91 | 18.2% |
| Iroquois | 1 | 0.2% |
| Mexican | 19 | 3.8% |
| Native Hawaiian | 7 | 1.4% |
| Norwegian | 16 | 3.2% |
| Pennsylvania German | 2 | 0.4% |
| Polish | 7 | 1.4% |
| Samoan | 7 | 1.4% |
| Scottish | 3 | 0.6% |
| Swedish | 5 | 1.0% |
| Swiss | 3 | 0.6% |
| Welsh | 2 | 0.4% | View All 24 Rows |
Immigrants in Grand Mound

| Immigration Origin | # Population | % Population | View All 0 Rows |
Sex and Age in Grand Mound
Sex and Age in Grand Mound
The most populous age groups in Grand Mound are 65 to 69 Years (34 | 13.7%) for men and Under 5 Years (35 | 13.8%) for women.
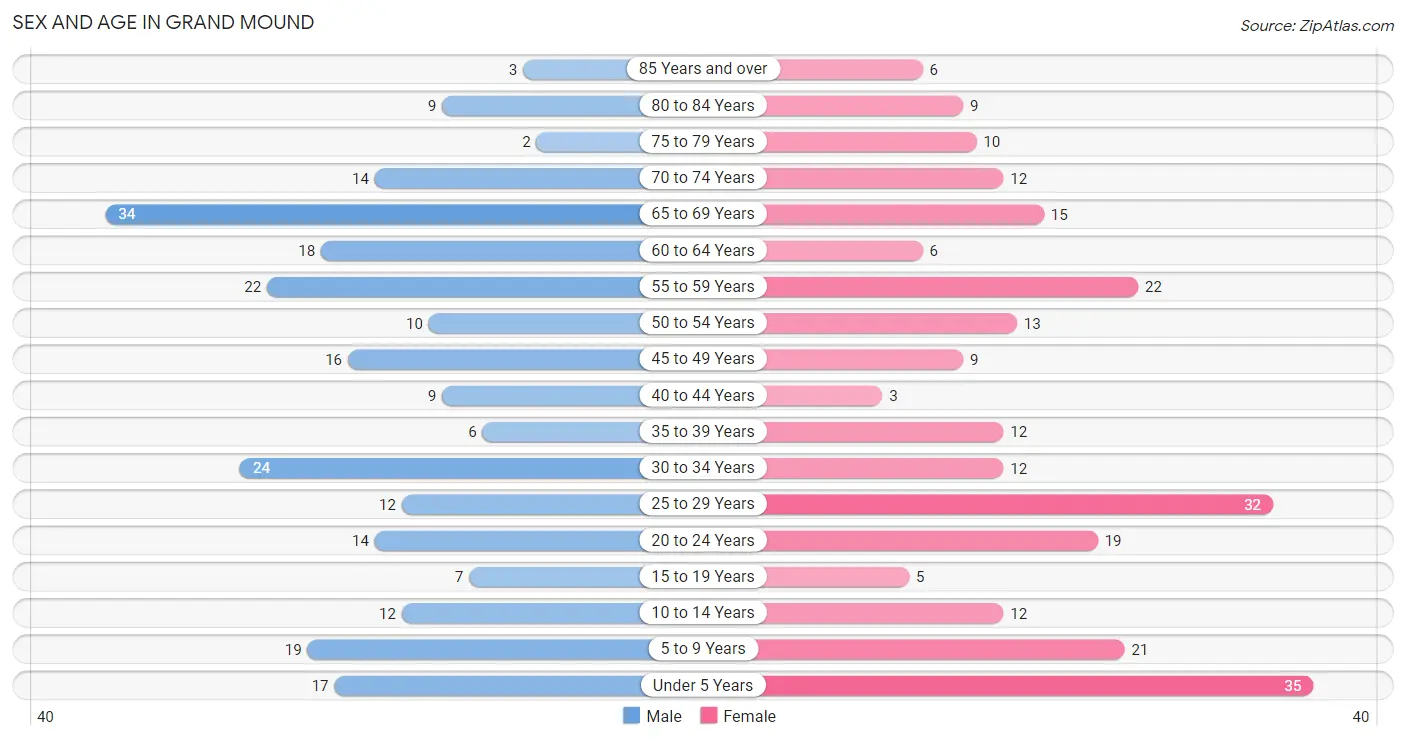
| Age Bracket | Male | Female |
| Under 5 Years | 17 (6.9%) | 35 (13.8%) |
| 5 to 9 Years | 19 (7.7%) | 21 (8.3%) |
| 10 to 14 Years | 12 (4.8%) | 12 (4.7%) |
| 15 to 19 Years | 7 (2.8%) | 5 (2.0%) |
| 20 to 24 Years | 14 (5.7%) | 19 (7.5%) |
| 25 to 29 Years | 12 (4.8%) | 32 (12.7%) |
| 30 to 34 Years | 24 (9.7%) | 12 (4.7%) |
| 35 to 39 Years | 6 (2.4%) | 12 (4.7%) |
| 40 to 44 Years | 9 (3.6%) | 3 (1.2%) |
| 45 to 49 Years | 16 (6.5%) | 9 (3.6%) |
| 50 to 54 Years | 10 (4.0%) | 13 (5.1%) |
| 55 to 59 Years | 22 (8.9%) | 22 (8.7%) |
| 60 to 64 Years | 18 (7.3%) | 6 (2.4%) |
| 65 to 69 Years | 34 (13.7%) | 15 (5.9%) |
| 70 to 74 Years | 14 (5.7%) | 12 (4.7%) |
| 75 to 79 Years | 2 (0.8%) | 10 (4.0%) |
| 80 to 84 Years | 9 (3.6%) | 9 (3.6%) |
| 85 Years and over | 3 (1.2%) | 6 (2.4%) |
| Total | 248 (100.0%) | 253 (100.0%) |
Families and Households in Grand Mound
Median Family Size in Grand Mound
The median family size in Grand Mound is 3.12 persons per family, with single female/mother families (16 | 11.6%) accounting for the largest median family size of 3.75 persons per family. On the other hand, married-couple families (103 | 74.6%) represent the smallest median family size with 3.01 persons per family.
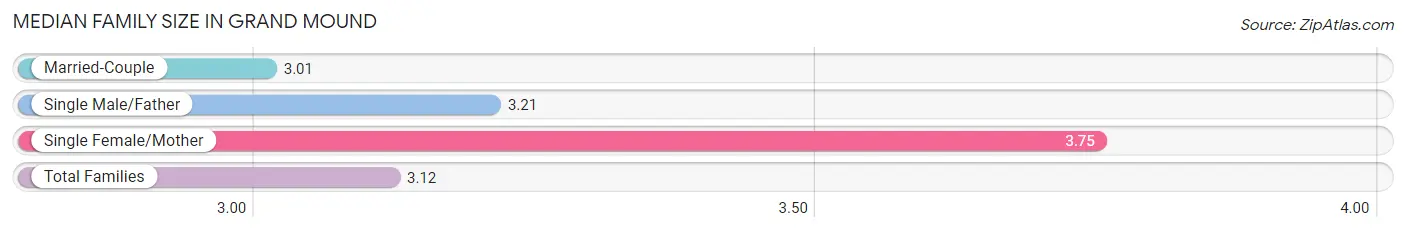
| Family Type | # Families | Family Size |
| Married-Couple | 103 (74.6%) | 3.01 |
| Single Male/Father | 19 (13.8%) | 3.21 |
| Single Female/Mother | 16 (11.6%) | 3.75 |
| Total Families | 138 (100.0%) | 3.12 |
Median Household Size in Grand Mound
The median household size in Grand Mound is 2.53 persons per household, with single female/mother households (16 | 8.1%) accounting for the largest median household size of 4 persons per household. non-family households (60 | 30.3%) represent the smallest median household size with 1.05 persons per household.
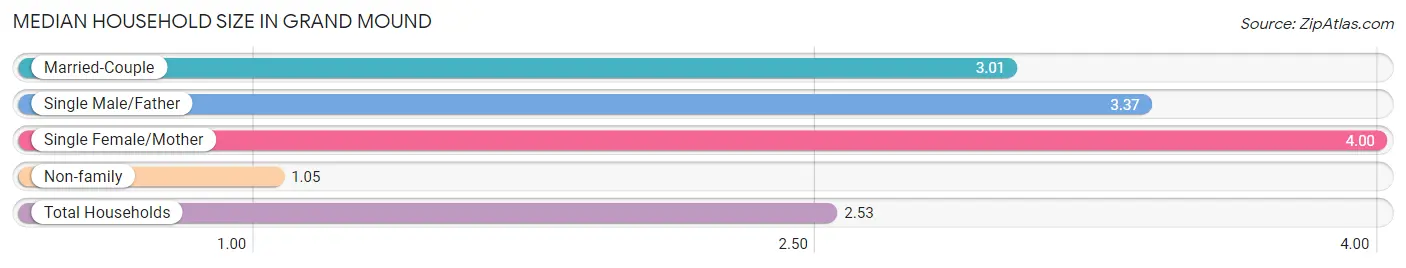
| Household Type | # Households | Household Size |
| Married-Couple | 103 (52.0%) | 3.01 |
| Single Male/Father | 19 (9.6%) | 3.37 |
| Single Female/Mother | 16 (8.1%) | 4.00 |
| Non-family | 60 (30.3%) | 1.05 |
| Total Households | 198 (100.0%) | 2.53 |
Household Size by Marriage Status in Grand Mound
Out of a total of 198 households in Grand Mound, 138 (69.7%) are family households, while 60 (30.3%) are nonfamily households. The most numerous type of family households are 2-person households, comprising 67, and the most common type of nonfamily households are 1-person households, comprising 58.
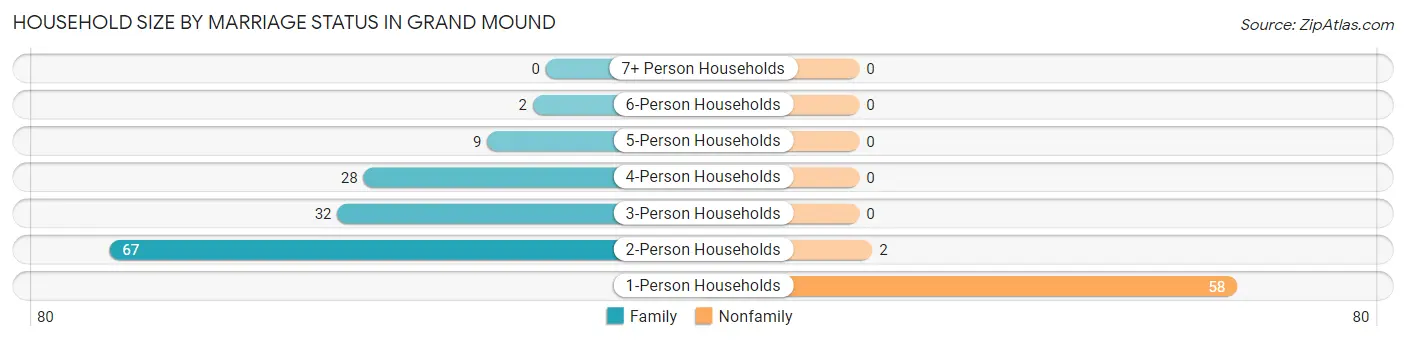
| Household Size | Family Households | Nonfamily Households |
| 1-Person Households | - | 58 (29.3%) |
| 2-Person Households | 67 (33.8%) | 2 (1.0%) |
| 3-Person Households | 32 (16.2%) | 0 (0.0%) |
| 4-Person Households | 28 (14.1%) | 0 (0.0%) |
| 5-Person Households | 9 (4.5%) | 0 (0.0%) |
| 6-Person Households | 2 (1.0%) | 0 (0.0%) |
| 7+ Person Households | 0 (0.0%) | 0 (0.0%) |
| Total | 138 (69.7%) | 60 (30.3%) |
Female Fertility in Grand Mound
Fertility by Age in Grand Mound
Average fertility rate in Grand Mound is 63.0 births per 1,000 women. Women in the age bracket of 15 to 19 years have the highest fertility rate with 400.0 births per 1,000 women. Women in the age bracket of 20 to 34 years acount for 66.7% of all women with births.
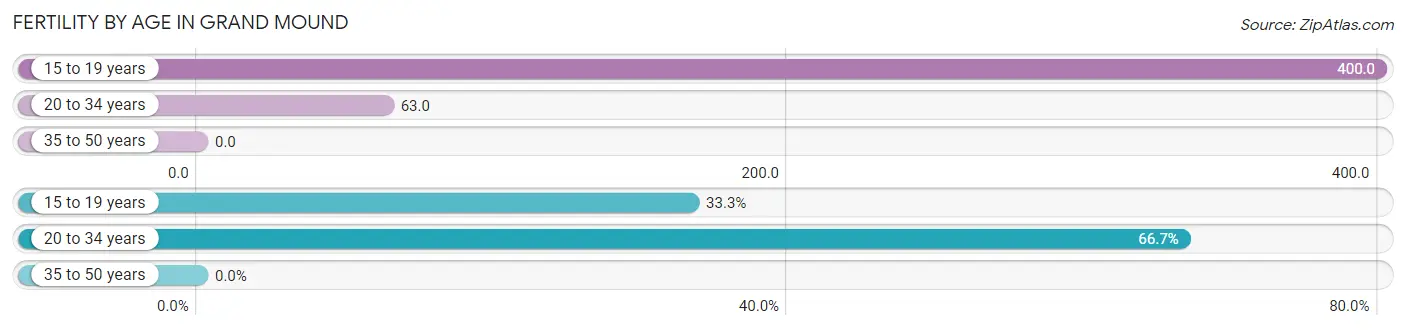
| Age Bracket | Women with Births | Births / 1,000 Women |
| 15 to 19 years | 2 (33.3%) | 400.0 |
| 20 to 34 years | 4 (66.7%) | 63.0 |
| 35 to 50 years | 0 (0.0%) | 0.0 |
| Total | 6 (100.0%) | 63.0 |
Fertility by Age by Marriage Status in Grand Mound
66.7% of women with births (6) in Grand Mound are married. The highest percentage of unmarried women with births falls into 15 to 19 years age bracket with 100.0% of them unmarried at the time of birth, while the lowest percentage of unmarried women with births belong to 20 to 34 years age bracket with 0.0% of them unmarried.
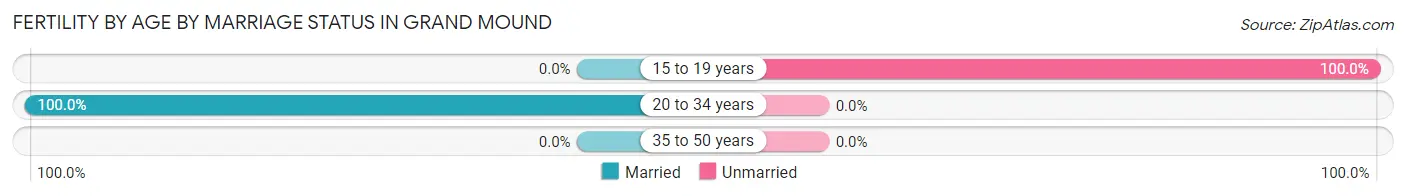
| Age Bracket | Married | Unmarried |
| 15 to 19 years | 0 (0.0%) | 2 (100.0%) |
| 20 to 34 years | 4 (100.0%) | 0 (0.0%) |
| 35 to 50 years | 0 (0.0%) | 0 (0.0%) |
| Total | 4 (66.7%) | 2 (33.3%) |
Fertility by Education in Grand Mound
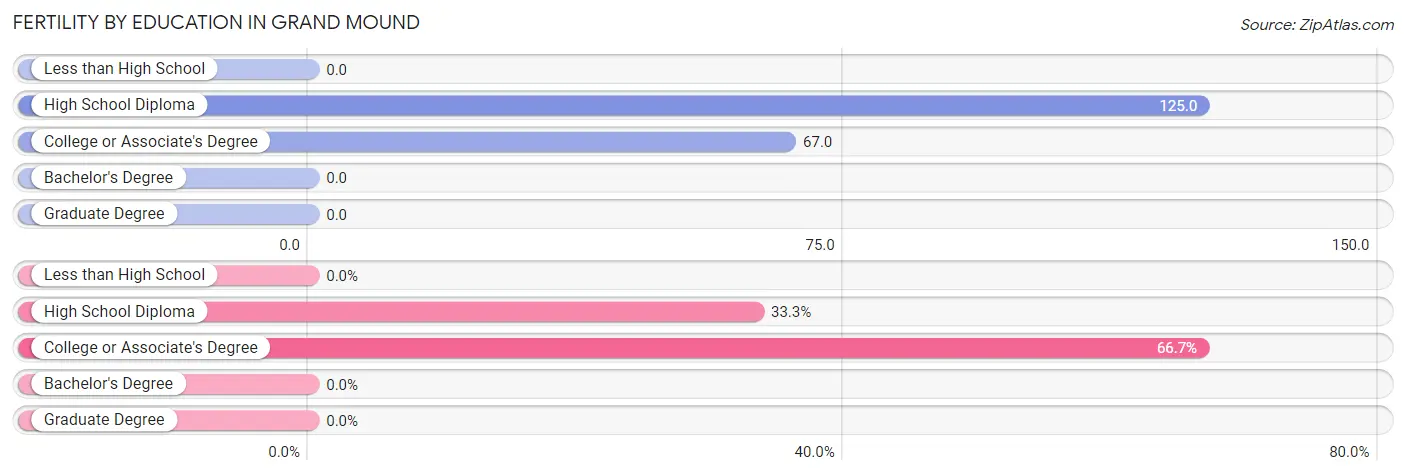
| Educational Attainment | Women with Births | Births / 1,000 Women |
| Less than High School | 0 (0.0%) | 0.0 |
| High School Diploma | 2 (33.3%) | 125.0 |
| College or Associate's Degree | 4 (66.7%) | 67.0 |
| Bachelor's Degree | 0 (0.0%) | 0.0 |
| Graduate Degree | 0 (0.0%) | 0.0 |
| Total | 6 (100.0%) | 63.0 |
Fertility by Education by Marriage Status in Grand Mound
33.3% of women with births in Grand Mound are unmarried. Women with the educational attainment of college or associate's degree are most likely to be married with 100.0% of them married at childbirth, while women with the educational attainment of high school diploma are least likely to be married with 100.0% of them unmarried at childbirth.
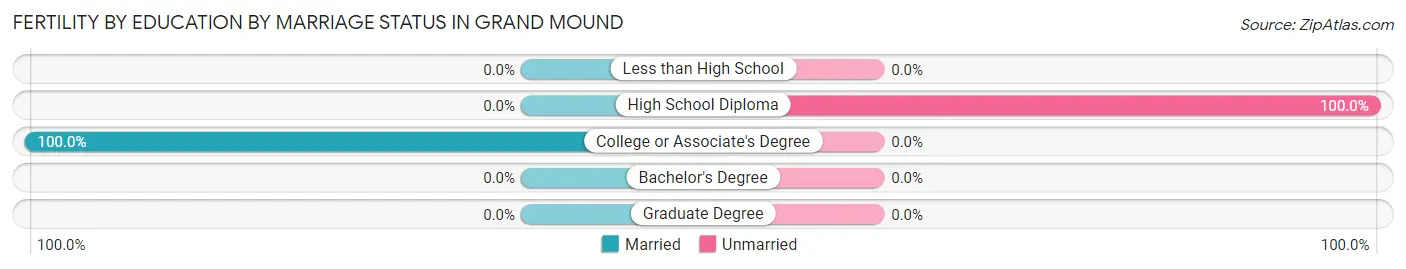
| Educational Attainment | Married | Unmarried |
| Less than High School | 0 (0.0%) | 0 (0.0%) |
| High School Diploma | 0 (0.0%) | 2 (100.0%) |
| College or Associate's Degree | 4 (100.0%) | 0 (0.0%) |
| Bachelor's Degree | 0 (0.0%) | 0 (0.0%) |
| Graduate Degree | 0 (0.0%) | 0 (0.0%) |
| Total | 4 (66.7%) | 2 (33.3%) |
Employment Characteristics in Grand Mound
Employment by Class of Employer in Grand Mound
Among the 221 employed individuals in Grand Mound, private company employees (166 | 75.1%), local government employees (13 | 5.9%), and self-employed (not incorporated) (12 | 5.4%) make up the most common classes of employment.
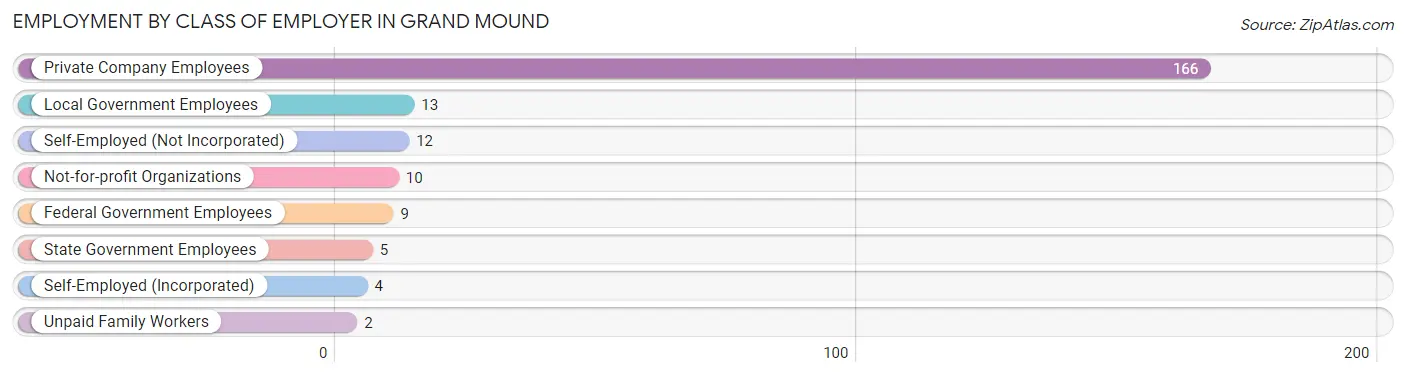
| Employer Class | # Employees | % Employees |
| Private Company Employees | 166 | 75.1% |
| Self-Employed (Incorporated) | 4 | 1.8% |
| Self-Employed (Not Incorporated) | 12 | 5.4% |
| Not-for-profit Organizations | 10 | 4.5% |
| Local Government Employees | 13 | 5.9% |
| State Government Employees | 5 | 2.3% |
| Federal Government Employees | 9 | 4.1% |
| Unpaid Family Workers | 2 | 0.9% |
| Total | 221 | 100.0% |
Employment Status by Age in Grand Mound
According to the labor force statistics for Grand Mound, out of the total population over 16 years of age (380), 61.8% or 235 individuals are in the labor force, with 3.8% or 9 of them unemployed. The age group with the highest labor force participation rate is 20 to 24 years, with 90.9% or 30 individuals in the labor force. Within the labor force, the 20 to 24 years age range has the highest percentage of unemployed individuals, with 13.3% or 4 of them being unemployed.
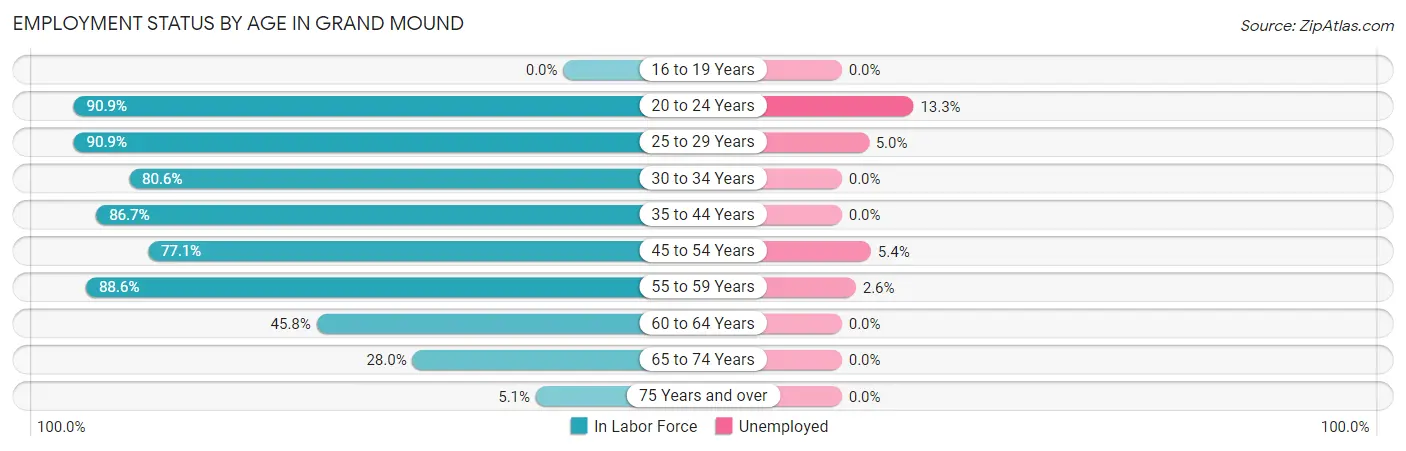
| Age Bracket | In Labor Force | Unemployed |
| 16 to 19 Years | 0 (0.0%) | 0 (0.0%) |
| 20 to 24 Years | 30 (90.9%) | 4 (13.3%) |
| 25 to 29 Years | 40 (90.9%) | 2 (5.0%) |
| 30 to 34 Years | 29 (80.6%) | 0 (0.0%) |
| 35 to 44 Years | 26 (86.7%) | 0 (0.0%) |
| 45 to 54 Years | 37 (77.1%) | 2 (5.4%) |
| 55 to 59 Years | 39 (88.6%) | 1 (2.6%) |
| 60 to 64 Years | 11 (45.8%) | 0 (0.0%) |
| 65 to 74 Years | 21 (28.0%) | 0 (0.0%) |
| 75 Years and over | 2 (5.1%) | 0 (0.0%) |
| Total | 235 (61.8%) | 9 (3.8%) |
Employment Status by Educational Attainment in Grand Mound
According to labor force statistics for Grand Mound, 80.5% of individuals (182) out of the total population between 25 and 64 years of age (226) are in the labor force, with 2.7% or 5 of them being unemployed. The group with the highest labor force participation rate are those with the educational attainment of bachelor's degree or higher, with 82.9% or 29 individuals in the labor force. Within the labor force, individuals with less than high school education have the highest percentage of unemployment, with 100.0% or 2 of them being unemployed.
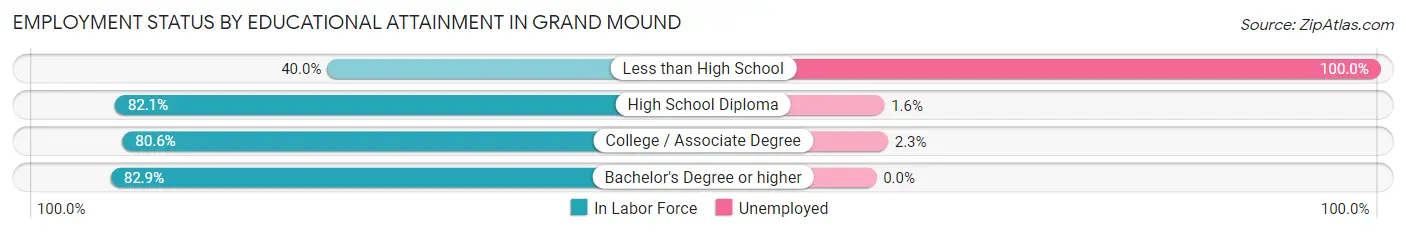
| Educational Attainment | In Labor Force | Unemployed |
| Less than High School | 2 (40.0%) | 5 (100.0%) |
| High School Diploma | 64 (82.1%) | 1 (1.6%) |
| College / Associate Degree | 87 (80.6%) | 2 (2.3%) |
| Bachelor's Degree or higher | 29 (82.9%) | 0 (0.0%) |
| Total | 182 (80.5%) | 6 (2.7%) |
Employment Occupations by Sex in Grand Mound
Management, Business, Science and Arts Occupations
The most common Management, Business, Science and Arts occupations in Grand Mound are Management (25 | 11.1%), Community & Social Service (19 | 8.4%), Education, Arts & Media (10 | 4.4%), Education Instruction & Library (9 | 4.0%), and Business & Financial (7 | 3.1%).
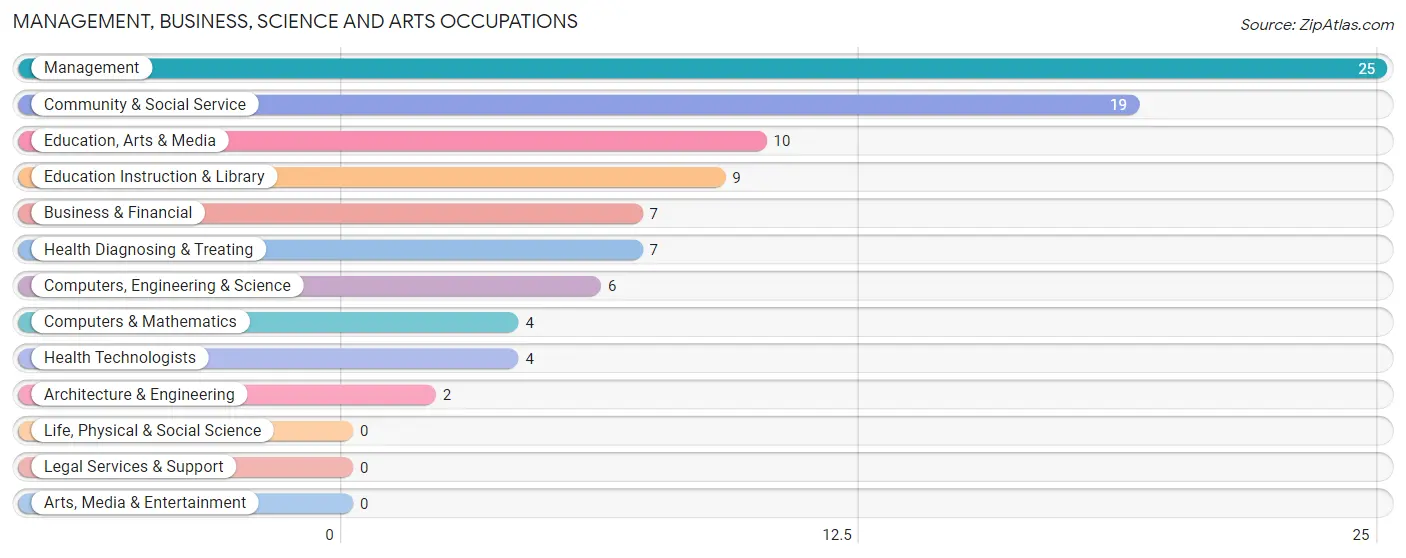
Management, Business, Science and Arts Occupations by Sex
Within the Management, Business, Science and Arts occupations in Grand Mound, the most male-oriented occupations are Computers, Engineering & Science (100.0%), Computers & Mathematics (100.0%), and Architecture & Engineering (100.0%), while the most female-oriented occupations are Health Diagnosing & Treating (85.7%), Health Technologists (75.0%), and Business & Financial (71.4%).
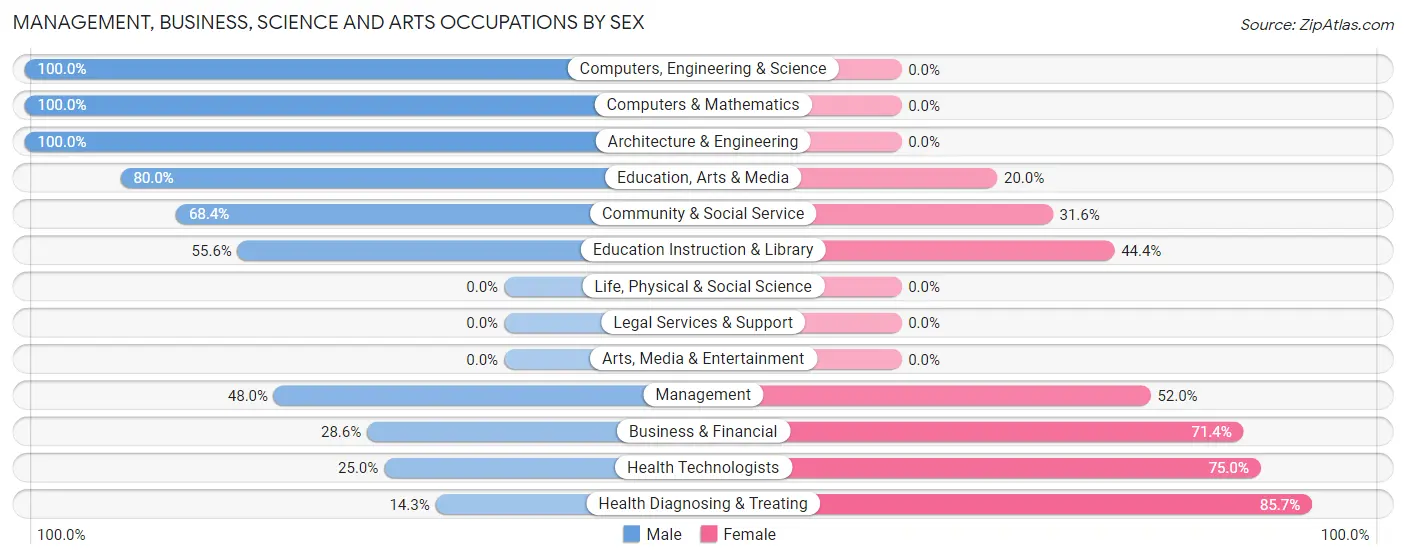
| Occupation | Male | Female |
| Management | 12 (48.0%) | 13 (52.0%) |
| Business & Financial | 2 (28.6%) | 5 (71.4%) |
| Computers, Engineering & Science | 6 (100.0%) | 0 (0.0%) |
| Computers & Mathematics | 4 (100.0%) | 0 (0.0%) |
| Architecture & Engineering | 2 (100.0%) | 0 (0.0%) |
| Life, Physical & Social Science | 0 (0.0%) | 0 (0.0%) |
| Community & Social Service | 13 (68.4%) | 6 (31.6%) |
| Education, Arts & Media | 8 (80.0%) | 2 (20.0%) |
| Legal Services & Support | 0 (0.0%) | 0 (0.0%) |
| Education Instruction & Library | 5 (55.6%) | 4 (44.4%) |
| Arts, Media & Entertainment | 0 (0.0%) | 0 (0.0%) |
| Health Diagnosing & Treating | 1 (14.3%) | 6 (85.7%) |
| Health Technologists | 1 (25.0%) | 3 (75.0%) |
| Total (Category) | 34 (53.1%) | 30 (46.9%) |
| Total (Overall) | 117 (51.8%) | 109 (48.2%) |
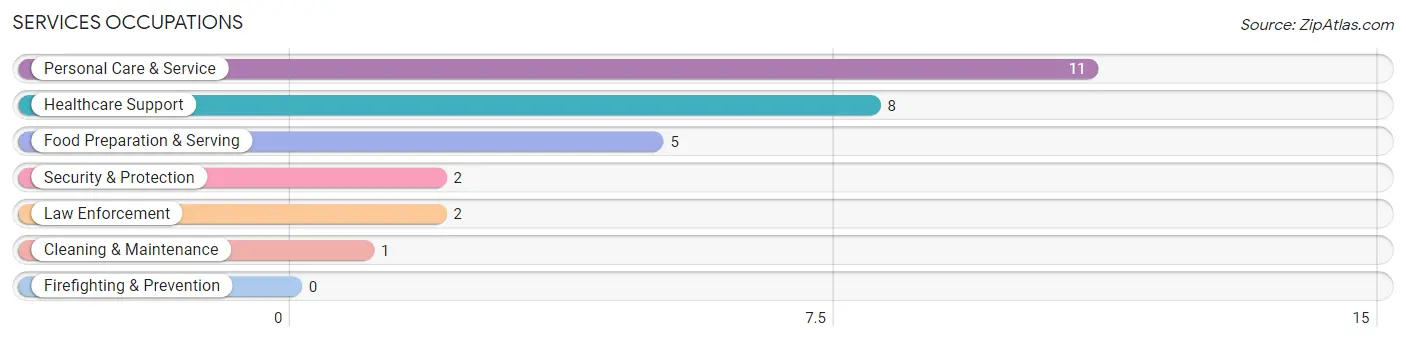
Services Occupations
The most common Services occupations in Grand Mound are Personal Care & Service (11 | 4.9%), Healthcare Support (8 | 3.5%), Food Preparation & Serving (5 | 2.2%), Security & Protection (2 | 0.9%), and Law Enforcement (2 | 0.9%).
Services Occupations by Sex
Within the Services occupations in Grand Mound, the most male-oriented occupations are Security & Protection (100.0%), Law Enforcement (100.0%), and Cleaning & Maintenance (100.0%), while the most female-oriented occupations are Healthcare Support (100.0%), Food Preparation & Serving (100.0%), and Personal Care & Service (100.0%).
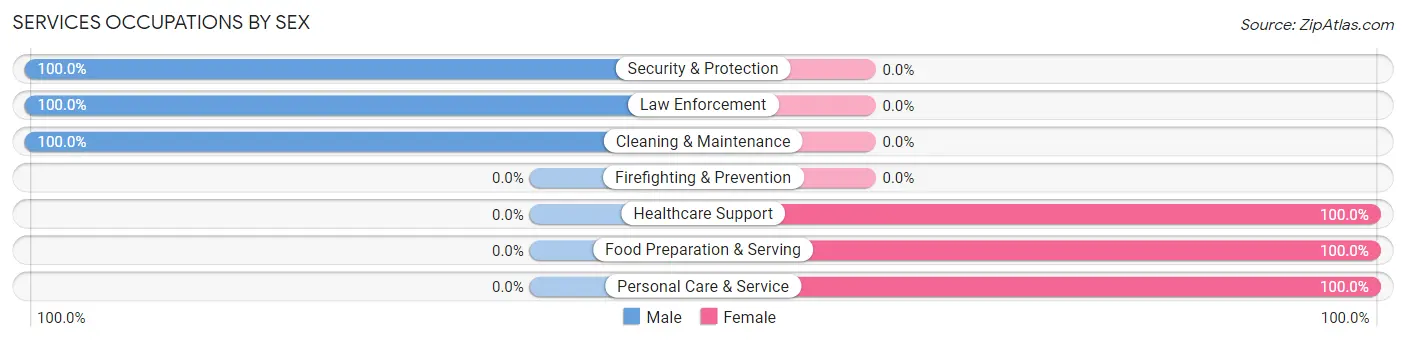
| Occupation | Male | Female |
| Healthcare Support | 0 (0.0%) | 8 (100.0%) |
| Security & Protection | 2 (100.0%) | 0 (0.0%) |
| Firefighting & Prevention | 0 (0.0%) | 0 (0.0%) |
| Law Enforcement | 2 (100.0%) | 0 (0.0%) |
| Food Preparation & Serving | 0 (0.0%) | 5 (100.0%) |
| Cleaning & Maintenance | 1 (100.0%) | 0 (0.0%) |
| Personal Care & Service | 0 (0.0%) | 11 (100.0%) |
| Total (Category) | 3 (11.1%) | 24 (88.9%) |
| Total (Overall) | 117 (51.8%) | 109 (48.2%) |
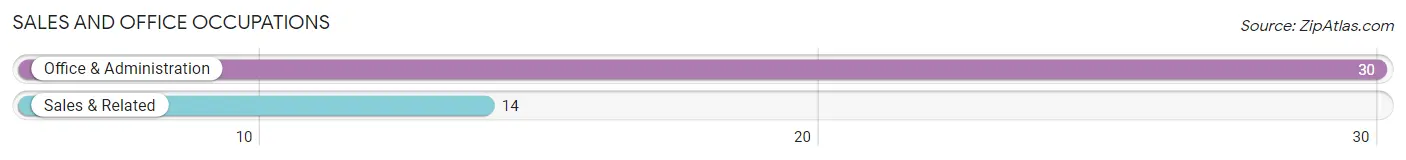
Sales and Office Occupations
The most common Sales and Office occupations in Grand Mound are Office & Administration (30 | 13.3%), and Sales & Related (14 | 6.2%).
Sales and Office Occupations by Sex
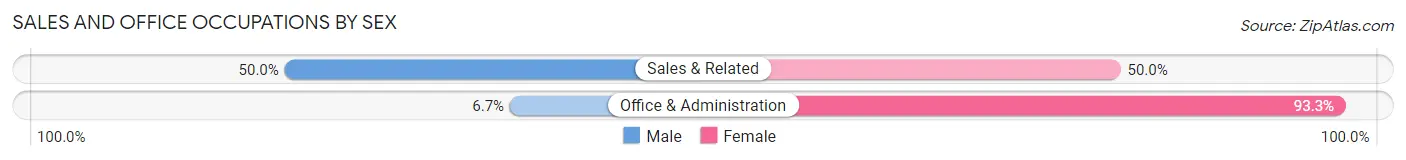
| Occupation | Male | Female |
| Sales & Related | 7 (50.0%) | 7 (50.0%) |
| Office & Administration | 2 (6.7%) | 28 (93.3%) |
| Total (Category) | 9 (20.4%) | 35 (79.5%) |
| Total (Overall) | 117 (51.8%) | 109 (48.2%) |
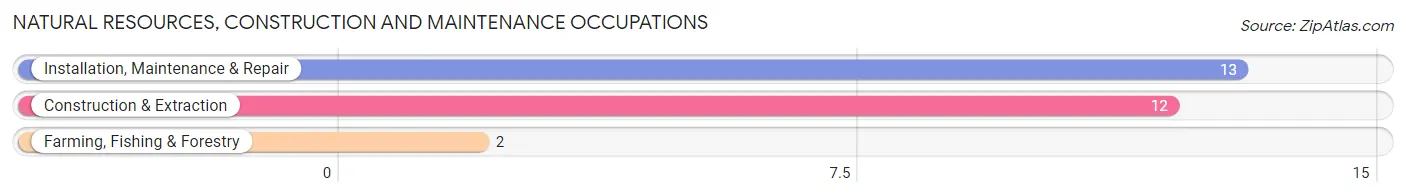
Natural Resources, Construction and Maintenance Occupations
The most common Natural Resources, Construction and Maintenance occupations in Grand Mound are Installation, Maintenance & Repair (13 | 5.8%), Construction & Extraction (12 | 5.3%), and Farming, Fishing & Forestry (2 | 0.9%).
Natural Resources, Construction and Maintenance Occupations by Sex
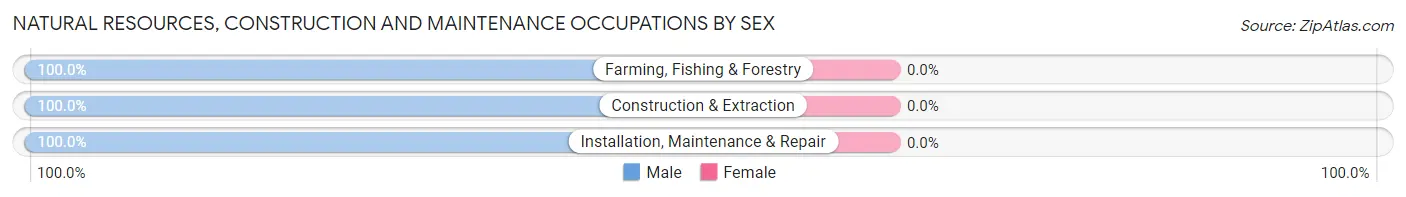
| Occupation | Male | Female |
| Farming, Fishing & Forestry | 2 (100.0%) | 0 (0.0%) |
| Construction & Extraction | 12 (100.0%) | 0 (0.0%) |
| Installation, Maintenance & Repair | 13 (100.0%) | 0 (0.0%) |
| Total (Category) | 27 (100.0%) | 0 (0.0%) |
| Total (Overall) | 117 (51.8%) | 109 (48.2%) |
Production, Transportation and Moving Occupations
The most common Production, Transportation and Moving occupations in Grand Mound are Production (37 | 16.4%), Material Moving (14 | 6.2%), and Transportation (13 | 5.8%).
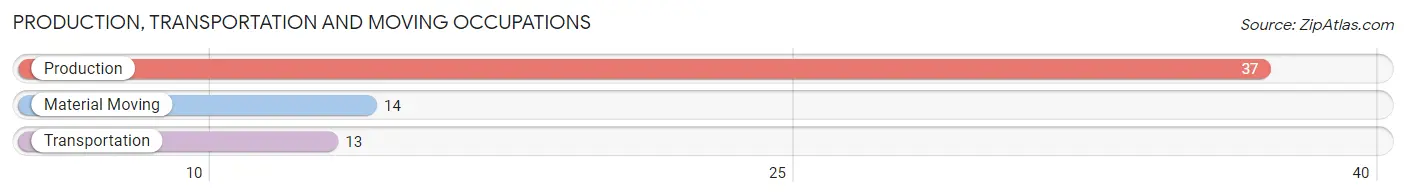
Production, Transportation and Moving Occupations by Sex
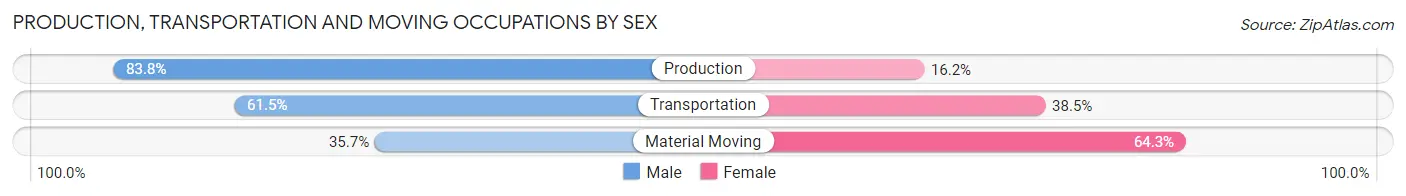
| Occupation | Male | Female |
| Production | 31 (83.8%) | 6 (16.2%) |
| Transportation | 8 (61.5%) | 5 (38.5%) |
| Material Moving | 5 (35.7%) | 9 (64.3%) |
| Total (Category) | 44 (68.8%) | 20 (31.2%) |
| Total (Overall) | 117 (51.8%) | 109 (48.2%) |
Employment Industries by Sex in Grand Mound
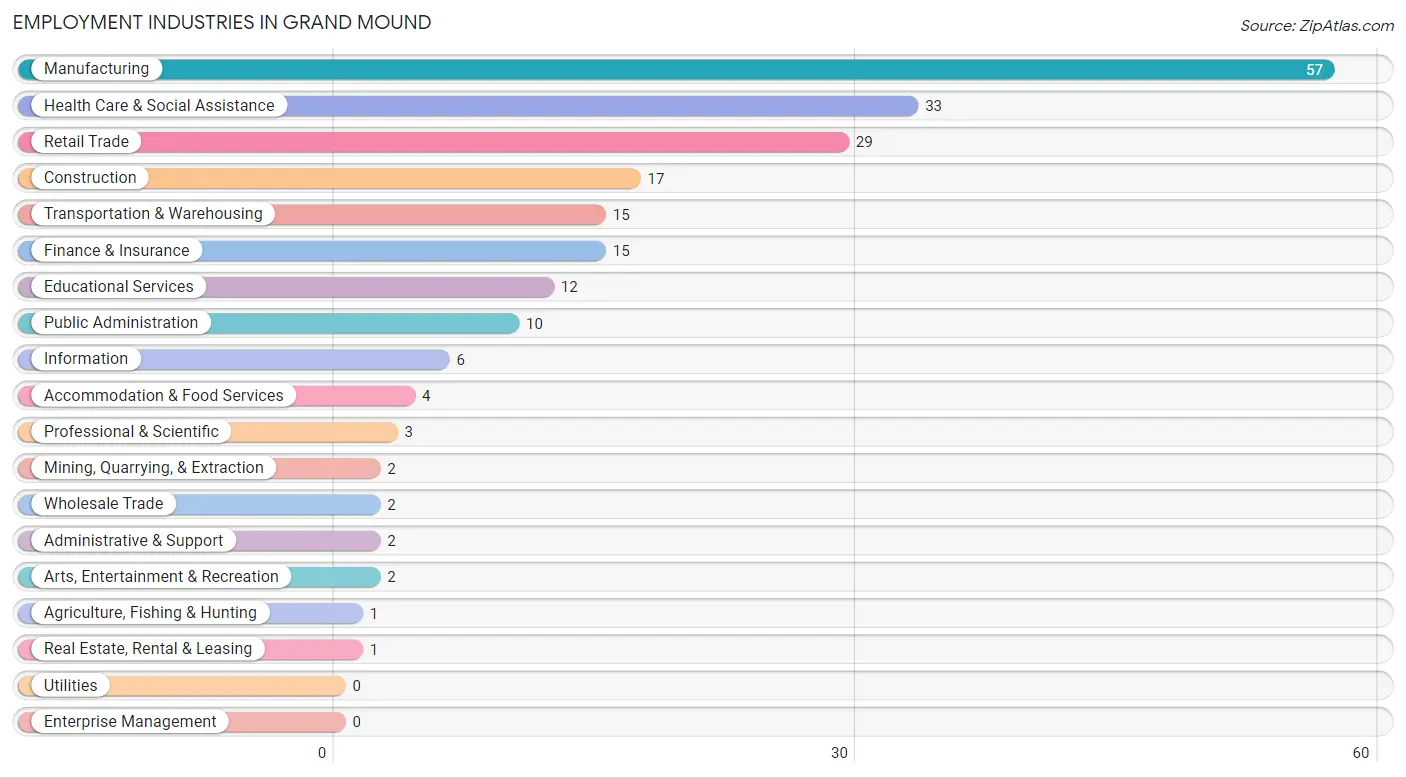
Employment Industries in Grand Mound
The major employment industries in Grand Mound include Manufacturing (57 | 25.2%), Health Care & Social Assistance (33 | 14.6%), Retail Trade (29 | 12.8%), Construction (17 | 7.5%), and Transportation & Warehousing (15 | 6.6%).
Employment Industries by Sex in Grand Mound
The Grand Mound industries that see more men than women are Agriculture, Fishing & Hunting (100.0%), Mining, Quarrying, & Extraction (100.0%), and Wholesale Trade (100.0%), whereas the industries that tend to have a higher number of women are Information (100.0%), Finance & Insurance (100.0%), and Administrative & Support (100.0%).
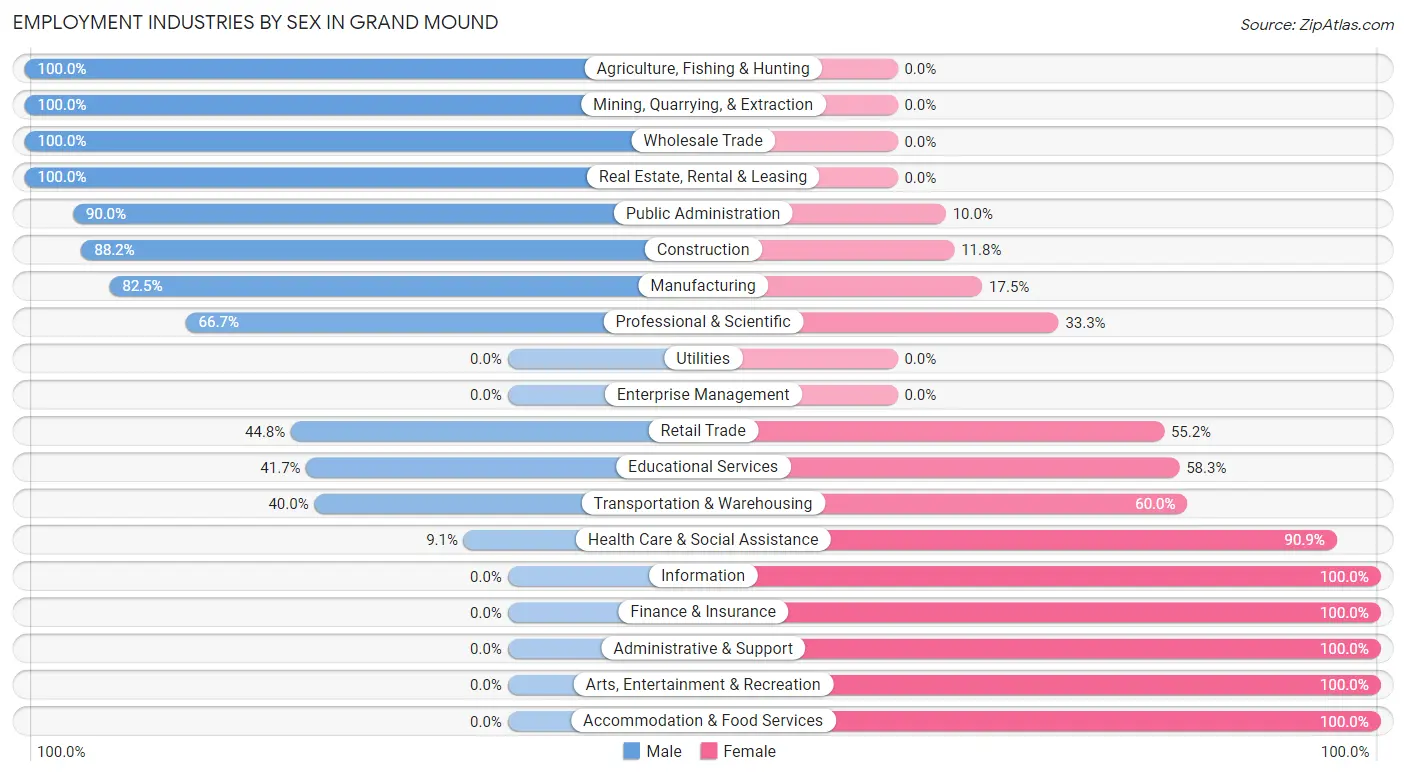
| Industry | Male | Female |
| Agriculture, Fishing & Hunting | 1 (100.0%) | 0 (0.0%) |
| Mining, Quarrying, & Extraction | 2 (100.0%) | 0 (0.0%) |
| Construction | 15 (88.2%) | 2 (11.8%) |
| Manufacturing | 47 (82.5%) | 10 (17.5%) |
| Wholesale Trade | 2 (100.0%) | 0 (0.0%) |
| Retail Trade | 13 (44.8%) | 16 (55.2%) |
| Transportation & Warehousing | 6 (40.0%) | 9 (60.0%) |
| Utilities | 0 (0.0%) | 0 (0.0%) |
| Information | 0 (0.0%) | 6 (100.0%) |
| Finance & Insurance | 0 (0.0%) | 15 (100.0%) |
| Real Estate, Rental & Leasing | 1 (100.0%) | 0 (0.0%) |
| Professional & Scientific | 2 (66.7%) | 1 (33.3%) |
| Enterprise Management | 0 (0.0%) | 0 (0.0%) |
| Administrative & Support | 0 (0.0%) | 2 (100.0%) |
| Educational Services | 5 (41.7%) | 7 (58.3%) |
| Health Care & Social Assistance | 3 (9.1%) | 30 (90.9%) |
| Arts, Entertainment & Recreation | 0 (0.0%) | 2 (100.0%) |
| Accommodation & Food Services | 0 (0.0%) | 4 (100.0%) |
| Public Administration | 9 (90.0%) | 1 (10.0%) |
| Total | 117 (51.8%) | 109 (48.2%) |
Education in Grand Mound
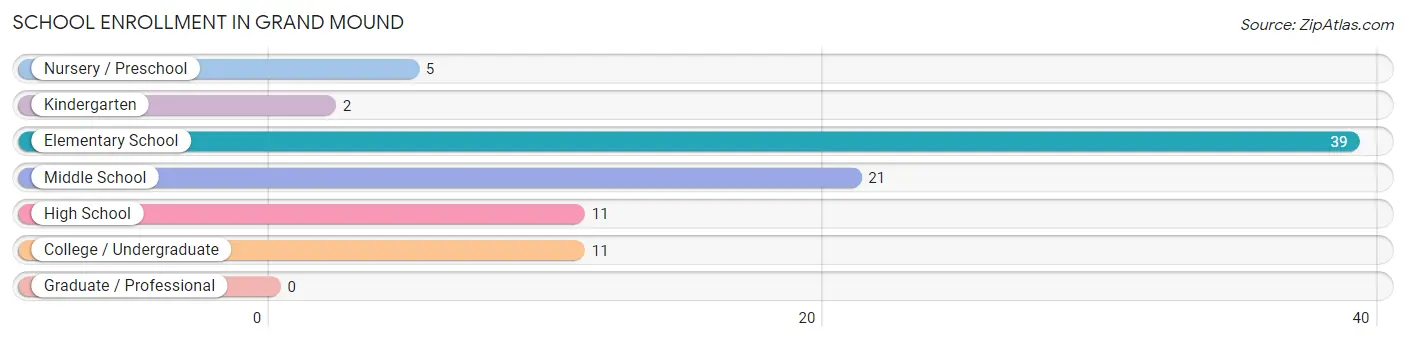
School Enrollment in Grand Mound
The most common levels of schooling among the 89 students in Grand Mound are elementary school (39 | 43.8%), middle school (21 | 23.6%), and high school (11 | 12.4%).
| School Level | # Students | % Students |
| Nursery / Preschool | 5 | 5.6% |
| Kindergarten | 2 | 2.2% |
| Elementary School | 39 | 43.8% |
| Middle School | 21 | 23.6% |
| High School | 11 | 12.4% |
| College / Undergraduate | 11 | 12.4% |
| Graduate / Professional | 0 | 0.0% |
| Total | 89 | 100.0% |
School Enrollment by Age by Funding Source in Grand Mound
Out of a total of 89 students who are enrolled in schools in Grand Mound, 20 (22.5%) attend a private institution, while the remaining 69 (77.5%) are enrolled in public schools. The age group of 35 years and over has the highest likelihood of being enrolled in private schools, with 2 (100.0% in the age bracket) enrolled. Conversely, the age group of 3 to 4 year olds has the lowest likelihood of being enrolled in a private school, with 5 (100.0% in the age bracket) attending a public institution.
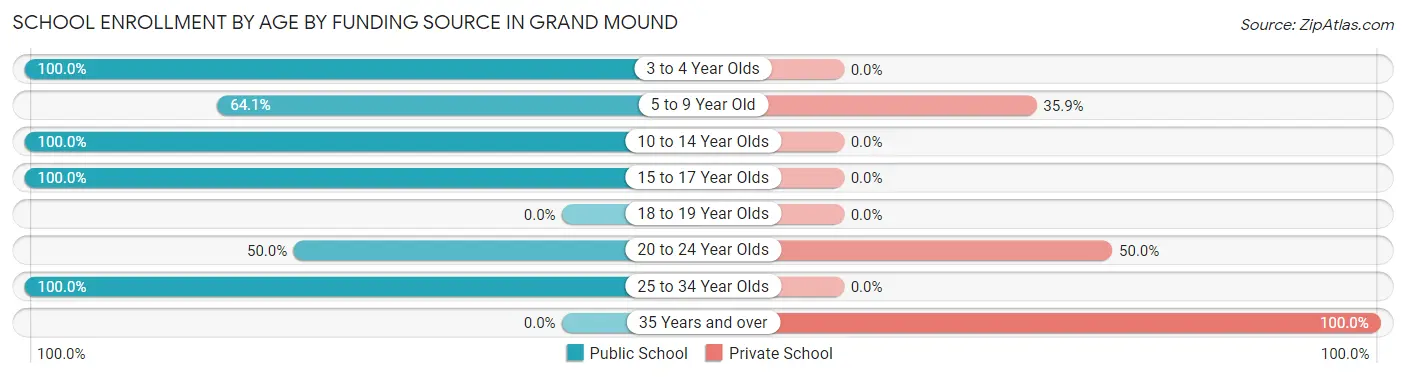
| Age Bracket | Public School | Private School |
| 3 to 4 Year Olds | 5 (100.0%) | 0 (0.0%) |
| 5 to 9 Year Old | 25 (64.1%) | 14 (35.9%) |
| 10 to 14 Year Olds | 24 (100.0%) | 0 (0.0%) |
| 15 to 17 Year Olds | 10 (100.0%) | 0 (0.0%) |
| 18 to 19 Year Olds | 0 (0.0%) | 0 (0.0%) |
| 20 to 24 Year Olds | 4 (50.0%) | 4 (50.0%) |
| 25 to 34 Year Olds | 1 (100.0%) | 0 (0.0%) |
| 35 Years and over | 0 (0.0%) | 2 (100.0%) |
| Total | 69 (77.5%) | 20 (22.5%) |
Educational Attainment by Field of Study in Grand Mound
Education (14 | 20.3%), business (12 | 17.4%), science & technology (7 | 10.1%), bio, nature & agricultural (6 | 8.7%), and physical & health sciences (6 | 8.7%) are the most common fields of study among 69 individuals in Grand Mound who have obtained a bachelor's degree or higher.
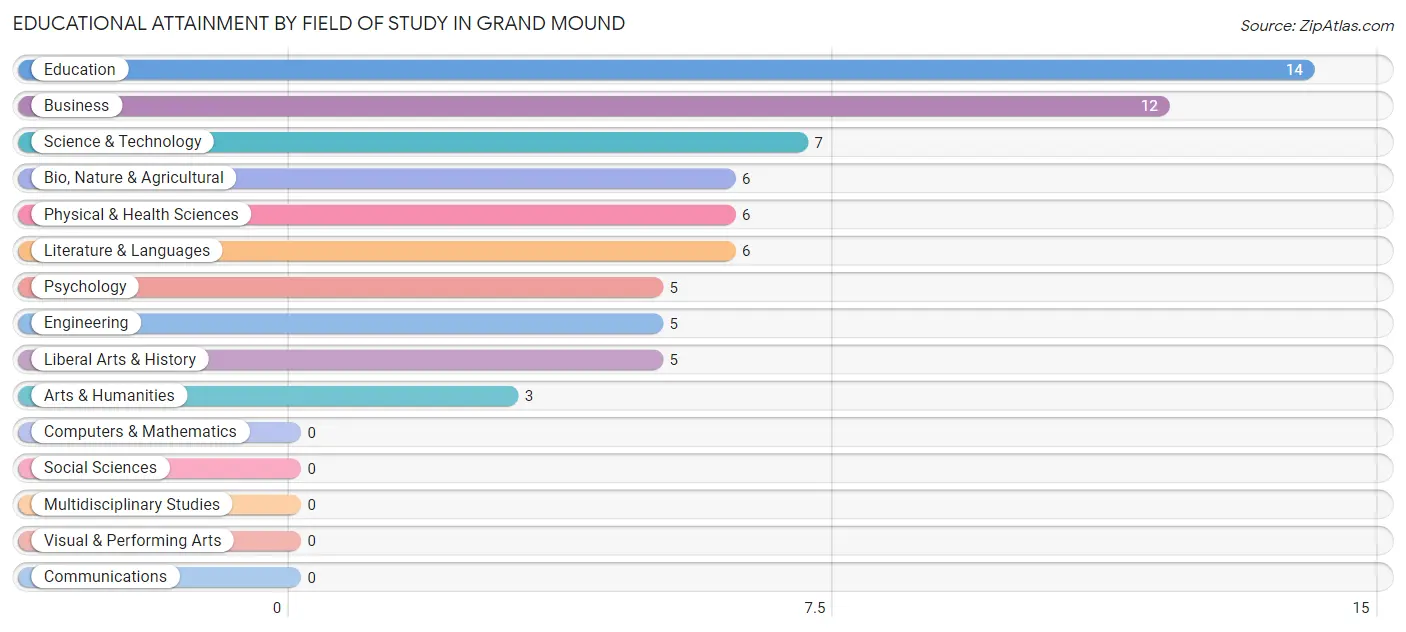
| Field of Study | # Graduates | % Graduates |
| Computers & Mathematics | 0 | 0.0% |
| Bio, Nature & Agricultural | 6 | 8.7% |
| Physical & Health Sciences | 6 | 8.7% |
| Psychology | 5 | 7.2% |
| Social Sciences | 0 | 0.0% |
| Engineering | 5 | 7.2% |
| Multidisciplinary Studies | 0 | 0.0% |
| Science & Technology | 7 | 10.1% |
| Business | 12 | 17.4% |
| Education | 14 | 20.3% |
| Literature & Languages | 6 | 8.7% |
| Liberal Arts & History | 5 | 7.2% |
| Visual & Performing Arts | 0 | 0.0% |
| Communications | 0 | 0.0% |
| Arts & Humanities | 3 | 4.3% |
| Total | 69 | 100.0% |
Transportation & Commute in Grand Mound
Vehicle Availability by Sex in Grand Mound
The most prevalent vehicle ownership categories in Grand Mound are males with 2 vehicles (42, accounting for 37.2%) and females with 2 vehicles (35, making up 38.9%).
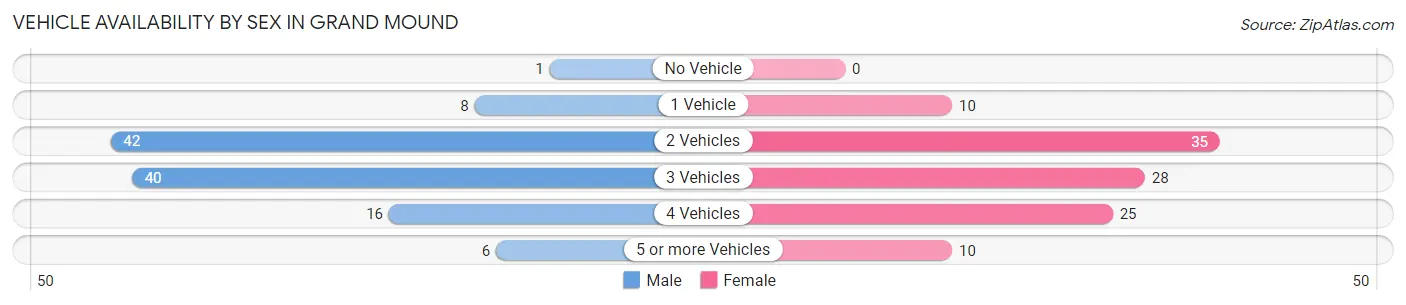
| Vehicles Available | Male | Female |
| No Vehicle | 1 (0.9%) | 0 (0.0%) |
| 1 Vehicle | 8 (7.1%) | 10 (9.3%) |
| 2 Vehicles | 42 (37.2%) | 35 (32.4%) |
| 3 Vehicles | 40 (35.4%) | 28 (25.9%) |
| 4 Vehicles | 16 (14.2%) | 25 (23.2%) |
| 5 or more Vehicles | 6 (5.3%) | 10 (9.3%) |
| Total | 113 (100.0%) | 108 (100.0%) |
Commute Time in Grand Mound
The most frequently occuring commute durations in Grand Mound are 30 to 34 minutes (48 commuters, 23.1%), 10 to 14 minutes (30 commuters, 14.4%), and 20 to 24 minutes (21 commuters, 10.1%).
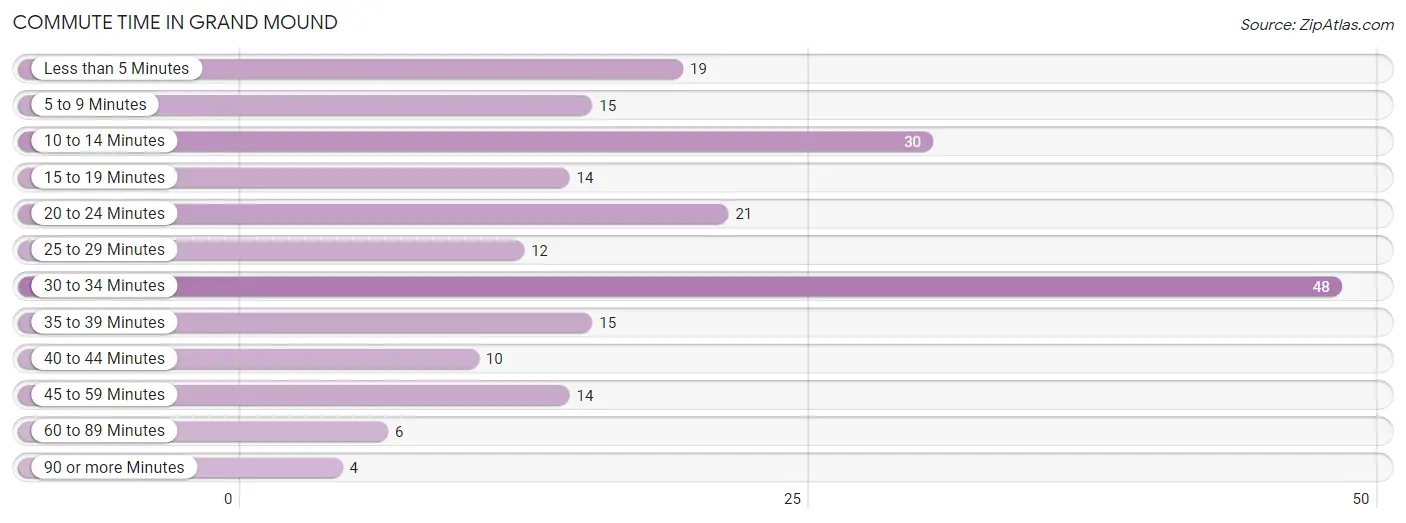
| Commute Time | # Commuters | % Commuters |
| Less than 5 Minutes | 19 | 9.1% |
| 5 to 9 Minutes | 15 | 7.2% |
| 10 to 14 Minutes | 30 | 14.4% |
| 15 to 19 Minutes | 14 | 6.7% |
| 20 to 24 Minutes | 21 | 10.1% |
| 25 to 29 Minutes | 12 | 5.8% |
| 30 to 34 Minutes | 48 | 23.1% |
| 35 to 39 Minutes | 15 | 7.2% |
| 40 to 44 Minutes | 10 | 4.8% |
| 45 to 59 Minutes | 14 | 6.7% |
| 60 to 89 Minutes | 6 | 2.9% |
| 90 or more Minutes | 4 | 1.9% |
Commute Time by Sex in Grand Mound
The most common commute times in Grand Mound are 30 to 34 minutes (24 commuters, 21.8%) for males and 30 to 34 minutes (24 commuters, 24.5%) for females.
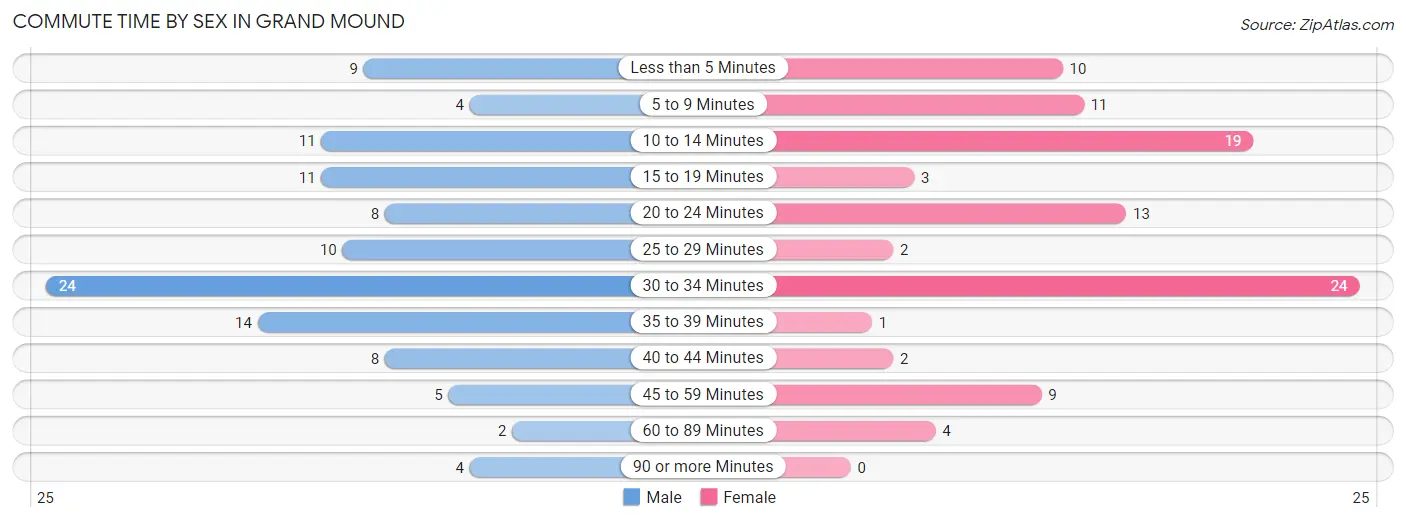
| Commute Time | Male | Female |
| Less than 5 Minutes | 9 (8.2%) | 10 (10.2%) |
| 5 to 9 Minutes | 4 (3.6%) | 11 (11.2%) |
| 10 to 14 Minutes | 11 (10.0%) | 19 (19.4%) |
| 15 to 19 Minutes | 11 (10.0%) | 3 (3.1%) |
| 20 to 24 Minutes | 8 (7.3%) | 13 (13.3%) |
| 25 to 29 Minutes | 10 (9.1%) | 2 (2.0%) |
| 30 to 34 Minutes | 24 (21.8%) | 24 (24.5%) |
| 35 to 39 Minutes | 14 (12.7%) | 1 (1.0%) |
| 40 to 44 Minutes | 8 (7.3%) | 2 (2.0%) |
| 45 to 59 Minutes | 5 (4.5%) | 9 (9.2%) |
| 60 to 89 Minutes | 2 (1.8%) | 4 (4.1%) |
| 90 or more Minutes | 4 (3.6%) | 0 (0.0%) |
Time of Departure to Work by Sex in Grand Mound
The most frequent times of departure to work in Grand Mound are 12:00 AM to 4:59 AM (21, 19.1%) for males and 7:00 AM to 7:29 AM (19, 19.4%) for females.
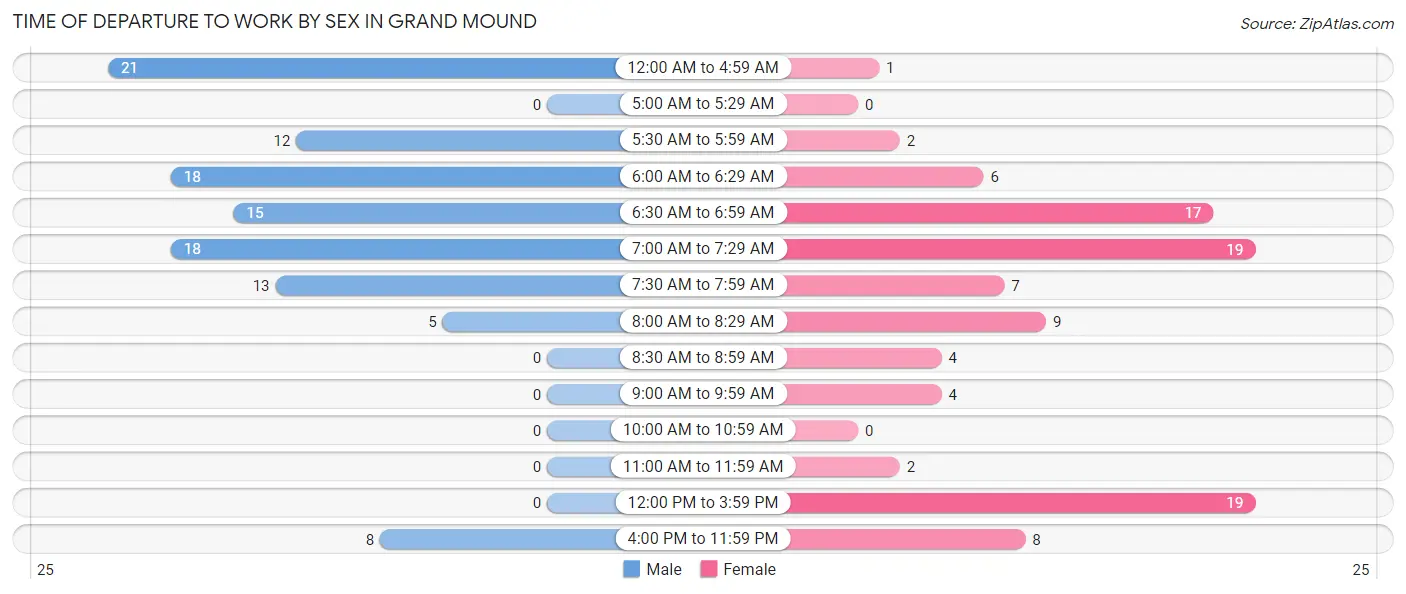
| Time of Departure | Male | Female |
| 12:00 AM to 4:59 AM | 21 (19.1%) | 1 (1.0%) |
| 5:00 AM to 5:29 AM | 0 (0.0%) | 0 (0.0%) |
| 5:30 AM to 5:59 AM | 12 (10.9%) | 2 (2.0%) |
| 6:00 AM to 6:29 AM | 18 (16.4%) | 6 (6.1%) |
| 6:30 AM to 6:59 AM | 15 (13.6%) | 17 (17.3%) |
| 7:00 AM to 7:29 AM | 18 (16.4%) | 19 (19.4%) |
| 7:30 AM to 7:59 AM | 13 (11.8%) | 7 (7.1%) |
| 8:00 AM to 8:29 AM | 5 (4.5%) | 9 (9.2%) |
| 8:30 AM to 8:59 AM | 0 (0.0%) | 4 (4.1%) |
| 9:00 AM to 9:59 AM | 0 (0.0%) | 4 (4.1%) |
| 10:00 AM to 10:59 AM | 0 (0.0%) | 0 (0.0%) |
| 11:00 AM to 11:59 AM | 0 (0.0%) | 2 (2.0%) |
| 12:00 PM to 3:59 PM | 0 (0.0%) | 19 (19.4%) |
| 4:00 PM to 11:59 PM | 8 (7.3%) | 8 (8.2%) |
| Total | 110 (100.0%) | 98 (100.0%) |
Housing Occupancy in Grand Mound
Occupancy by Ownership in Grand Mound
Of the total 198 dwellings in Grand Mound, owner-occupied units account for 164 (82.8%), while renter-occupied units make up 34 (17.2%).
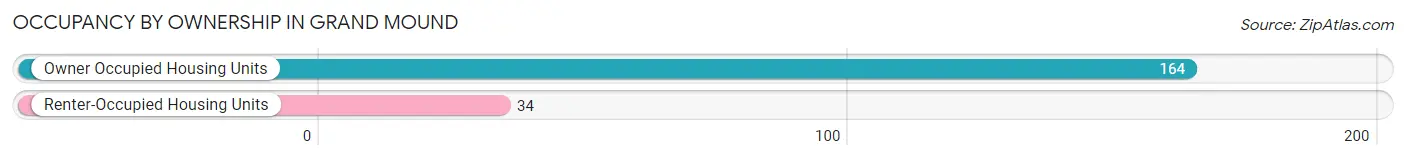
| Occupancy | # Housing Units | % Housing Units |
| Owner Occupied Housing Units | 164 | 82.8% |
| Renter-Occupied Housing Units | 34 | 17.2% |
| Total Occupied Housing Units | 198 | 100.0% |
Occupancy by Household Size in Grand Mound
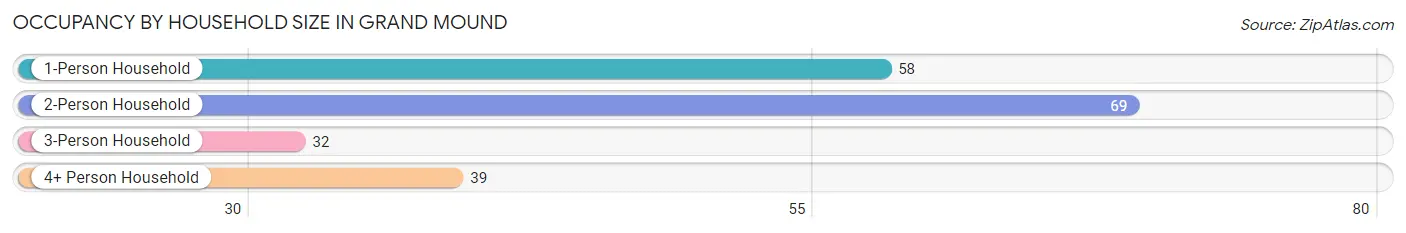
| Household Size | # Housing Units | % Housing Units |
| 1-Person Household | 58 | 29.3% |
| 2-Person Household | 69 | 34.8% |
| 3-Person Household | 32 | 16.2% |
| 4+ Person Household | 39 | 19.7% |
| Total Housing Units | 198 | 100.0% |
Occupancy by Ownership by Household Size in Grand Mound
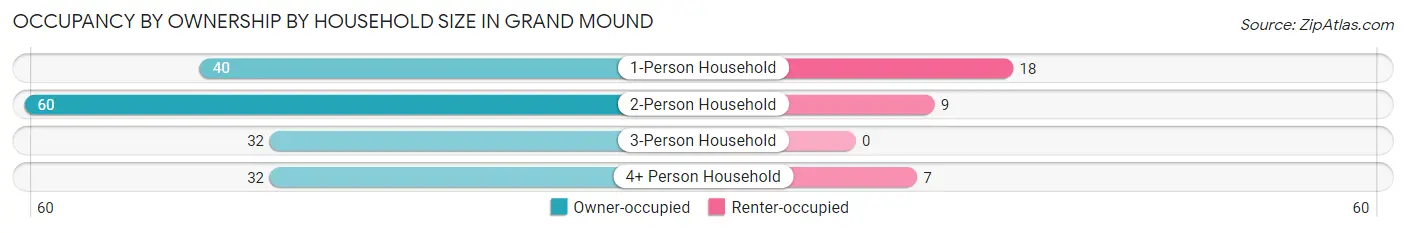
| Household Size | Owner-occupied | Renter-occupied |
| 1-Person Household | 40 (69.0%) | 18 (31.0%) |
| 2-Person Household | 60 (87.0%) | 9 (13.0%) |
| 3-Person Household | 32 (100.0%) | 0 (0.0%) |
| 4+ Person Household | 32 (82.1%) | 7 (17.9%) |
| Total Housing Units | 164 (82.8%) | 34 (17.2%) |
Occupancy by Educational Attainment in Grand Mound
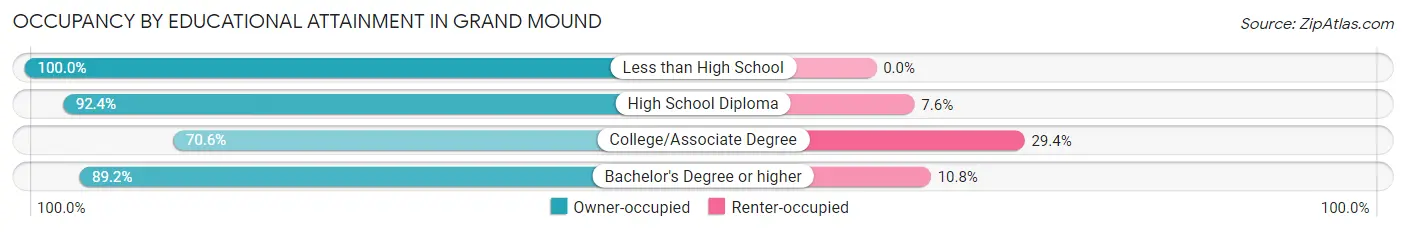
| Household Size | Owner-occupied | Renter-occupied |
| Less than High School | 10 (100.0%) | 0 (0.0%) |
| High School Diploma | 61 (92.4%) | 5 (7.6%) |
| College/Associate Degree | 60 (70.6%) | 25 (29.4%) |
| Bachelor's Degree or higher | 33 (89.2%) | 4 (10.8%) |
Occupancy by Age of Householder in Grand Mound
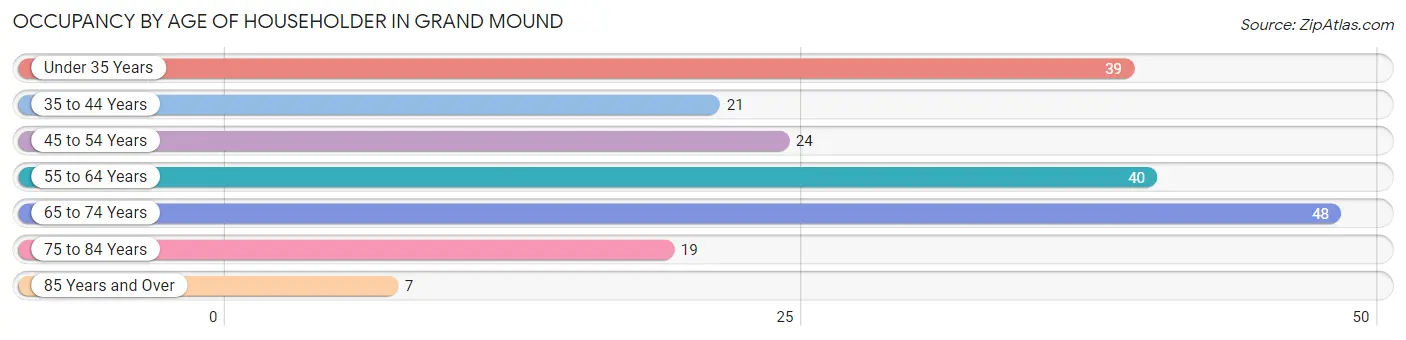
| Age Bracket | # Households | % Households |
| Under 35 Years | 39 | 19.7% |
| 35 to 44 Years | 21 | 10.6% |
| 45 to 54 Years | 24 | 12.1% |
| 55 to 64 Years | 40 | 20.2% |
| 65 to 74 Years | 48 | 24.2% |
| 75 to 84 Years | 19 | 9.6% |
| 85 Years and Over | 7 | 3.5% |
| Total | 198 | 100.0% |
Housing Finances in Grand Mound
Median Income by Occupancy in Grand Mound
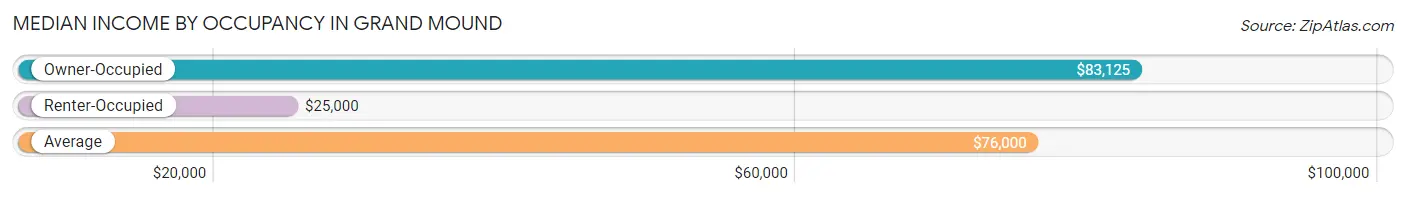
| Occupancy Type | # Households | Median Income |
| Owner-Occupied | 164 (82.8%) | $83,125 |
| Renter-Occupied | 34 (17.2%) | $25,000 |
| Average | 198 (100.0%) | $76,000 |
Occupancy by Householder Income Bracket in Grand Mound
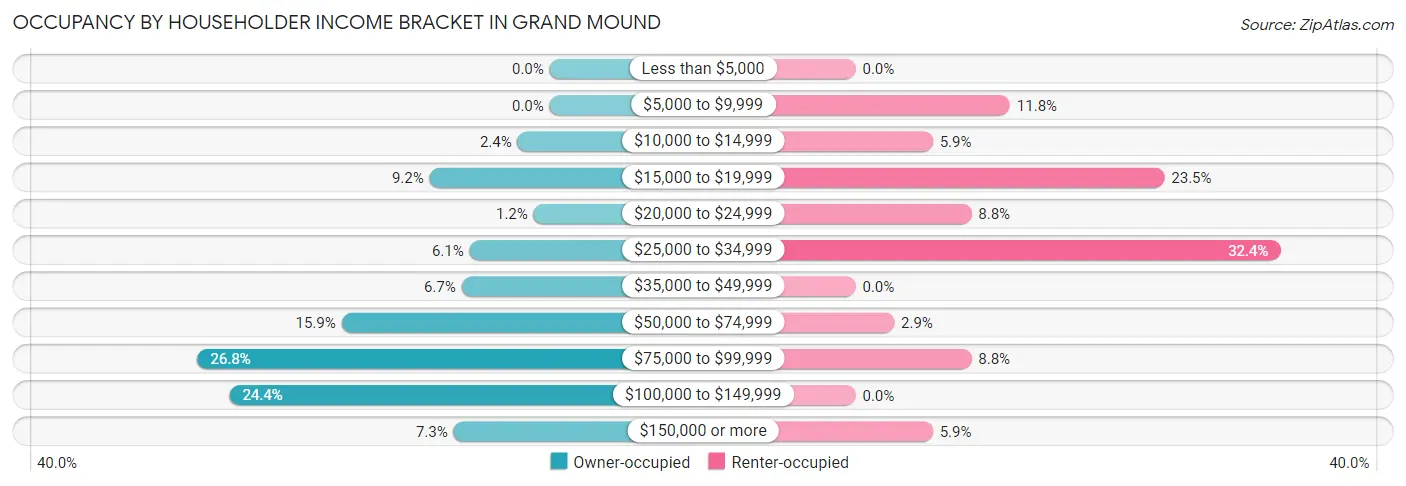
| Income Bracket | Owner-occupied | Renter-occupied |
| Less than $5,000 | 0 (0.0%) | 0 (0.0%) |
| $5,000 to $9,999 | 0 (0.0%) | 4 (11.8%) |
| $10,000 to $14,999 | 4 (2.4%) | 2 (5.9%) |
| $15,000 to $19,999 | 15 (9.1%) | 8 (23.5%) |
| $20,000 to $24,999 | 2 (1.2%) | 3 (8.8%) |
| $25,000 to $34,999 | 10 (6.1%) | 11 (32.4%) |
| $35,000 to $49,999 | 11 (6.7%) | 0 (0.0%) |
| $50,000 to $74,999 | 26 (15.9%) | 1 (2.9%) |
| $75,000 to $99,999 | 44 (26.8%) | 3 (8.8%) |
| $100,000 to $149,999 | 40 (24.4%) | 0 (0.0%) |
| $150,000 or more | 12 (7.3%) | 2 (5.9%) |
| Total | 164 (100.0%) | 34 (100.0%) |
Monthly Housing Cost Tiers in Grand Mound
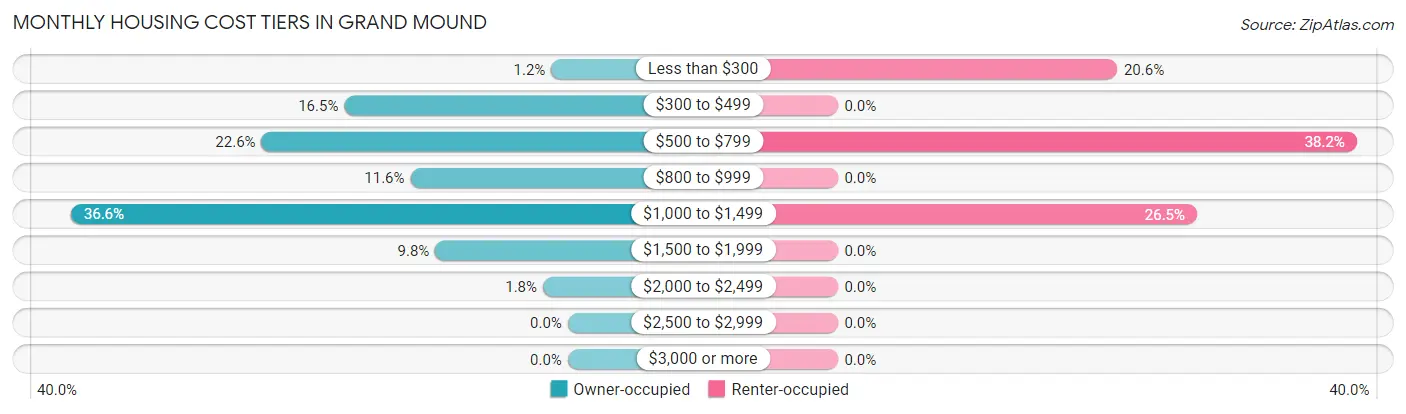
| Monthly Cost | Owner-occupied | Renter-occupied |
| Less than $300 | 2 (1.2%) | 7 (20.6%) |
| $300 to $499 | 27 (16.5%) | 0 (0.0%) |
| $500 to $799 | 37 (22.6%) | 13 (38.2%) |
| $800 to $999 | 19 (11.6%) | 0 (0.0%) |
| $1,000 to $1,499 | 60 (36.6%) | 9 (26.5%) |
| $1,500 to $1,999 | 16 (9.8%) | 0 (0.0%) |
| $2,000 to $2,499 | 3 (1.8%) | 0 (0.0%) |
| $2,500 to $2,999 | 0 (0.0%) | 0 (0.0%) |
| $3,000 or more | 0 (0.0%) | 0 (0.0%) |
| Total | 164 (100.0%) | 34 (100.0%) |
Physical Housing Characteristics in Grand Mound
Housing Structures in Grand Mound
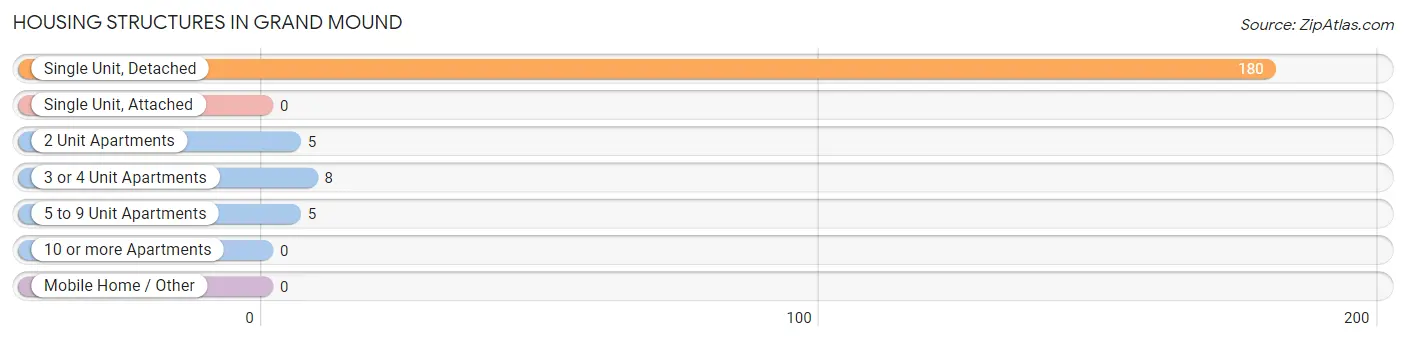
| Structure Type | # Housing Units | % Housing Units |
| Single Unit, Detached | 180 | 90.9% |
| Single Unit, Attached | 0 | 0.0% |
| 2 Unit Apartments | 5 | 2.5% |
| 3 or 4 Unit Apartments | 8 | 4.0% |
| 5 to 9 Unit Apartments | 5 | 2.5% |
| 10 or more Apartments | 0 | 0.0% |
| Mobile Home / Other | 0 | 0.0% |
| Total | 198 | 100.0% |
Housing Structures by Occupancy in Grand Mound
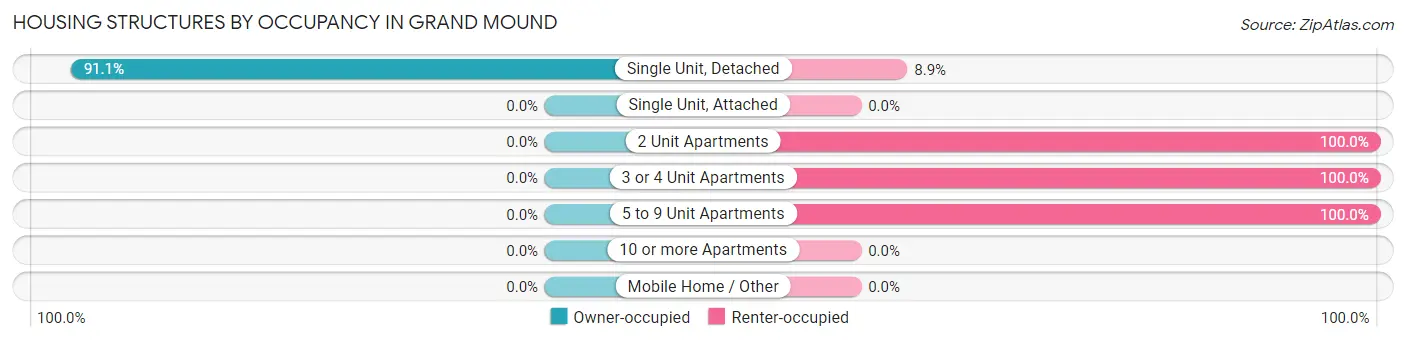
| Structure Type | Owner-occupied | Renter-occupied |
| Single Unit, Detached | 164 (91.1%) | 16 (8.9%) |
| Single Unit, Attached | 0 (0.0%) | 0 (0.0%) |
| 2 Unit Apartments | 0 (0.0%) | 5 (100.0%) |
| 3 or 4 Unit Apartments | 0 (0.0%) | 8 (100.0%) |
| 5 to 9 Unit Apartments | 0 (0.0%) | 5 (100.0%) |
| 10 or more Apartments | 0 (0.0%) | 0 (0.0%) |
| Mobile Home / Other | 0 (0.0%) | 0 (0.0%) |
| Total | 164 (82.8%) | 34 (17.2%) |
Housing Structures by Number of Rooms in Grand Mound
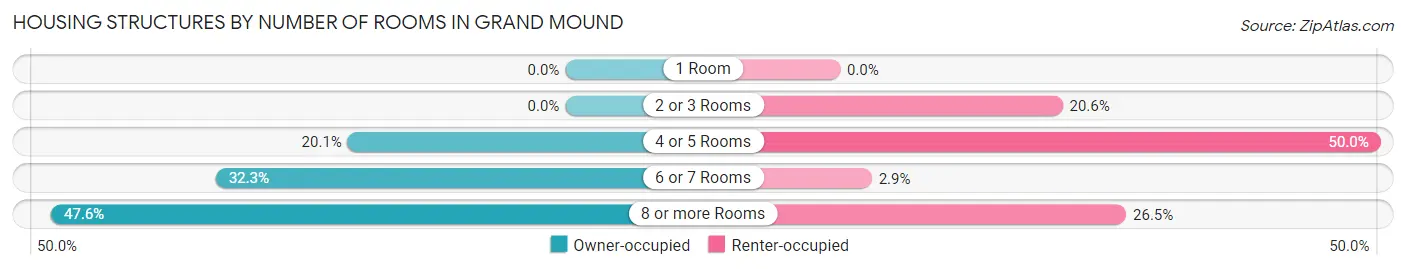
| Number of Rooms | Owner-occupied | Renter-occupied |
| 1 Room | 0 (0.0%) | 0 (0.0%) |
| 2 or 3 Rooms | 0 (0.0%) | 7 (20.6%) |
| 4 or 5 Rooms | 33 (20.1%) | 17 (50.0%) |
| 6 or 7 Rooms | 53 (32.3%) | 1 (2.9%) |
| 8 or more Rooms | 78 (47.6%) | 9 (26.5%) |
| Total | 164 (100.0%) | 34 (100.0%) |
Housing Structure by Heating Type in Grand Mound
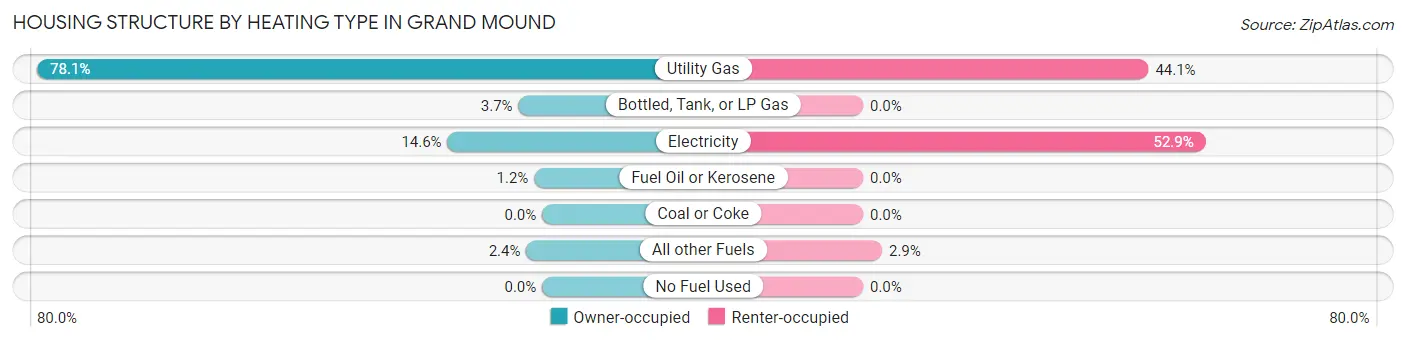
| Heating Type | Owner-occupied | Renter-occupied |
| Utility Gas | 128 (78.0%) | 15 (44.1%) |
| Bottled, Tank, or LP Gas | 6 (3.7%) | 0 (0.0%) |
| Electricity | 24 (14.6%) | 18 (52.9%) |
| Fuel Oil or Kerosene | 2 (1.2%) | 0 (0.0%) |
| Coal or Coke | 0 (0.0%) | 0 (0.0%) |
| All other Fuels | 4 (2.4%) | 1 (2.9%) |
| No Fuel Used | 0 (0.0%) | 0 (0.0%) |
| Total | 164 (100.0%) | 34 (100.0%) |
Household Vehicle Usage in Grand Mound
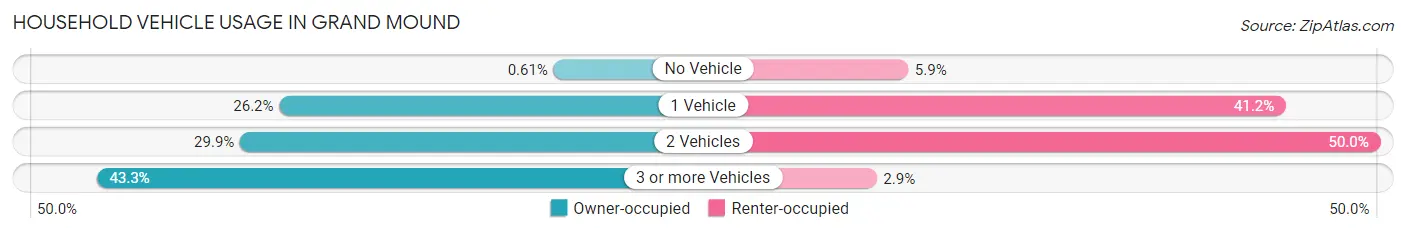
| Vehicles per Household | Owner-occupied | Renter-occupied |
| No Vehicle | 1 (0.6%) | 2 (5.9%) |
| 1 Vehicle | 43 (26.2%) | 14 (41.2%) |
| 2 Vehicles | 49 (29.9%) | 17 (50.0%) |
| 3 or more Vehicles | 71 (43.3%) | 1 (2.9%) |
| Total | 164 (100.0%) | 34 (100.0%) |
Real Estate & Mortgages in Grand Mound
Real Estate and Mortgage Overview in Grand Mound
| Characteristic | Without Mortgage | With Mortgage |
| Housing Units | 68 | 96 |
| Median Property Value | $146,200 | $147,500 |
| Median Household Income | $59,792 | $8 |
| Monthly Housing Costs | $556 | $0 |
| Real Estate Taxes | $1,923 | $0 |
Property Value by Mortgage Status in Grand Mound
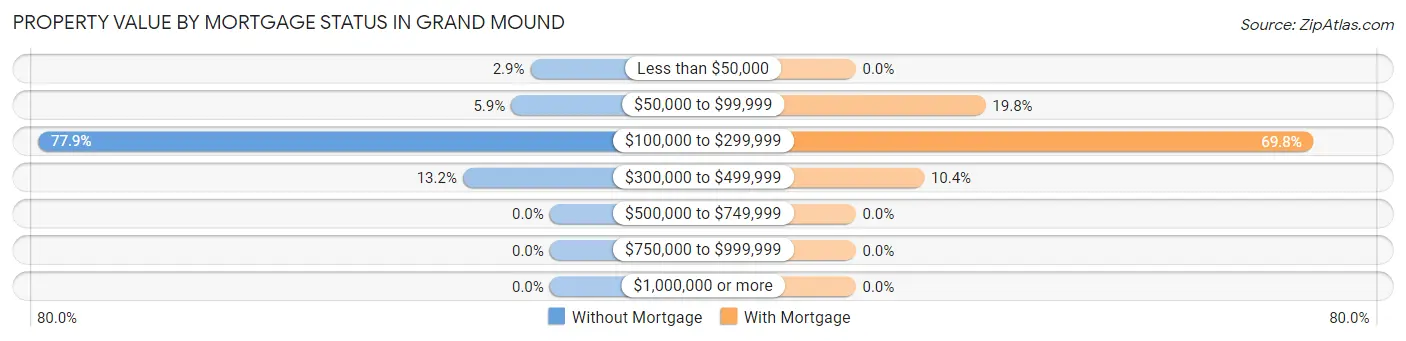
| Property Value | Without Mortgage | With Mortgage |
| Less than $50,000 | 2 (2.9%) | 0 (0.0%) |
| $50,000 to $99,999 | 4 (5.9%) | 19 (19.8%) |
| $100,000 to $299,999 | 53 (77.9%) | 67 (69.8%) |
| $300,000 to $499,999 | 9 (13.2%) | 10 (10.4%) |
| $500,000 to $749,999 | 0 (0.0%) | 0 (0.0%) |
| $750,000 to $999,999 | 0 (0.0%) | 0 (0.0%) |
| $1,000,000 or more | 0 (0.0%) | 0 (0.0%) |
| Total | 68 (100.0%) | 96 (100.0%) |
Household Income by Mortgage Status in Grand Mound
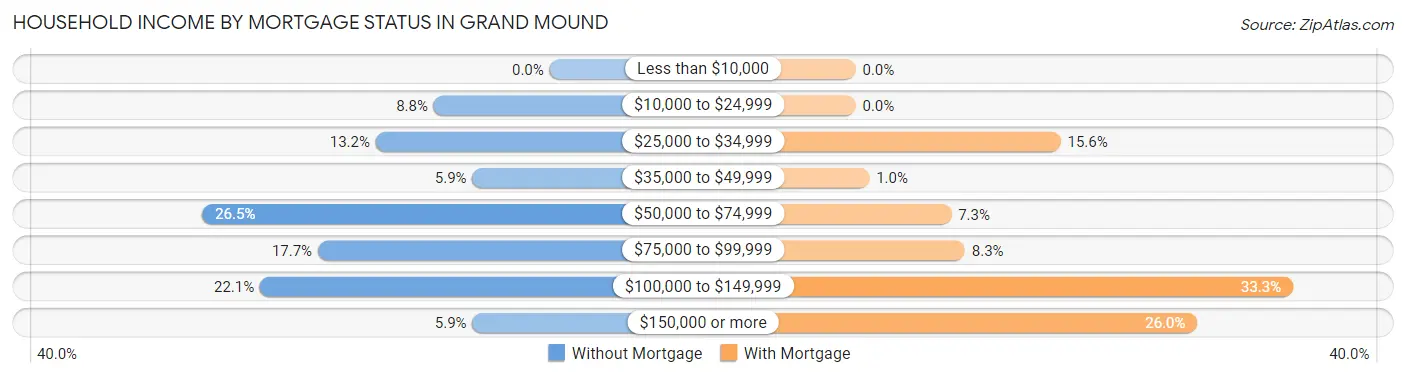
| Household Income | Without Mortgage | With Mortgage |
| Less than $10,000 | 0 (0.0%) | 0 (0.0%) |
| $10,000 to $24,999 | 6 (8.8%) | 0 (0.0%) |
| $25,000 to $34,999 | 9 (13.2%) | 15 (15.6%) |
| $35,000 to $49,999 | 4 (5.9%) | 1 (1.0%) |
| $50,000 to $74,999 | 18 (26.5%) | 7 (7.3%) |
| $75,000 to $99,999 | 12 (17.6%) | 8 (8.3%) |
| $100,000 to $149,999 | 15 (22.1%) | 32 (33.3%) |
| $150,000 or more | 4 (5.9%) | 25 (26.0%) |
| Total | 68 (100.0%) | 96 (100.0%) |
Property Value to Household Income Ratio in Grand Mound
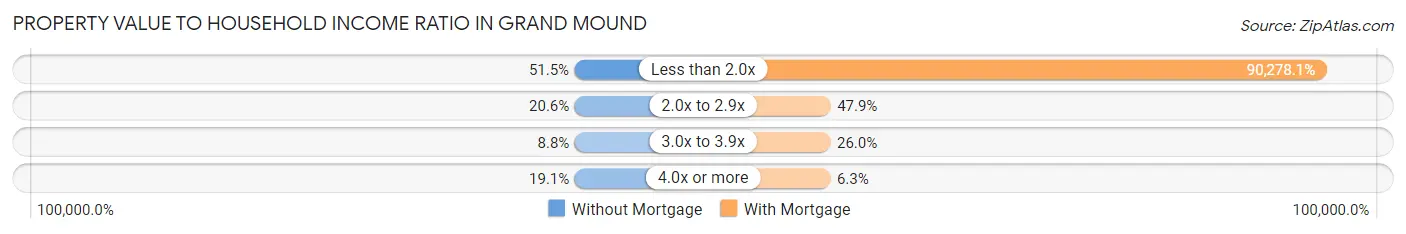
| Value-to-Income Ratio | Without Mortgage | With Mortgage |
| Less than 2.0x | 35 (51.5%) | 86,667 (90,278.1%) |
| 2.0x to 2.9x | 14 (20.6%) | 46 (47.9%) |
| 3.0x to 3.9x | 6 (8.8%) | 25 (26.0%) |
| 4.0x or more | 13 (19.1%) | 6 (6.2%) |
| Total | 68 (100.0%) | 96 (100.0%) |
Real Estate Taxes by Mortgage Status in Grand Mound
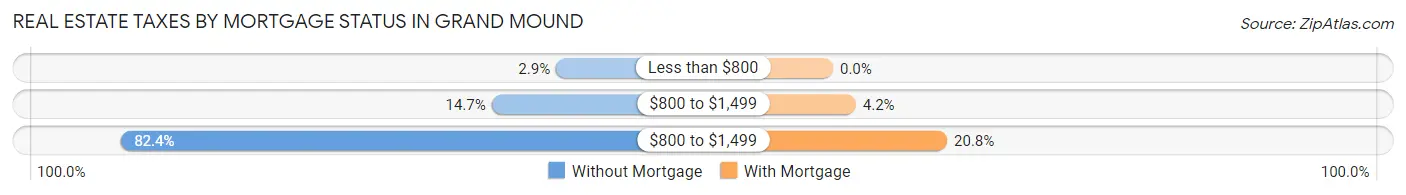
| Property Taxes | Without Mortgage | With Mortgage |
| Less than $800 | 2 (2.9%) | 0 (0.0%) |
| $800 to $1,499 | 10 (14.7%) | 4 (4.2%) |
| $800 to $1,499 | 56 (82.4%) | 20 (20.8%) |
| Total | 68 (100.0%) | 96 (100.0%) |
Health & Disability in Grand Mound
Health Insurance Coverage by Age in Grand Mound
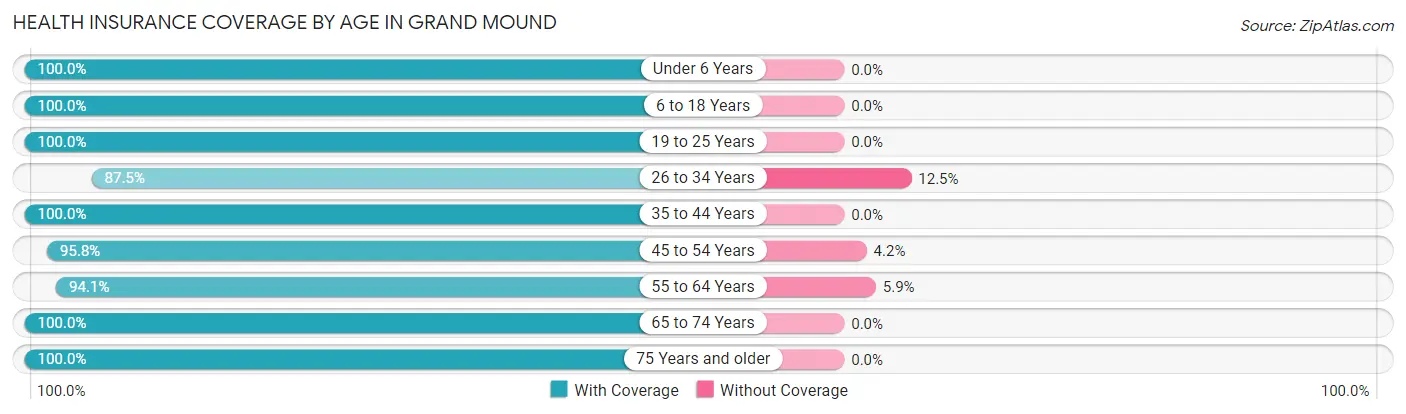
| Age Bracket | With Coverage | Without Coverage |
| Under 6 Years | 55 (100.0%) | 0 (0.0%) |
| 6 to 18 Years | 71 (100.0%) | 0 (0.0%) |
| 19 to 25 Years | 43 (100.0%) | 0 (0.0%) |
| 26 to 34 Years | 63 (87.5%) | 9 (12.5%) |
| 35 to 44 Years | 30 (100.0%) | 0 (0.0%) |
| 45 to 54 Years | 46 (95.8%) | 2 (4.2%) |
| 55 to 64 Years | 64 (94.1%) | 4 (5.9%) |
| 65 to 74 Years | 75 (100.0%) | 0 (0.0%) |
| 75 Years and older | 39 (100.0%) | 0 (0.0%) |
| Total | 486 (97.0%) | 15 (3.0%) |
Health Insurance Coverage by Citizenship Status in Grand Mound
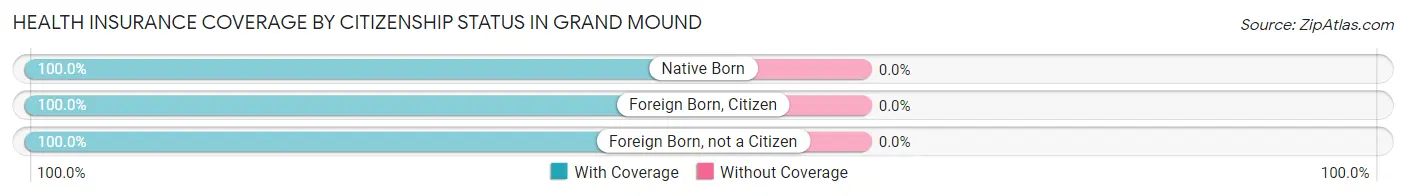
| Citizenship Status | With Coverage | Without Coverage |
| Native Born | 55 (100.0%) | 0 (0.0%) |
| Foreign Born, Citizen | 71 (100.0%) | 0 (0.0%) |
| Foreign Born, not a Citizen | 43 (100.0%) | 0 (0.0%) |
Health Insurance Coverage by Household Income in Grand Mound
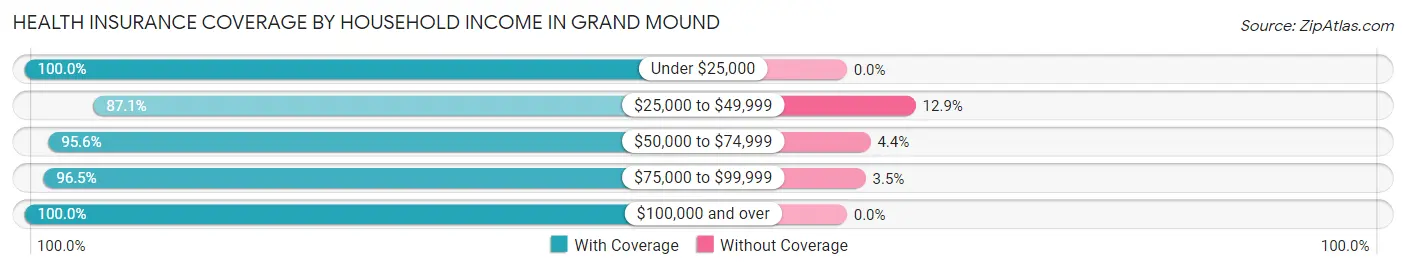
| Household Income | With Coverage | Without Coverage |
| Under $25,000 | 74 (100.0%) | 0 (0.0%) |
| $25,000 to $49,999 | 54 (87.1%) | 8 (12.9%) |
| $50,000 to $74,999 | 43 (95.6%) | 2 (4.4%) |
| $75,000 to $99,999 | 137 (96.5%) | 5 (3.5%) |
| $100,000 and over | 178 (100.0%) | 0 (0.0%) |
Public vs Private Health Insurance Coverage by Age in Grand Mound
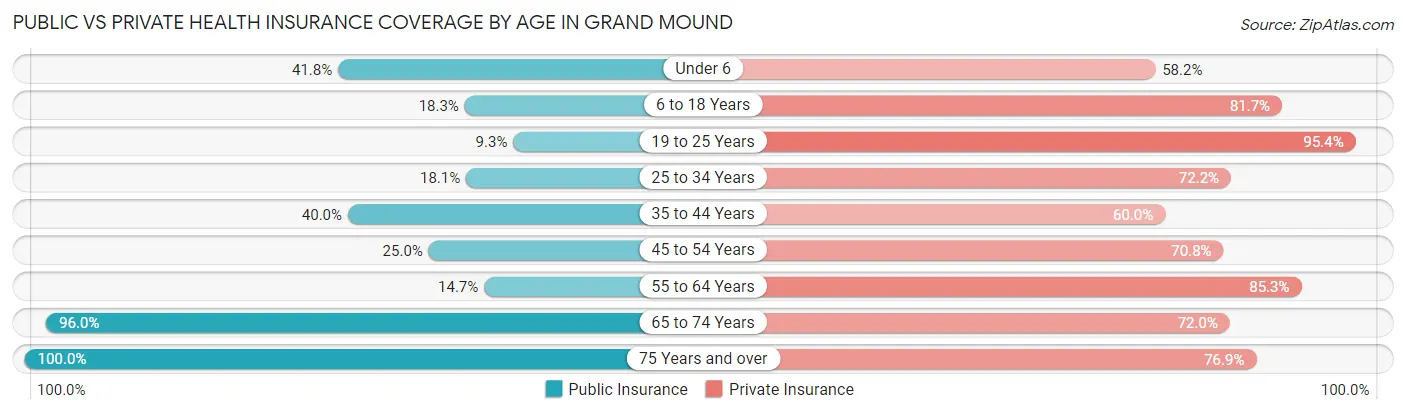
| Age Bracket | Public Insurance | Private Insurance |
| Under 6 | 23 (41.8%) | 32 (58.2%) |
| 6 to 18 Years | 13 (18.3%) | 58 (81.7%) |
| 19 to 25 Years | 4 (9.3%) | 41 (95.4%) |
| 25 to 34 Years | 13 (18.1%) | 52 (72.2%) |
| 35 to 44 Years | 12 (40.0%) | 18 (60.0%) |
| 45 to 54 Years | 12 (25.0%) | 34 (70.8%) |
| 55 to 64 Years | 10 (14.7%) | 58 (85.3%) |
| 65 to 74 Years | 72 (96.0%) | 54 (72.0%) |
| 75 Years and over | 39 (100.0%) | 30 (76.9%) |
| Total | 198 (39.5%) | 377 (75.2%) |
Disability Status by Sex by Age in Grand Mound
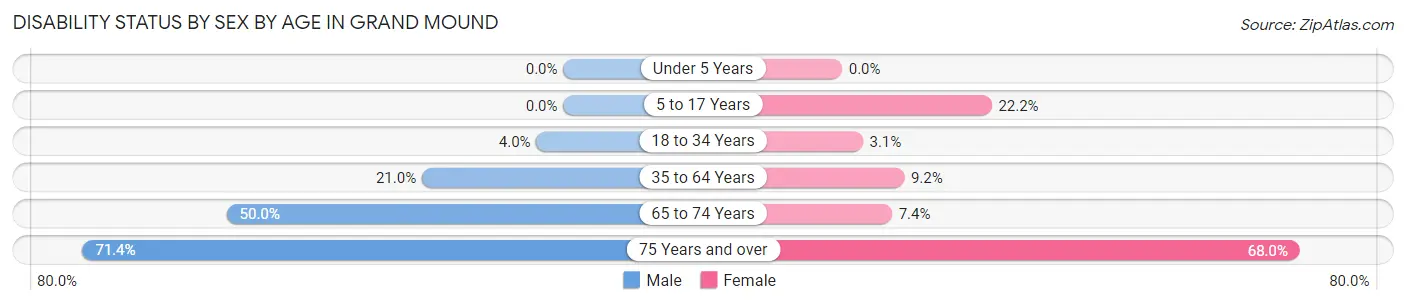
| Age Bracket | Male | Female |
| Under 5 Years | 0 (0.0%) | 0 (0.0%) |
| 5 to 17 Years | 0 (0.0%) | 8 (22.2%) |
| 18 to 34 Years | 2 (4.0%) | 2 (3.1%) |
| 35 to 64 Years | 17 (21.0%) | 6 (9.2%) |
| 65 to 74 Years | 24 (50.0%) | 2 (7.4%) |
| 75 Years and over | 10 (71.4%) | 17 (68.0%) |
Disability Class by Sex by Age in Grand Mound
Disability Class: Hearing Difficulty
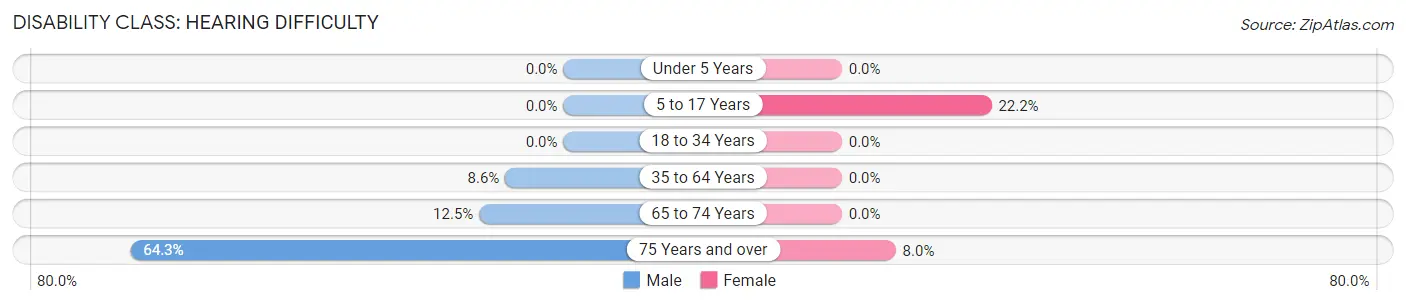
| Age Bracket | Male | Female |
| Under 5 Years | 0 (0.0%) | 0 (0.0%) |
| 5 to 17 Years | 0 (0.0%) | 8 (22.2%) |
| 18 to 34 Years | 0 (0.0%) | 0 (0.0%) |
| 35 to 64 Years | 7 (8.6%) | 0 (0.0%) |
| 65 to 74 Years | 6 (12.5%) | 0 (0.0%) |
| 75 Years and over | 9 (64.3%) | 2 (8.0%) |
Disability Class: Vision Difficulty
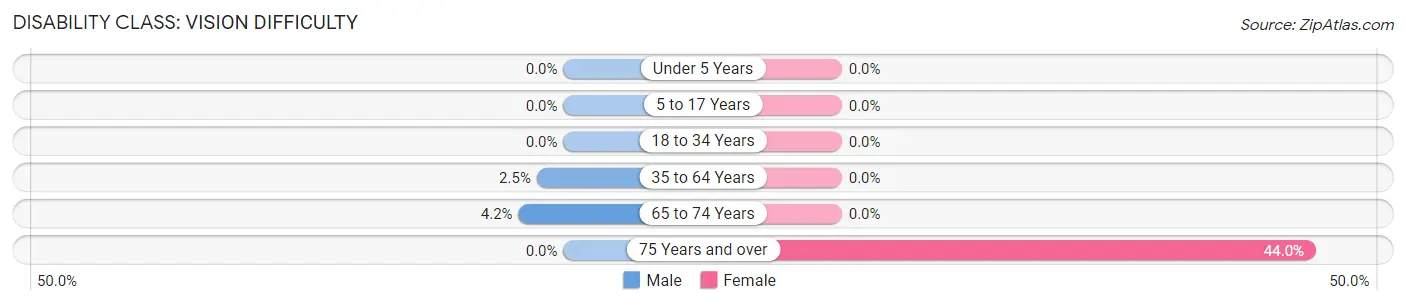
| Age Bracket | Male | Female |
| Under 5 Years | 0 (0.0%) | 0 (0.0%) |
| 5 to 17 Years | 0 (0.0%) | 0 (0.0%) |
| 18 to 34 Years | 0 (0.0%) | 0 (0.0%) |
| 35 to 64 Years | 2 (2.5%) | 0 (0.0%) |
| 65 to 74 Years | 2 (4.2%) | 0 (0.0%) |
| 75 Years and over | 0 (0.0%) | 11 (44.0%) |
Disability Class: Cognitive Difficulty
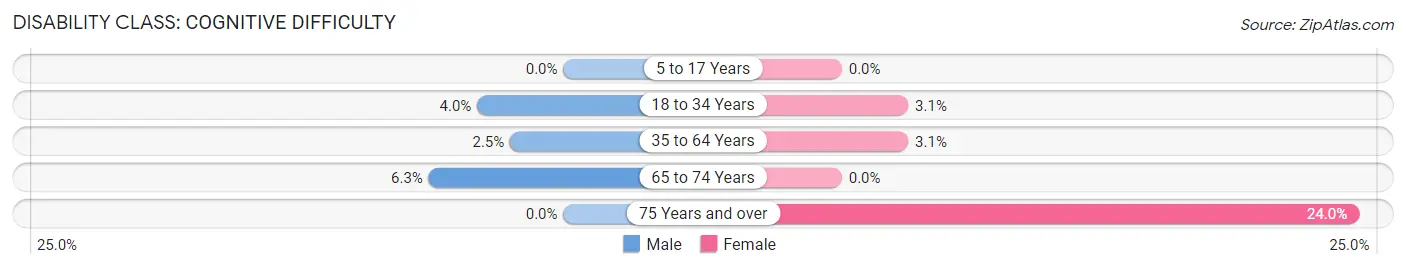
| Age Bracket | Male | Female |
| 5 to 17 Years | 0 (0.0%) | 0 (0.0%) |
| 18 to 34 Years | 2 (4.0%) | 2 (3.1%) |
| 35 to 64 Years | 2 (2.5%) | 2 (3.1%) |
| 65 to 74 Years | 3 (6.2%) | 0 (0.0%) |
| 75 Years and over | 0 (0.0%) | 6 (24.0%) |
Disability Class: Ambulatory Difficulty
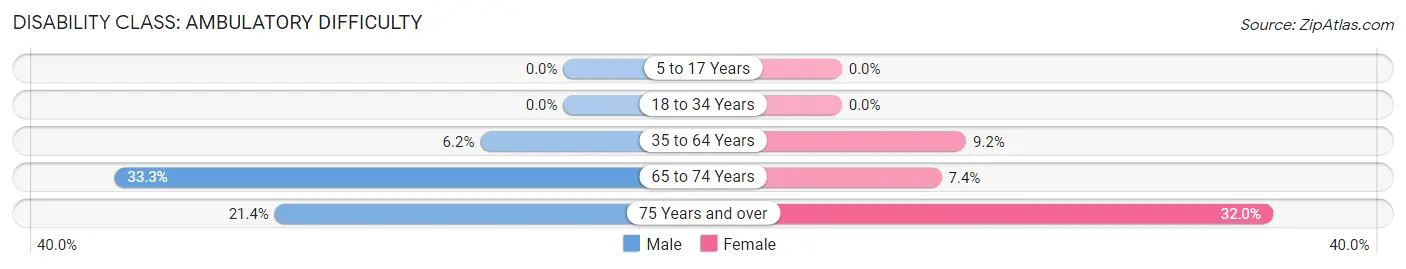
| Age Bracket | Male | Female |
| 5 to 17 Years | 0 (0.0%) | 0 (0.0%) |
| 18 to 34 Years | 0 (0.0%) | 0 (0.0%) |
| 35 to 64 Years | 5 (6.2%) | 6 (9.2%) |
| 65 to 74 Years | 16 (33.3%) | 2 (7.4%) |
| 75 Years and over | 3 (21.4%) | 8 (32.0%) |
Disability Class: Self-Care Difficulty
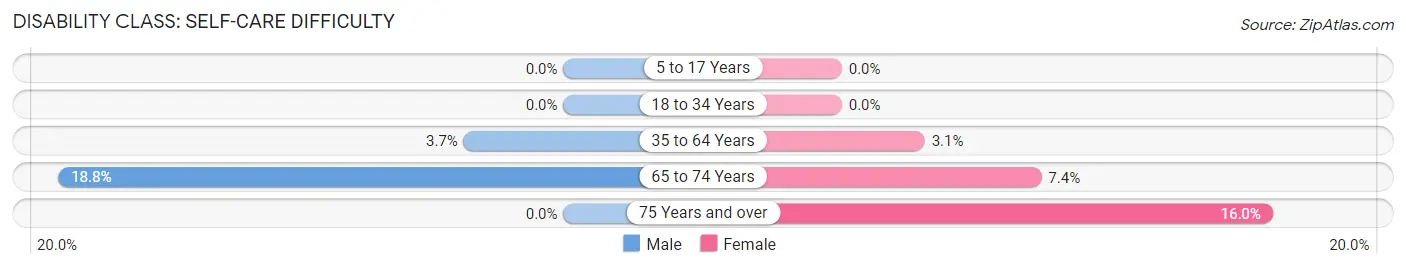
| Age Bracket | Male | Female |
| 5 to 17 Years | 0 (0.0%) | 0 (0.0%) |
| 18 to 34 Years | 0 (0.0%) | 0 (0.0%) |
| 35 to 64 Years | 3 (3.7%) | 2 (3.1%) |
| 65 to 74 Years | 9 (18.8%) | 2 (7.4%) |
| 75 Years and over | 0 (0.0%) | 4 (16.0%) |
Technology Access in Grand Mound
Computing Device Access in Grand Mound
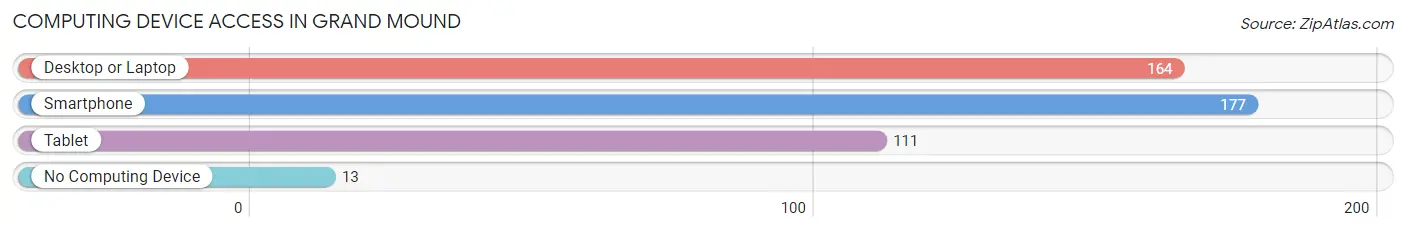
| Device Type | # Households | % Households |
| Desktop or Laptop | 164 | 82.8% |
| Smartphone | 177 | 89.4% |
| Tablet | 111 | 56.1% |
| No Computing Device | 13 | 6.6% |
| Total | 198 | 100.0% |
Internet Access in Grand Mound
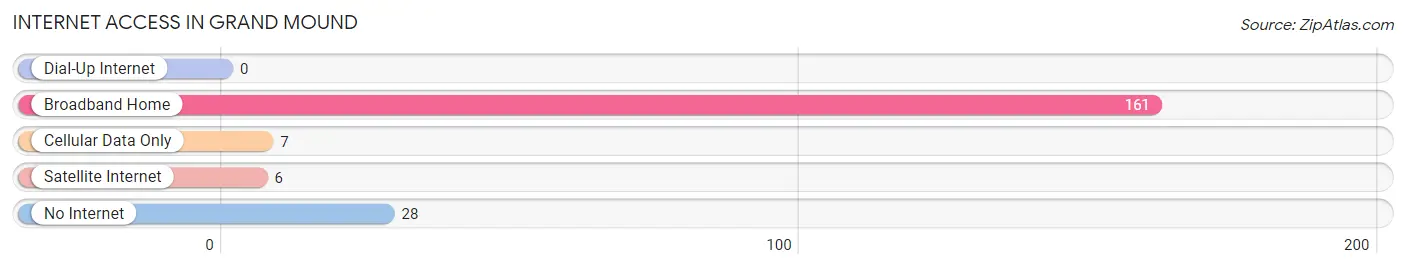
| Internet Type | # Households | % Households |
| Dial-Up Internet | 0 | 0.0% |
| Broadband Home | 161 | 81.3% |
| Cellular Data Only | 7 | 3.5% |
| Satellite Internet | 6 | 3.0% |
| No Internet | 28 | 14.1% |
| Total | 198 | 100.0% |
Grand Mound Summary
Grand Mound is a small unincorporated community located in Clinton County, Iowa, United States. It is situated along the banks of the Wapsipinicon River, approximately 10 miles south of the city of Clinton. The population of Grand Mound was estimated to be around 200 people in 2020.
History
Grand Mound was first settled in the early 1840s by a group of settlers from New York. The town was originally known as “Grand Mound” due to the large mound of earth that was located near the center of the town. The mound was believed to have been created by Native Americans hundreds of years prior.
The town was officially platted in 1854 and the first post office was established in 1855. The town was named after the nearby mound and was originally intended to be a trading post for the local Native American tribes.
In the late 1800s, Grand Mound was a thriving community with a population of over 500 people. The town had several stores, a hotel, a blacksmith shop, a sawmill, a grist mill, and a school.
Geography
Grand Mound is located in the eastern part of Clinton County, Iowa. It is situated along the banks of the Wapsipinicon River, approximately 10 miles south of the city of Clinton. The town is located in a rural area and is surrounded by farmland.
The terrain of the area is mostly flat with some rolling hills. The climate is humid continental, with hot summers and cold winters. The average annual temperature is around 50 degrees Fahrenheit.
Economy
The economy of Grand Mound is largely based on agriculture. The town is surrounded by farmland and many of the residents are employed in the agricultural industry. Other industries in the area include manufacturing, retail, and tourism.
The town is home to several small businesses, including a grocery store, a hardware store, and a restaurant. There are also several churches in the area.
Demographics
The population of Grand Mound was estimated to be around 200 people in 2020. The racial makeup of the town is predominantly white, with a small percentage of African Americans and Native Americans. The median household income is around $45,000.
The town is served by the Grand Mound Community School District, which includes a K-12 school. The town also has a public library and a post office.
Conclusion
Grand Mound is a small unincorporated community located in Clinton County, Iowa. It is situated along the banks of the Wapsipinicon River, approximately 10 miles south of the city of Clinton. The population of Grand Mound was estimated to be around 200 people in 2020. The town is largely agricultural, with many of the residents employed in the agricultural industry. Other industries in the area include manufacturing, retail, and tourism. The town is served by the Grand Mound Community School District, which includes a K-12 school. The town also has a public library and a post office.
Common Questions
What is Per Capita Income in Grand Mound?
Per Capita income in Grand Mound is $30,791.
What is the Median Family Income in Grand Mound?
Median Family Income in Grand Mound is $87,000.
What is the Median Household income in Grand Mound?
Median Household Income in Grand Mound is $76,000.
What is Income or Wage Gap in Grand Mound?
Income or Wage Gap in Grand Mound is 45.3%.
Women in Grand Mound earn 54.7 cents for every dollar earned by a man.
What is Inequality or Gini Index in Grand Mound?
Inequality or Gini Index in Grand Mound is 0.36.
What is the Total Population of Grand Mound?
Total Population of Grand Mound is 501.
What is the Total Male Population of Grand Mound?
Total Male Population of Grand Mound is 248.
What is the Total Female Population of Grand Mound?
Total Female Population of Grand Mound is 253.
What is the Ratio of Males per 100 Females in Grand Mound?
There are 98.02 Males per 100 Females in Grand Mound.
What is the Ratio of Females per 100 Males in Grand Mound?
There are 102.02 Females per 100 Males in Grand Mound.
What is the Median Population Age in Grand Mound?
Median Population Age in Grand Mound is 37.1 Years.
What is the Average Family Size in Grand Mound
Average Family Size in Grand Mound is 3.1 People.
What is the Average Household Size in Grand Mound
Average Household Size in Grand Mound is 2.5 People.
How Large is the Labor Force in Grand Mound?
There are 235 People in the Labor Forcein in Grand Mound.
What is the Percentage of People in the Labor Force in Grand Mound?
61.8% of People are in the Labor Force in Grand Mound.
What is the Unemployment Rate in Grand Mound?
Unemployment Rate in Grand Mound is 3.8%.