Zip Codes with the Highest Percentage of Population Employed in Office & Administration in Delaware
RELATED REPORTS & OPTIONS
Office & Administration
Delaware
Compare Zip Codes
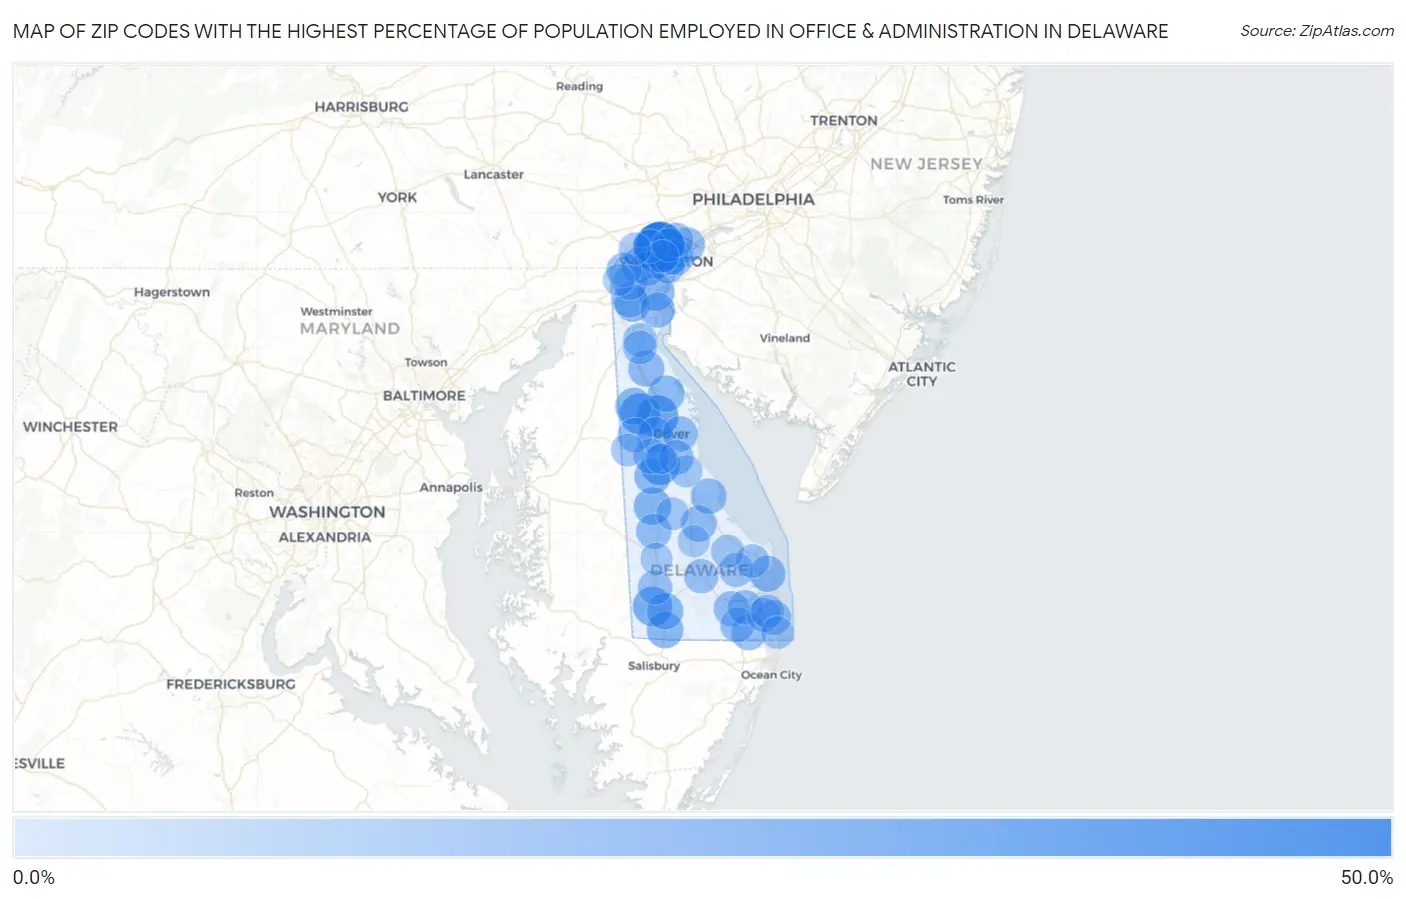
Map of Zip Codes with the Highest Percentage of Population Employed in Office & Administration in Delaware
0.0%
50.0%
Zip Codes with the Highest Percentage of Population Employed in Office & Administration in Delaware
| Zip Code | % Employed | vs State | vs National | |
| 1. | 19710 | 47.1% | 11.4%(+35.7)#1 | 10.9%(+36.2)#168 |
| 2. | 19732 | 40.3% | 11.4%(+28.9)#2 | 10.9%(+29.4)#259 |
| 3. | 19936 | 28.0% | 11.4%(+16.7)#3 | 10.9%(+17.2)#687 |
| 4. | 19955 | 26.0% | 11.4%(+14.6)#4 | 10.9%(+15.2)#832 |
| 5. | 19979 | 23.5% | 11.4%(+12.1)#5 | 10.9%(+12.6)#1,091 |
| 6. | 19931 | 21.8% | 11.4%(+10.5)#6 | 10.9%(+11.0)#1,334 |
| 7. | 19952 | 17.2% | 11.4%(+5.78)#7 | 10.9%(+6.30)#2,769 |
| 8. | 19938 | 15.9% | 11.4%(+4.48)#8 | 10.9%(+5.00)#3,681 |
| 9. | 19940 | 15.4% | 11.4%(+3.97)#9 | 10.9%(+4.50)#4,143 |
| 10. | 19956 | 15.2% | 11.4%(+3.78)#10 | 10.9%(+4.31)#4,361 |
| 11. | 19977 | 15.1% | 11.4%(+3.74)#11 | 10.9%(+4.26)#4,420 |
| 12. | 19720 | 14.5% | 11.4%(+3.09)#12 | 10.9%(+3.62)#5,283 |
| 13. | 19943 | 14.5% | 11.4%(+3.08)#13 | 10.9%(+3.61)#5,301 |
| 14. | 19734 | 14.1% | 11.4%(+2.75)#14 | 10.9%(+3.27)#5,809 |
| 15. | 19971 | 13.6% | 11.4%(+2.22)#15 | 10.9%(+2.74)#6,721 |
| 16. | 19904 | 13.4% | 11.4%(+1.99)#16 | 10.9%(+2.52)#7,202 |
| 17. | 19960 | 13.2% | 11.4%(+1.77)#17 | 10.9%(+2.30)#7,690 |
| 18. | 19701 | 13.1% | 11.4%(+1.74)#18 | 10.9%(+2.27)#7,768 |
| 19. | 19963 | 13.1% | 11.4%(+1.69)#19 | 10.9%(+2.21)#7,914 |
| 20. | 19975 | 12.5% | 11.4%(+1.09)#20 | 10.9%(+1.62)#9,371 |
| 21. | 19805 | 12.4% | 11.4%(+1.02)#21 | 10.9%(+1.55)#9,554 |
| 22. | 19934 | 12.2% | 11.4%(+0.824)#22 | 10.9%(+1.35)#10,128 |
| 23. | 19702 | 12.2% | 11.4%(+0.822)#23 | 10.9%(+1.35)#10,134 |
| 24. | 19950 | 12.1% | 11.4%(+0.763)#24 | 10.9%(+1.29)#10,306 |
| 25. | 19901 | 11.9% | 11.4%(+0.520)#25 | 10.9%(+1.04)#11,060 |
| 26. | 19808 | 11.9% | 11.4%(+0.498)#26 | 10.9%(+1.02)#11,115 |
| 27. | 19809 | 11.9% | 11.4%(+0.471)#27 | 10.9%(+0.996)#11,186 |
| 28. | 19966 | 11.6% | 11.4%(+0.238)#28 | 10.9%(+0.763)#11,876 |
| 29. | 19706 | 11.6% | 11.4%(+0.187)#29 | 10.9%(+0.712)#12,048 |
| 30. | 19703 | 11.5% | 11.4%(+0.157)#30 | 10.9%(+0.682)#12,161 |
| 31. | 19713 | 11.5% | 11.4%(+0.137)#31 | 10.9%(+0.662)#12,200 |
| 32. | 19930 | 11.2% | 11.4%(-0.212)#32 | 10.9%(+0.313)#13,302 |
| 33. | 19962 | 11.1% | 11.4%(-0.317)#33 | 10.9%(+0.208)#13,645 |
| 34. | 19804 | 10.8% | 11.4%(-0.575)#34 | 10.9%(-0.050)#14,493 |
| 35. | 19945 | 10.5% | 11.4%(-0.905)#35 | 10.9%(-0.380)#15,560 |
| 36. | 19939 | 10.5% | 11.4%(-0.929)#36 | 10.9%(-0.404)#15,660 |
| 37. | 19953 | 10.4% | 11.4%(-0.949)#37 | 10.9%(-0.424)#15,709 |
| 38. | 19801 | 10.4% | 11.4%(-0.953)#38 | 10.9%(-0.428)#15,719 |
| 39. | 19711 | 10.3% | 11.4%(-1.13)#39 | 10.9%(-0.600)#16,311 |
| 40. | 19973 | 10.1% | 11.4%(-1.27)#40 | 10.9%(-0.748)#16,767 |
| 41. | 19802 | 9.9% | 11.4%(-1.47)#41 | 10.9%(-0.941)#17,392 |
| 42. | 19810 | 9.8% | 11.4%(-1.53)#42 | 10.9%(-1.01)#17,618 |
| 43. | 19947 | 9.5% | 11.4%(-1.85)#43 | 10.9%(-1.32)#18,623 |
| 44. | 19967 | 9.2% | 11.4%(-2.21)#44 | 10.9%(-1.68)#19,736 |
| 45. | 19951 | 9.1% | 11.4%(-2.28)#45 | 10.9%(-1.76)#19,943 |
| 46. | 19709 | 8.5% | 11.4%(-2.84)#46 | 10.9%(-2.31)#21,563 |
| 47. | 19730 | 8.4% | 11.4%(-2.98)#47 | 10.9%(-2.46)#21,962 |
| 48. | 19807 | 8.2% | 11.4%(-3.17)#48 | 10.9%(-2.64)#22,495 |
| 49. | 19958 | 8.1% | 11.4%(-3.24)#49 | 10.9%(-2.71)#22,676 |
| 50. | 19970 | 7.8% | 11.4%(-3.55)#50 | 10.9%(-3.02)#23,410 |
| 51. | 19803 | 7.3% | 11.4%(-4.10)#51 | 10.9%(-3.58)#24,650 |
| 52. | 19968 | 7.0% | 11.4%(-4.43)#52 | 10.9%(-3.91)#25,305 |
| 53. | 19944 | 6.1% | 11.4%(-5.28)#53 | 10.9%(-4.76)#26,702 |
| 54. | 19964 | 6.1% | 11.4%(-5.30)#54 | 10.9%(-4.77)#26,724 |
| 55. | 19954 | 5.9% | 11.4%(-5.52)#55 | 10.9%(-4.99)#27,046 |
| 56. | 19806 | 5.8% | 11.4%(-5.62)#56 | 10.9%(-5.10)#27,201 |
| 57. | 19707 | 5.5% | 11.4%(-5.84)#57 | 10.9%(-5.32)#27,490 |
| 58. | 19946 | 5.2% | 11.4%(-6.22)#58 | 10.9%(-5.69)#27,942 |
| 59. | 19933 | 4.6% | 11.4%(-6.78)#59 | 10.9%(-6.25)#28,466 |
| 60. | 19941 | 3.8% | 11.4%(-7.57)#60 | 10.9%(-7.04)#29,163 |
| 61. | 19717 | 3.6% | 11.4%(-7.83)#61 | 10.9%(-7.30)#29,328 |
| 62. | 19980 | 1.0% | 11.4%(-10.3)#62 | 10.9%(-9.81)#30,371 |
1
Common Questions
What are the Top 10 Zip Codes with the Highest Percentage of Population Employed in Office & Administration in Delaware?
Top 10 Zip Codes with the Highest Percentage of Population Employed in Office & Administration in Delaware are:
What zip code has the Highest Percentage of Population Employed in Office & Administration in Delaware?
19710 has the Highest Percentage of Population Employed in Office & Administration in Delaware with 47.1%.
What is the Percentage of Population Employed in Office & Administration in the State of Delaware?
Percentage of Population Employed in Office & Administration in Delaware is 11.4%.
What is the Percentage of Population Employed in Office & Administration in the United States?
Percentage of Population Employed in Office & Administration in the United States is 10.9%.