El Jebel, CO Map & Demographics
El Jebel Map
El Jebel Overview
$72,769
PER CAPITA INCOME
$123,810
AVG FAMILY INCOME
$120,278
AVG HOUSEHOLD INCOME
55.5%
WAGE / INCOME GAP [ % ]
44.5¢/ $1
WAGE / INCOME GAP [ $ ]
0.51
INEQUALITY / GINI INDEX
4,328
TOTAL POPULATION
2,547
MALE POPULATION
1,781
FEMALE POPULATION
143.01
MALES / 100 FEMALES
69.93
FEMALES / 100 MALES
39.7
MEDIAN AGE
2.8
AVG FAMILY SIZE
2.9
AVG HOUSEHOLD SIZE
2,734
LABOR FORCE [ PEOPLE ]
76.8%
PERCENT IN LABOR FORCE
El Jebel Area Codes
Income in El Jebel
Income Overview in El Jebel
Per Capita Income in El Jebel is $72,769, while median incomes of families and households are $123,810 and $120,278 respectively.
| Characteristic | Number | Measure |
| Per Capita Income | 4,328 | $72,769 |
| Median Family Income | 981 | $123,810 |
| Mean Family Income | 981 | $197,579 |
| Median Household Income | 1,494 | $120,278 |
| Mean Household Income | 1,494 | $177,819 |
| Income Deficit | 981 | $0 |
| Wage / Income Gap (%) | 4,328 | 55.52% |
| Wage / Income Gap ($) | 4,328 | 44.48¢ per $1 |
| Gini / Inequality Index | 4,328 | 0.51 |
Earnings by Sex in El Jebel
Average Earnings in El Jebel are $39,901, $53,114 for men and $23,625 for women, a difference of 55.5%.
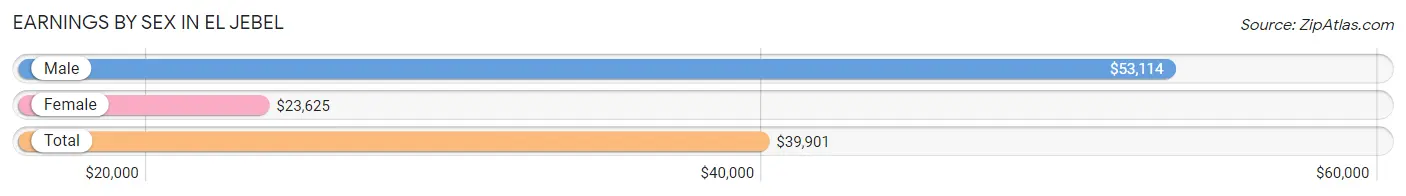
| Sex | Number | Average Earnings |
| Male | 1,900 (64.3%) | $53,114 |
| Female | 1,053 (35.7%) | $23,625 |
| Total | 2,953 (100.0%) | $39,901 |
Earnings by Sex by Income Bracket in El Jebel
The most common earnings brackets in El Jebel are $100,000+ for men (537 | 28.3%) and $20,000 to $22,499 for women (142 | 13.5%).
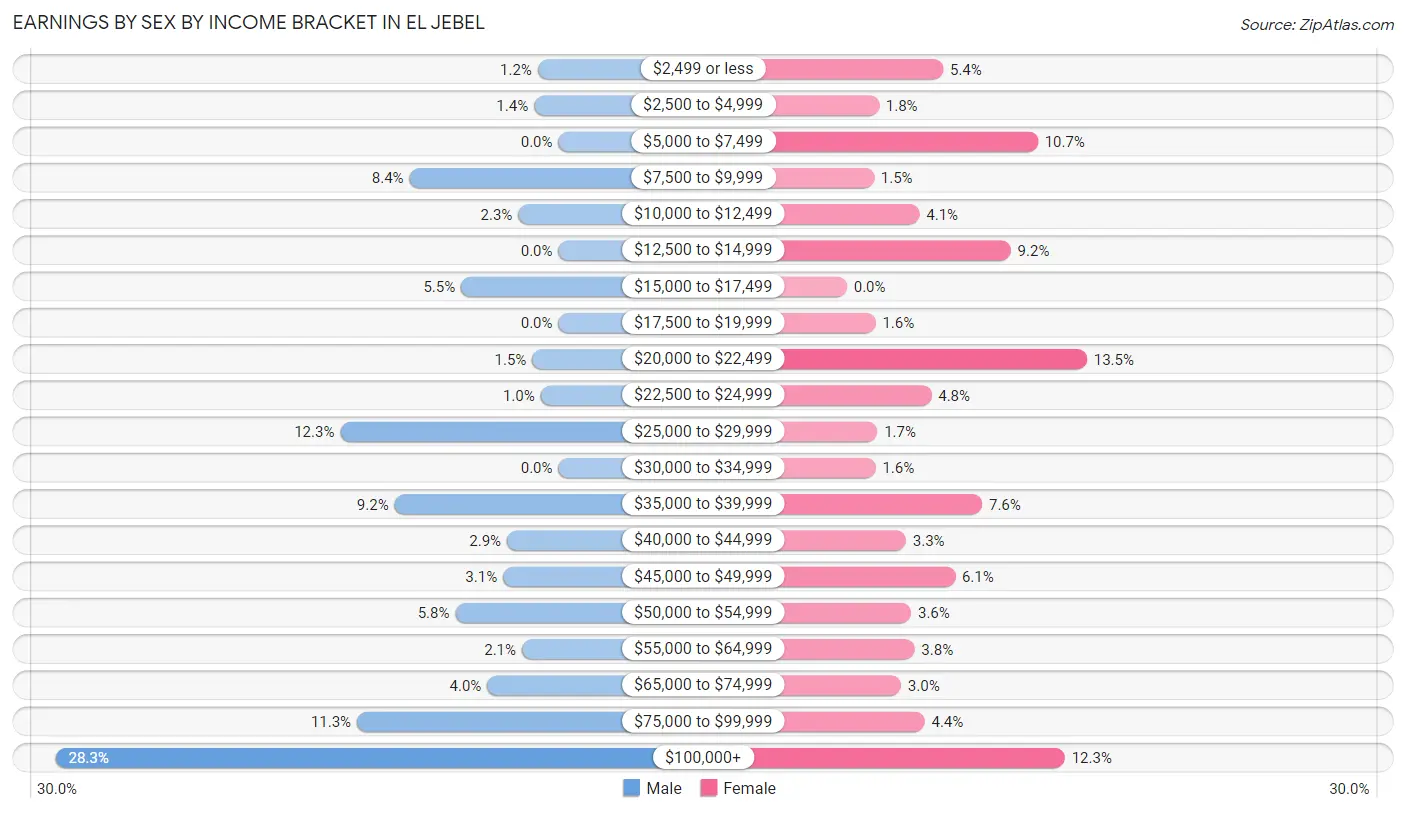
| Income | Male | Female |
| $2,499 or less | 22 (1.2%) | 57 (5.4%) |
| $2,500 to $4,999 | 26 (1.4%) | 19 (1.8%) |
| $5,000 to $7,499 | 0 (0.0%) | 113 (10.7%) |
| $7,500 to $9,999 | 159 (8.4%) | 16 (1.5%) |
| $10,000 to $12,499 | 43 (2.3%) | 43 (4.1%) |
| $12,500 to $14,999 | 0 (0.0%) | 97 (9.2%) |
| $15,000 to $17,499 | 104 (5.5%) | 0 (0.0%) |
| $17,500 to $19,999 | 0 (0.0%) | 17 (1.6%) |
| $20,000 to $22,499 | 28 (1.5%) | 142 (13.5%) |
| $22,500 to $24,999 | 19 (1.0%) | 50 (4.8%) |
| $25,000 to $29,999 | 233 (12.3%) | 18 (1.7%) |
| $30,000 to $34,999 | 0 (0.0%) | 17 (1.6%) |
| $35,000 to $39,999 | 175 (9.2%) | 80 (7.6%) |
| $40,000 to $44,999 | 55 (2.9%) | 35 (3.3%) |
| $45,000 to $49,999 | 59 (3.1%) | 64 (6.1%) |
| $50,000 to $54,999 | 110 (5.8%) | 38 (3.6%) |
| $55,000 to $64,999 | 39 (2.1%) | 40 (3.8%) |
| $65,000 to $74,999 | 76 (4.0%) | 32 (3.0%) |
| $75,000 to $99,999 | 215 (11.3%) | 46 (4.4%) |
| $100,000+ | 537 (28.3%) | 129 (12.2%) |
| Total | 1,900 (100.0%) | 1,053 (100.0%) |
Earnings by Sex by Educational Attainment in El Jebel
Average earnings in El Jebel are $56,597 for men and $29,375 for women, a difference of 48.1%. Men with an educational attainment of graduate degree enjoy the highest average annual earnings of $137,569, while those with less than high school education earn the least with $26,286. Women with an educational attainment of graduate degree earn the most with the average annual earnings of $87,593, while those with high school diploma education have the smallest earnings of $12,949.
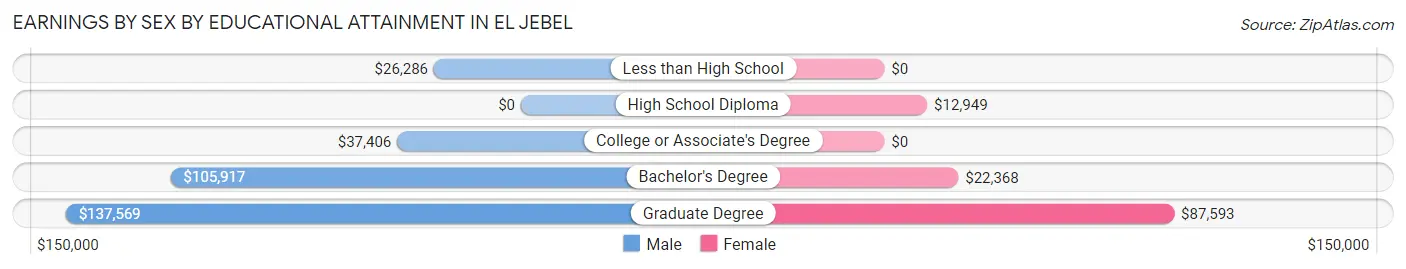
| Educational Attainment | Male Income | Female Income |
| Less than High School | $26,286 | $0 |
| High School Diploma | - | - |
| College or Associate's Degree | $37,406 | $0 |
| Bachelor's Degree | $105,917 | $22,368 |
| Graduate Degree | $137,569 | $87,593 |
| Total | $56,597 | $29,375 |
Family Income in El Jebel
Family Income Brackets in El Jebel
According to the El Jebel family income data, there are 212 families falling into the $200,000+ income range, which is the most common income bracket and makes up 21.6% of all families.
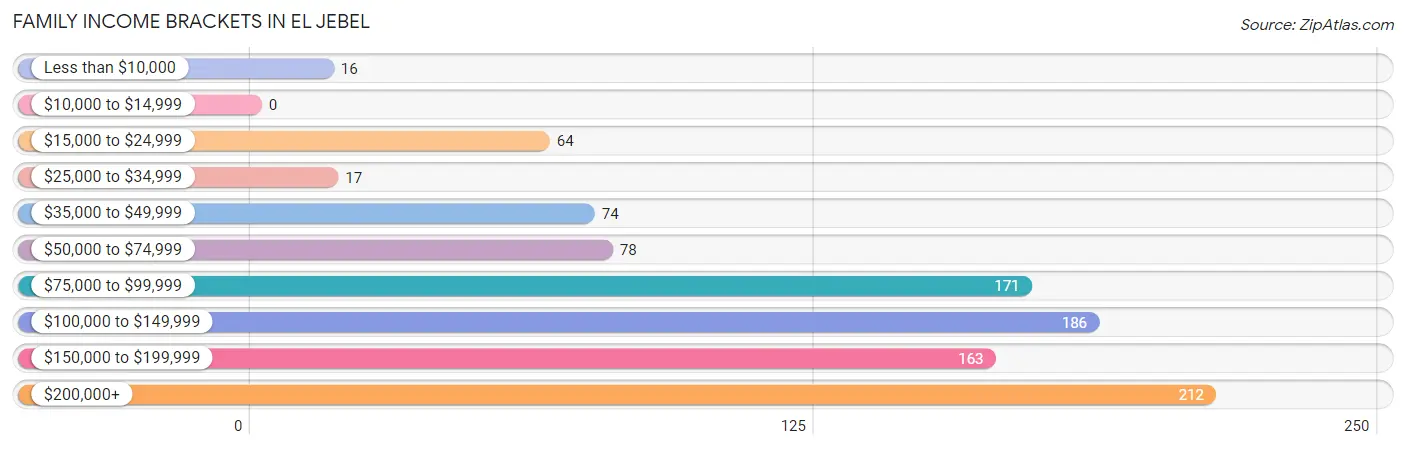
| Income Bracket | # Families | % Families |
| Less than $10,000 | 16 | 1.6% |
| $10,000 to $14,999 | 0 | 0.0% |
| $15,000 to $24,999 | 64 | 6.5% |
| $25,000 to $34,999 | 17 | 1.7% |
| $35,000 to $49,999 | 74 | 7.5% |
| $50,000 to $74,999 | 78 | 8.0% |
| $75,000 to $99,999 | 171 | 17.4% |
| $100,000 to $149,999 | 186 | 19.0% |
| $150,000 to $199,999 | 163 | 16.6% |
| $200,000+ | 212 | 21.6% |
Family Income by Famaliy Size in El Jebel
4-person families (77 | 7.9%) account for the highest median family income in El Jebel with $185,625 per family, while 2-person families (508 | 51.8%) have the highest median income of $73,750 per family member.
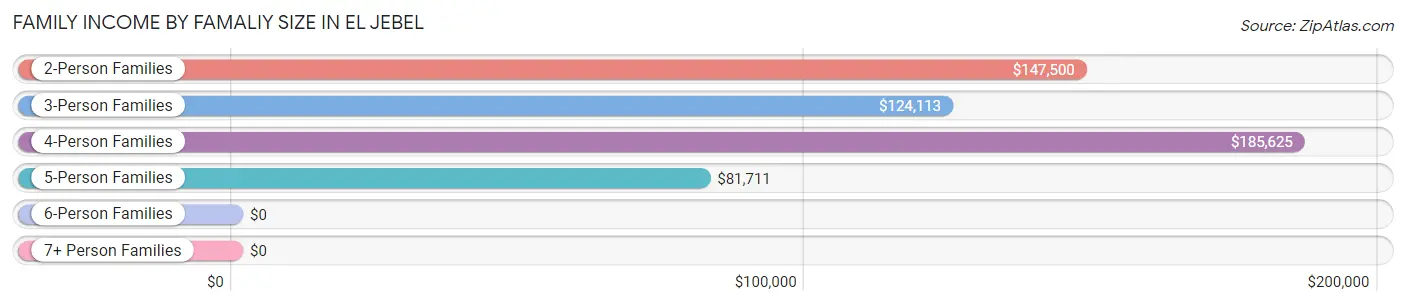
| Income Bracket | # Families | Median Income |
| 2-Person Families | 508 (51.8%) | $147,500 |
| 3-Person Families | 266 (27.1%) | $124,113 |
| 4-Person Families | 77 (7.9%) | $185,625 |
| 5-Person Families | 130 (13.3%) | $81,711 |
| 6-Person Families | 0 (0.0%) | $0 |
| 7+ Person Families | 0 (0.0%) | $0 |
| Total | 981 (100.0%) | $123,810 |
Family Income by Number of Earners in El Jebel
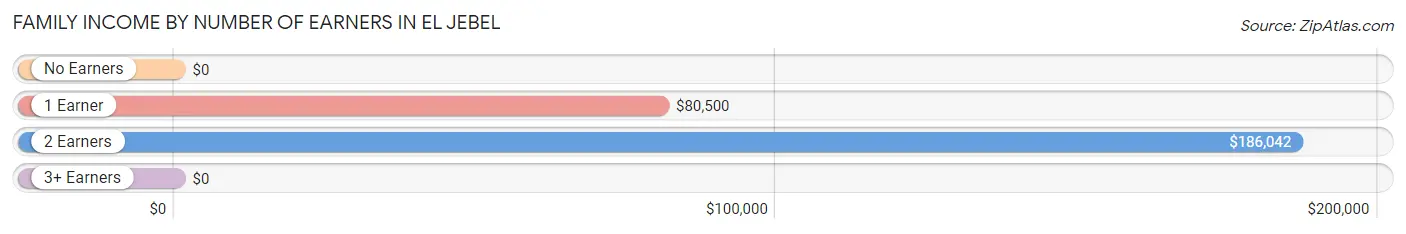
| Number of Earners | # Families | Median Income |
| No Earners | 31 (3.2%) | $0 |
| 1 Earner | 346 (35.3%) | $80,500 |
| 2 Earners | 567 (57.8%) | $186,042 |
| 3+ Earners | 37 (3.8%) | $0 |
| Total | 981 (100.0%) | $123,810 |
Household Income in El Jebel
Household Income Brackets in El Jebel
With 365 households falling in the category, the $200,000+ income range is the most frequent in El Jebel, accounting for 24.4% of all households. In contrast, only 16 households (1.1%) fall into the $25,000 to $34,999 income bracket, making it the least populous group.
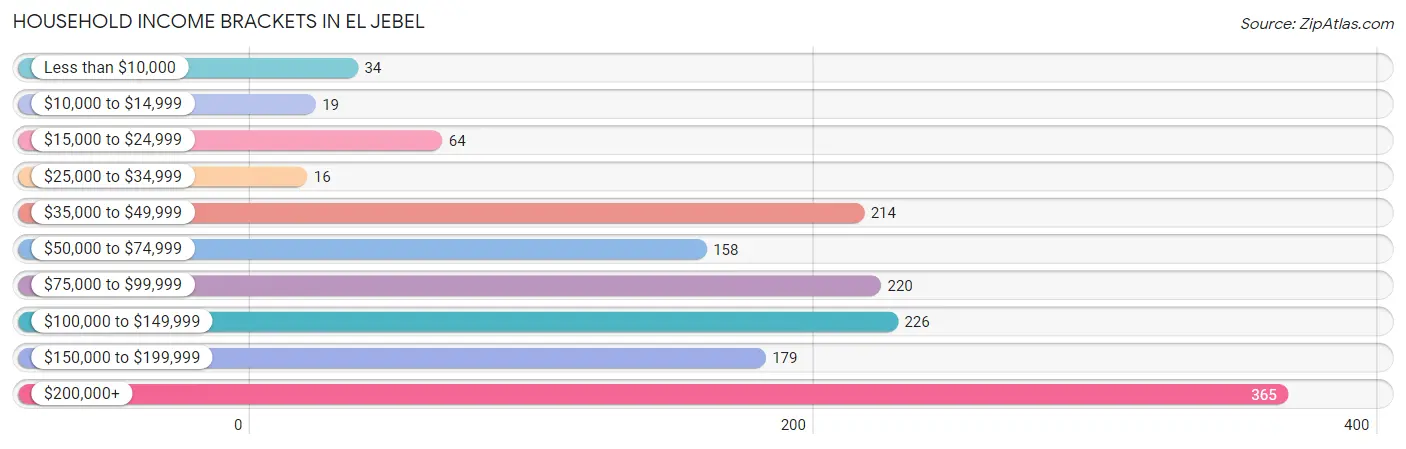
| Income Bracket | # Households | % Households |
| Less than $10,000 | 34 | 2.3% |
| $10,000 to $14,999 | 19 | 1.3% |
| $15,000 to $24,999 | 64 | 4.3% |
| $25,000 to $34,999 | 16 | 1.1% |
| $35,000 to $49,999 | 214 | 14.3% |
| $50,000 to $74,999 | 158 | 10.6% |
| $75,000 to $99,999 | 220 | 14.7% |
| $100,000 to $149,999 | 226 | 15.1% |
| $150,000 to $199,999 | 179 | 12.0% |
| $200,000+ | 365 | 24.4% |
Household Income by Householder Age in El Jebel
The median household income in El Jebel is $120,278, with the highest median household income of $186,528 found in the 45 to 64 years age bracket for the primary householder. A total of 630 households (42.2%) fall into this category. Meanwhile, the 15 to 24 years age bracket for the primary householder has the lowest median household income of $0, with 69 households (4.6%) in this group.
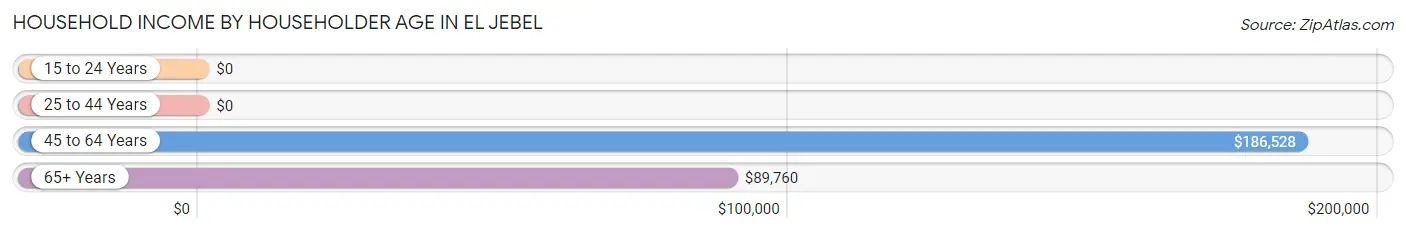
| Income Bracket | # Households | Median Income |
| 15 to 24 Years | 69 (4.6%) | $0 |
| 25 to 44 Years | 410 (27.4%) | $0 |
| 45 to 64 Years | 630 (42.2%) | $186,528 |
| 65+ Years | 385 (25.8%) | $89,760 |
| Total | 1,494 (100.0%) | $120,278 |
Poverty in El Jebel
Income Below Poverty by Sex and Age in El Jebel
With 7.1% poverty level for males and 12.9% for females among the residents of El Jebel, 16 and 17 year old males and 18 to 24 year old females are the most vulnerable to poverty, with 50 males (44.3%) and 82 females (100.0%) in their respective age groups living below the poverty level.
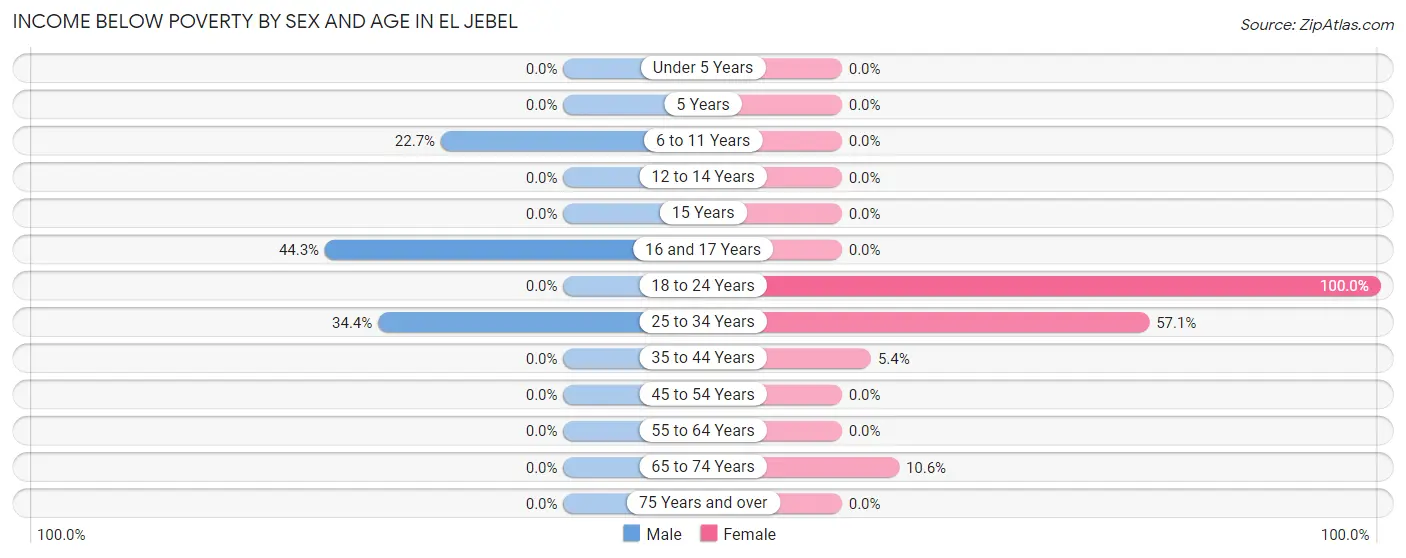
| Age Bracket | Male | Female |
| Under 5 Years | 0 (0.0%) | 0 (0.0%) |
| 5 Years | 0 (0.0%) | 0 (0.0%) |
| 6 to 11 Years | 20 (22.7%) | 0 (0.0%) |
| 12 to 14 Years | 0 (0.0%) | 0 (0.0%) |
| 15 Years | 0 (0.0%) | 0 (0.0%) |
| 16 and 17 Years | 50 (44.3%) | 0 (0.0%) |
| 18 to 24 Years | 0 (0.0%) | 82 (100.0%) |
| 25 to 34 Years | 110 (34.4%) | 97 (57.1%) |
| 35 to 44 Years | 0 (0.0%) | 16 (5.4%) |
| 45 to 54 Years | 0 (0.0%) | 0 (0.0%) |
| 55 to 64 Years | 0 (0.0%) | 0 (0.0%) |
| 65 to 74 Years | 0 (0.0%) | 19 (10.6%) |
| 75 Years and over | 0 (0.0%) | 0 (0.0%) |
| Total | 180 (7.1%) | 214 (12.9%) |
Income Above Poverty by Sex and Age in El Jebel
According to the poverty statistics in El Jebel, males aged under 5 years and females aged under 5 years are the age groups that are most secure financially, with 100.0% of males and 100.0% of females in these age groups living above the poverty line.
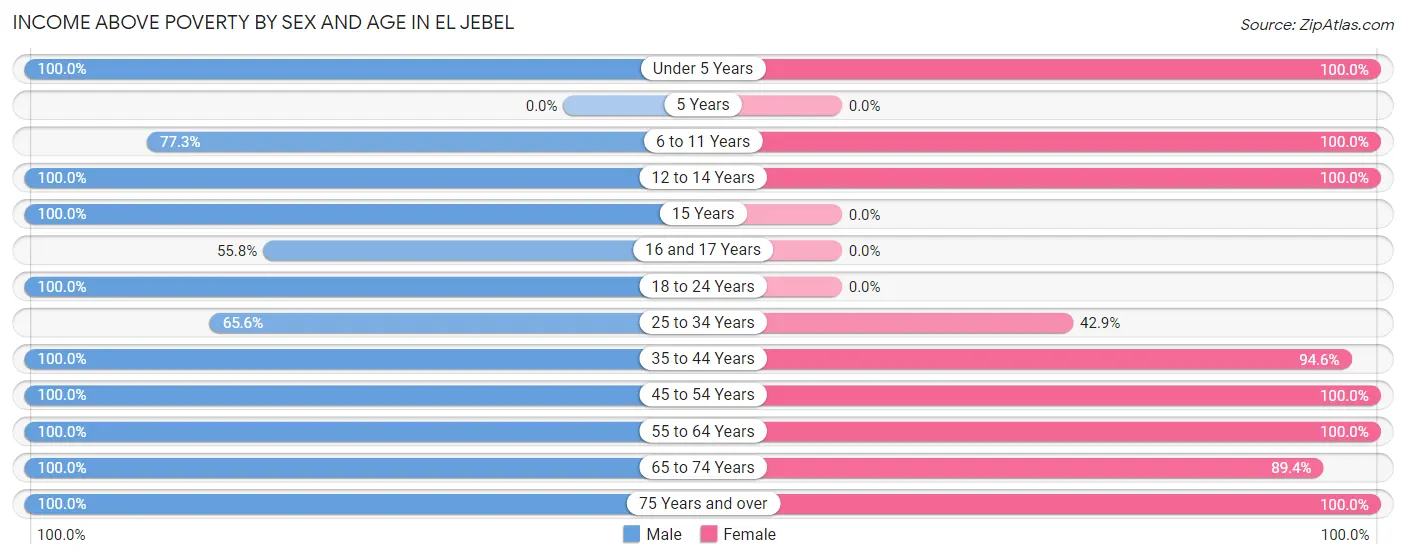
| Age Bracket | Male | Female |
| Under 5 Years | 147 (100.0%) | 16 (100.0%) |
| 5 Years | 0 (0.0%) | 0 (0.0%) |
| 6 to 11 Years | 68 (77.3%) | 281 (100.0%) |
| 12 to 14 Years | 69 (100.0%) | 16 (100.0%) |
| 15 Years | 28 (100.0%) | 0 (0.0%) |
| 16 and 17 Years | 63 (55.7%) | 0 (0.0%) |
| 18 to 24 Years | 126 (100.0%) | 0 (0.0%) |
| 25 to 34 Years | 210 (65.6%) | 73 (42.9%) |
| 35 to 44 Years | 728 (100.0%) | 279 (94.6%) |
| 45 to 54 Years | 417 (100.0%) | 284 (100.0%) |
| 55 to 64 Years | 276 (100.0%) | 234 (100.0%) |
| 65 to 74 Years | 143 (100.0%) | 160 (89.4%) |
| 75 Years and over | 92 (100.0%) | 101 (100.0%) |
| Total | 2,367 (92.9%) | 1,444 (87.1%) |
Income Below Poverty Among Married-Couple Families in El Jebel
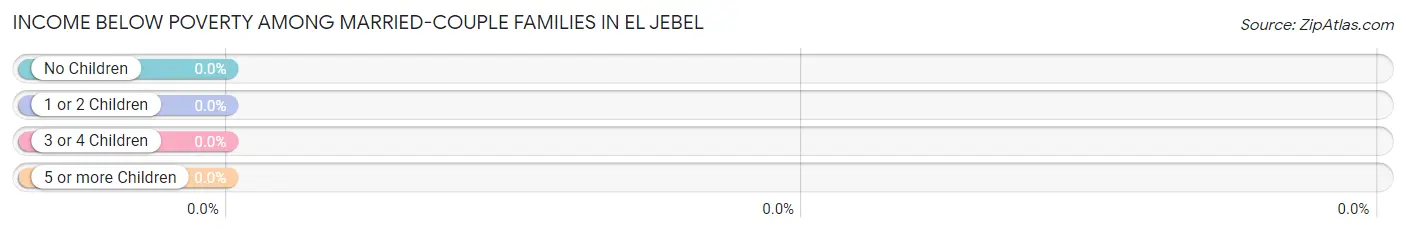
| Children | Above Poverty | Below Poverty |
| No Children | 473 (100.0%) | 0 (0.0%) |
| 1 or 2 Children | 227 (100.0%) | 0 (0.0%) |
| 3 or 4 Children | 130 (100.0%) | 0 (0.0%) |
| 5 or more Children | 0 (0.0%) | 0 (0.0%) |
| Total | 830 (100.0%) | 0 (0.0%) |
Income Below Poverty Among Single-Parent Households in El Jebel
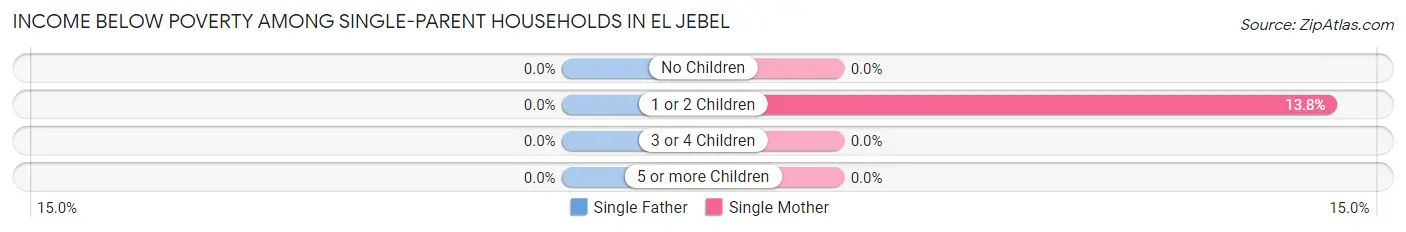
| Children | Single Father | Single Mother |
| No Children | 0 (0.0%) | 0 (0.0%) |
| 1 or 2 Children | 0 (0.0%) | 16 (13.8%) |
| 3 or 4 Children | 0 (0.0%) | 0 (0.0%) |
| 5 or more Children | 0 (0.0%) | 0 (0.0%) |
| Total | 0 (0.0%) | 16 (13.8%) |
Income Below Poverty Among Married-Couple vs Single-Parent Households in El Jebel
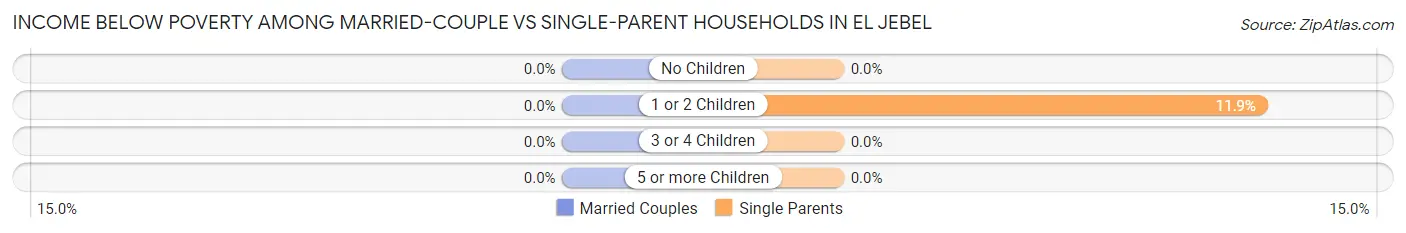
| Children | Married-Couple Families | Single-Parent Households |
| No Children | 0 (0.0%) | 0 (0.0%) |
| 1 or 2 Children | 0 (0.0%) | 16 (11.8%) |
| 3 or 4 Children | 0 (0.0%) | 0 (0.0%) |
| 5 or more Children | 0 (0.0%) | 0 (0.0%) |
| Total | 0 (0.0%) | 16 (10.6%) |
Race in El Jebel
The most populous races in El Jebel are White / Caucasian (3,726 | 86.1%), Hispanic or Latino (1,263 | 29.2%), and Some other Race (442 | 10.2%).
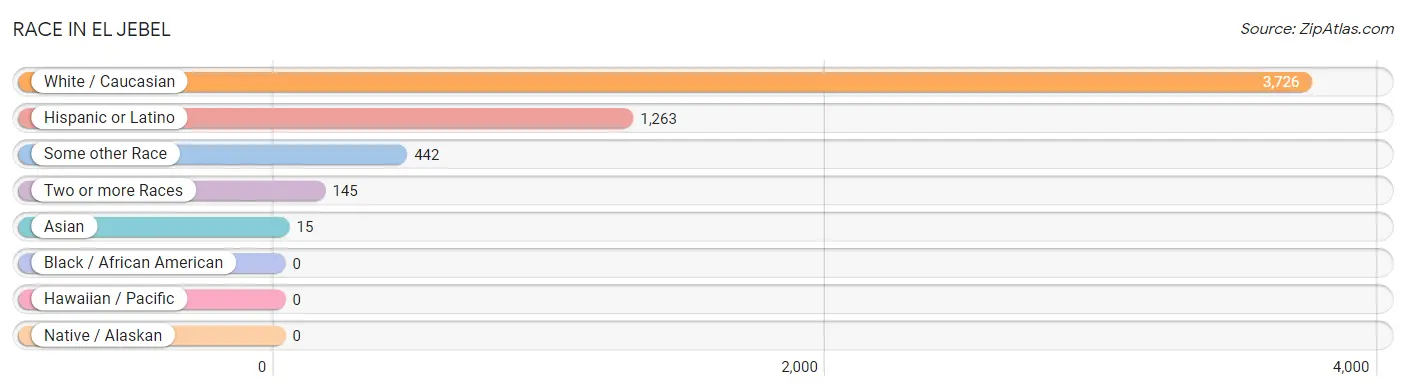
| Race | # Population | % Population |
| Asian | 15 | 0.4% |
| Black / African American | 0 | 0.0% |
| Hawaiian / Pacific | 0 | 0.0% |
| Hispanic or Latino | 1,263 | 29.2% |
| Native / Alaskan | 0 | 0.0% |
| White / Caucasian | 3,726 | 86.1% |
| Two or more Races | 145 | 3.4% |
| Some other Race | 442 | 10.2% |
| Total | 4,328 | 100.0% |
Ancestry in El Jebel
The most populous ancestries reported in El Jebel are German (927 | 21.4%), Central American (845 | 19.5%), Salvadoran (845 | 19.5%), English (580 | 13.4%), and Irish (379 | 8.8%), together accounting for 82.6% of all El Jebel residents.
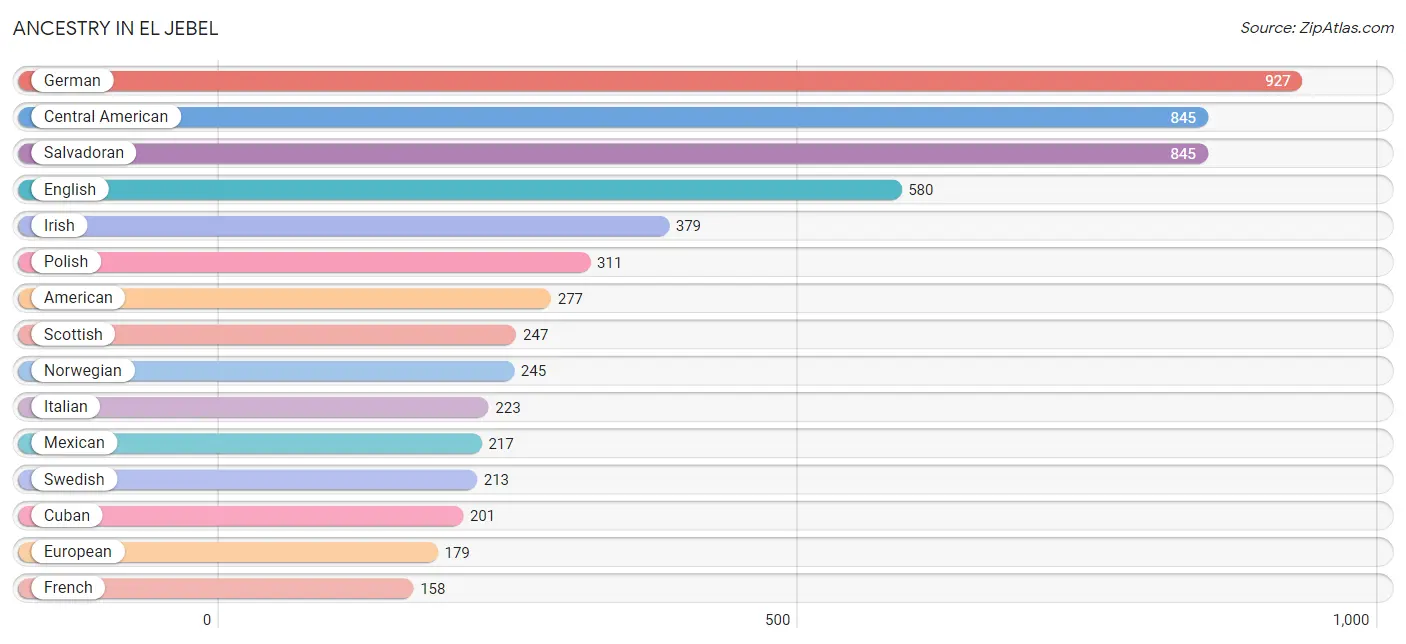
| Ancestry | # Population | % Population |
| American | 277 | 6.4% |
| Arab | 9 | 0.2% |
| Australian | 32 | 0.7% |
| British | 152 | 3.5% |
| Burmese | 15 | 0.4% |
| Central American | 845 | 19.5% |
| Cuban | 201 | 4.6% |
| Czech | 26 | 0.6% |
| English | 580 | 13.4% |
| European | 179 | 4.1% |
| French | 158 | 3.6% |
| French Canadian | 63 | 1.5% |
| German | 927 | 21.4% |
| Iranian | 32 | 0.7% |
| Irish | 379 | 8.8% |
| Italian | 223 | 5.1% |
| Lithuanian | 20 | 0.5% |
| Mexican | 217 | 5.0% |
| Norwegian | 245 | 5.7% |
| Polish | 311 | 7.2% |
| Portuguese | 24 | 0.5% |
| Salvadoran | 845 | 19.5% |
| Scotch-Irish | 19 | 0.4% |
| Scottish | 247 | 5.7% |
| Slovak | 20 | 0.5% |
| Swedish | 213 | 4.9% |
| Swiss | 65 | 1.5% | View All 27 Rows |
Immigrants in El Jebel
The most numerous immigrant groups reported in El Jebel came from Central America (644 | 14.9%), Latin America (644 | 14.9%), El Salvador (509 | 11.8%), Mexico (135 | 3.1%), and Canada (69 | 1.6%), together accounting for 46.2% of all El Jebel residents.
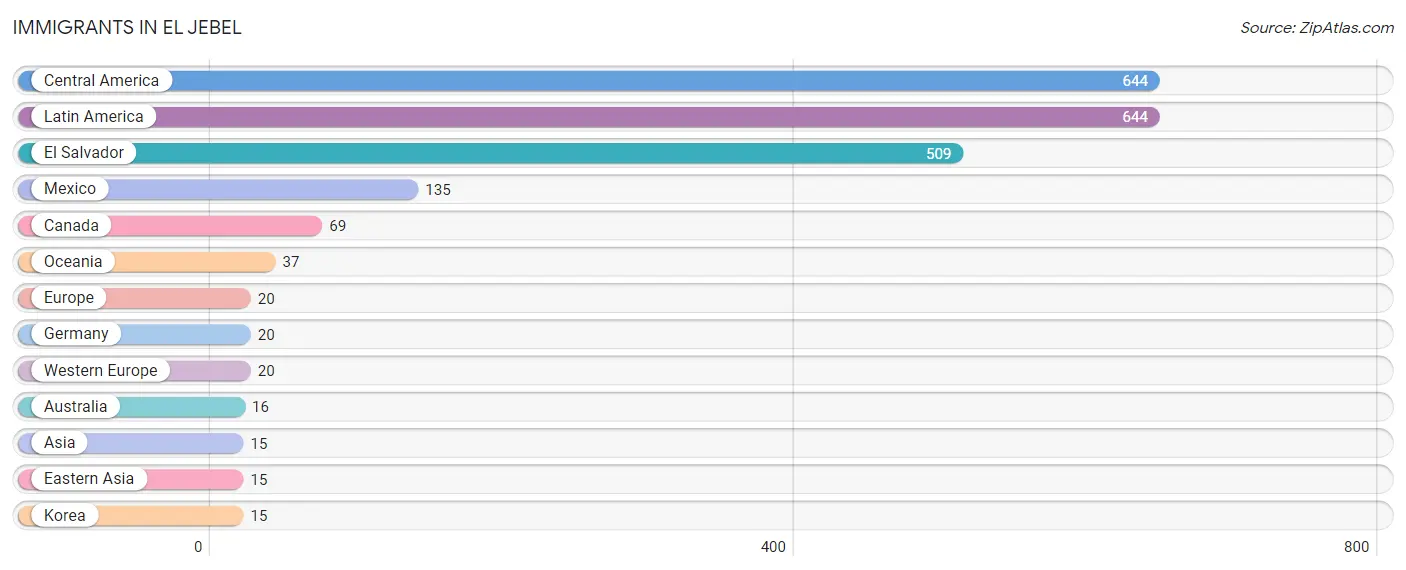
| Immigration Origin | # Population | % Population |
| Asia | 15 | 0.4% |
| Australia | 16 | 0.4% |
| Canada | 69 | 1.6% |
| Central America | 644 | 14.9% |
| Eastern Asia | 15 | 0.4% |
| El Salvador | 509 | 11.8% |
| Europe | 20 | 0.5% |
| Germany | 20 | 0.5% |
| Korea | 15 | 0.4% |
| Latin America | 644 | 14.9% |
| Mexico | 135 | 3.1% |
| Oceania | 37 | 0.9% |
| Western Europe | 20 | 0.5% | View All 13 Rows |
Sex and Age in El Jebel
Sex and Age in El Jebel
The most populous age groups in El Jebel are 35 to 39 Years (459 | 18.0%) for men and 50 to 54 Years (189 | 10.6%) for women.
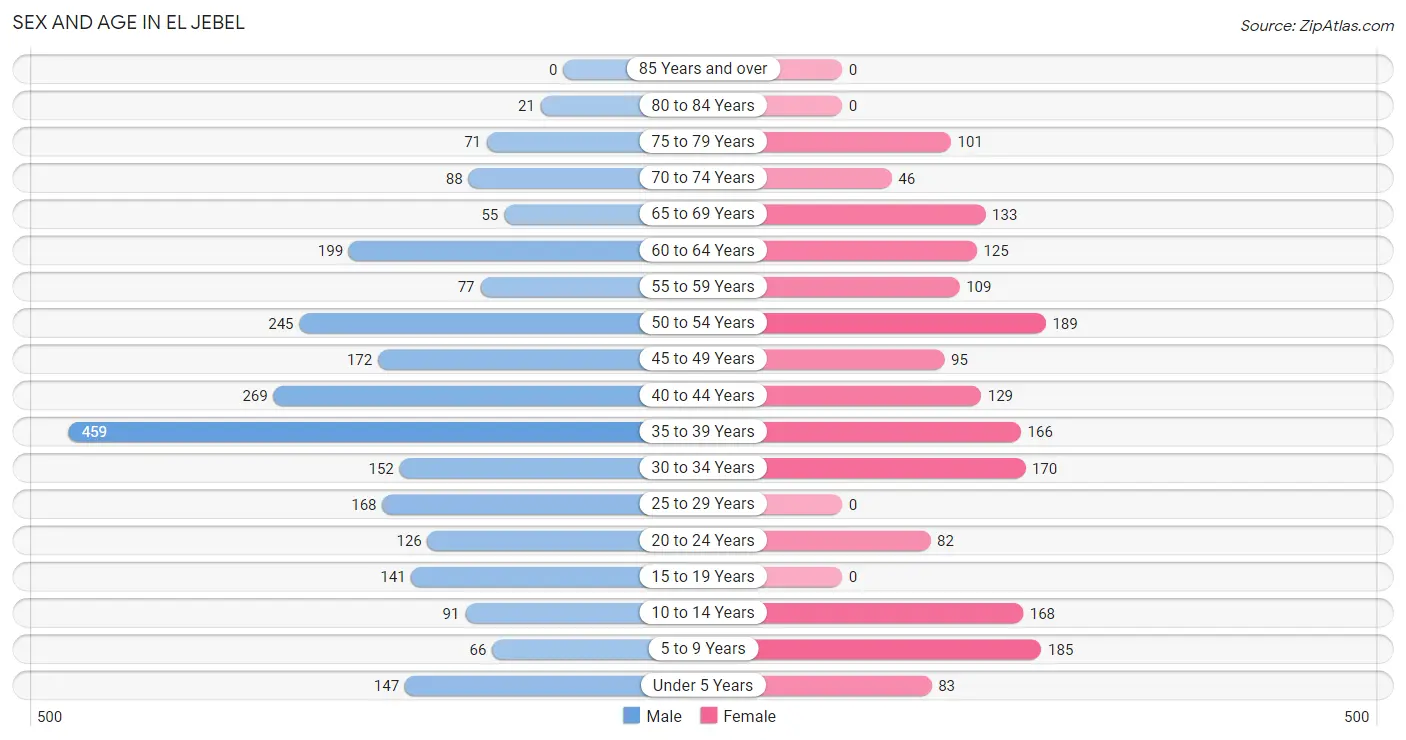
| Age Bracket | Male | Female |
| Under 5 Years | 147 (5.8%) | 83 (4.7%) |
| 5 to 9 Years | 66 (2.6%) | 185 (10.4%) |
| 10 to 14 Years | 91 (3.6%) | 168 (9.4%) |
| 15 to 19 Years | 141 (5.5%) | 0 (0.0%) |
| 20 to 24 Years | 126 (5.0%) | 82 (4.6%) |
| 25 to 29 Years | 168 (6.6%) | 0 (0.0%) |
| 30 to 34 Years | 152 (6.0%) | 170 (9.6%) |
| 35 to 39 Years | 459 (18.0%) | 166 (9.3%) |
| 40 to 44 Years | 269 (10.6%) | 129 (7.2%) |
| 45 to 49 Years | 172 (6.8%) | 95 (5.3%) |
| 50 to 54 Years | 245 (9.6%) | 189 (10.6%) |
| 55 to 59 Years | 77 (3.0%) | 109 (6.1%) |
| 60 to 64 Years | 199 (7.8%) | 125 (7.0%) |
| 65 to 69 Years | 55 (2.2%) | 133 (7.5%) |
| 70 to 74 Years | 88 (3.5%) | 46 (2.6%) |
| 75 to 79 Years | 71 (2.8%) | 101 (5.7%) |
| 80 to 84 Years | 21 (0.8%) | 0 (0.0%) |
| 85 Years and over | 0 (0.0%) | 0 (0.0%) |
| Total | 2,547 (100.0%) | 1,781 (100.0%) |
Families and Households in El Jebel
Median Family Size in El Jebel
The median family size in El Jebel is 2.83 persons per family, with single male/father families (35 | 3.6%) accounting for the largest median family size of 4.17 persons per family. On the other hand, single female/mother families (116 | 11.8%) represent the smallest median family size with 1.89 persons per family.
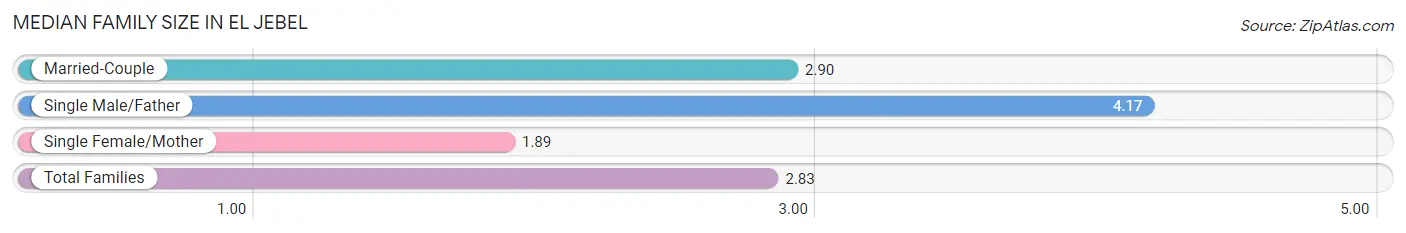
| Family Type | # Families | Family Size |
| Married-Couple | 830 (84.6%) | 2.90 |
| Single Male/Father | 35 (3.6%) | 4.17 |
| Single Female/Mother | 116 (11.8%) | 1.89 |
| Total Families | 981 (100.0%) | 2.83 |
Median Household Size in El Jebel
The median household size in El Jebel is 2.90 persons per household, with single male/father households (35 | 2.3%) accounting for the largest median household size of 4.17 persons per household. single female/mother households (116 | 7.8%) represent the smallest median household size with 1.89 persons per household.
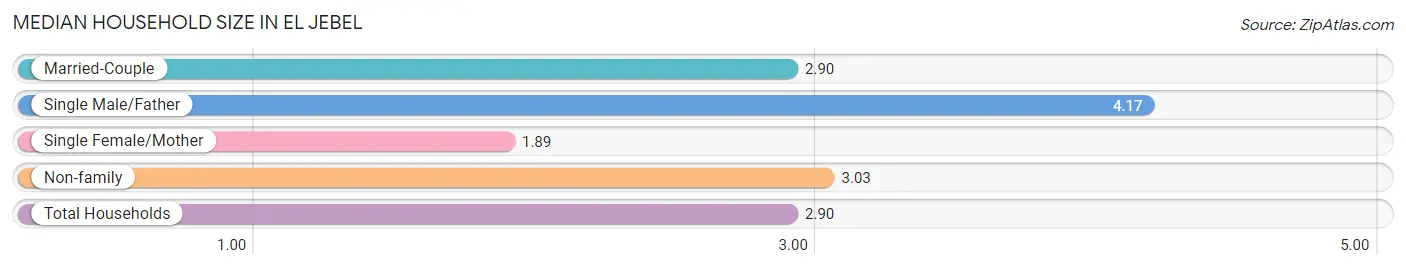
| Household Type | # Households | Household Size |
| Married-Couple | 830 (55.6%) | 2.90 |
| Single Male/Father | 35 (2.3%) | 4.17 |
| Single Female/Mother | 116 (7.8%) | 1.89 |
| Non-family | 513 (34.3%) | 3.03 |
| Total Households | 1,494 (100.0%) | 2.90 |
Household Size by Marriage Status in El Jebel
Out of a total of 1,494 households in El Jebel, 981 (65.7%) are family households, while 513 (34.3%) are nonfamily households. The most numerous type of family households are 2-person households, comprising 508, and the most common type of nonfamily households are 1-person households, comprising 279.
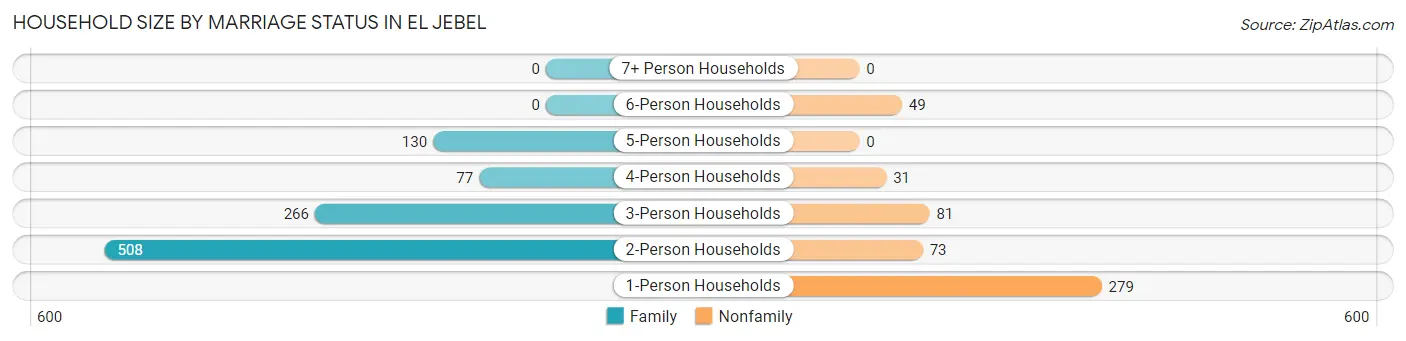
| Household Size | Family Households | Nonfamily Households |
| 1-Person Households | - | 279 (18.7%) |
| 2-Person Households | 508 (34.0%) | 73 (4.9%) |
| 3-Person Households | 266 (17.8%) | 81 (5.4%) |
| 4-Person Households | 77 (5.1%) | 31 (2.1%) |
| 5-Person Households | 130 (8.7%) | 0 (0.0%) |
| 6-Person Households | 0 (0.0%) | 49 (3.3%) |
| 7+ Person Households | 0 (0.0%) | 0 (0.0%) |
| Total | 981 (65.7%) | 513 (34.3%) |
Female Fertility in El Jebel
Fertility by Age in El Jebel
Average fertility rate in El Jebel is 78.0 births per 1,000 women. Women in the age bracket of 35 to 50 years have the highest fertility rate with 128.0 births per 1,000 women. Women in the age bracket of 35 to 50 years acount for 100.0% of all women with births.
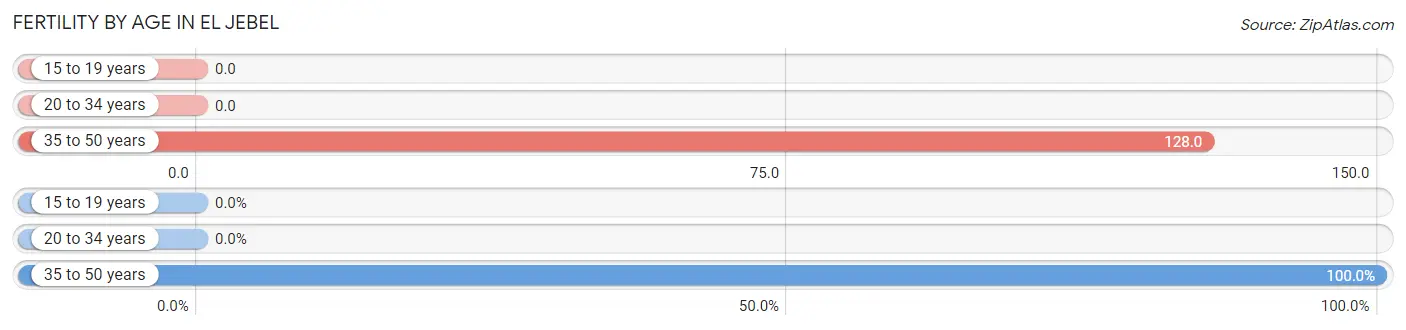
| Age Bracket | Women with Births | Births / 1,000 Women |
| 15 to 19 years | 0 (0.0%) | 0.0 |
| 20 to 34 years | 0 (0.0%) | 0.0 |
| 35 to 50 years | 50 (100.0%) | 128.0 |
| Total | 50 (100.0%) | 78.0 |
Fertility by Age by Marriage Status in El Jebel
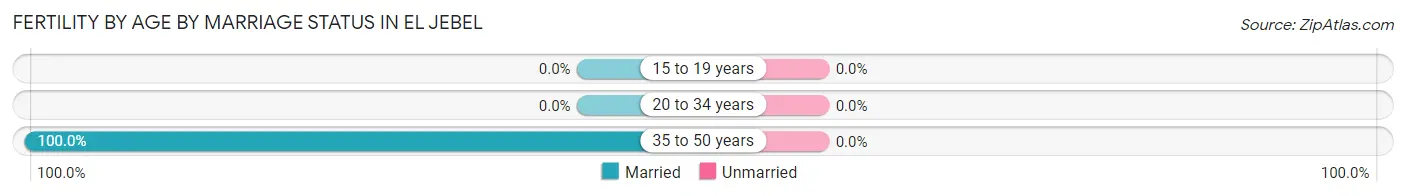
| Age Bracket | Married | Unmarried |
| 15 to 19 years | 0 (0.0%) | 0 (0.0%) |
| 20 to 34 years | 0 (0.0%) | 0 (0.0%) |
| 35 to 50 years | 50 (100.0%) | 0 (0.0%) |
| Total | 50 (100.0%) | 0 (0.0%) |
Fertility by Education in El Jebel
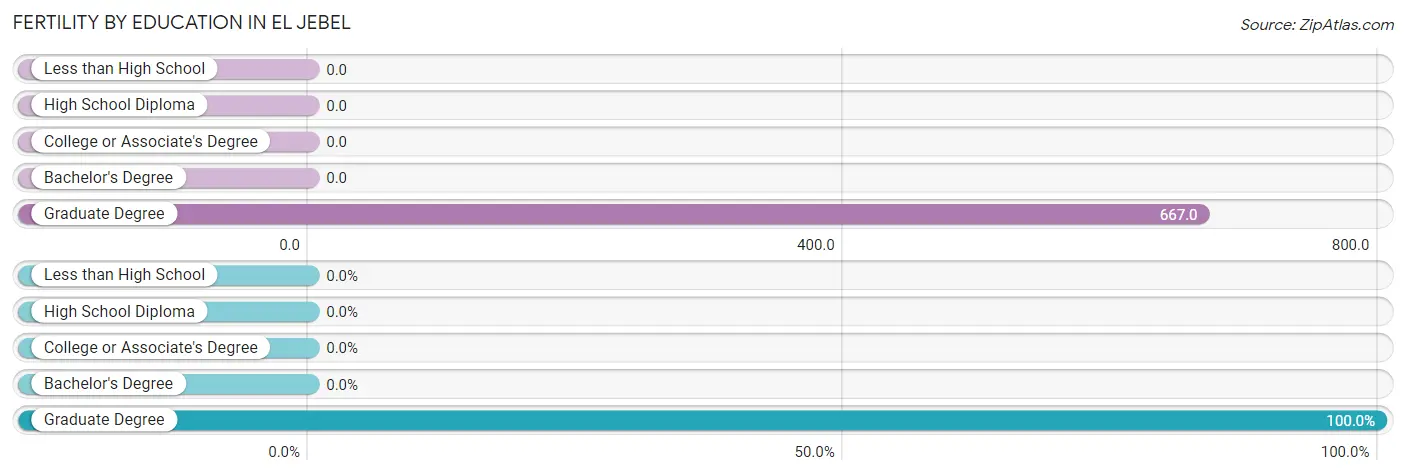
| Educational Attainment | Women with Births | Births / 1,000 Women |
| Less than High School | 0 (0.0%) | 0.0 |
| High School Diploma | 0 (0.0%) | 0.0 |
| College or Associate's Degree | 0 (0.0%) | 0.0 |
| Bachelor's Degree | 0 (0.0%) | 0.0 |
| Graduate Degree | 50 (100.0%) | 667.0 |
| Total | 50 (100.0%) | 78.0 |
Fertility by Education by Marriage Status in El Jebel
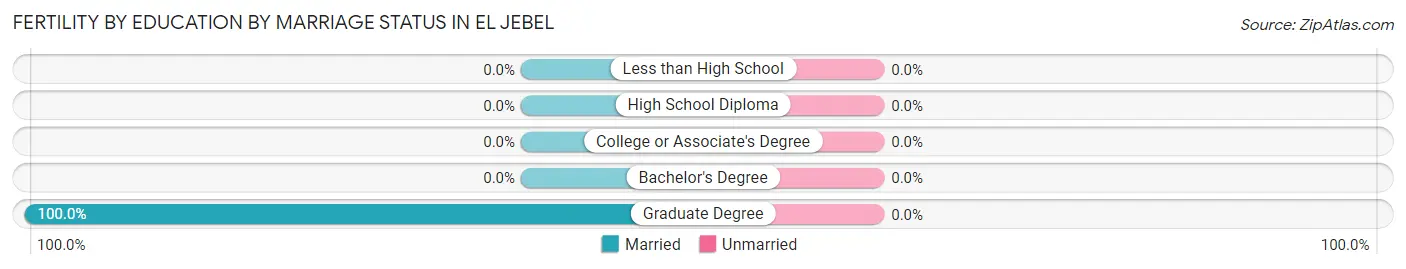
| Educational Attainment | Married | Unmarried |
| Less than High School | 0 (0.0%) | 0 (0.0%) |
| High School Diploma | 0 (0.0%) | 0 (0.0%) |
| College or Associate's Degree | 0 (0.0%) | 0 (0.0%) |
| Bachelor's Degree | 0 (0.0%) | 0 (0.0%) |
| Graduate Degree | 50 (100.0%) | 0 (0.0%) |
| Total | 50 (100.0%) | 0 (0.0%) |
Employment Characteristics in El Jebel
Employment by Class of Employer in El Jebel
Among the 2,687 employed individuals in El Jebel, private company employees (1,728 | 64.3%), self-employed (not incorporated) (384 | 14.3%), and self-employed (incorporated) (222 | 8.3%) make up the most common classes of employment.
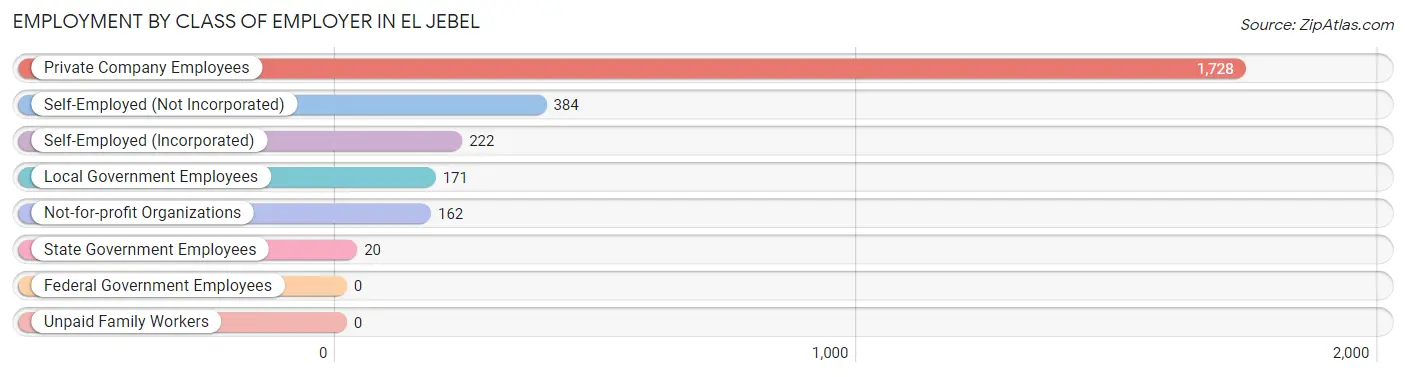
| Employer Class | # Employees | % Employees |
| Private Company Employees | 1,728 | 64.3% |
| Self-Employed (Incorporated) | 222 | 8.3% |
| Self-Employed (Not Incorporated) | 384 | 14.3% |
| Not-for-profit Organizations | 162 | 6.0% |
| Local Government Employees | 171 | 6.4% |
| State Government Employees | 20 | 0.7% |
| Federal Government Employees | 0 | 0.0% |
| Unpaid Family Workers | 0 | 0.0% |
| Total | 2,687 | 100.0% |
Employment Status by Age in El Jebel
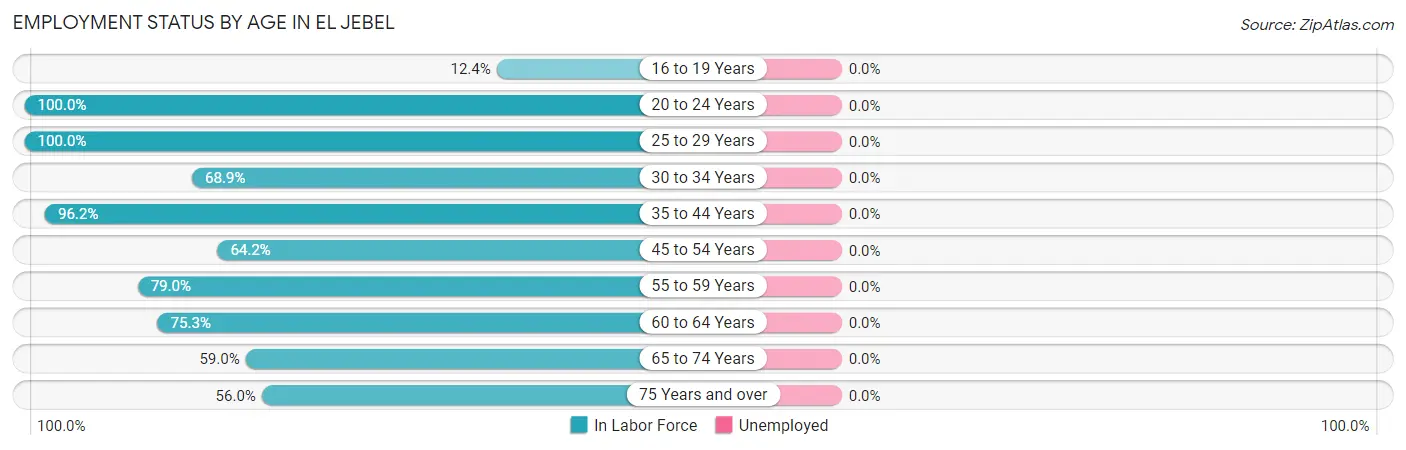
| Age Bracket | In Labor Force | Unemployed |
| 16 to 19 Years | 14 (12.4%) | 0 (0.0%) |
| 20 to 24 Years | 208 (100.0%) | 0 (0.0%) |
| 25 to 29 Years | 168 (100.0%) | 0 (0.0%) |
| 30 to 34 Years | 222 (68.9%) | 0 (0.0%) |
| 35 to 44 Years | 984 (96.2%) | 0 (0.0%) |
| 45 to 54 Years | 450 (64.2%) | 0 (0.0%) |
| 55 to 59 Years | 147 (79.0%) | 0 (0.0%) |
| 60 to 64 Years | 244 (75.3%) | 0 (0.0%) |
| 65 to 74 Years | 190 (59.0%) | 0 (0.0%) |
| 75 Years and over | 108 (56.0%) | 0 (0.0%) |
| Total | 2,734 (76.8%) | 0 (0.0%) |
Employment Status by Educational Attainment in El Jebel
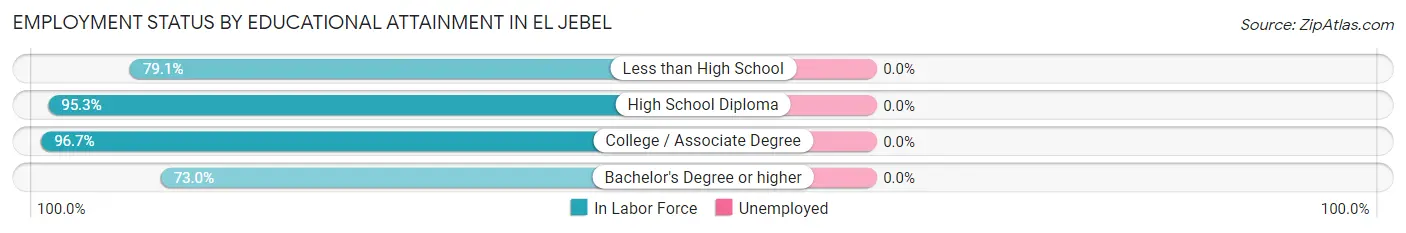
| Educational Attainment | In Labor Force | Unemployed |
| Less than High School | 379 (79.1%) | 0 (0.0%) |
| High School Diploma | 346 (95.3%) | 0 (0.0%) |
| College / Associate Degree | 473 (96.7%) | 0 (0.0%) |
| Bachelor's Degree or higher | 1,017 (73.0%) | 0 (0.0%) |
| Total | 2,215 (81.3%) | 0 (0.0%) |
Employment Occupations by Sex in El Jebel
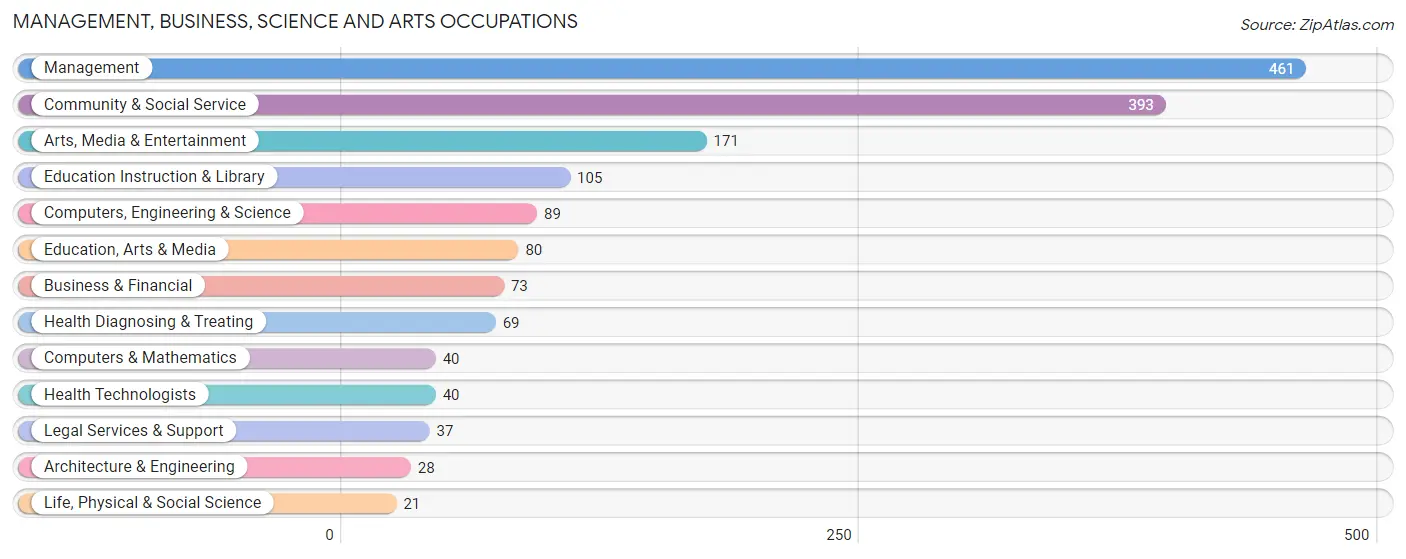
Management, Business, Science and Arts Occupations
The most common Management, Business, Science and Arts occupations in El Jebel are Management (461 | 16.9%), Community & Social Service (393 | 14.4%), Arts, Media & Entertainment (171 | 6.2%), Education Instruction & Library (105 | 3.8%), and Computers, Engineering & Science (89 | 3.3%).
Management, Business, Science and Arts Occupations by Sex
Within the Management, Business, Science and Arts occupations in El Jebel, the most male-oriented occupations are Architecture & Engineering (100.0%), Life, Physical & Social Science (100.0%), and Health Diagnosing & Treating (100.0%), while the most female-oriented occupations are Education, Arts & Media (100.0%), Arts, Media & Entertainment (100.0%), and Community & Social Service (87.0%).
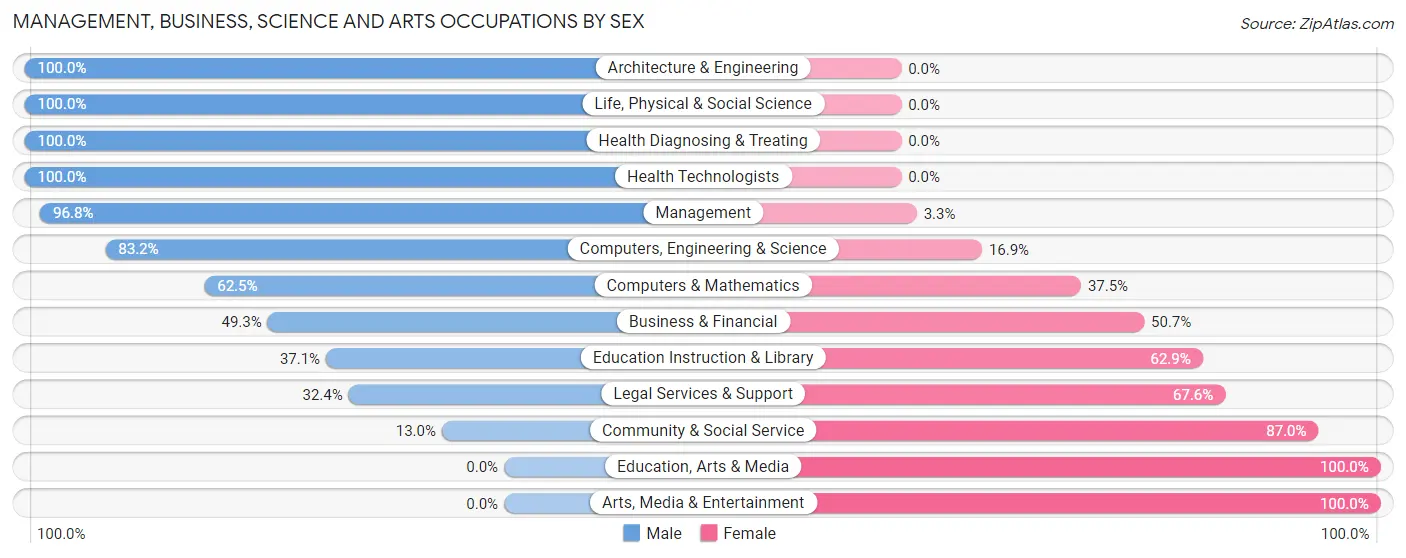
| Occupation | Male | Female |
| Management | 446 (96.8%) | 15 (3.3%) |
| Business & Financial | 36 (49.3%) | 37 (50.7%) |
| Computers, Engineering & Science | 74 (83.2%) | 15 (16.9%) |
| Computers & Mathematics | 25 (62.5%) | 15 (37.5%) |
| Architecture & Engineering | 28 (100.0%) | 0 (0.0%) |
| Life, Physical & Social Science | 21 (100.0%) | 0 (0.0%) |
| Community & Social Service | 51 (13.0%) | 342 (87.0%) |
| Education, Arts & Media | 0 (0.0%) | 80 (100.0%) |
| Legal Services & Support | 12 (32.4%) | 25 (67.6%) |
| Education Instruction & Library | 39 (37.1%) | 66 (62.9%) |
| Arts, Media & Entertainment | 0 (0.0%) | 171 (100.0%) |
| Health Diagnosing & Treating | 69 (100.0%) | 0 (0.0%) |
| Health Technologists | 40 (100.0%) | 0 (0.0%) |
| Total (Category) | 676 (62.3%) | 409 (37.7%) |
| Total (Overall) | 1,784 (65.2%) | 951 (34.8%) |
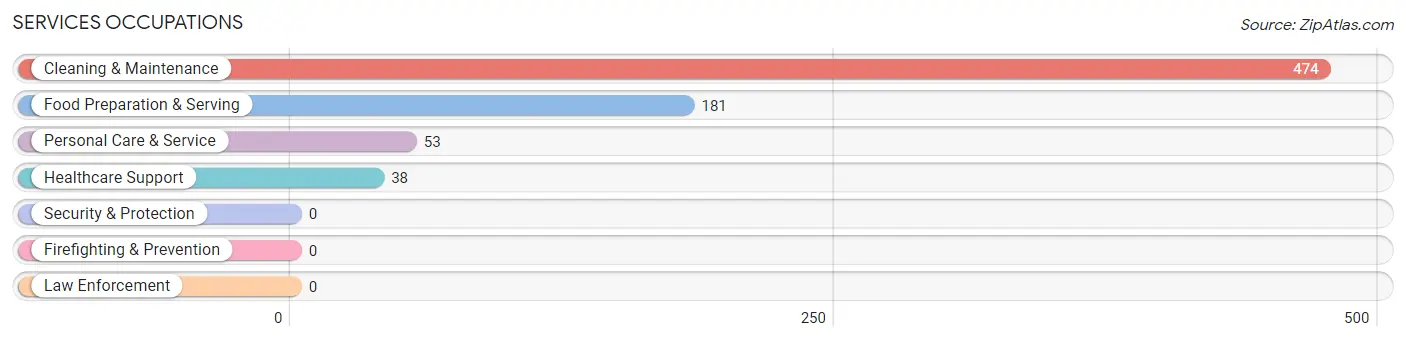
Services Occupations
The most common Services occupations in El Jebel are Cleaning & Maintenance (474 | 17.3%), Food Preparation & Serving (181 | 6.6%), Personal Care & Service (53 | 1.9%), and Healthcare Support (38 | 1.4%).
Services Occupations by Sex
Within the Services occupations in El Jebel, the most male-oriented occupations are Food Preparation & Serving (91.2%), Personal Care & Service (73.6%), and Cleaning & Maintenance (54.2%), while the most female-oriented occupations are Healthcare Support (100.0%), Cleaning & Maintenance (45.8%), and Personal Care & Service (26.4%).
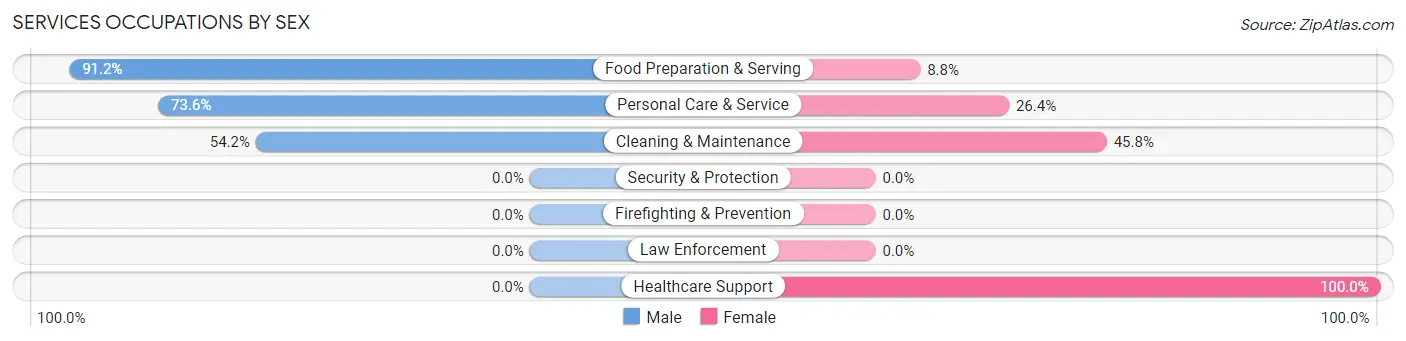
| Occupation | Male | Female |
| Healthcare Support | 0 (0.0%) | 38 (100.0%) |
| Security & Protection | 0 (0.0%) | 0 (0.0%) |
| Firefighting & Prevention | 0 (0.0%) | 0 (0.0%) |
| Law Enforcement | 0 (0.0%) | 0 (0.0%) |
| Food Preparation & Serving | 165 (91.2%) | 16 (8.8%) |
| Cleaning & Maintenance | 257 (54.2%) | 217 (45.8%) |
| Personal Care & Service | 39 (73.6%) | 14 (26.4%) |
| Total (Category) | 461 (61.8%) | 285 (38.2%) |
| Total (Overall) | 1,784 (65.2%) | 951 (34.8%) |
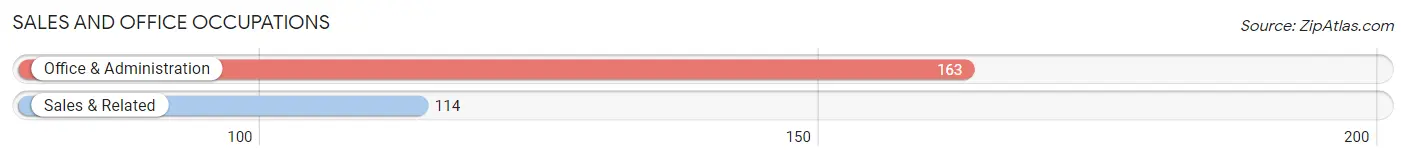
Sales and Office Occupations
The most common Sales and Office occupations in El Jebel are Office & Administration (163 | 6.0%), and Sales & Related (114 | 4.2%).
Sales and Office Occupations by Sex
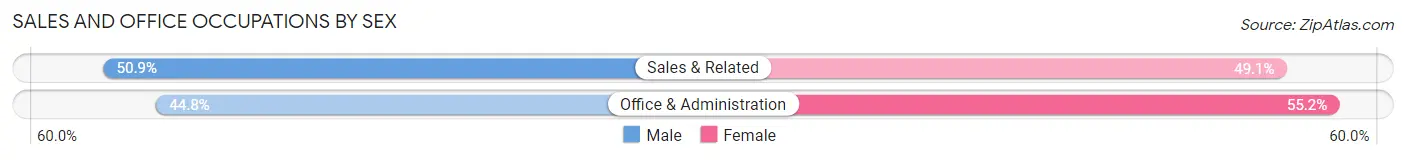
| Occupation | Male | Female |
| Sales & Related | 58 (50.9%) | 56 (49.1%) |
| Office & Administration | 73 (44.8%) | 90 (55.2%) |
| Total (Category) | 131 (47.3%) | 146 (52.7%) |
| Total (Overall) | 1,784 (65.2%) | 951 (34.8%) |
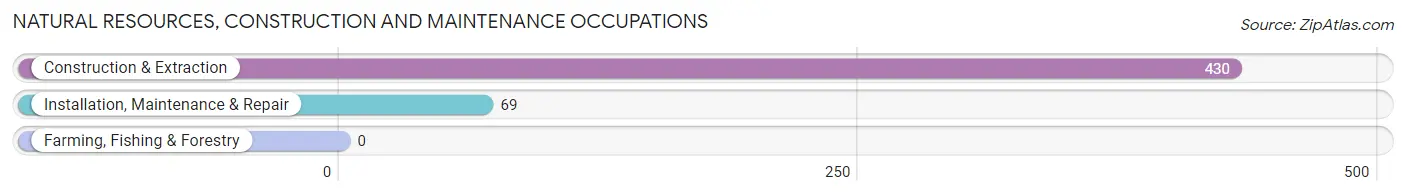
Natural Resources, Construction and Maintenance Occupations
The most common Natural Resources, Construction and Maintenance occupations in El Jebel are Construction & Extraction (430 | 15.7%), and Installation, Maintenance & Repair (69 | 2.5%).
Natural Resources, Construction and Maintenance Occupations by Sex
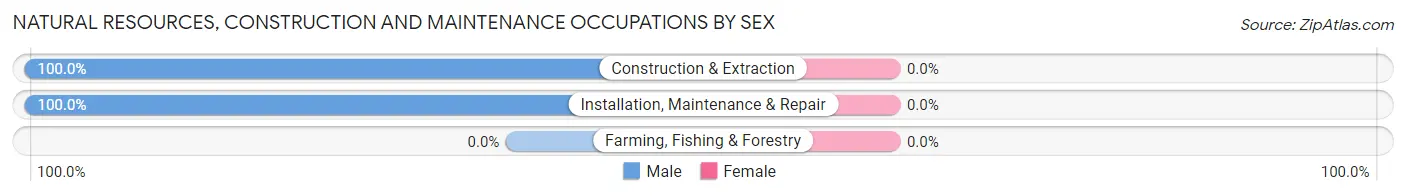
| Occupation | Male | Female |
| Farming, Fishing & Forestry | 0 (0.0%) | 0 (0.0%) |
| Construction & Extraction | 430 (100.0%) | 0 (0.0%) |
| Installation, Maintenance & Repair | 69 (100.0%) | 0 (0.0%) |
| Total (Category) | 499 (100.0%) | 0 (0.0%) |
| Total (Overall) | 1,784 (65.2%) | 951 (34.8%) |
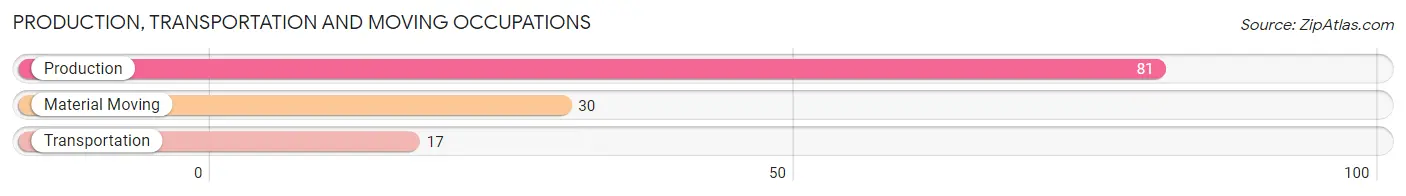
Production, Transportation and Moving Occupations
The most common Production, Transportation and Moving occupations in El Jebel are Production (81 | 3.0%), Material Moving (30 | 1.1%), and Transportation (17 | 0.6%).
Production, Transportation and Moving Occupations by Sex
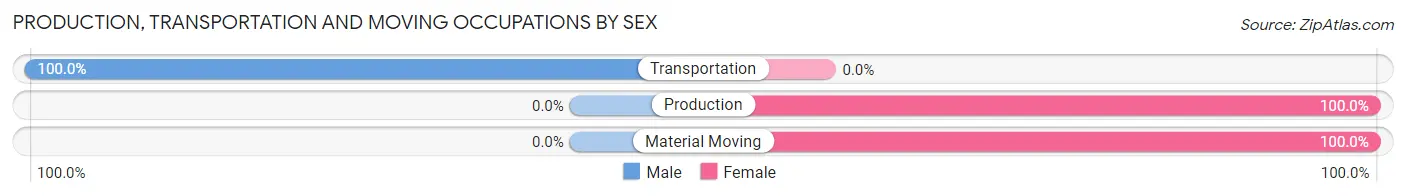
| Occupation | Male | Female |
| Production | 0 (0.0%) | 81 (100.0%) |
| Transportation | 17 (100.0%) | 0 (0.0%) |
| Material Moving | 0 (0.0%) | 30 (100.0%) |
| Total (Category) | 17 (13.3%) | 111 (86.7%) |
| Total (Overall) | 1,784 (65.2%) | 951 (34.8%) |
Employment Industries by Sex in El Jebel
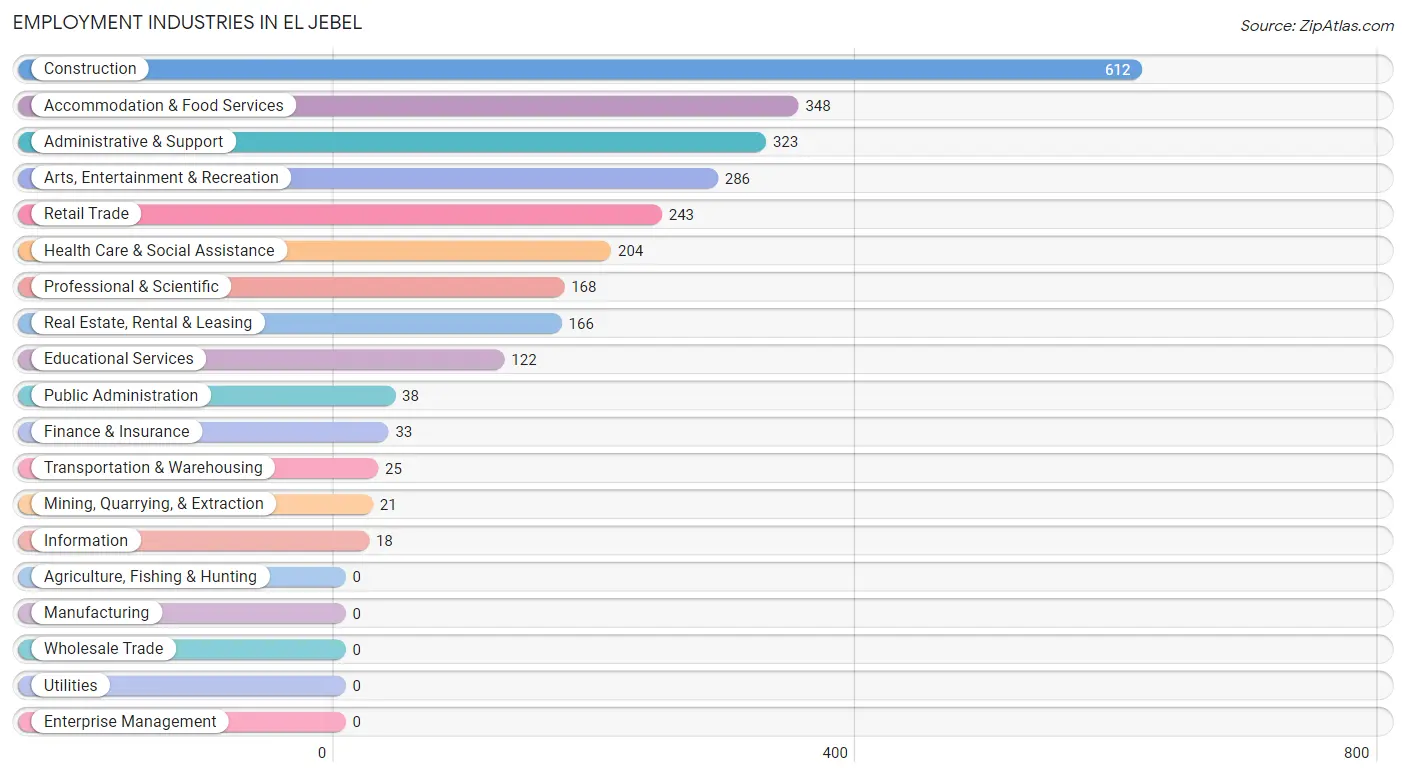
Employment Industries in El Jebel
The major employment industries in El Jebel include Construction (612 | 22.4%), Accommodation & Food Services (348 | 12.7%), Administrative & Support (323 | 11.8%), Arts, Entertainment & Recreation (286 | 10.5%), and Retail Trade (243 | 8.9%).
Employment Industries by Sex in El Jebel
The El Jebel industries that see more men than women are Mining, Quarrying, & Extraction (100.0%), Transportation & Warehousing (100.0%), and Information (100.0%), whereas the industries that tend to have a higher number of women are Public Administration (100.0%), Retail Trade (69.1%), and Educational Services (68.0%).
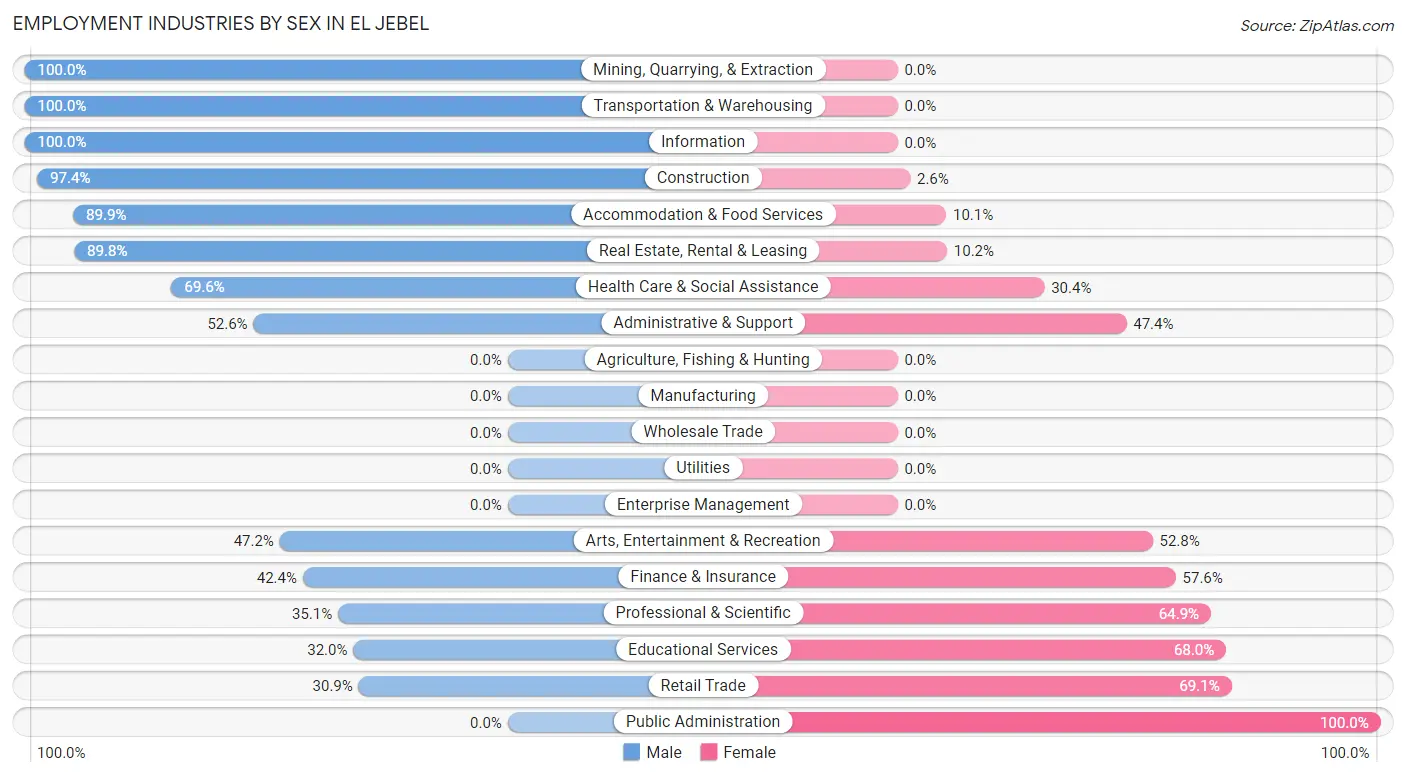
| Industry | Male | Female |
| Agriculture, Fishing & Hunting | 0 (0.0%) | 0 (0.0%) |
| Mining, Quarrying, & Extraction | 21 (100.0%) | 0 (0.0%) |
| Construction | 596 (97.4%) | 16 (2.6%) |
| Manufacturing | 0 (0.0%) | 0 (0.0%) |
| Wholesale Trade | 0 (0.0%) | 0 (0.0%) |
| Retail Trade | 75 (30.9%) | 168 (69.1%) |
| Transportation & Warehousing | 25 (100.0%) | 0 (0.0%) |
| Utilities | 0 (0.0%) | 0 (0.0%) |
| Information | 18 (100.0%) | 0 (0.0%) |
| Finance & Insurance | 14 (42.4%) | 19 (57.6%) |
| Real Estate, Rental & Leasing | 149 (89.8%) | 17 (10.2%) |
| Professional & Scientific | 59 (35.1%) | 109 (64.9%) |
| Enterprise Management | 0 (0.0%) | 0 (0.0%) |
| Administrative & Support | 170 (52.6%) | 153 (47.4%) |
| Educational Services | 39 (32.0%) | 83 (68.0%) |
| Health Care & Social Assistance | 142 (69.6%) | 62 (30.4%) |
| Arts, Entertainment & Recreation | 135 (47.2%) | 151 (52.8%) |
| Accommodation & Food Services | 313 (89.9%) | 35 (10.1%) |
| Public Administration | 0 (0.0%) | 38 (100.0%) |
| Total | 1,784 (65.2%) | 951 (34.8%) |
Education in El Jebel
School Enrollment in El Jebel
The most common levels of schooling among the 909 students in El Jebel are elementary school (324 | 35.6%), middle school (186 | 20.5%), and college / undergraduate (155 | 17.1%).
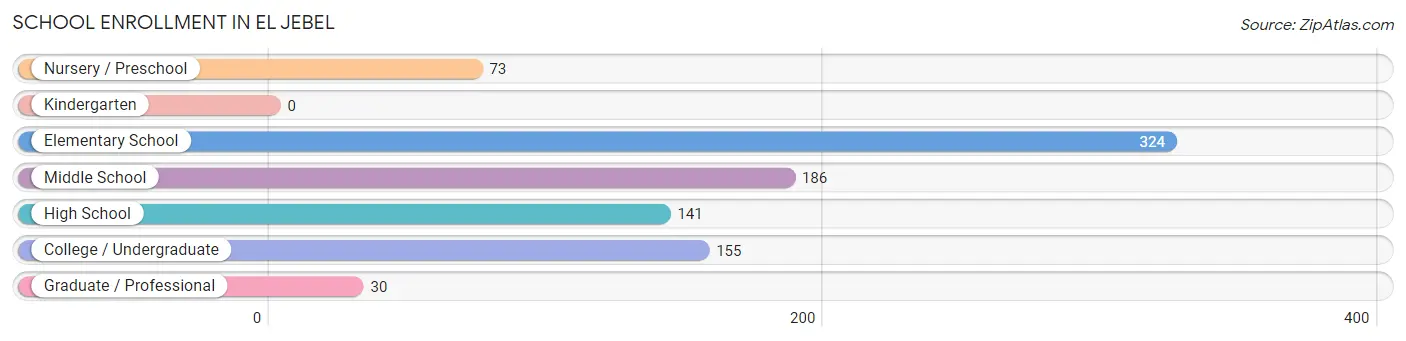
| School Level | # Students | % Students |
| Nursery / Preschool | 73 | 8.0% |
| Kindergarten | 0 | 0.0% |
| Elementary School | 324 | 35.6% |
| Middle School | 186 | 20.5% |
| High School | 141 | 15.5% |
| College / Undergraduate | 155 | 17.1% |
| Graduate / Professional | 30 | 3.3% |
| Total | 909 | 100.0% |
School Enrollment by Age by Funding Source in El Jebel
Out of a total of 909 students who are enrolled in schools in El Jebel, 92 (10.1%) attend a private institution, while the remaining 817 (89.9%) are enrolled in public schools. The age group of 3 to 4 year olds has the highest likelihood of being enrolled in private schools, with 23 (31.5% in the age bracket) enrolled. Conversely, the age group of 5 to 9 year old has the lowest likelihood of being enrolled in a private school, with 251 (100.0% in the age bracket) attending a public institution.
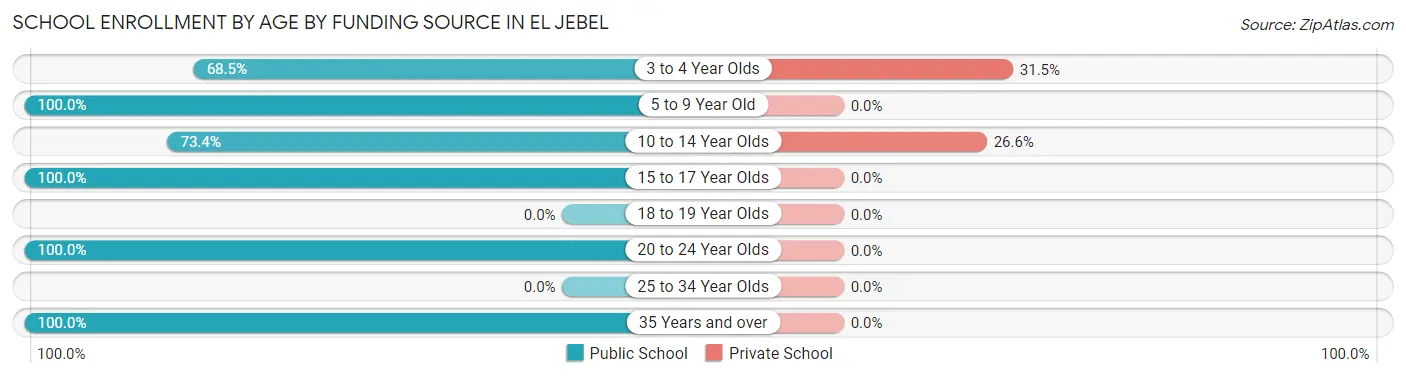
| Age Bracket | Public School | Private School |
| 3 to 4 Year Olds | 50 (68.5%) | 23 (31.5%) |
| 5 to 9 Year Old | 251 (100.0%) | 0 (0.0%) |
| 10 to 14 Year Olds | 190 (73.4%) | 69 (26.6%) |
| 15 to 17 Year Olds | 141 (100.0%) | 0 (0.0%) |
| 18 to 19 Year Olds | 0 (0.0%) | 0 (0.0%) |
| 20 to 24 Year Olds | 69 (100.0%) | 0 (0.0%) |
| 25 to 34 Year Olds | 0 (0.0%) | 0 (0.0%) |
| 35 Years and over | 116 (100.0%) | 0 (0.0%) |
| Total | 817 (89.9%) | 92 (10.1%) |
Educational Attainment by Field of Study in El Jebel
Education (272 | 15.1%), communications (237 | 13.2%), arts & humanities (213 | 11.8%), computers & mathematics (192 | 10.7%), and science & technology (145 | 8.1%) are the most common fields of study among 1,799 individuals in El Jebel who have obtained a bachelor's degree or higher.
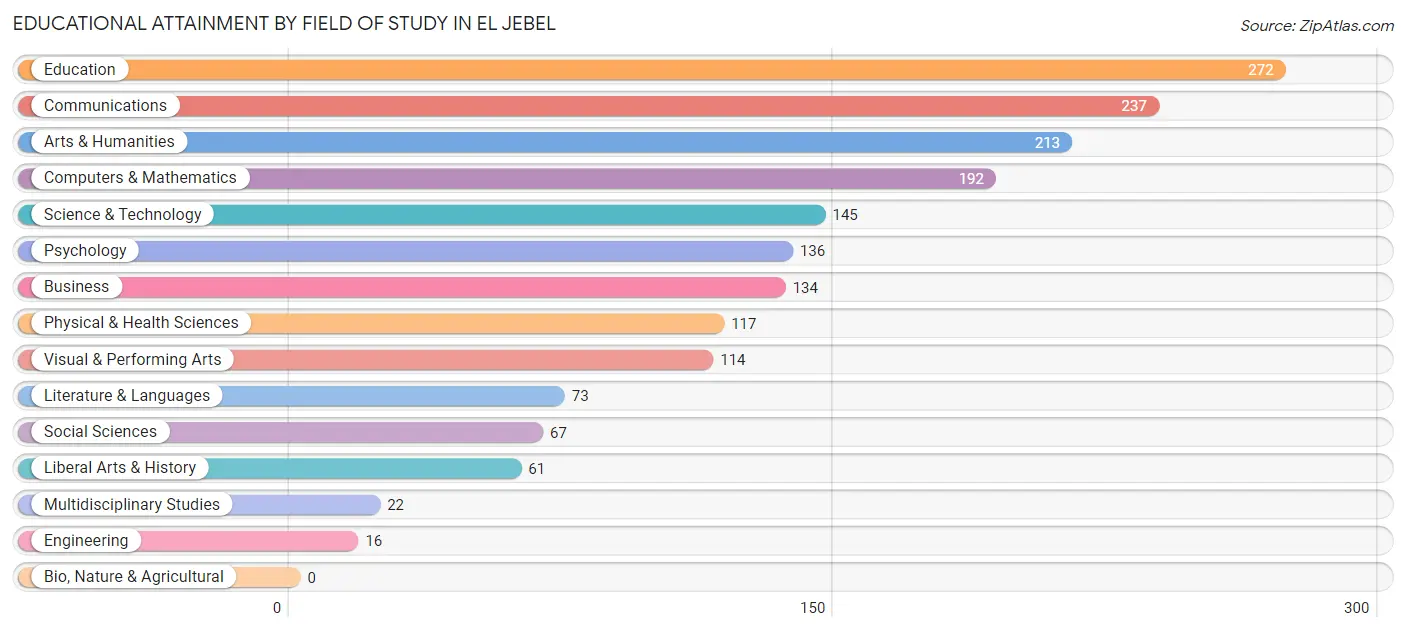
| Field of Study | # Graduates | % Graduates |
| Computers & Mathematics | 192 | 10.7% |
| Bio, Nature & Agricultural | 0 | 0.0% |
| Physical & Health Sciences | 117 | 6.5% |
| Psychology | 136 | 7.6% |
| Social Sciences | 67 | 3.7% |
| Engineering | 16 | 0.9% |
| Multidisciplinary Studies | 22 | 1.2% |
| Science & Technology | 145 | 8.1% |
| Business | 134 | 7.4% |
| Education | 272 | 15.1% |
| Literature & Languages | 73 | 4.1% |
| Liberal Arts & History | 61 | 3.4% |
| Visual & Performing Arts | 114 | 6.3% |
| Communications | 237 | 13.2% |
| Arts & Humanities | 213 | 11.8% |
| Total | 1,799 | 100.0% |
Transportation & Commute in El Jebel
Vehicle Availability by Sex in El Jebel
The most prevalent vehicle ownership categories in El Jebel are males with 3 vehicles (958, accounting for 53.7%) and females with 3 vehicles (198, making up 106.1%).
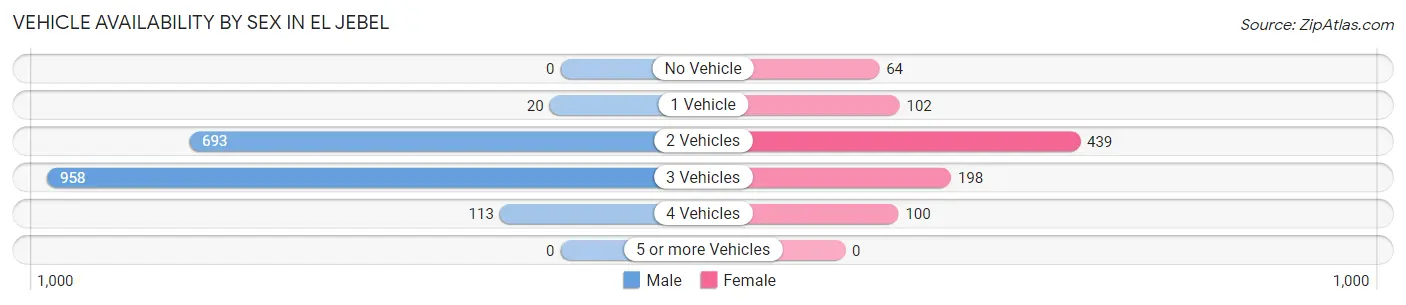
| Vehicles Available | Male | Female |
| No Vehicle | 0 (0.0%) | 64 (7.1%) |
| 1 Vehicle | 20 (1.1%) | 102 (11.3%) |
| 2 Vehicles | 693 (38.9%) | 439 (48.6%) |
| 3 Vehicles | 958 (53.7%) | 198 (21.9%) |
| 4 Vehicles | 113 (6.3%) | 100 (11.1%) |
| 5 or more Vehicles | 0 (0.0%) | 0 (0.0%) |
| Total | 1,784 (100.0%) | 903 (100.0%) |
Commute Time in El Jebel
The most frequently occuring commute durations in El Jebel are 30 to 34 minutes (544 commuters, 23.5%), 35 to 39 minutes (373 commuters, 16.1%), and 15 to 19 minutes (294 commuters, 12.7%).
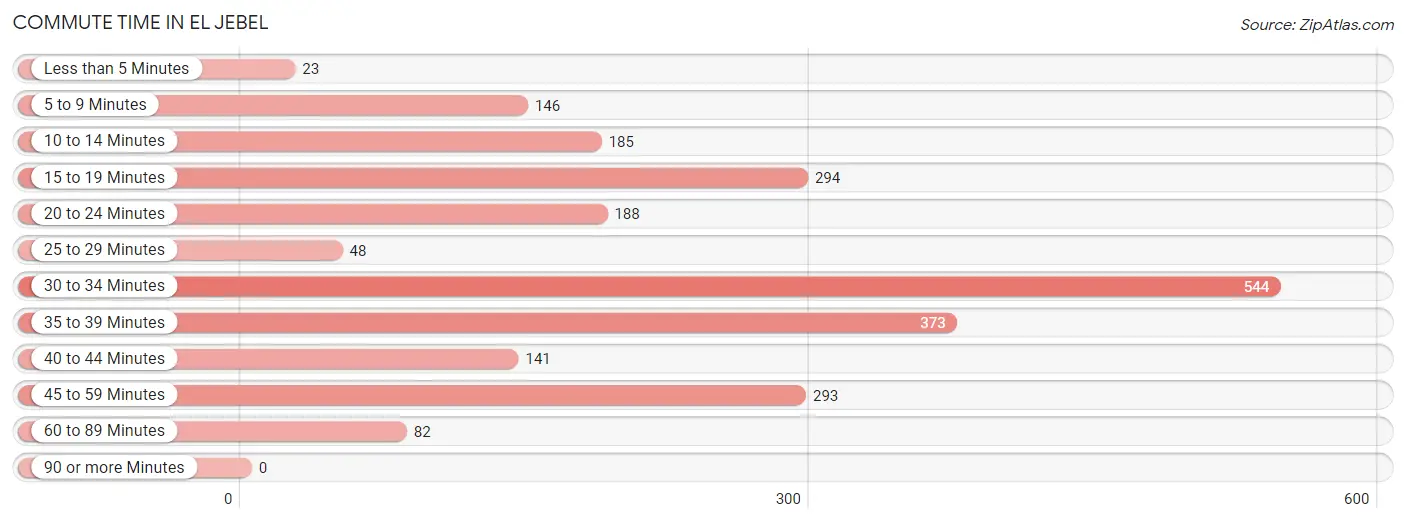
| Commute Time | # Commuters | % Commuters |
| Less than 5 Minutes | 23 | 1.0% |
| 5 to 9 Minutes | 146 | 6.3% |
| 10 to 14 Minutes | 185 | 8.0% |
| 15 to 19 Minutes | 294 | 12.7% |
| 20 to 24 Minutes | 188 | 8.1% |
| 25 to 29 Minutes | 48 | 2.1% |
| 30 to 34 Minutes | 544 | 23.5% |
| 35 to 39 Minutes | 373 | 16.1% |
| 40 to 44 Minutes | 141 | 6.1% |
| 45 to 59 Minutes | 293 | 12.7% |
| 60 to 89 Minutes | 82 | 3.5% |
| 90 or more Minutes | 0 | 0.0% |
Commute Time by Sex in El Jebel
The most common commute times in El Jebel are 30 to 34 minutes (442 commuters, 27.4%) for males and 40 to 44 minutes (122 commuters, 17.3%) for females.
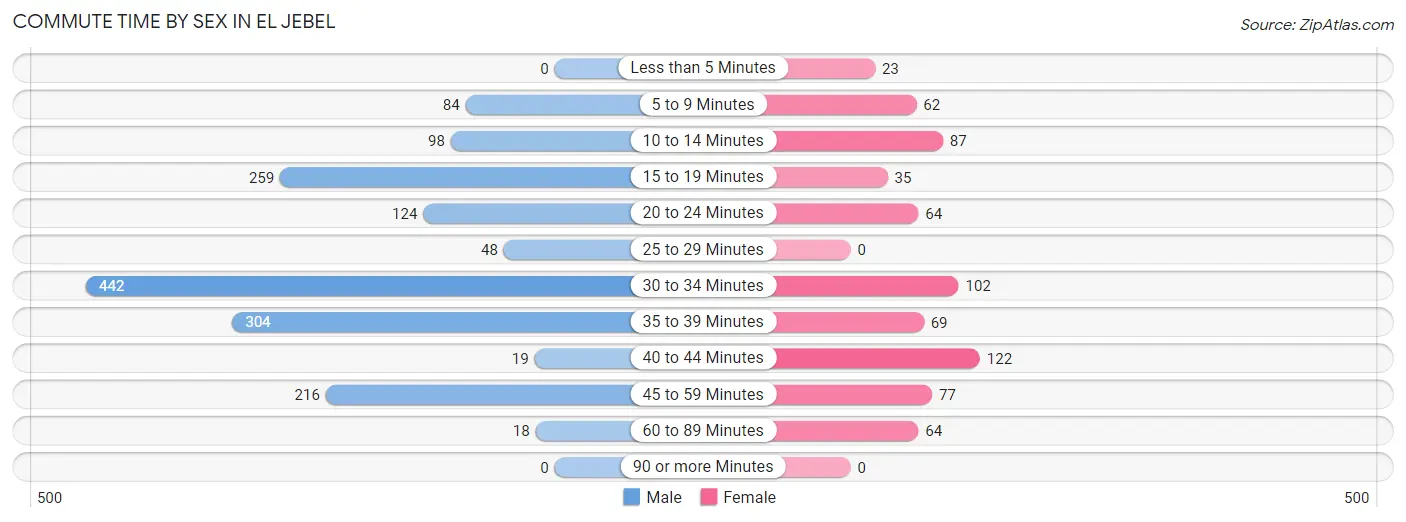
| Commute Time | Male | Female |
| Less than 5 Minutes | 0 (0.0%) | 23 (3.3%) |
| 5 to 9 Minutes | 84 (5.2%) | 62 (8.8%) |
| 10 to 14 Minutes | 98 (6.1%) | 87 (12.3%) |
| 15 to 19 Minutes | 259 (16.1%) | 35 (5.0%) |
| 20 to 24 Minutes | 124 (7.7%) | 64 (9.1%) |
| 25 to 29 Minutes | 48 (3.0%) | 0 (0.0%) |
| 30 to 34 Minutes | 442 (27.4%) | 102 (14.5%) |
| 35 to 39 Minutes | 304 (18.9%) | 69 (9.8%) |
| 40 to 44 Minutes | 19 (1.2%) | 122 (17.3%) |
| 45 to 59 Minutes | 216 (13.4%) | 77 (10.9%) |
| 60 to 89 Minutes | 18 (1.1%) | 64 (9.1%) |
| 90 or more Minutes | 0 (0.0%) | 0 (0.0%) |
Time of Departure to Work by Sex in El Jebel
The most frequent times of departure to work in El Jebel are 7:00 AM to 7:29 AM (468, 29.0%) for males and 7:00 AM to 7:29 AM (163, 23.1%) for females.
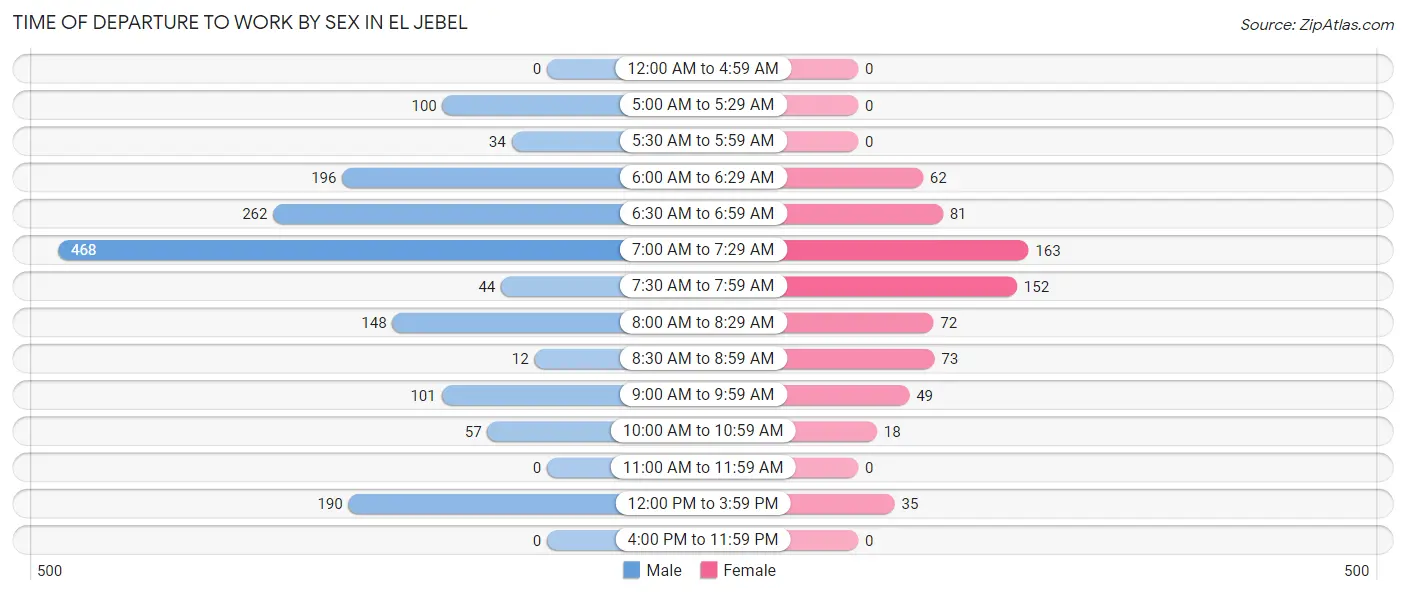
| Time of Departure | Male | Female |
| 12:00 AM to 4:59 AM | 0 (0.0%) | 0 (0.0%) |
| 5:00 AM to 5:29 AM | 100 (6.2%) | 0 (0.0%) |
| 5:30 AM to 5:59 AM | 34 (2.1%) | 0 (0.0%) |
| 6:00 AM to 6:29 AM | 196 (12.2%) | 62 (8.8%) |
| 6:30 AM to 6:59 AM | 262 (16.3%) | 81 (11.5%) |
| 7:00 AM to 7:29 AM | 468 (29.0%) | 163 (23.1%) |
| 7:30 AM to 7:59 AM | 44 (2.7%) | 152 (21.6%) |
| 8:00 AM to 8:29 AM | 148 (9.2%) | 72 (10.2%) |
| 8:30 AM to 8:59 AM | 12 (0.7%) | 73 (10.3%) |
| 9:00 AM to 9:59 AM | 101 (6.3%) | 49 (7.0%) |
| 10:00 AM to 10:59 AM | 57 (3.5%) | 18 (2.5%) |
| 11:00 AM to 11:59 AM | 0 (0.0%) | 0 (0.0%) |
| 12:00 PM to 3:59 PM | 190 (11.8%) | 35 (5.0%) |
| 4:00 PM to 11:59 PM | 0 (0.0%) | 0 (0.0%) |
| Total | 1,612 (100.0%) | 705 (100.0%) |
Housing Occupancy in El Jebel
Occupancy by Ownership in El Jebel
Of the total 1,494 dwellings in El Jebel, owner-occupied units account for 1,117 (74.8%), while renter-occupied units make up 377 (25.2%).
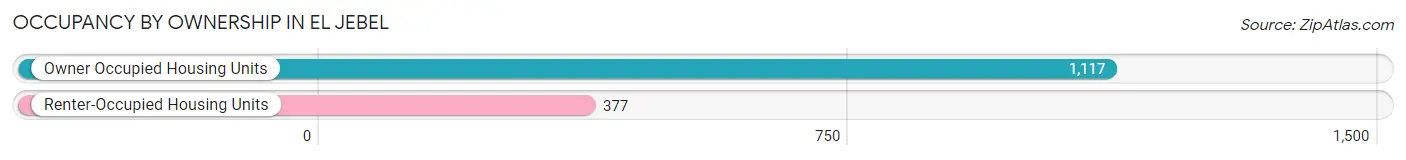
| Occupancy | # Housing Units | % Housing Units |
| Owner Occupied Housing Units | 1,117 | 74.8% |
| Renter-Occupied Housing Units | 377 | 25.2% |
| Total Occupied Housing Units | 1,494 | 100.0% |
Occupancy by Household Size in El Jebel
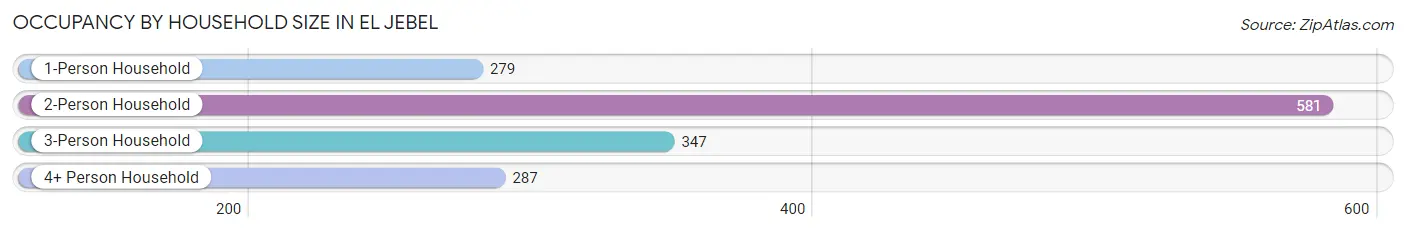
| Household Size | # Housing Units | % Housing Units |
| 1-Person Household | 279 | 18.7% |
| 2-Person Household | 581 | 38.9% |
| 3-Person Household | 347 | 23.2% |
| 4+ Person Household | 287 | 19.2% |
| Total Housing Units | 1,494 | 100.0% |
Occupancy by Ownership by Household Size in El Jebel
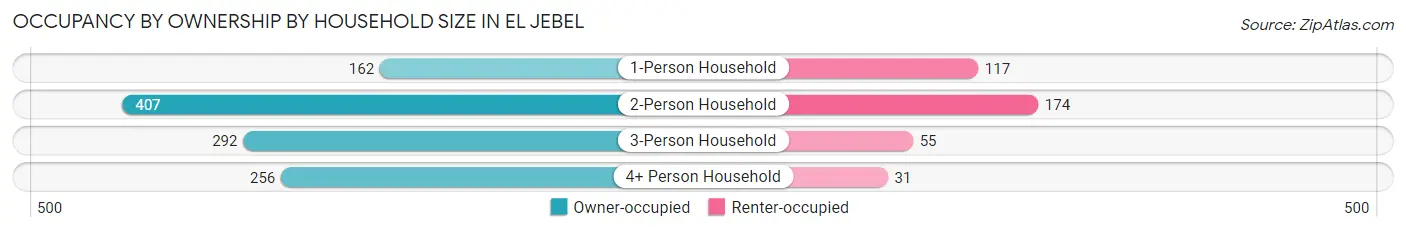
| Household Size | Owner-occupied | Renter-occupied |
| 1-Person Household | 162 (58.1%) | 117 (41.9%) |
| 2-Person Household | 407 (70.1%) | 174 (29.9%) |
| 3-Person Household | 292 (84.2%) | 55 (15.9%) |
| 4+ Person Household | 256 (89.2%) | 31 (10.8%) |
| Total Housing Units | 1,117 (74.8%) | 377 (25.2%) |
Occupancy by Educational Attainment in El Jebel
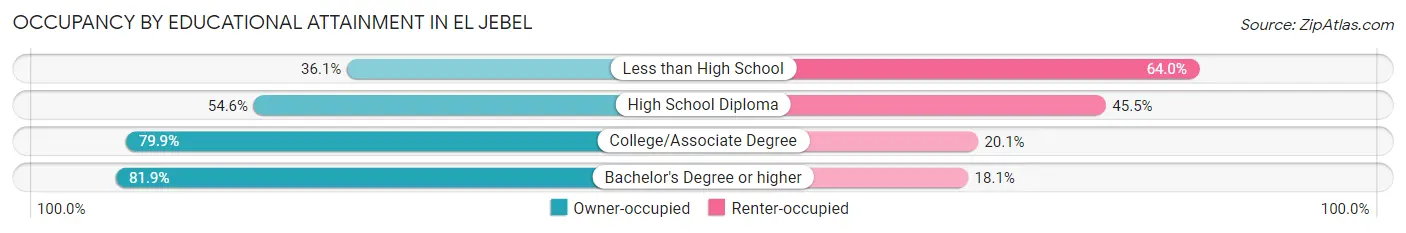
| Household Size | Owner-occupied | Renter-occupied |
| Less than High School | 31 (36.0%) | 55 (63.9%) |
| High School Diploma | 114 (54.5%) | 95 (45.5%) |
| College/Associate Degree | 390 (79.9%) | 98 (20.1%) |
| Bachelor's Degree or higher | 582 (81.9%) | 129 (18.1%) |
Occupancy by Age of Householder in El Jebel
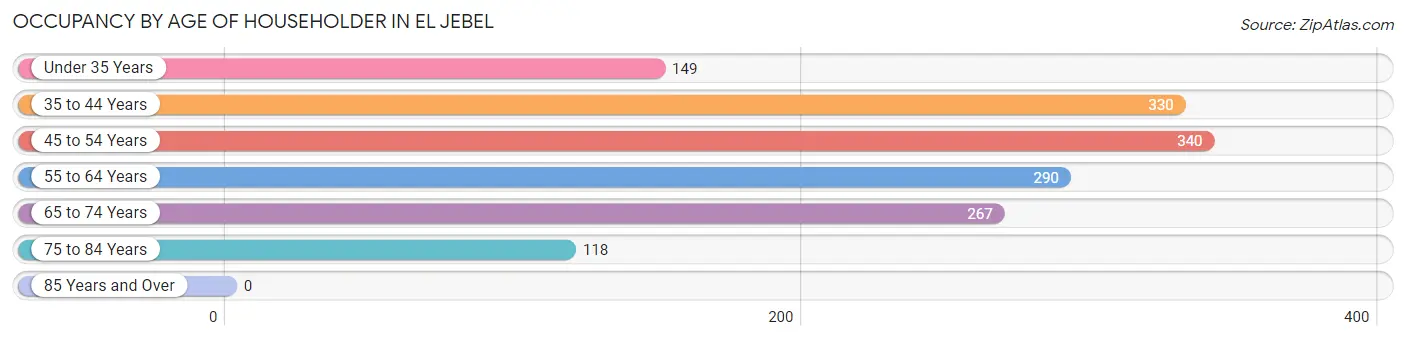
| Age Bracket | # Households | % Households |
| Under 35 Years | 149 | 10.0% |
| 35 to 44 Years | 330 | 22.1% |
| 45 to 54 Years | 340 | 22.8% |
| 55 to 64 Years | 290 | 19.4% |
| 65 to 74 Years | 267 | 17.9% |
| 75 to 84 Years | 118 | 7.9% |
| 85 Years and Over | 0 | 0.0% |
| Total | 1,494 | 100.0% |
Housing Finances in El Jebel
Median Income by Occupancy in El Jebel
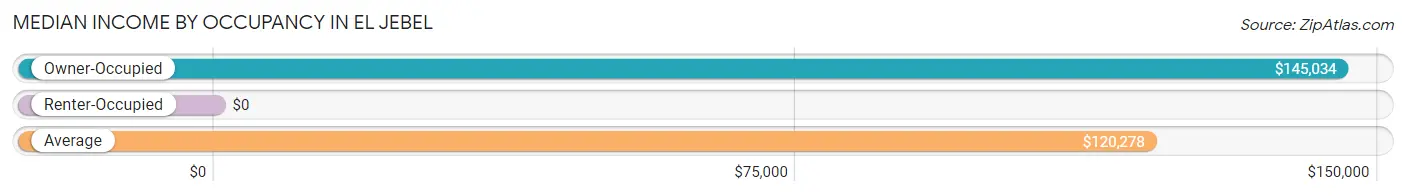
| Occupancy Type | # Households | Median Income |
| Owner-Occupied | 1,117 (74.8%) | $145,034 |
| Renter-Occupied | 377 (25.2%) | $0 |
| Average | 1,494 (100.0%) | $120,278 |
Occupancy by Householder Income Bracket in El Jebel
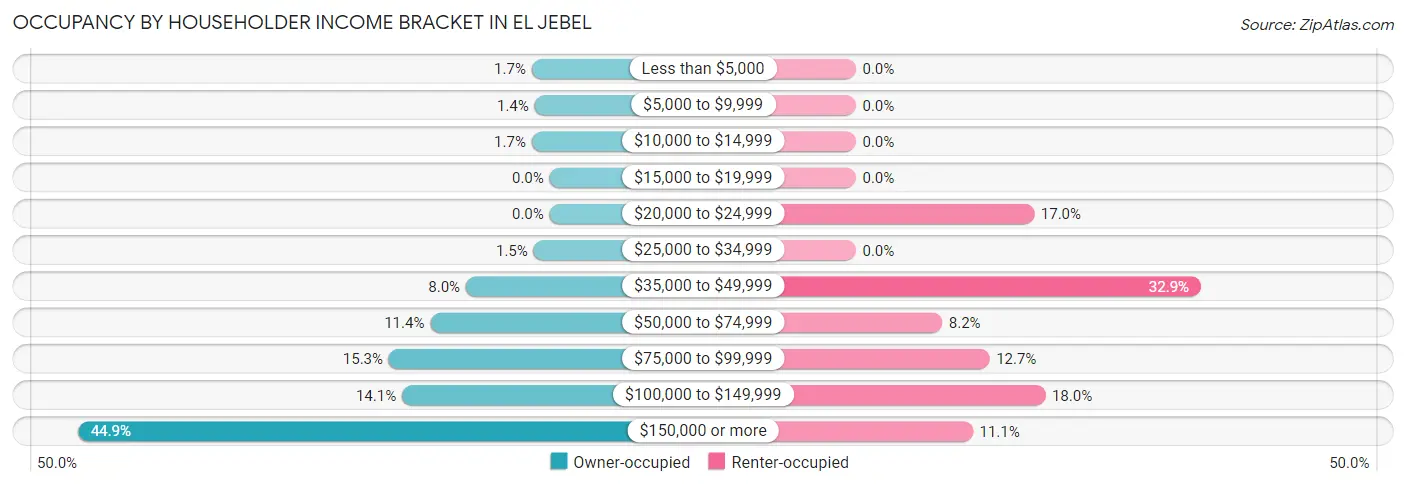
| Income Bracket | Owner-occupied | Renter-occupied |
| Less than $5,000 | 19 (1.7%) | 0 (0.0%) |
| $5,000 to $9,999 | 16 (1.4%) | 0 (0.0%) |
| $10,000 to $14,999 | 19 (1.7%) | 0 (0.0%) |
| $15,000 to $19,999 | 0 (0.0%) | 0 (0.0%) |
| $20,000 to $24,999 | 0 (0.0%) | 64 (17.0%) |
| $25,000 to $34,999 | 17 (1.5%) | 0 (0.0%) |
| $35,000 to $49,999 | 89 (8.0%) | 124 (32.9%) |
| $50,000 to $74,999 | 127 (11.4%) | 31 (8.2%) |
| $75,000 to $99,999 | 171 (15.3%) | 48 (12.7%) |
| $100,000 to $149,999 | 157 (14.1%) | 68 (18.0%) |
| $150,000 or more | 502 (44.9%) | 42 (11.1%) |
| Total | 1,117 (100.0%) | 377 (100.0%) |
Monthly Housing Cost Tiers in El Jebel
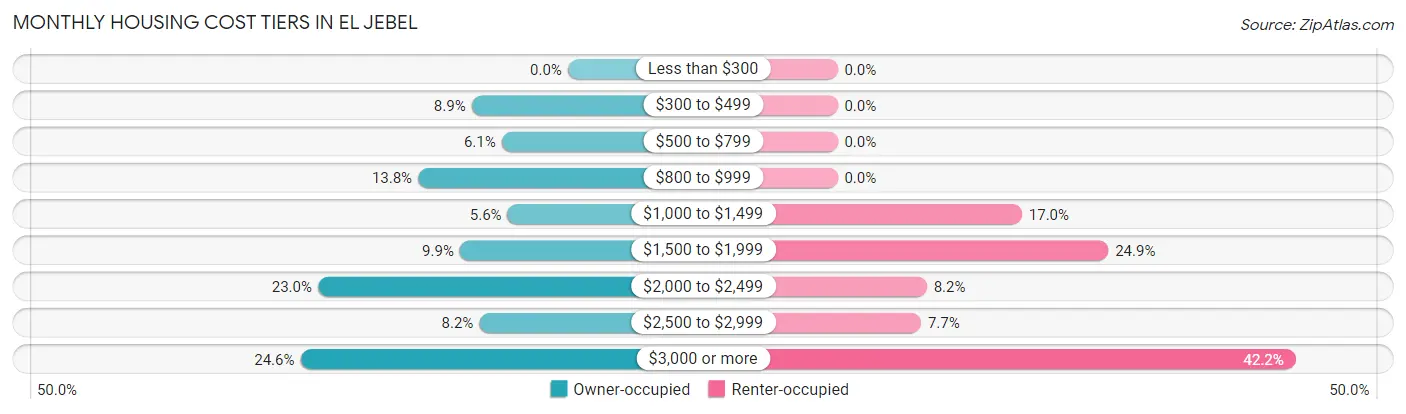
| Monthly Cost | Owner-occupied | Renter-occupied |
| Less than $300 | 0 (0.0%) | 0 (0.0%) |
| $300 to $499 | 99 (8.9%) | 0 (0.0%) |
| $500 to $799 | 68 (6.1%) | 0 (0.0%) |
| $800 to $999 | 154 (13.8%) | 0 (0.0%) |
| $1,000 to $1,499 | 62 (5.6%) | 64 (17.0%) |
| $1,500 to $1,999 | 111 (9.9%) | 94 (24.9%) |
| $2,000 to $2,499 | 257 (23.0%) | 31 (8.2%) |
| $2,500 to $2,999 | 91 (8.2%) | 29 (7.7%) |
| $3,000 or more | 275 (24.6%) | 159 (42.2%) |
| Total | 1,117 (100.0%) | 377 (100.0%) |
Physical Housing Characteristics in El Jebel
Housing Structures in El Jebel
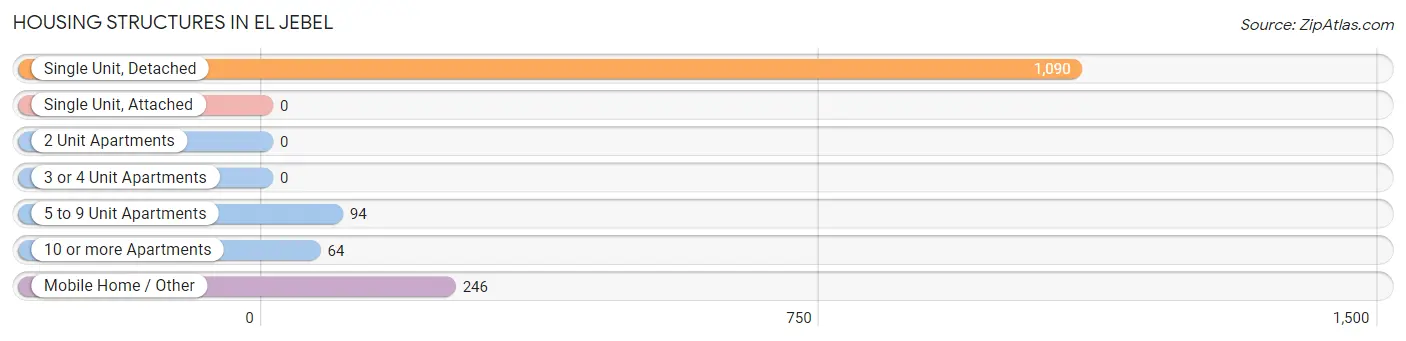
| Structure Type | # Housing Units | % Housing Units |
| Single Unit, Detached | 1,090 | 73.0% |
| Single Unit, Attached | 0 | 0.0% |
| 2 Unit Apartments | 0 | 0.0% |
| 3 or 4 Unit Apartments | 0 | 0.0% |
| 5 to 9 Unit Apartments | 94 | 6.3% |
| 10 or more Apartments | 64 | 4.3% |
| Mobile Home / Other | 246 | 16.5% |
| Total | 1,494 | 100.0% |
Housing Structures by Occupancy in El Jebel
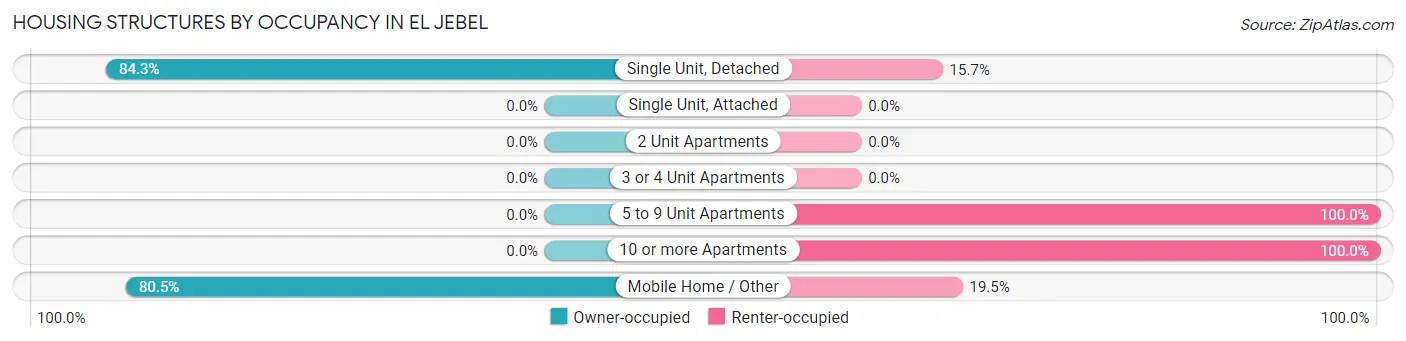
| Structure Type | Owner-occupied | Renter-occupied |
| Single Unit, Detached | 919 (84.3%) | 171 (15.7%) |
| Single Unit, Attached | 0 (0.0%) | 0 (0.0%) |
| 2 Unit Apartments | 0 (0.0%) | 0 (0.0%) |
| 3 or 4 Unit Apartments | 0 (0.0%) | 0 (0.0%) |
| 5 to 9 Unit Apartments | 0 (0.0%) | 94 (100.0%) |
| 10 or more Apartments | 0 (0.0%) | 64 (100.0%) |
| Mobile Home / Other | 198 (80.5%) | 48 (19.5%) |
| Total | 1,117 (74.8%) | 377 (25.2%) |
Housing Structures by Number of Rooms in El Jebel
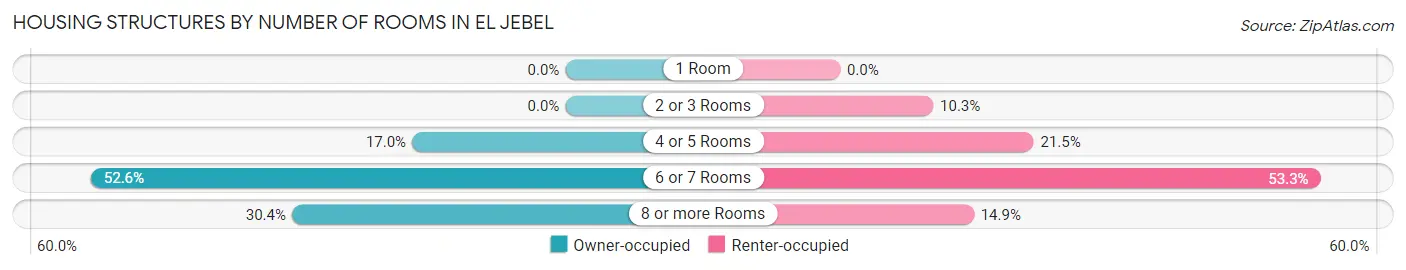
| Number of Rooms | Owner-occupied | Renter-occupied |
| 1 Room | 0 (0.0%) | 0 (0.0%) |
| 2 or 3 Rooms | 0 (0.0%) | 39 (10.3%) |
| 4 or 5 Rooms | 190 (17.0%) | 81 (21.5%) |
| 6 or 7 Rooms | 588 (52.6%) | 201 (53.3%) |
| 8 or more Rooms | 339 (30.3%) | 56 (14.8%) |
| Total | 1,117 (100.0%) | 377 (100.0%) |
Housing Structure by Heating Type in El Jebel
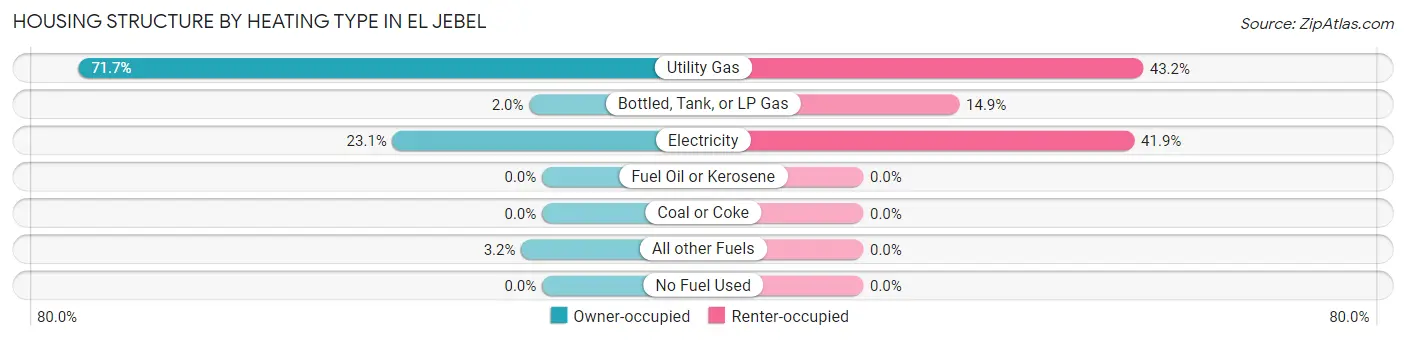
| Heating Type | Owner-occupied | Renter-occupied |
| Utility Gas | 801 (71.7%) | 163 (43.2%) |
| Bottled, Tank, or LP Gas | 22 (2.0%) | 56 (14.8%) |
| Electricity | 258 (23.1%) | 158 (41.9%) |
| Fuel Oil or Kerosene | 0 (0.0%) | 0 (0.0%) |
| Coal or Coke | 0 (0.0%) | 0 (0.0%) |
| All other Fuels | 36 (3.2%) | 0 (0.0%) |
| No Fuel Used | 0 (0.0%) | 0 (0.0%) |
| Total | 1,117 (100.0%) | 377 (100.0%) |
Household Vehicle Usage in El Jebel
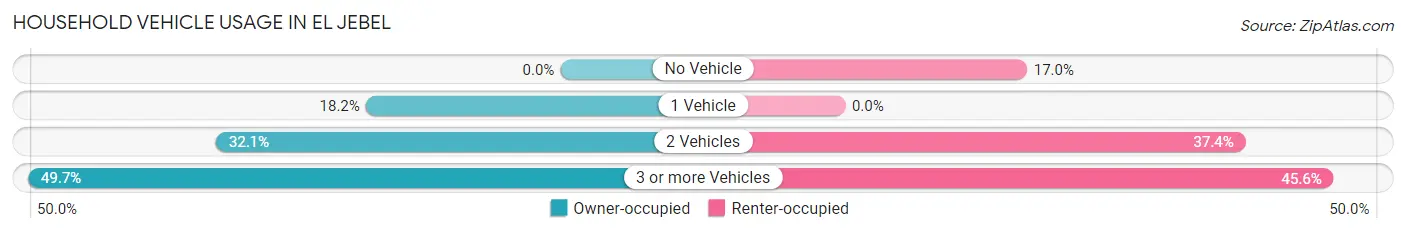
| Vehicles per Household | Owner-occupied | Renter-occupied |
| No Vehicle | 0 (0.0%) | 64 (17.0%) |
| 1 Vehicle | 203 (18.2%) | 0 (0.0%) |
| 2 Vehicles | 359 (32.1%) | 141 (37.4%) |
| 3 or more Vehicles | 555 (49.7%) | 172 (45.6%) |
| Total | 1,117 (100.0%) | 377 (100.0%) |
Real Estate & Mortgages in El Jebel
Real Estate and Mortgage Overview in El Jebel
| Characteristic | Without Mortgage | With Mortgage |
| Housing Units | 348 | 769 |
| Median Property Value | $404,800 | $848,800 |
| Median Household Income | $124,556 | $339 |
| Monthly Housing Costs | $906 | $275 |
| Real Estate Taxes | $1,809 | $39 |
Property Value by Mortgage Status in El Jebel
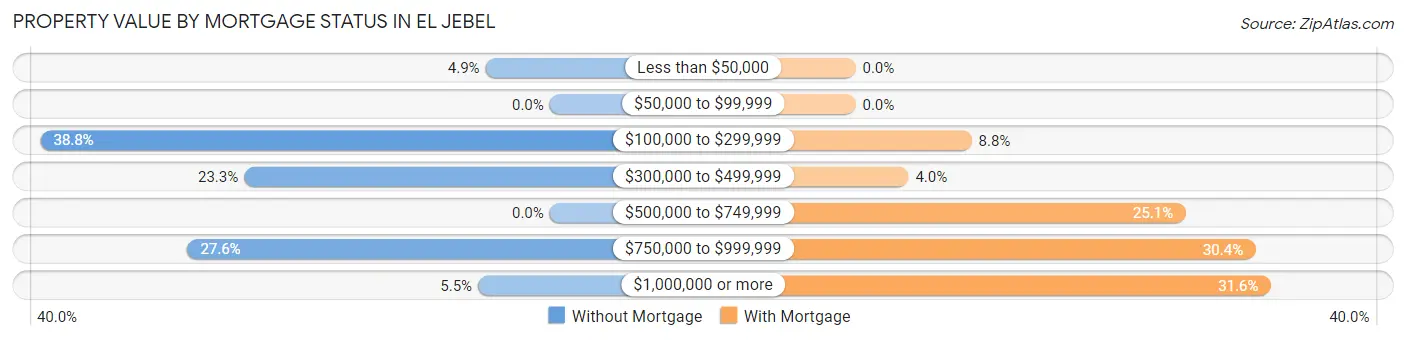
| Property Value | Without Mortgage | With Mortgage |
| Less than $50,000 | 17 (4.9%) | 0 (0.0%) |
| $50,000 to $99,999 | 0 (0.0%) | 0 (0.0%) |
| $100,000 to $299,999 | 135 (38.8%) | 68 (8.8%) |
| $300,000 to $499,999 | 81 (23.3%) | 31 (4.0%) |
| $500,000 to $749,999 | 0 (0.0%) | 193 (25.1%) |
| $750,000 to $999,999 | 96 (27.6%) | 234 (30.4%) |
| $1,000,000 or more | 19 (5.5%) | 243 (31.6%) |
| Total | 348 (100.0%) | 769 (100.0%) |
Household Income by Mortgage Status in El Jebel
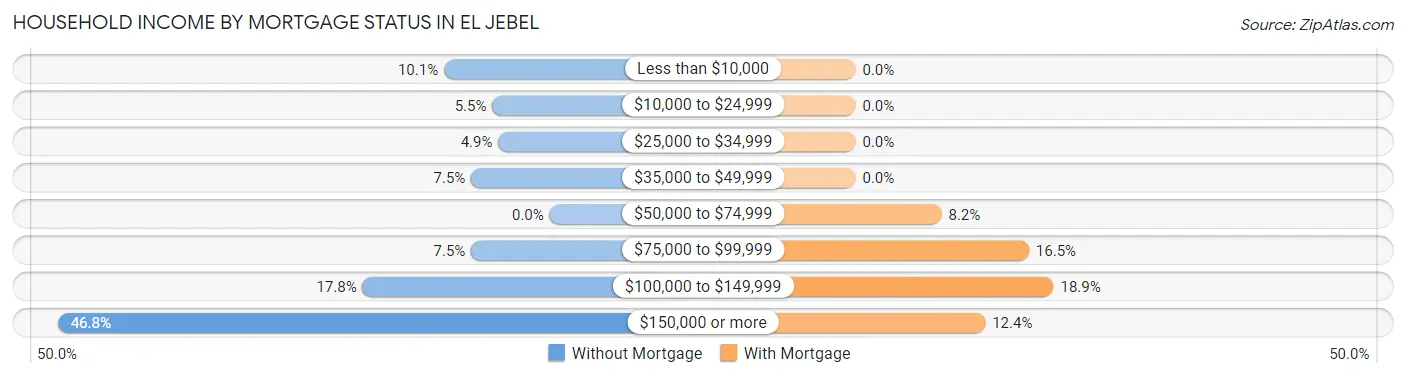
| Household Income | Without Mortgage | With Mortgage |
| Less than $10,000 | 35 (10.1%) | 0 (0.0%) |
| $10,000 to $24,999 | 19 (5.5%) | 0 (0.0%) |
| $25,000 to $34,999 | 17 (4.9%) | 0 (0.0%) |
| $35,000 to $49,999 | 26 (7.5%) | 0 (0.0%) |
| $50,000 to $74,999 | 0 (0.0%) | 63 (8.2%) |
| $75,000 to $99,999 | 26 (7.5%) | 127 (16.5%) |
| $100,000 to $149,999 | 62 (17.8%) | 145 (18.9%) |
| $150,000 or more | 163 (46.8%) | 95 (12.3%) |
| Total | 348 (100.0%) | 769 (100.0%) |
Property Value to Household Income Ratio in El Jebel
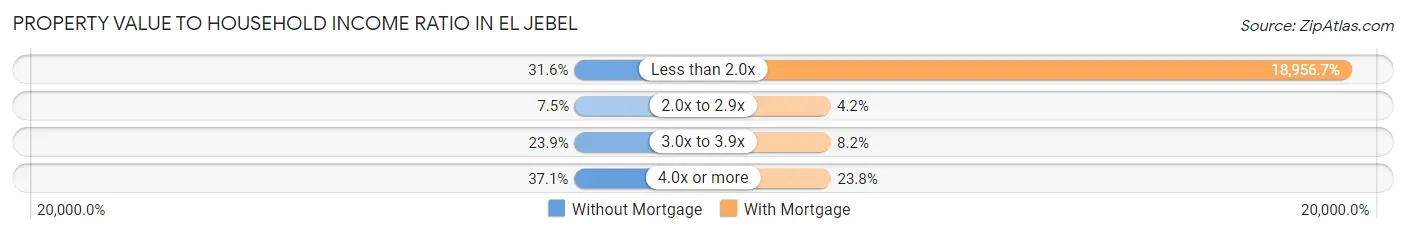
| Value-to-Income Ratio | Without Mortgage | With Mortgage |
| Less than 2.0x | 110 (31.6%) | 145,777 (18,956.7%) |
| 2.0x to 2.9x | 26 (7.5%) | 32 (4.2%) |
| 3.0x to 3.9x | 83 (23.8%) | 63 (8.2%) |
| 4.0x or more | 129 (37.1%) | 183 (23.8%) |
| Total | 348 (100.0%) | 769 (100.0%) |
Real Estate Taxes by Mortgage Status in El Jebel

| Property Taxes | Without Mortgage | With Mortgage |
| Less than $800 | 114 (32.8%) | 0 (0.0%) |
| $800 to $1,499 | 0 (0.0%) | 0 (0.0%) |
| $800 to $1,499 | 234 (67.2%) | 49 (6.4%) |
| Total | 348 (100.0%) | 769 (100.0%) |
Health & Disability in El Jebel
Health Insurance Coverage by Age in El Jebel
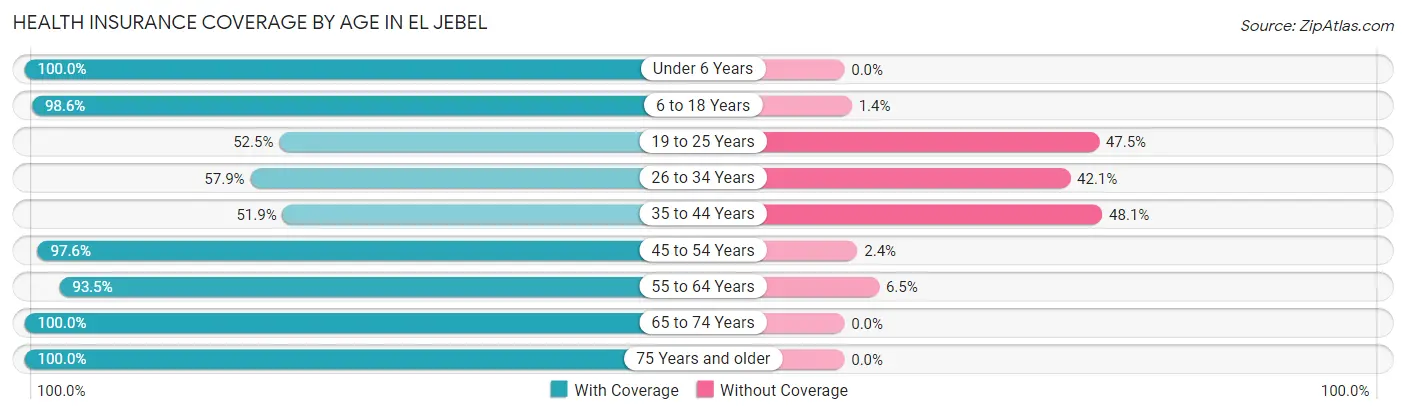
| Age Bracket | With Coverage | Without Coverage |
| Under 6 Years | 230 (100.0%) | 0 (0.0%) |
| 6 to 18 Years | 642 (98.6%) | 9 (1.4%) |
| 19 to 25 Years | 167 (52.5%) | 151 (47.5%) |
| 26 to 34 Years | 220 (57.9%) | 160 (42.1%) |
| 35 to 44 Years | 531 (51.9%) | 492 (48.1%) |
| 45 to 54 Years | 684 (97.6%) | 17 (2.4%) |
| 55 to 64 Years | 477 (93.5%) | 33 (6.5%) |
| 65 to 74 Years | 322 (100.0%) | 0 (0.0%) |
| 75 Years and older | 193 (100.0%) | 0 (0.0%) |
| Total | 3,466 (80.1%) | 862 (19.9%) |
Health Insurance Coverage by Citizenship Status in El Jebel
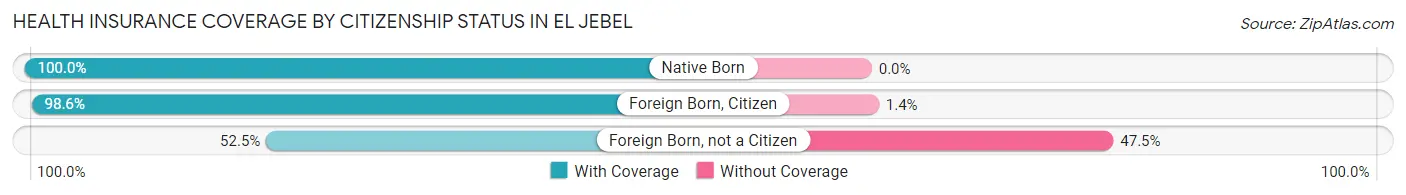
| Citizenship Status | With Coverage | Without Coverage |
| Native Born | 230 (100.0%) | 0 (0.0%) |
| Foreign Born, Citizen | 642 (98.6%) | 9 (1.4%) |
| Foreign Born, not a Citizen | 167 (52.5%) | 151 (47.5%) |
Health Insurance Coverage by Household Income in El Jebel
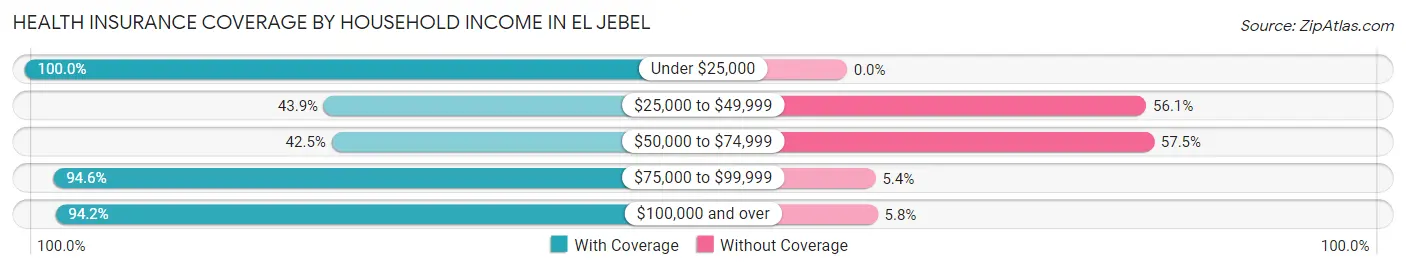
| Household Income | With Coverage | Without Coverage |
| Under $25,000 | 187 (100.0%) | 0 (0.0%) |
| $25,000 to $49,999 | 159 (43.9%) | 203 (56.1%) |
| $50,000 to $74,999 | 364 (42.5%) | 493 (57.5%) |
| $75,000 to $99,999 | 582 (94.6%) | 33 (5.4%) |
| $100,000 and over | 2,174 (94.2%) | 133 (5.8%) |
Public vs Private Health Insurance Coverage by Age in El Jebel
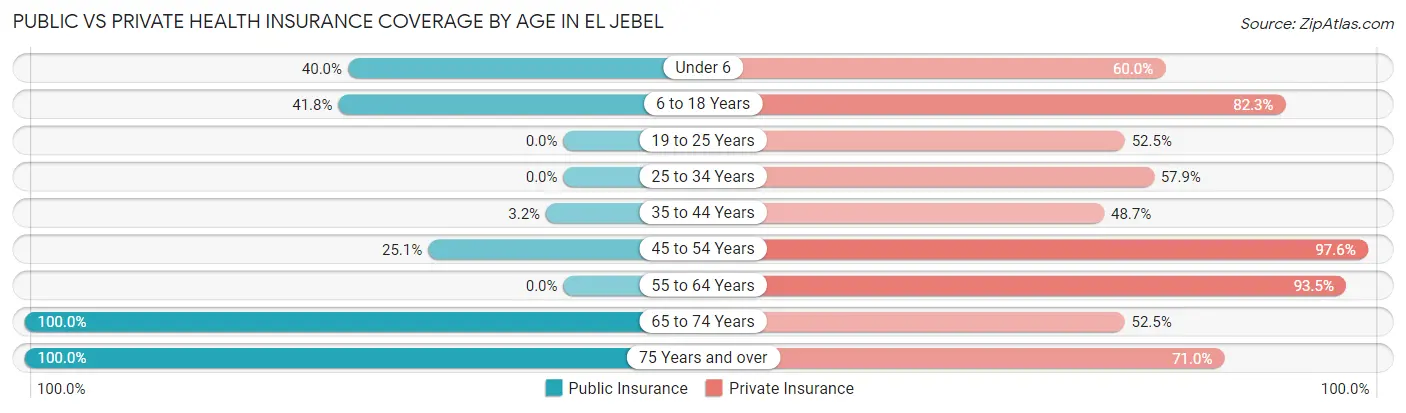
| Age Bracket | Public Insurance | Private Insurance |
| Under 6 | 92 (40.0%) | 138 (60.0%) |
| 6 to 18 Years | 272 (41.8%) | 536 (82.3%) |
| 19 to 25 Years | 0 (0.0%) | 167 (52.5%) |
| 25 to 34 Years | 0 (0.0%) | 220 (57.9%) |
| 35 to 44 Years | 33 (3.2%) | 498 (48.7%) |
| 45 to 54 Years | 176 (25.1%) | 684 (97.6%) |
| 55 to 64 Years | 0 (0.0%) | 477 (93.5%) |
| 65 to 74 Years | 322 (100.0%) | 169 (52.5%) |
| 75 Years and over | 193 (100.0%) | 137 (71.0%) |
| Total | 1,088 (25.1%) | 3,026 (69.9%) |
Disability Status by Sex by Age in El Jebel
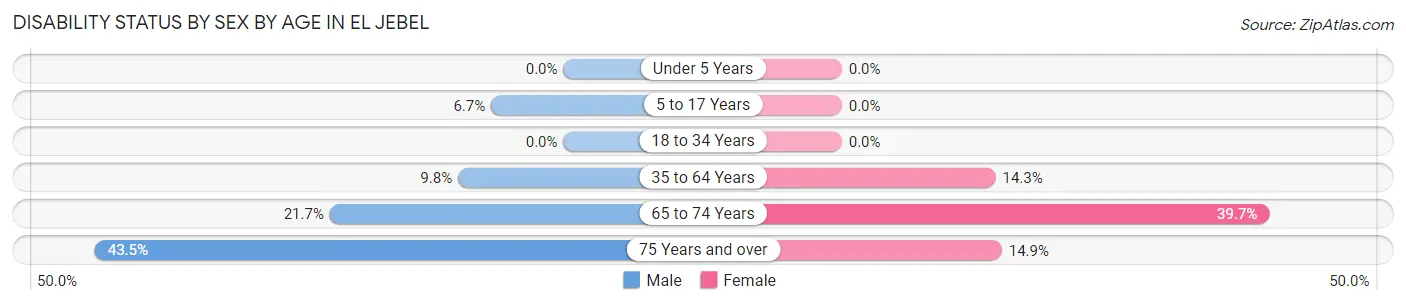
| Age Bracket | Male | Female |
| Under 5 Years | 0 (0.0%) | 0 (0.0%) |
| 5 to 17 Years | 20 (6.7%) | 0 (0.0%) |
| 18 to 34 Years | 0 (0.0%) | 0 (0.0%) |
| 35 to 64 Years | 139 (9.8%) | 116 (14.3%) |
| 65 to 74 Years | 31 (21.7%) | 71 (39.7%) |
| 75 Years and over | 40 (43.5%) | 15 (14.8%) |
Disability Class by Sex by Age in El Jebel
Disability Class: Hearing Difficulty
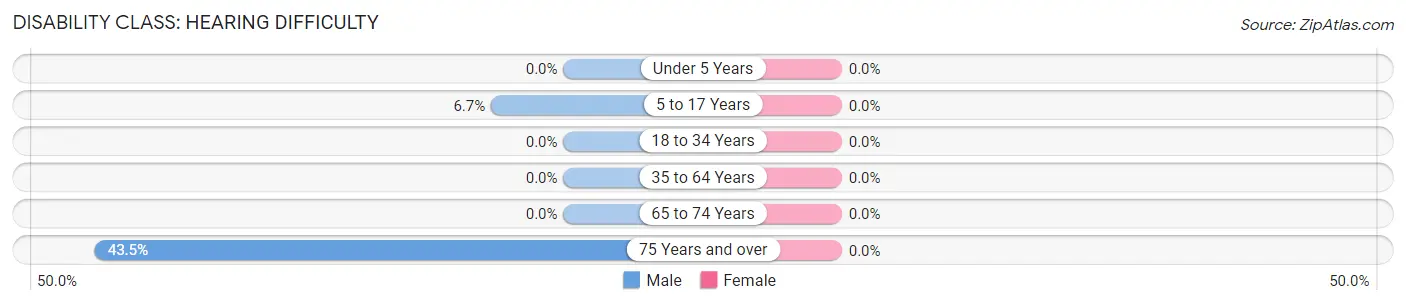
| Age Bracket | Male | Female |
| Under 5 Years | 0 (0.0%) | 0 (0.0%) |
| 5 to 17 Years | 20 (6.7%) | 0 (0.0%) |
| 18 to 34 Years | 0 (0.0%) | 0 (0.0%) |
| 35 to 64 Years | 0 (0.0%) | 0 (0.0%) |
| 65 to 74 Years | 0 (0.0%) | 0 (0.0%) |
| 75 Years and over | 40 (43.5%) | 0 (0.0%) |
Disability Class: Vision Difficulty
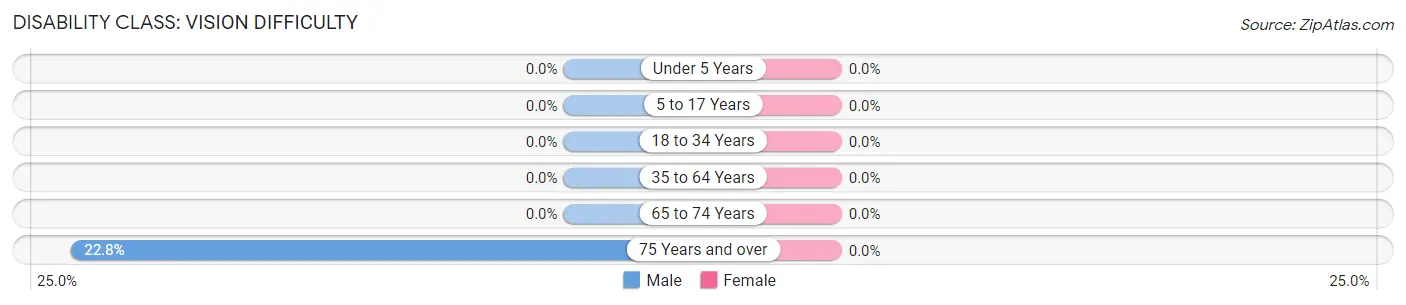
| Age Bracket | Male | Female |
| Under 5 Years | 0 (0.0%) | 0 (0.0%) |
| 5 to 17 Years | 0 (0.0%) | 0 (0.0%) |
| 18 to 34 Years | 0 (0.0%) | 0 (0.0%) |
| 35 to 64 Years | 0 (0.0%) | 0 (0.0%) |
| 65 to 74 Years | 0 (0.0%) | 0 (0.0%) |
| 75 Years and over | 21 (22.8%) | 0 (0.0%) |
Disability Class: Cognitive Difficulty
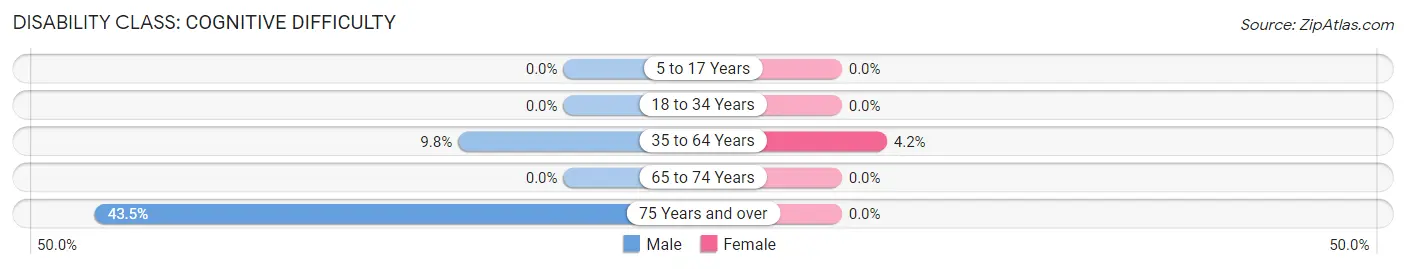
| Age Bracket | Male | Female |
| 5 to 17 Years | 0 (0.0%) | 0 (0.0%) |
| 18 to 34 Years | 0 (0.0%) | 0 (0.0%) |
| 35 to 64 Years | 139 (9.8%) | 34 (4.2%) |
| 65 to 74 Years | 0 (0.0%) | 0 (0.0%) |
| 75 Years and over | 40 (43.5%) | 0 (0.0%) |
Disability Class: Ambulatory Difficulty
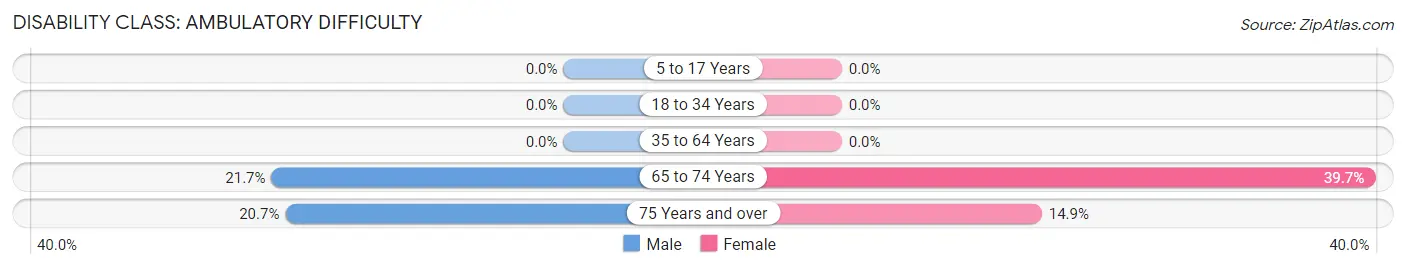
| Age Bracket | Male | Female |
| 5 to 17 Years | 0 (0.0%) | 0 (0.0%) |
| 18 to 34 Years | 0 (0.0%) | 0 (0.0%) |
| 35 to 64 Years | 0 (0.0%) | 0 (0.0%) |
| 65 to 74 Years | 31 (21.7%) | 71 (39.7%) |
| 75 Years and over | 19 (20.6%) | 15 (14.8%) |
Disability Class: Self-Care Difficulty
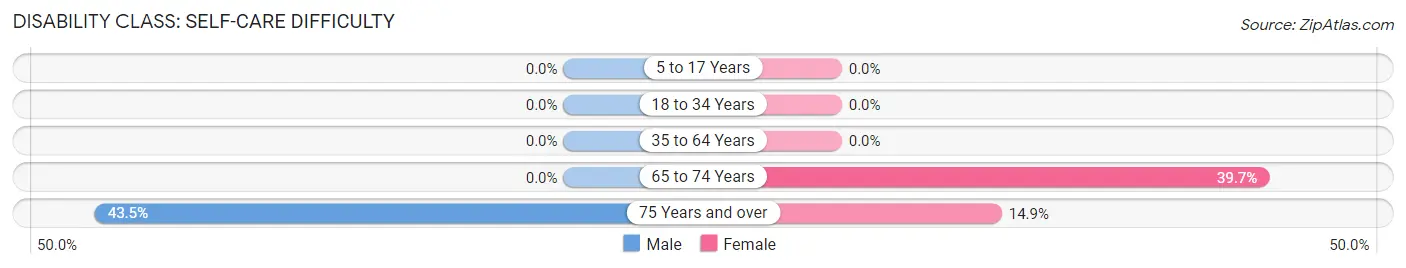
| Age Bracket | Male | Female |
| 5 to 17 Years | 0 (0.0%) | 0 (0.0%) |
| 18 to 34 Years | 0 (0.0%) | 0 (0.0%) |
| 35 to 64 Years | 0 (0.0%) | 0 (0.0%) |
| 65 to 74 Years | 0 (0.0%) | 71 (39.7%) |
| 75 Years and over | 40 (43.5%) | 15 (14.8%) |
Technology Access in El Jebel
Computing Device Access in El Jebel
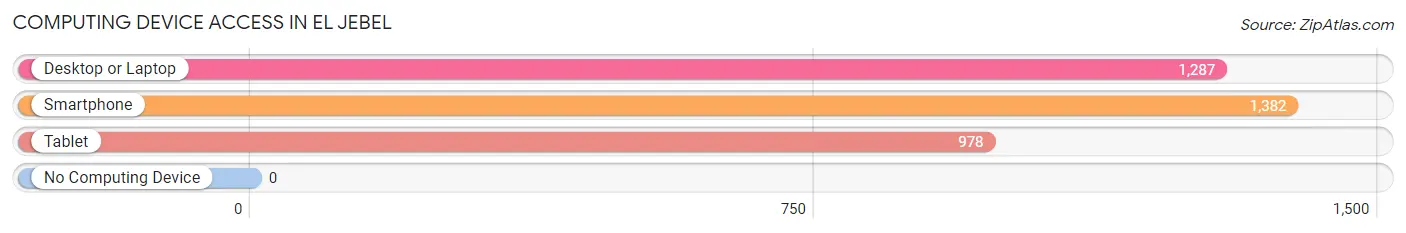
| Device Type | # Households | % Households |
| Desktop or Laptop | 1,287 | 86.1% |
| Smartphone | 1,382 | 92.5% |
| Tablet | 978 | 65.5% |
| No Computing Device | 0 | 0.0% |
| Total | 1,494 | 100.0% |
Internet Access in El Jebel
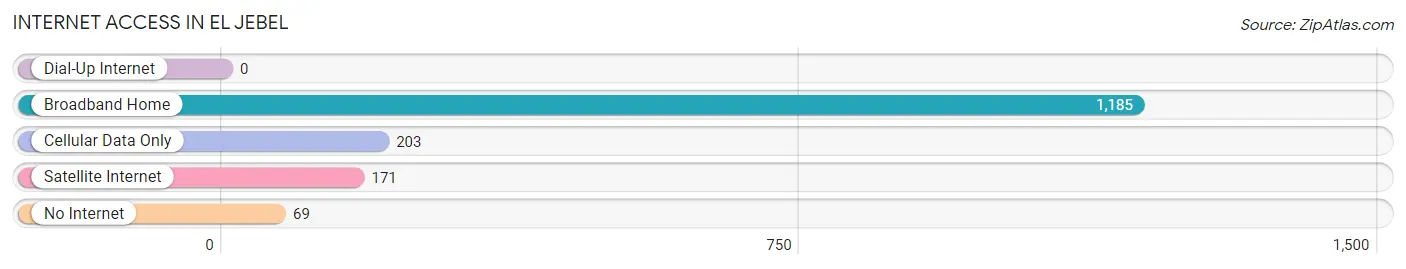
| Internet Type | # Households | % Households |
| Dial-Up Internet | 0 | 0.0% |
| Broadband Home | 1,185 | 79.3% |
| Cellular Data Only | 203 | 13.6% |
| Satellite Internet | 171 | 11.5% |
| No Internet | 69 | 4.6% |
| Total | 1,494 | 100.0% |
El Jebel Summary
Jebel, Colorado is a small unincorporated community located in Eagle County, Colorado. It is situated in the Roaring Fork Valley, approximately 10 miles east of Glenwood Springs and 30 miles west of Aspen. The town is located at the base of the Flat Tops Mountains, and is surrounded by the White River National Forest.
History
The area around El Jebel has been inhabited for thousands of years. The Ute Indians were the first to settle in the area, and they used the area for hunting and gathering. The Ute Indians were eventually forced out of the area by the United States government in the late 1800s.
In the early 1900s, the area around El Jebel was settled by homesteaders. The first homesteaders were mostly ranchers and farmers, and they built small cabins and homesteads in the area. The town of El Jebel was officially established in the early 1920s, and the first post office was established in 1923.
The town of El Jebel grew slowly over the years, and by the 1950s it had a population of around 200 people. The town was mostly a farming and ranching community, and it was also home to a few small businesses.
Geography
El Jebel is located in the Roaring Fork Valley, at the base of the Flat Tops Mountains. The town is surrounded by the White River National Forest, and is approximately 10 miles east of Glenwood Springs and 30 miles west of Aspen.
The town is situated at an elevation of 6,800 feet, and the surrounding area is mostly mountainous. The town is located in a valley, and the surrounding mountains provide a stunning backdrop.
Economy
The economy of El Jebel is largely based on tourism and agriculture. The town is a popular destination for outdoor enthusiasts, and it is home to several ski resorts, hiking trails, and other outdoor activities.
Agriculture is also an important part of the local economy. The town is home to several farms and ranches, and the surrounding area is used for grazing cattle and growing hay.
Demographics
As of the 2010 census, the population of El Jebel was 545. The town is predominantly white, with a small Hispanic population. The median household income is $50,000, and the median age is 44.
Conclusion
El Jebel, Colorado is a small unincorporated community located in Eagle County, Colorado. It is situated in the Roaring Fork Valley, approximately 10 miles east of Glenwood Springs and 30 miles west of Aspen. The town is surrounded by the White River National Forest, and is home to several ski resorts, hiking trails, and other outdoor activities. The economy of El Jebel is largely based on tourism and agriculture, and the town is predominantly white, with a small Hispanic population.
Common Questions
What is Per Capita Income in El Jebel?
Per Capita income in El Jebel is $72,769.
What is the Median Family Income in El Jebel?
Median Family Income in El Jebel is $123,810.
What is the Median Household income in El Jebel?
Median Household Income in El Jebel is $120,278.
What is Income or Wage Gap in El Jebel?
Income or Wage Gap in El Jebel is 55.5%.
Women in El Jebel earn 44.5 cents for every dollar earned by a man.
What is Inequality or Gini Index in El Jebel?
Inequality or Gini Index in El Jebel is 0.51.
What is the Total Population of El Jebel?
Total Population of El Jebel is 4,328.
What is the Total Male Population of El Jebel?
Total Male Population of El Jebel is 2,547.
What is the Total Female Population of El Jebel?
Total Female Population of El Jebel is 1,781.
What is the Ratio of Males per 100 Females in El Jebel?
There are 143.01 Males per 100 Females in El Jebel.
What is the Ratio of Females per 100 Males in El Jebel?
There are 69.93 Females per 100 Males in El Jebel.
What is the Median Population Age in El Jebel?
Median Population Age in El Jebel is 39.7 Years.
What is the Average Family Size in El Jebel
Average Family Size in El Jebel is 2.8 People.
What is the Average Household Size in El Jebel
Average Household Size in El Jebel is 2.9 People.
How Large is the Labor Force in El Jebel?
There are 2,734 People in the Labor Forcein in El Jebel.
What is the Percentage of People in the Labor Force in El Jebel?
76.8% of People are in the Labor Force in El Jebel.