Upper Bear Creek, CO Map & Demographics
Upper Bear Creek Map
Upper Bear Creek Overview
$106,471
PER CAPITA INCOME
$160,592
AVG FAMILY INCOME
$177,856
AVG HOUSEHOLD INCOME
24.8%
WAGE / INCOME GAP [ % ]
75.2¢/ $1
WAGE / INCOME GAP [ $ ]
0.38
INEQUALITY / GINI INDEX
921
TOTAL POPULATION
480
MALE POPULATION
441
FEMALE POPULATION
108.84
MALES / 100 FEMALES
91.88
FEMALES / 100 MALES
57.2
MEDIAN AGE
2.2
AVG FAMILY SIZE
1.9
AVG HOUSEHOLD SIZE
463
LABOR FORCE [ PEOPLE ]
55.1%
PERCENT IN LABOR FORCE
Income in Upper Bear Creek
Income Overview in Upper Bear Creek
Per Capita Income in Upper Bear Creek is $106,471, while median incomes of families and households are $160,592 and $177,856 respectively.
| Characteristic | Number | Measure |
| Per Capita Income | 921 | $106,471 |
| Median Family Income | 329 | $160,592 |
| Mean Family Income | 329 | $199,991 |
| Median Household Income | 495 | $177,856 |
| Mean Household Income | 495 | $201,702 |
| Income Deficit | 329 | $0 |
| Wage / Income Gap (%) | 921 | 24.81% |
| Wage / Income Gap ($) | 921 | 75.19¢ per $1 |
| Gini / Inequality Index | 921 | 0.38 |
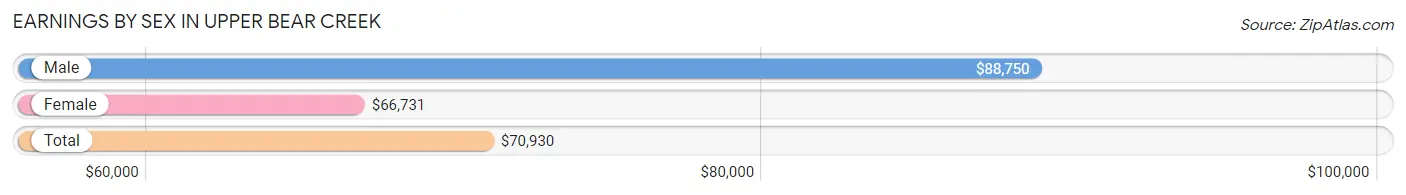
Earnings by Sex in Upper Bear Creek
Average Earnings in Upper Bear Creek are $70,930, $88,750 for men and $66,731 for women, a difference of 24.8%.
| Sex | Number | Average Earnings |
| Male | 264 (53.0%) | $88,750 |
| Female | 234 (47.0%) | $66,731 |
| Total | 498 (100.0%) | $70,930 |
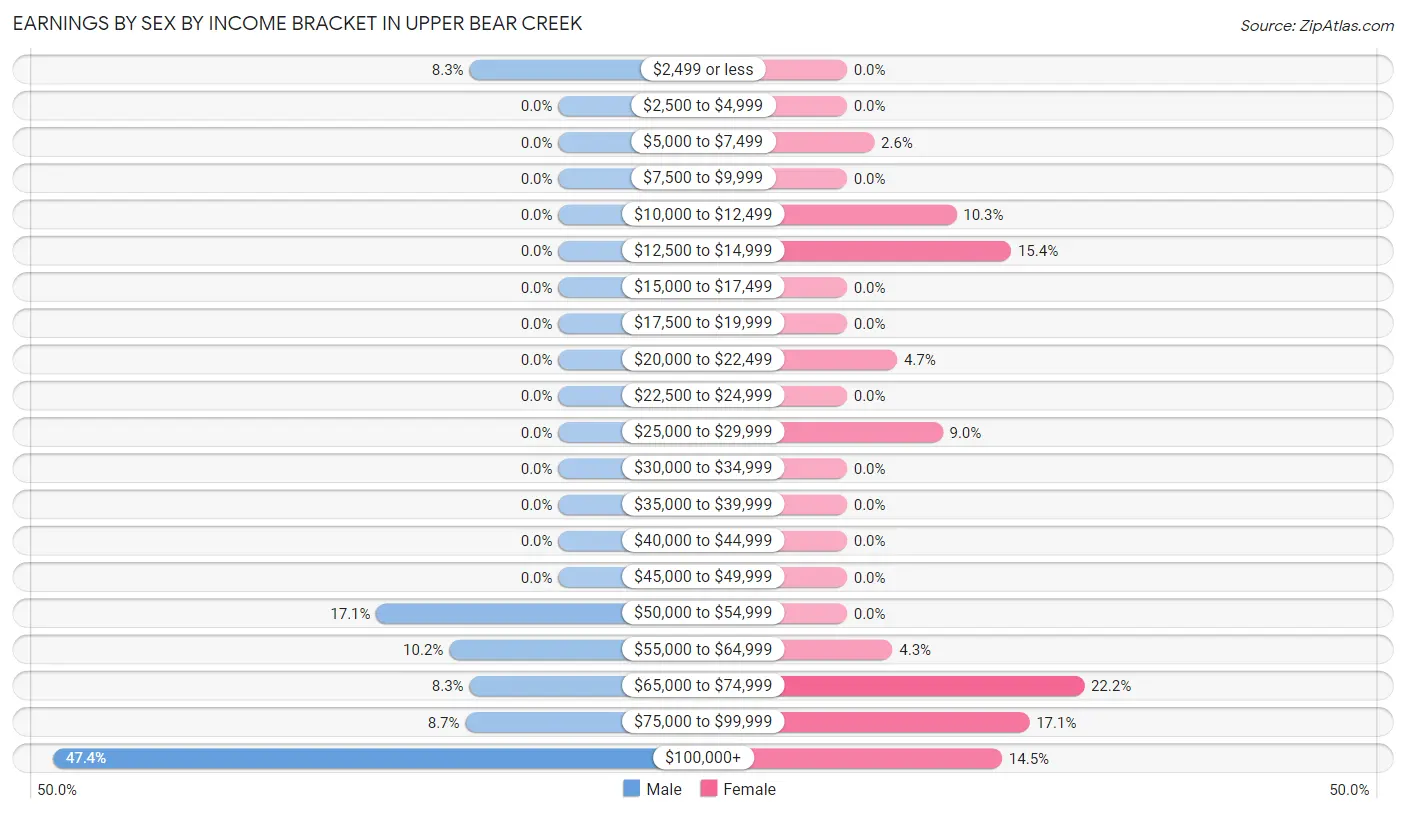
Earnings by Sex by Income Bracket in Upper Bear Creek
The most common earnings brackets in Upper Bear Creek are $100,000+ for men (125 | 47.3%) and $65,000 to $74,999 for women (52 | 22.2%).
| Income | Male | Female |
| $2,499 or less | 22 (8.3%) | 0 (0.0%) |
| $2,500 to $4,999 | 0 (0.0%) | 0 (0.0%) |
| $5,000 to $7,499 | 0 (0.0%) | 6 (2.6%) |
| $7,500 to $9,999 | 0 (0.0%) | 0 (0.0%) |
| $10,000 to $12,499 | 0 (0.0%) | 24 (10.3%) |
| $12,500 to $14,999 | 0 (0.0%) | 36 (15.4%) |
| $15,000 to $17,499 | 0 (0.0%) | 0 (0.0%) |
| $17,500 to $19,999 | 0 (0.0%) | 0 (0.0%) |
| $20,000 to $22,499 | 0 (0.0%) | 11 (4.7%) |
| $22,500 to $24,999 | 0 (0.0%) | 0 (0.0%) |
| $25,000 to $29,999 | 0 (0.0%) | 21 (9.0%) |
| $30,000 to $34,999 | 0 (0.0%) | 0 (0.0%) |
| $35,000 to $39,999 | 0 (0.0%) | 0 (0.0%) |
| $40,000 to $44,999 | 0 (0.0%) | 0 (0.0%) |
| $45,000 to $49,999 | 0 (0.0%) | 0 (0.0%) |
| $50,000 to $54,999 | 45 (17.1%) | 0 (0.0%) |
| $55,000 to $64,999 | 27 (10.2%) | 10 (4.3%) |
| $65,000 to $74,999 | 22 (8.3%) | 52 (22.2%) |
| $75,000 to $99,999 | 23 (8.7%) | 40 (17.1%) |
| $100,000+ | 125 (47.3%) | 34 (14.5%) |
| Total | 264 (100.0%) | 234 (100.0%) |
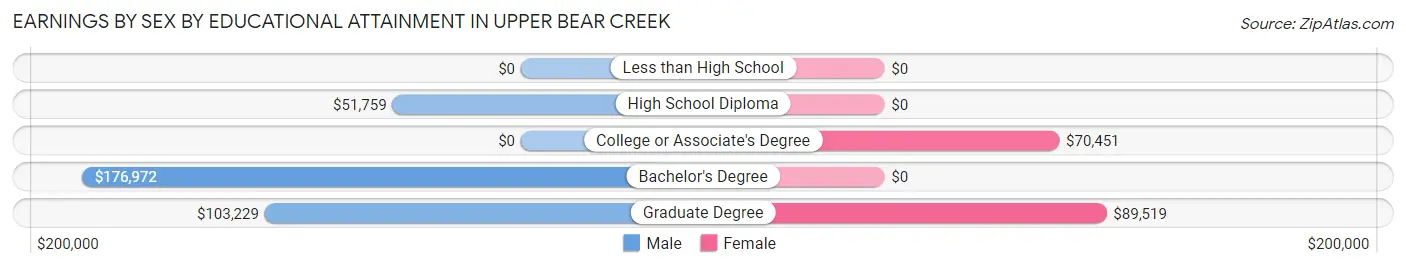
Earnings by Sex by Educational Attainment in Upper Bear Creek
Average earnings in Upper Bear Creek are $91,607 for men and $67,308 for women, a difference of 26.5%. Men with an educational attainment of bachelor's degree enjoy the highest average annual earnings of $176,972, while those with high school diploma education earn the least with $51,759. Women with an educational attainment of graduate degree earn the most with the average annual earnings of $89,519, while those with college or associate's degree education have the smallest earnings of $70,451.
| Educational Attainment | Male Income | Female Income |
| Less than High School | - | - |
| High School Diploma | $51,759 | $0 |
| College or Associate's Degree | - | - |
| Bachelor's Degree | $176,972 | $0 |
| Graduate Degree | $103,229 | $89,519 |
| Total | $91,607 | $67,308 |
Family Income in Upper Bear Creek
Family Income Brackets in Upper Bear Creek
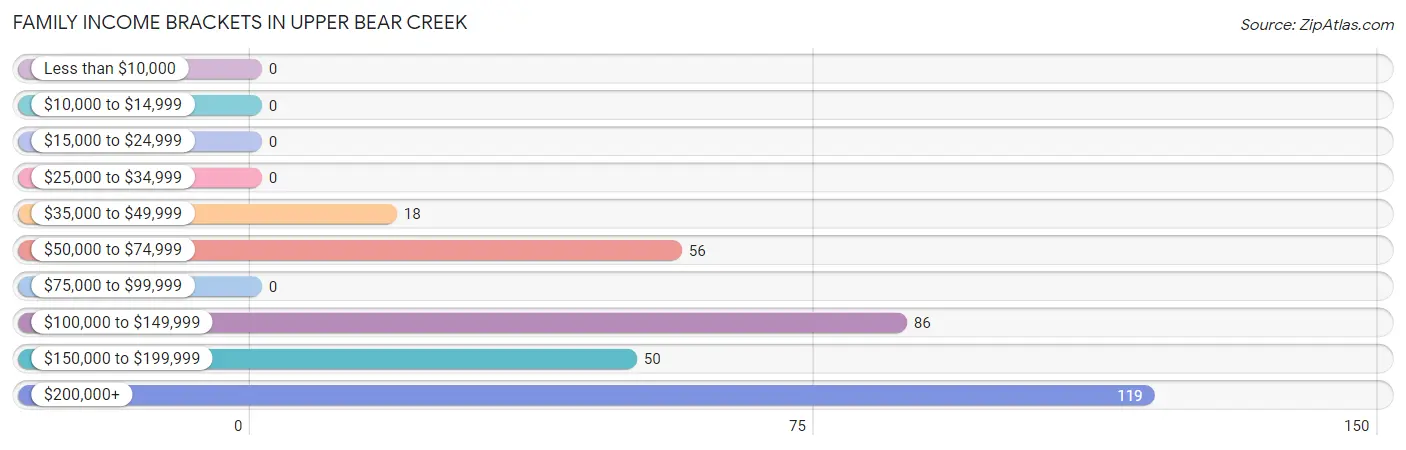
According to the Upper Bear Creek family income data, there are 119 families falling into the $200,000+ income range, which is the most common income bracket and makes up 36.2% of all families.
| Income Bracket | # Families | % Families |
| Less than $10,000 | 0 | 0.0% |
| $10,000 to $14,999 | 0 | 0.0% |
| $15,000 to $24,999 | 0 | 0.0% |
| $25,000 to $34,999 | 0 | 0.0% |
| $35,000 to $49,999 | 18 | 5.5% |
| $50,000 to $74,999 | 56 | 17.0% |
| $75,000 to $99,999 | 0 | 0.0% |
| $100,000 to $149,999 | 86 | 26.1% |
| $150,000 to $199,999 | 50 | 15.2% |
| $200,000+ | 119 | 36.2% |
Family Income by Famaliy Size in Upper Bear Creek
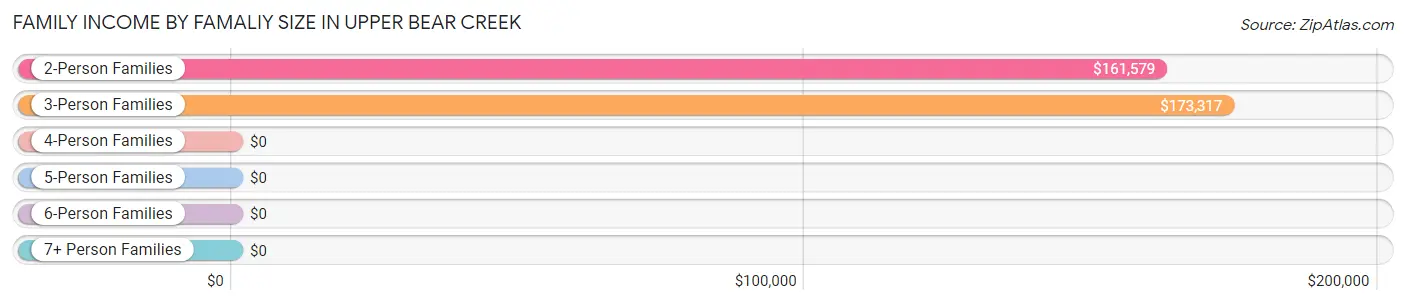
3-person families (75 | 22.8%) account for the highest median family income in Upper Bear Creek with $173,317 per family, while 2-person families (214 | 65.0%) have the highest median income of $80,790 per family member.
| Income Bracket | # Families | Median Income |
| 2-Person Families | 214 (65.0%) | $161,579 |
| 3-Person Families | 75 (22.8%) | $173,317 |
| 4-Person Families | 40 (12.2%) | $0 |
| 5-Person Families | 0 (0.0%) | $0 |
| 6-Person Families | 0 (0.0%) | $0 |
| 7+ Person Families | 0 (0.0%) | $0 |
| Total | 329 (100.0%) | $160,592 |
Family Income by Number of Earners in Upper Bear Creek
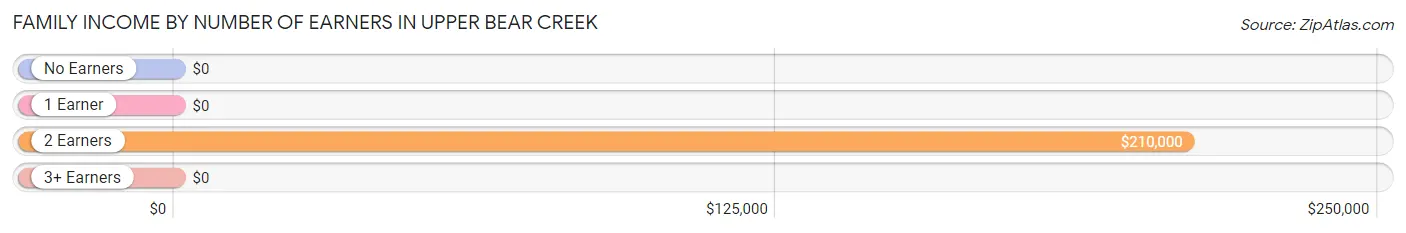
| Number of Earners | # Families | Median Income |
| No Earners | 57 (17.3%) | $0 |
| 1 Earner | 104 (31.6%) | $0 |
| 2 Earners | 164 (49.8%) | $210,000 |
| 3+ Earners | 4 (1.2%) | $0 |
| Total | 329 (100.0%) | $160,592 |
Household Income in Upper Bear Creek
Household Income Brackets in Upper Bear Creek
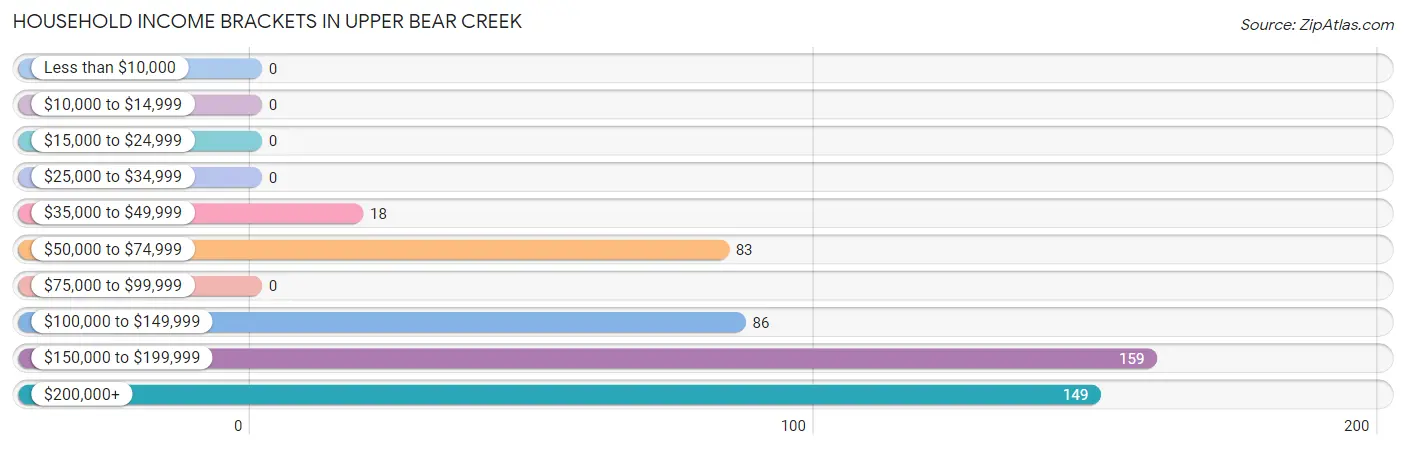
With 159 households falling in the category, the $150,000 to $199,999 income range is the most frequent in Upper Bear Creek, accounting for 32.1% of all households.
| Income Bracket | # Households | % Households |
| Less than $10,000 | 0 | 0.0% |
| $10,000 to $14,999 | 0 | 0.0% |
| $15,000 to $24,999 | 0 | 0.0% |
| $25,000 to $34,999 | 0 | 0.0% |
| $35,000 to $49,999 | 18 | 3.6% |
| $50,000 to $74,999 | 83 | 16.8% |
| $75,000 to $99,999 | 0 | 0.0% |
| $100,000 to $149,999 | 86 | 17.4% |
| $150,000 to $199,999 | 159 | 32.1% |
| $200,000+ | 149 | 30.1% |
Household Income by Householder Age in Upper Bear Creek
The median household income in Upper Bear Creek is $177,856, with the highest median household income of $178,842 found in the 65+ years age bracket for the primary householder. A total of 201 households (40.6%) fall into this category.
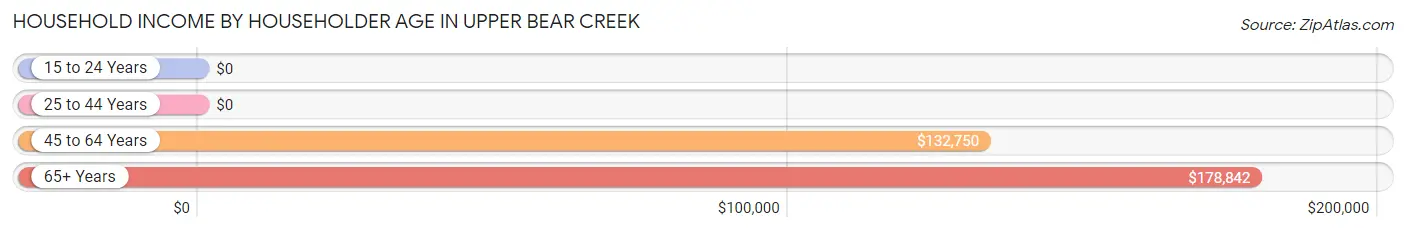
| Income Bracket | # Households | Median Income |
| 15 to 24 Years | 0 (0.0%) | $0 |
| 25 to 44 Years | 20 (4.0%) | $0 |
| 45 to 64 Years | 274 (55.3%) | $132,750 |
| 65+ Years | 201 (40.6%) | $178,842 |
| Total | 495 (100.0%) | $177,856 |
Poverty in Upper Bear Creek
Income Below Poverty by Sex and Age in Upper Bear Creek
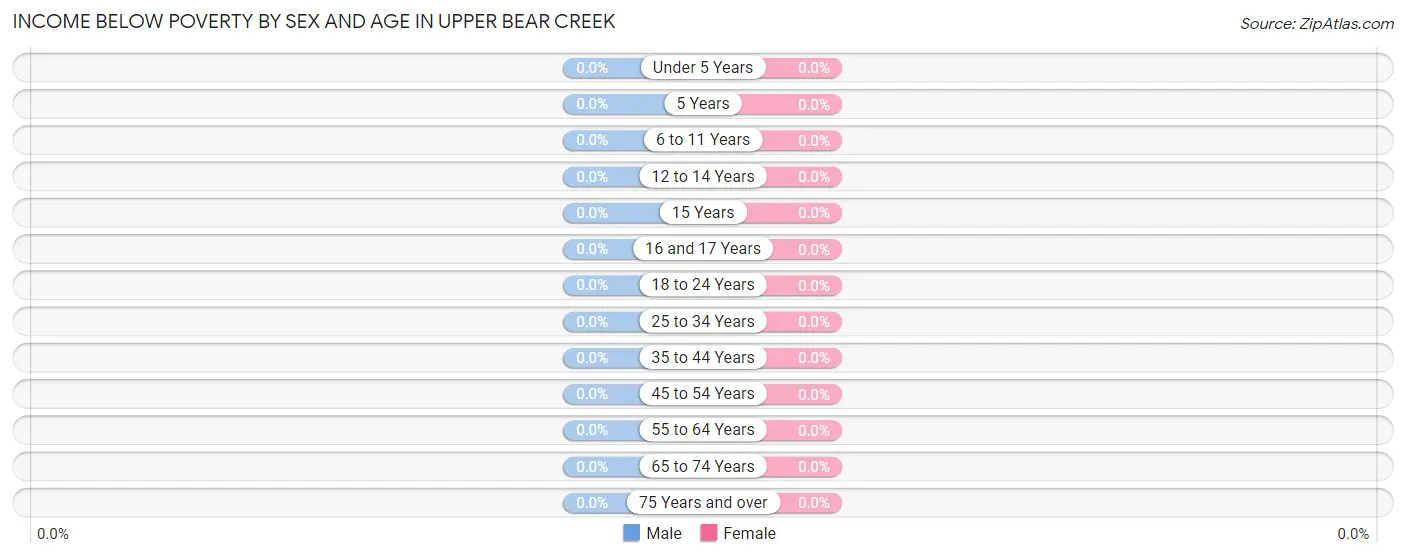
| Age Bracket | Male | Female |
| Under 5 Years | 0 (0.0%) | 0 (0.0%) |
| 5 Years | 0 (0.0%) | 0 (0.0%) |
| 6 to 11 Years | 0 (0.0%) | 0 (0.0%) |
| 12 to 14 Years | 0 (0.0%) | 0 (0.0%) |
| 15 Years | 0 (0.0%) | 0 (0.0%) |
| 16 and 17 Years | 0 (0.0%) | 0 (0.0%) |
| 18 to 24 Years | 0 (0.0%) | 0 (0.0%) |
| 25 to 34 Years | 0 (0.0%) | 0 (0.0%) |
| 35 to 44 Years | 0 (0.0%) | 0 (0.0%) |
| 45 to 54 Years | 0 (0.0%) | 0 (0.0%) |
| 55 to 64 Years | 0 (0.0%) | 0 (0.0%) |
| 65 to 74 Years | 0 (0.0%) | 0 (0.0%) |
| 75 Years and over | 0 (0.0%) | 0 (0.0%) |
| Total | 0 (0.0%) | 0 (0.0%) |
Income Above Poverty by Sex and Age in Upper Bear Creek
According to the poverty statistics in Upper Bear Creek, males aged under 5 years and females aged 12 to 14 years are the age groups that are most secure financially, with 100.0% of males and 100.0% of females in these age groups living above the poverty line.
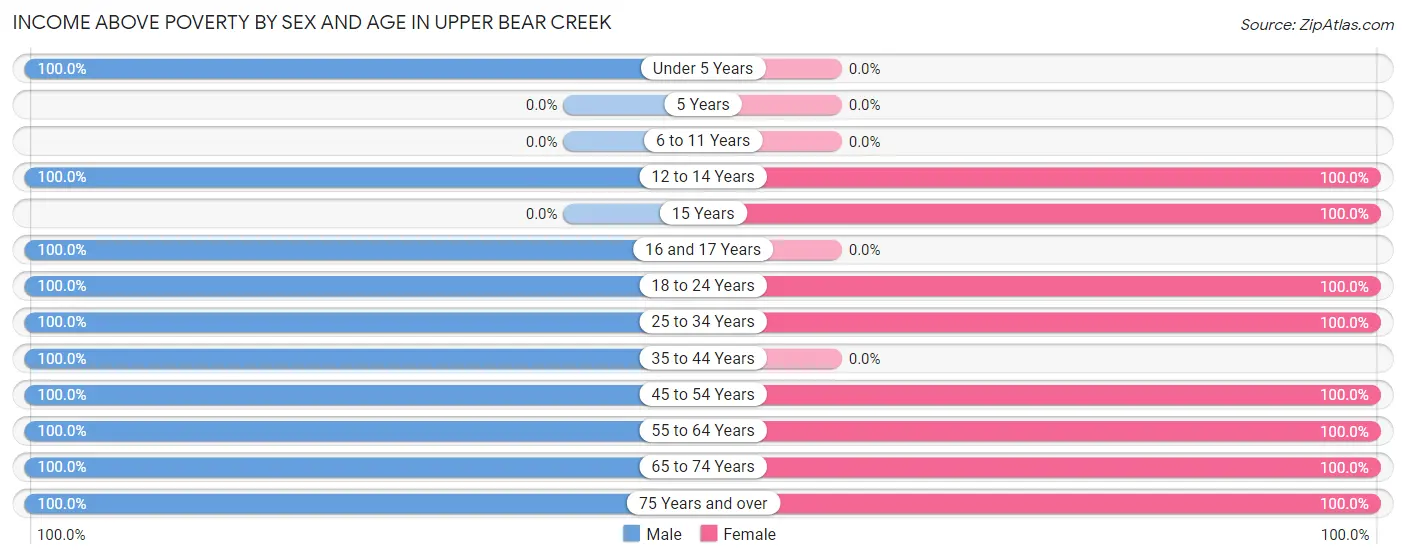
| Age Bracket | Male | Female |
| Under 5 Years | 16 (100.0%) | 0 (0.0%) |
| 5 Years | 0 (0.0%) | 0 (0.0%) |
| 6 to 11 Years | 0 (0.0%) | 0 (0.0%) |
| 12 to 14 Years | 24 (100.0%) | 18 (100.0%) |
| 15 Years | 0 (0.0%) | 22 (100.0%) |
| 16 and 17 Years | 21 (100.0%) | 0 (0.0%) |
| 18 to 24 Years | 9 (100.0%) | 6 (100.0%) |
| 25 to 34 Years | 18 (100.0%) | 19 (100.0%) |
| 35 to 44 Years | 24 (100.0%) | 0 (0.0%) |
| 45 to 54 Years | 89 (100.0%) | 134 (100.0%) |
| 55 to 64 Years | 126 (100.0%) | 135 (100.0%) |
| 65 to 74 Years | 37 (100.0%) | 91 (100.0%) |
| 75 Years and over | 116 (100.0%) | 16 (100.0%) |
| Total | 480 (100.0%) | 441 (100.0%) |
Income Below Poverty Among Married-Couple Families in Upper Bear Creek
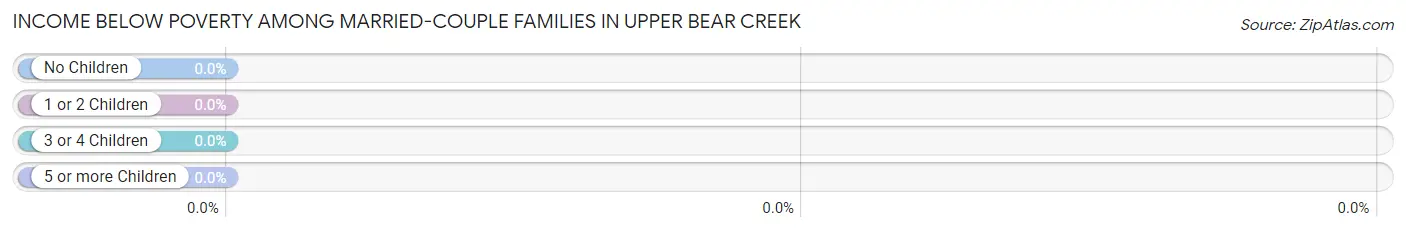
| Children | Above Poverty | Below Poverty |
| No Children | 218 (100.0%) | 0 (0.0%) |
| 1 or 2 Children | 82 (100.0%) | 0 (0.0%) |
| 3 or 4 Children | 0 (0.0%) | 0 (0.0%) |
| 5 or more Children | 0 (0.0%) | 0 (0.0%) |
| Total | 300 (100.0%) | 0 (0.0%) |
Income Below Poverty Among Single-Parent Households in Upper Bear Creek
| Children | Single Father | Single Mother |
| No Children | 0 (0.0%) | 0 (0.0%) |
| 1 or 2 Children | 0 (0.0%) | 0 (0.0%) |
| 3 or 4 Children | 0 (0.0%) | 0 (0.0%) |
| 5 or more Children | 0 (0.0%) | 0 (0.0%) |
| Total | 0 (0.0%) | 0 (0.0%) |
Income Below Poverty Among Married-Couple vs Single-Parent Households in Upper Bear Creek
| Children | Married-Couple Families | Single-Parent Households |
| No Children | 0 (0.0%) | 0 (0.0%) |
| 1 or 2 Children | 0 (0.0%) | 0 (0.0%) |
| 3 or 4 Children | 0 (0.0%) | 0 (0.0%) |
| 5 or more Children | 0 (0.0%) | 0 (0.0%) |
| Total | 0 (0.0%) | 0 (0.0%) |
Race in Upper Bear Creek
The most populous races in Upper Bear Creek are White / Caucasian (875 | 95.0%), Black / African American (18 | 1.9%), and Hispanic or Latino (15 | 1.6%).
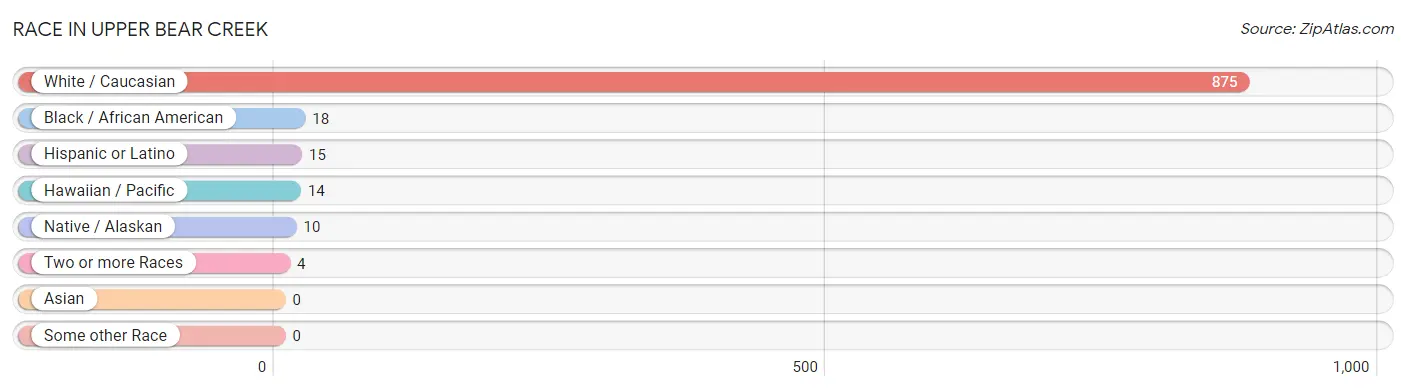
| Race | # Population | % Population |
| Asian | 0 | 0.0% |
| Black / African American | 18 | 1.9% |
| Hawaiian / Pacific | 14 | 1.5% |
| Hispanic or Latino | 15 | 1.6% |
| Native / Alaskan | 10 | 1.1% |
| White / Caucasian | 875 | 95.0% |
| Two or more Races | 4 | 0.4% |
| Some other Race | 0 | 0.0% |
| Total | 921 | 100.0% |
Ancestry in Upper Bear Creek
The most populous ancestries reported in Upper Bear Creek are English (229 | 24.9%), German (221 | 24.0%), Irish (161 | 17.5%), Swedish (92 | 10.0%), and French (85 | 9.2%), together accounting for 85.6% of all Upper Bear Creek residents.
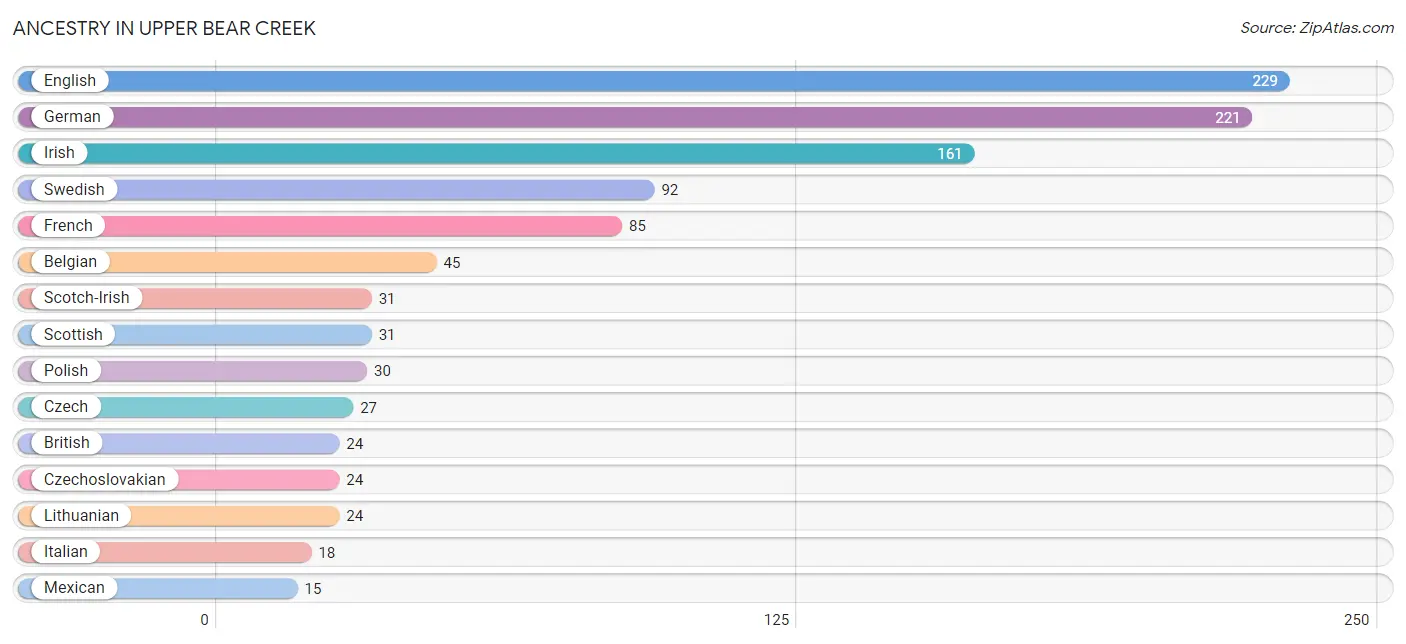
| Ancestry | # Population | % Population |
| Belgian | 45 | 4.9% |
| British | 24 | 2.6% |
| Czech | 27 | 2.9% |
| Czechoslovakian | 24 | 2.6% |
| Dutch | 4 | 0.4% |
| English | 229 | 24.9% |
| Finnish | 9 | 1.0% |
| French | 85 | 9.2% |
| German | 221 | 24.0% |
| Irish | 161 | 17.5% |
| Italian | 18 | 1.9% |
| Lithuanian | 24 | 2.6% |
| Mexican | 15 | 1.6% |
| Native Hawaiian | 14 | 1.5% |
| Norwegian | 7 | 0.8% |
| Polish | 30 | 3.3% |
| Russian | 11 | 1.2% |
| Scotch-Irish | 31 | 3.4% |
| Scottish | 31 | 3.4% |
| Sioux | 10 | 1.1% |
| Swedish | 92 | 10.0% | View All 21 Rows |
Immigrants in Upper Bear Creek
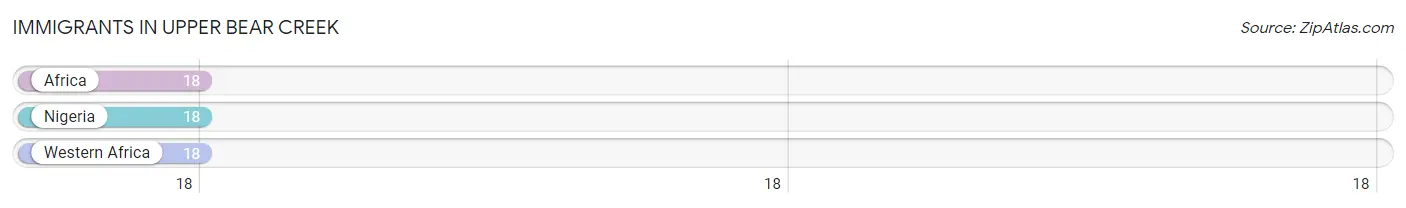
The most numerous immigrant groups reported in Upper Bear Creek came from Africa (18 | 1.9%), Nigeria (18 | 1.9%), and Western Africa (18 | 1.9%), together accounting for 5.8% of all Upper Bear Creek residents.
| Immigration Origin | # Population | % Population |
| Africa | 18 | 1.9% |
| Nigeria | 18 | 1.9% |
| Western Africa | 18 | 1.9% | View All 3 Rows |
Sex and Age in Upper Bear Creek
Sex and Age in Upper Bear Creek
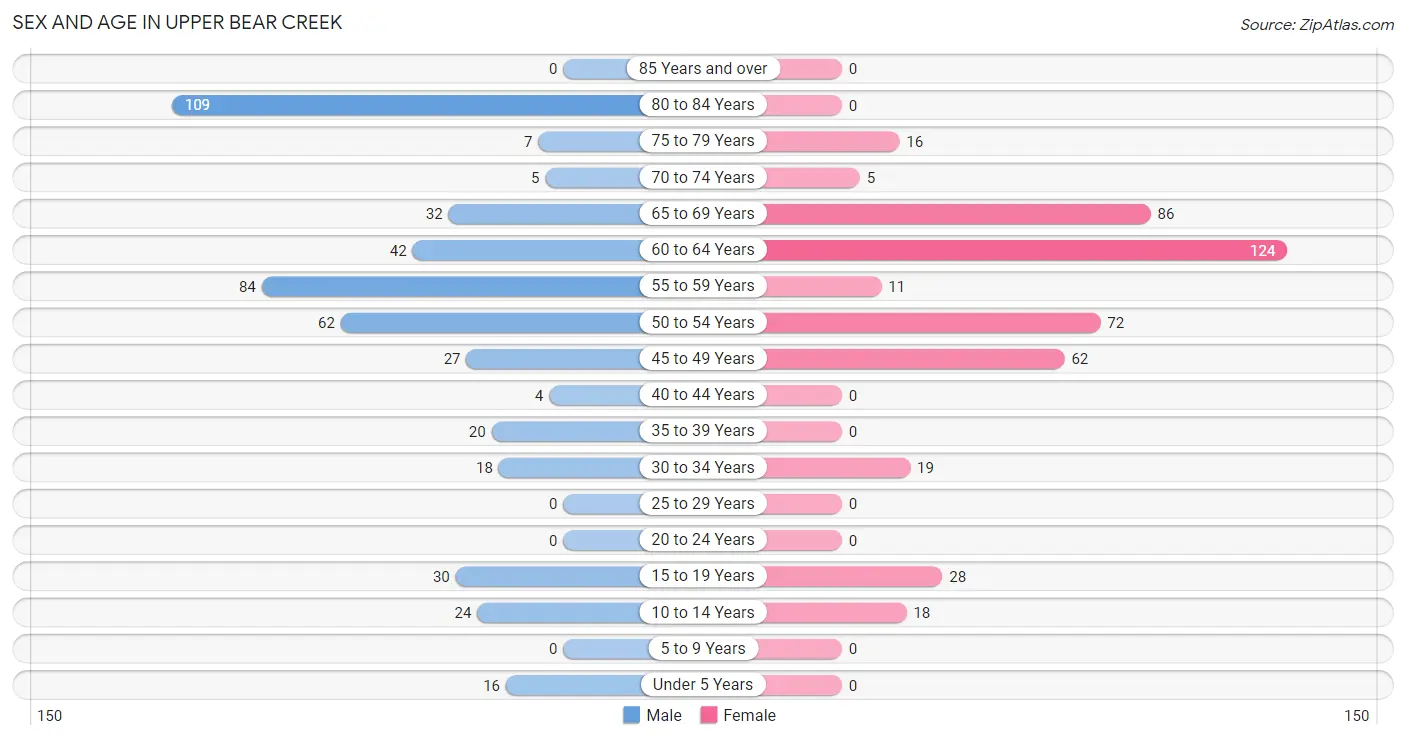
The most populous age groups in Upper Bear Creek are 80 to 84 Years (109 | 22.7%) for men and 60 to 64 Years (124 | 28.1%) for women.
| Age Bracket | Male | Female |
| Under 5 Years | 16 (3.3%) | 0 (0.0%) |
| 5 to 9 Years | 0 (0.0%) | 0 (0.0%) |
| 10 to 14 Years | 24 (5.0%) | 18 (4.1%) |
| 15 to 19 Years | 30 (6.2%) | 28 (6.4%) |
| 20 to 24 Years | 0 (0.0%) | 0 (0.0%) |
| 25 to 29 Years | 0 (0.0%) | 0 (0.0%) |
| 30 to 34 Years | 18 (3.7%) | 19 (4.3%) |
| 35 to 39 Years | 20 (4.2%) | 0 (0.0%) |
| 40 to 44 Years | 4 (0.8%) | 0 (0.0%) |
| 45 to 49 Years | 27 (5.6%) | 62 (14.1%) |
| 50 to 54 Years | 62 (12.9%) | 72 (16.3%) |
| 55 to 59 Years | 84 (17.5%) | 11 (2.5%) |
| 60 to 64 Years | 42 (8.7%) | 124 (28.1%) |
| 65 to 69 Years | 32 (6.7%) | 86 (19.5%) |
| 70 to 74 Years | 5 (1.0%) | 5 (1.1%) |
| 75 to 79 Years | 7 (1.5%) | 16 (3.6%) |
| 80 to 84 Years | 109 (22.7%) | 0 (0.0%) |
| 85 Years and over | 0 (0.0%) | 0 (0.0%) |
| Total | 480 (100.0%) | 441 (100.0%) |
Families and Households in Upper Bear Creek
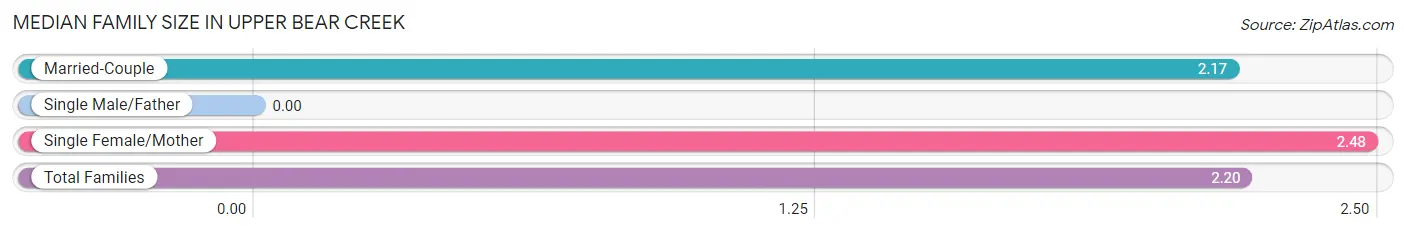
Median Family Size in Upper Bear Creek
| Family Type | # Families | Family Size |
| Married-Couple | 300 (91.2%) | 2.17 |
| Single Male/Father | 0 (0.0%) | - |
| Single Female/Mother | 29 (8.8%) | 2.48 |
| Total Families | 329 (100.0%) | 2.20 |
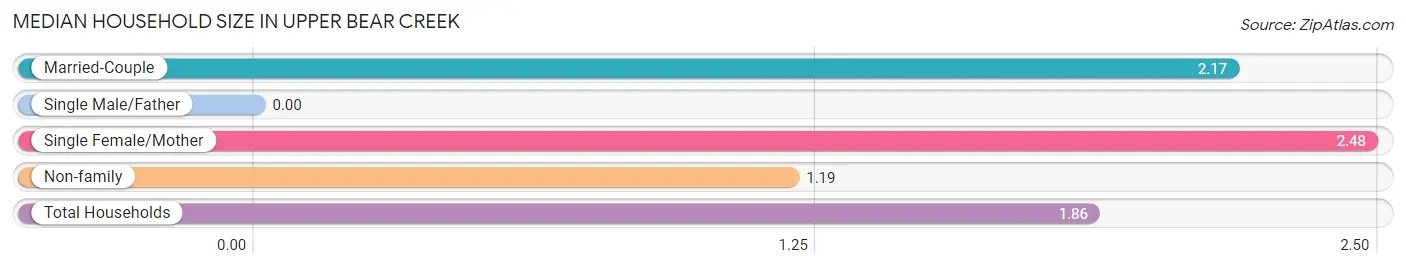
Median Household Size in Upper Bear Creek
| Household Type | # Households | Household Size |
| Married-Couple | 300 (60.6%) | 2.17 |
| Single Male/Father | 0 (0.0%) | - |
| Single Female/Mother | 29 (5.9%) | 2.48 |
| Non-family | 166 (33.5%) | 1.19 |
| Total Households | 495 (100.0%) | 1.86 |
Household Size by Marriage Status in Upper Bear Creek
Out of a total of 495 households in Upper Bear Creek, 329 (66.5%) are family households, while 166 (33.5%) are nonfamily households. The most numerous type of family households are 2-person households, comprising 214, and the most common type of nonfamily households are 1-person households, comprising 160.
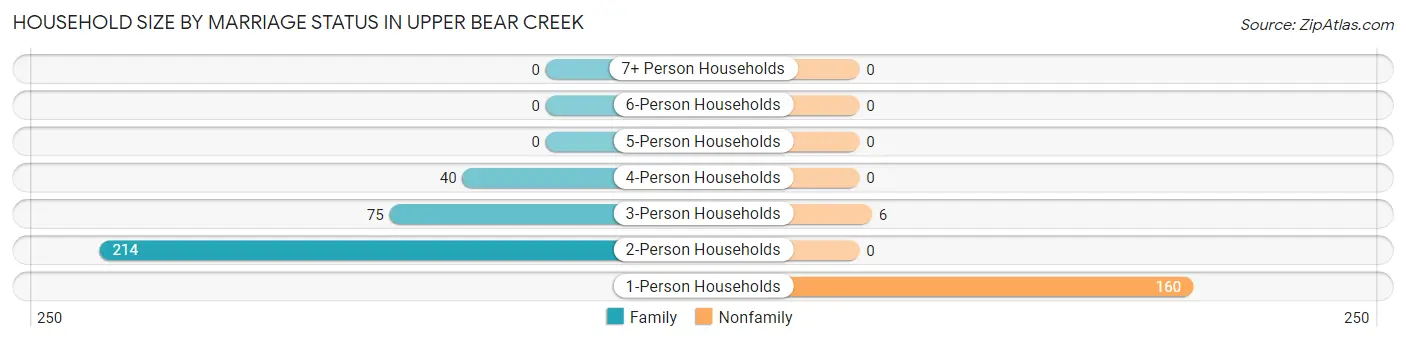
| Household Size | Family Households | Nonfamily Households |
| 1-Person Households | - | 160 (32.3%) |
| 2-Person Households | 214 (43.2%) | 0 (0.0%) |
| 3-Person Households | 75 (15.1%) | 6 (1.2%) |
| 4-Person Households | 40 (8.1%) | 0 (0.0%) |
| 5-Person Households | 0 (0.0%) | 0 (0.0%) |
| 6-Person Households | 0 (0.0%) | 0 (0.0%) |
| 7+ Person Households | 0 (0.0%) | 0 (0.0%) |
| Total | 329 (66.5%) | 166 (33.5%) |
Female Fertility in Upper Bear Creek
Fertility by Age in Upper Bear Creek
| Age Bracket | Women with Births | Births / 1,000 Women |
| 15 to 19 years | 0 (0.0%) | 0.0 |
| 20 to 34 years | 0 (0.0%) | 0.0 |
| 35 to 50 years | 0 (0.0%) | 0.0 |
| Total | 0 (0.0%) | 0.0 |
Fertility by Age by Marriage Status in Upper Bear Creek
| Age Bracket | Married | Unmarried |
| 15 to 19 years | 0 (0.0%) | 0 (0.0%) |
| 20 to 34 years | 0 (0.0%) | 0 (0.0%) |
| 35 to 50 years | 0 (0.0%) | 0 (0.0%) |
| Total | 0 (0.0%) | 0 (0.0%) |
Fertility by Education in Upper Bear Creek
| Educational Attainment | Women with Births | Births / 1,000 Women |
| Less than High School | 0 (0.0%) | 0.0 |
| High School Diploma | 0 (0.0%) | 0.0 |
| College or Associate's Degree | 0 (0.0%) | 0.0 |
| Bachelor's Degree | 0 (0.0%) | 0.0 |
| Graduate Degree | 0 (0.0%) | 0.0 |
| Total | 0 (0.0%) | 0.0 |
Fertility by Education by Marriage Status in Upper Bear Creek
| Educational Attainment | Married | Unmarried |
| Less than High School | 0 (0.0%) | 0 (0.0%) |
| High School Diploma | 0 (0.0%) | 0 (0.0%) |
| College or Associate's Degree | 0 (0.0%) | 0 (0.0%) |
| Bachelor's Degree | 0 (0.0%) | 0 (0.0%) |
| Graduate Degree | 0 (0.0%) | 0 (0.0%) |
| Total | 0 (0.0%) | 0 (0.0%) |
Employment Characteristics in Upper Bear Creek
Employment by Class of Employer in Upper Bear Creek
Among the 463 employed individuals in Upper Bear Creek, private company employees (266 | 57.5%), self-employed (incorporated) (79 | 17.1%), and self-employed (not incorporated) (45 | 9.7%) make up the most common classes of employment.
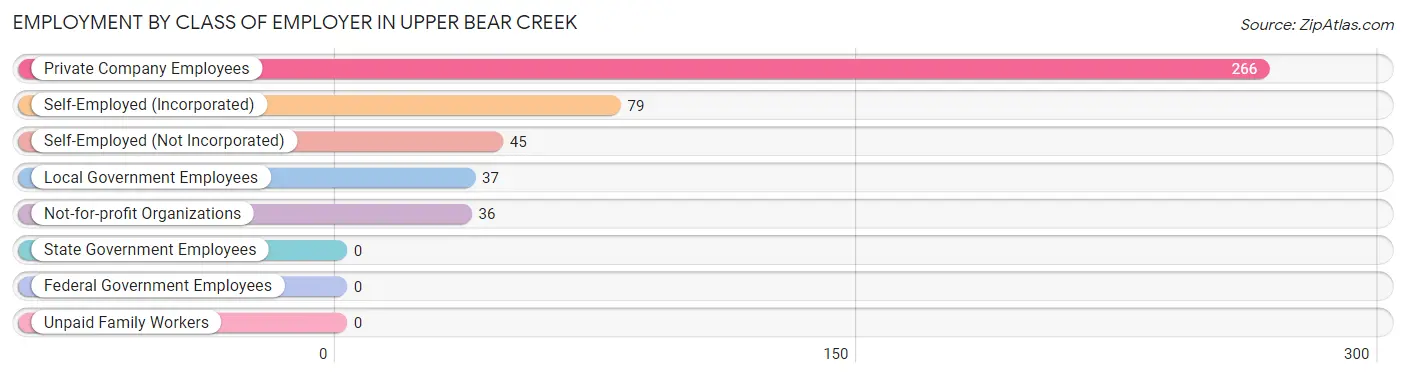
| Employer Class | # Employees | % Employees |
| Private Company Employees | 266 | 57.5% |
| Self-Employed (Incorporated) | 79 | 17.1% |
| Self-Employed (Not Incorporated) | 45 | 9.7% |
| Not-for-profit Organizations | 36 | 7.8% |
| Local Government Employees | 37 | 8.0% |
| State Government Employees | 0 | 0.0% |
| Federal Government Employees | 0 | 0.0% |
| Unpaid Family Workers | 0 | 0.0% |
| Total | 463 | 100.0% |
Employment Status by Age in Upper Bear Creek
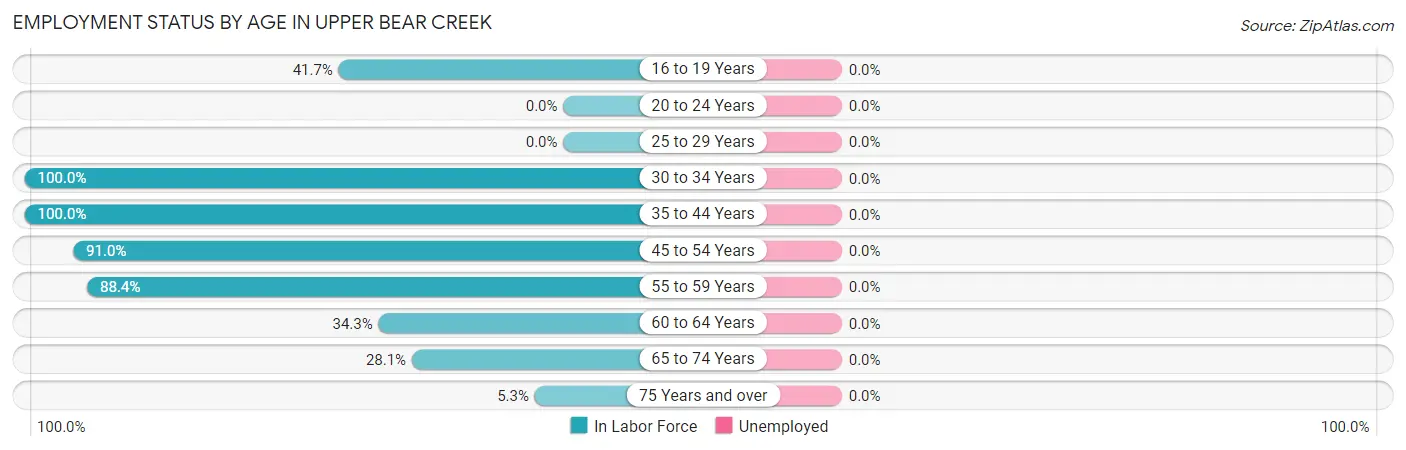
| Age Bracket | In Labor Force | Unemployed |
| 16 to 19 Years | 15 (41.7%) | 0 (0.0%) |
| 20 to 24 Years | 0 (0.0%) | 0 (0.0%) |
| 25 to 29 Years | 0 (0.0%) | 0 (0.0%) |
| 30 to 34 Years | 37 (100.0%) | 0 (0.0%) |
| 35 to 44 Years | 24 (100.0%) | 0 (0.0%) |
| 45 to 54 Years | 203 (91.0%) | 0 (0.0%) |
| 55 to 59 Years | 84 (88.4%) | 0 (0.0%) |
| 60 to 64 Years | 57 (34.3%) | 0 (0.0%) |
| 65 to 74 Years | 36 (28.1%) | 0 (0.0%) |
| 75 Years and over | 7 (5.3%) | 0 (0.0%) |
| Total | 463 (55.1%) | 0 (0.0%) |
Employment Status by Educational Attainment in Upper Bear Creek
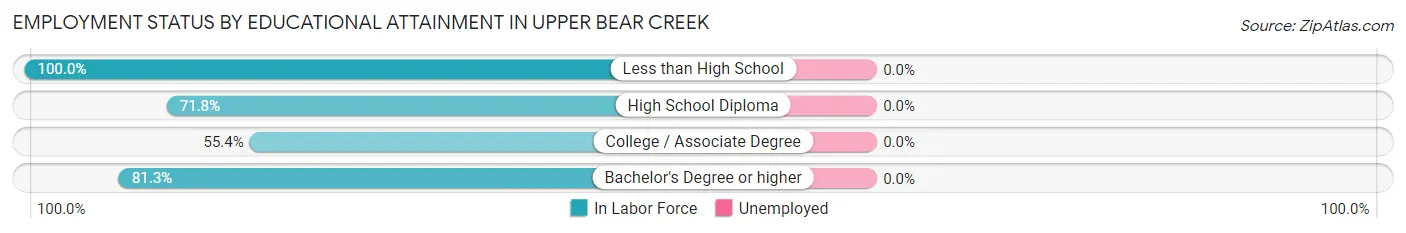
| Educational Attainment | In Labor Force | Unemployed |
| Less than High School | 41 (100.0%) | 0 (0.0%) |
| High School Diploma | 74 (71.8%) | 0 (0.0%) |
| College / Associate Degree | 77 (55.4%) | 0 (0.0%) |
| Bachelor's Degree or higher | 213 (81.3%) | 0 (0.0%) |
| Total | 405 (74.3%) | 0 (0.0%) |
Employment Occupations by Sex in Upper Bear Creek
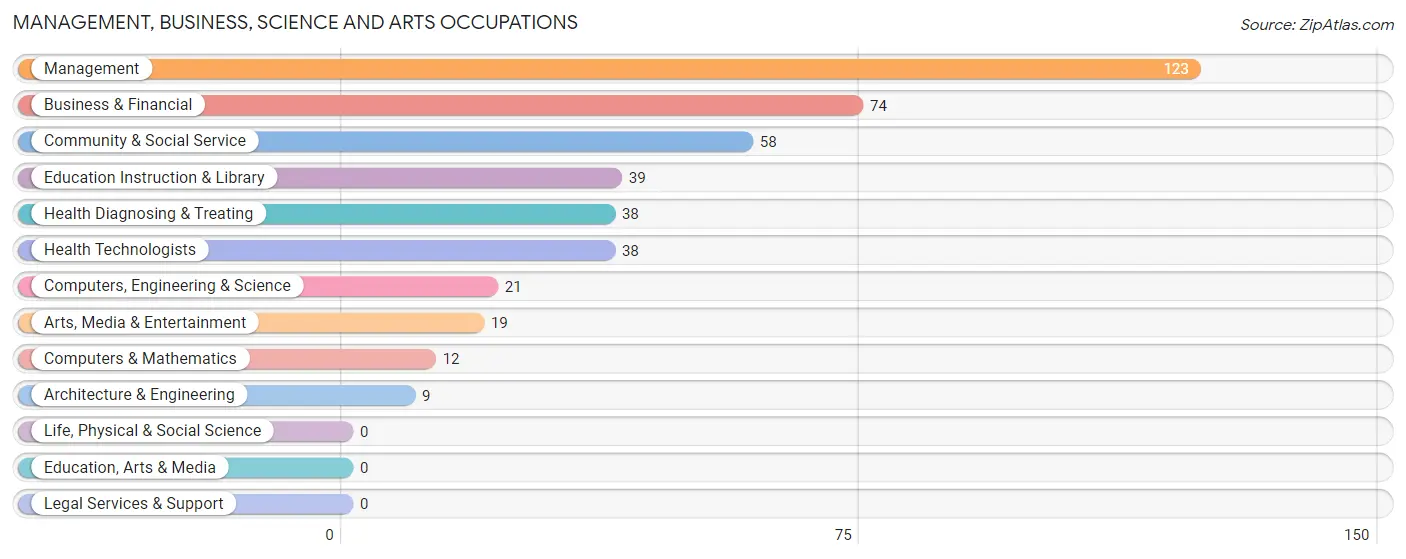
Management, Business, Science and Arts Occupations
The most common Management, Business, Science and Arts occupations in Upper Bear Creek are Management (123 | 26.6%), Business & Financial (74 | 16.0%), Community & Social Service (58 | 12.5%), Education Instruction & Library (39 | 8.4%), and Health Diagnosing & Treating (38 | 8.2%).
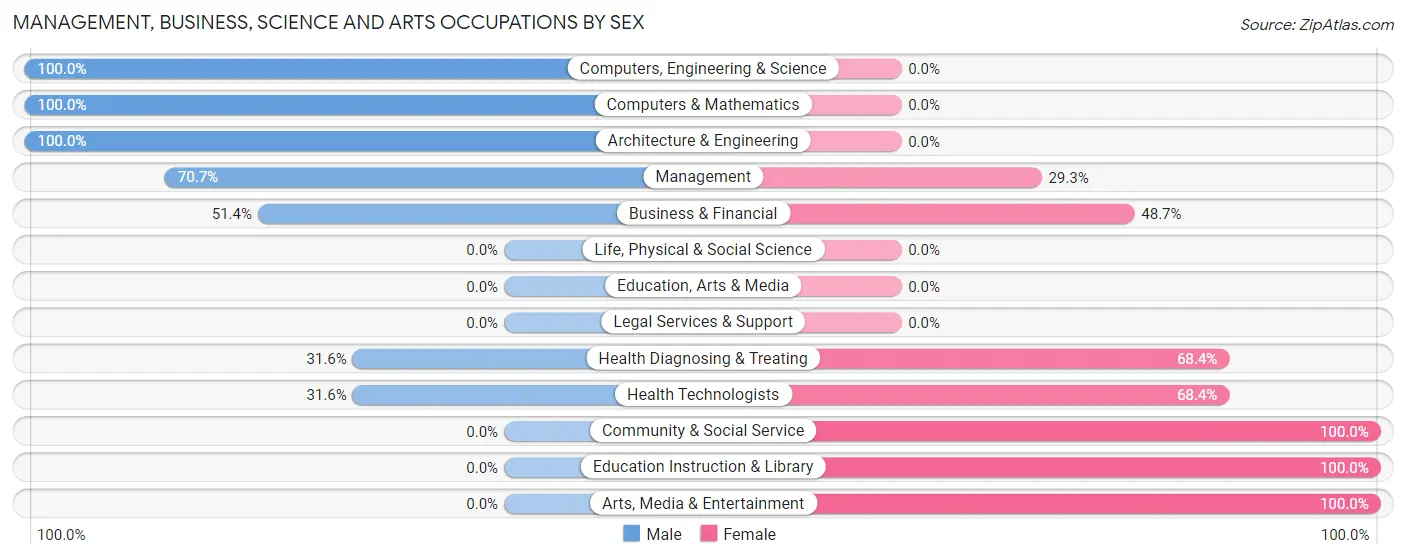
Management, Business, Science and Arts Occupations by Sex
Within the Management, Business, Science and Arts occupations in Upper Bear Creek, the most male-oriented occupations are Computers, Engineering & Science (100.0%), Computers & Mathematics (100.0%), and Architecture & Engineering (100.0%), while the most female-oriented occupations are Community & Social Service (100.0%), Education Instruction & Library (100.0%), and Arts, Media & Entertainment (100.0%).
| Occupation | Male | Female |
| Management | 87 (70.7%) | 36 (29.3%) |
| Business & Financial | 38 (51.3%) | 36 (48.6%) |
| Computers, Engineering & Science | 21 (100.0%) | 0 (0.0%) |
| Computers & Mathematics | 12 (100.0%) | 0 (0.0%) |
| Architecture & Engineering | 9 (100.0%) | 0 (0.0%) |
| Life, Physical & Social Science | 0 (0.0%) | 0 (0.0%) |
| Community & Social Service | 0 (0.0%) | 58 (100.0%) |
| Education, Arts & Media | 0 (0.0%) | 0 (0.0%) |
| Legal Services & Support | 0 (0.0%) | 0 (0.0%) |
| Education Instruction & Library | 0 (0.0%) | 39 (100.0%) |
| Arts, Media & Entertainment | 0 (0.0%) | 19 (100.0%) |
| Health Diagnosing & Treating | 12 (31.6%) | 26 (68.4%) |
| Health Technologists | 12 (31.6%) | 26 (68.4%) |
| Total (Category) | 158 (50.3%) | 156 (49.7%) |
| Total (Overall) | 264 (57.0%) | 199 (43.0%) |
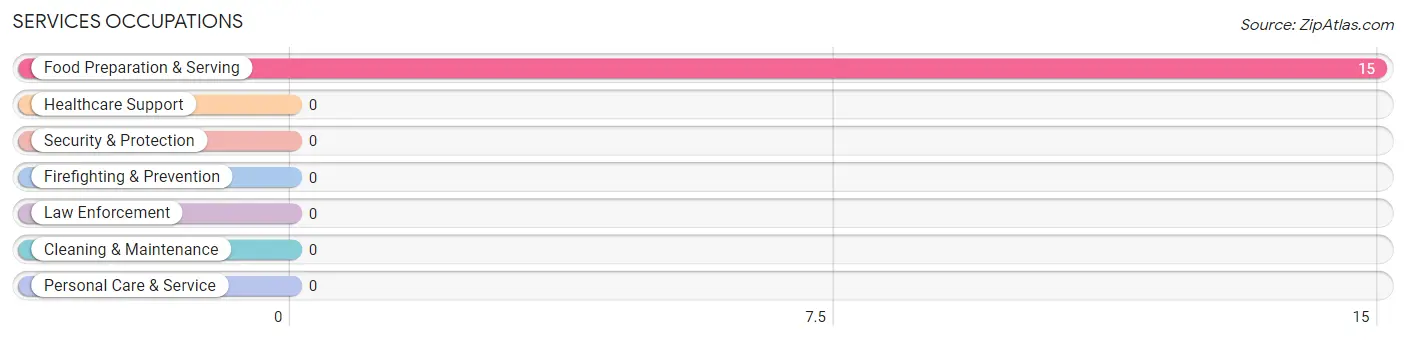
Services Occupations
The most common Services occupations in Upper Bear Creek are , and Food Preparation & Serving (15 | 3.2%).
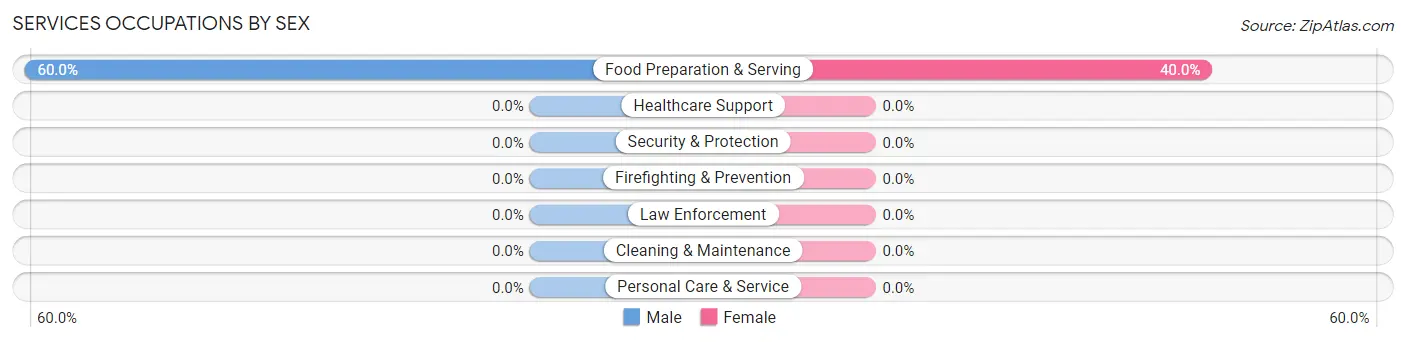
Services Occupations by Sex
| Occupation | Male | Female |
| Healthcare Support | 0 (0.0%) | 0 (0.0%) |
| Security & Protection | 0 (0.0%) | 0 (0.0%) |
| Firefighting & Prevention | 0 (0.0%) | 0 (0.0%) |
| Law Enforcement | 0 (0.0%) | 0 (0.0%) |
| Food Preparation & Serving | 9 (60.0%) | 6 (40.0%) |
| Cleaning & Maintenance | 0 (0.0%) | 0 (0.0%) |
| Personal Care & Service | 0 (0.0%) | 0 (0.0%) |
| Total (Category) | 9 (60.0%) | 6 (40.0%) |
| Total (Overall) | 264 (57.0%) | 199 (43.0%) |
Sales and Office Occupations
The most common Sales and Office occupations in Upper Bear Creek are Office & Administration (37 | 8.0%), and Sales & Related (28 | 6.0%).
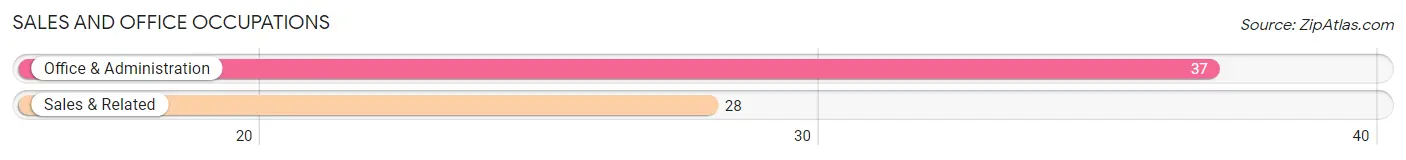
Sales and Office Occupations by Sex

| Occupation | Male | Female |
| Sales & Related | 28 (100.0%) | 0 (0.0%) |
| Office & Administration | 0 (0.0%) | 37 (100.0%) |
| Total (Category) | 28 (43.1%) | 37 (56.9%) |
| Total (Overall) | 264 (57.0%) | 199 (43.0%) |
Natural Resources, Construction and Maintenance Occupations
The most common Natural Resources, Construction and Maintenance occupations in Upper Bear Creek are , and Installation, Maintenance & Repair (17 | 3.7%).
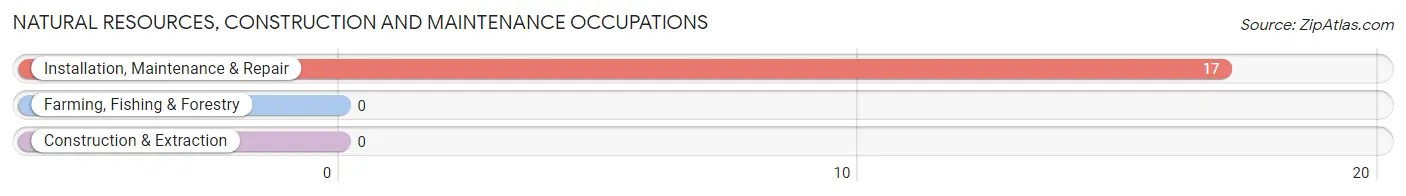
Natural Resources, Construction and Maintenance Occupations by Sex
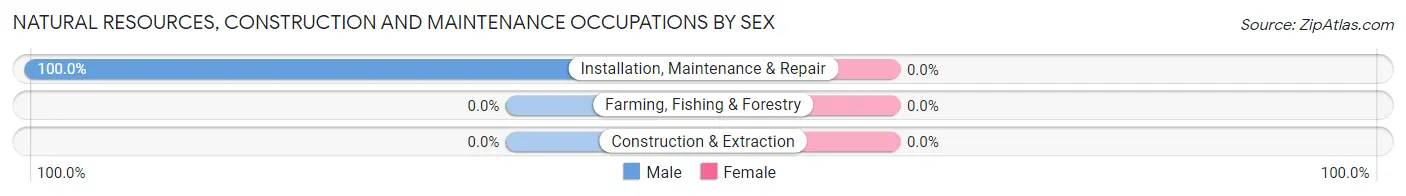
| Occupation | Male | Female |
| Farming, Fishing & Forestry | 0 (0.0%) | 0 (0.0%) |
| Construction & Extraction | 0 (0.0%) | 0 (0.0%) |
| Installation, Maintenance & Repair | 17 (100.0%) | 0 (0.0%) |
| Total (Category) | 17 (100.0%) | 0 (0.0%) |
| Total (Overall) | 264 (57.0%) | 199 (43.0%) |
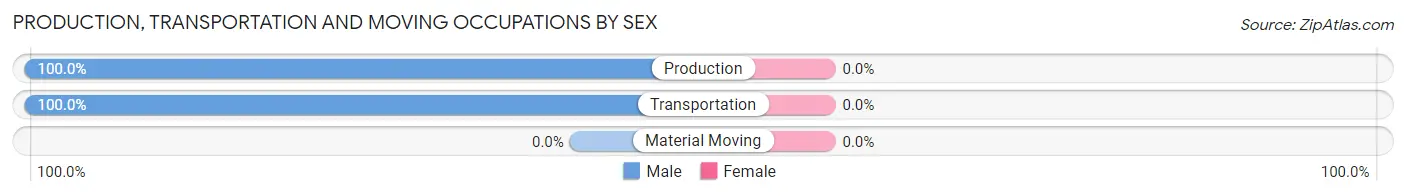
Production, Transportation and Moving Occupations
The most common Production, Transportation and Moving occupations in Upper Bear Creek are Transportation (45 | 9.7%), and Production (7 | 1.5%).
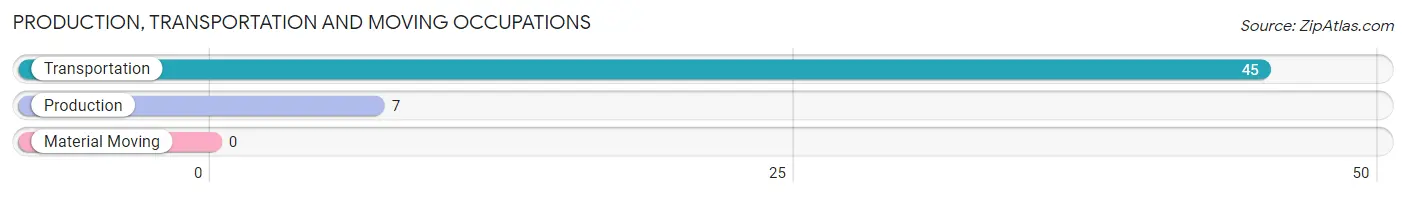
Production, Transportation and Moving Occupations by Sex
| Occupation | Male | Female |
| Production | 7 (100.0%) | 0 (0.0%) |
| Transportation | 45 (100.0%) | 0 (0.0%) |
| Material Moving | 0 (0.0%) | 0 (0.0%) |
| Total (Category) | 52 (100.0%) | 0 (0.0%) |
| Total (Overall) | 264 (57.0%) | 199 (43.0%) |
Employment Industries by Sex in Upper Bear Creek
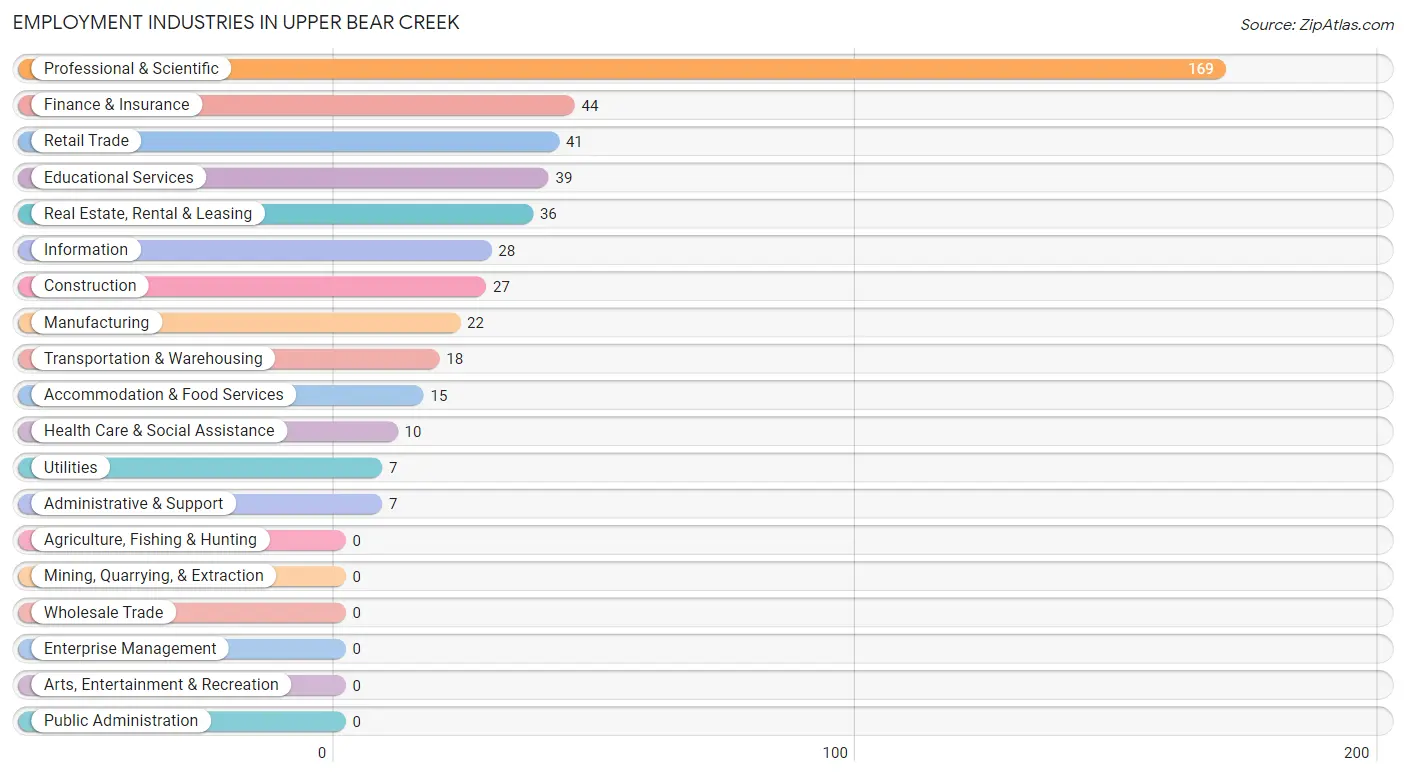
Employment Industries in Upper Bear Creek
The major employment industries in Upper Bear Creek include Professional & Scientific (169 | 36.5%), Finance & Insurance (44 | 9.5%), Retail Trade (41 | 8.9%), Educational Services (39 | 8.4%), and Real Estate, Rental & Leasing (36 | 7.8%).
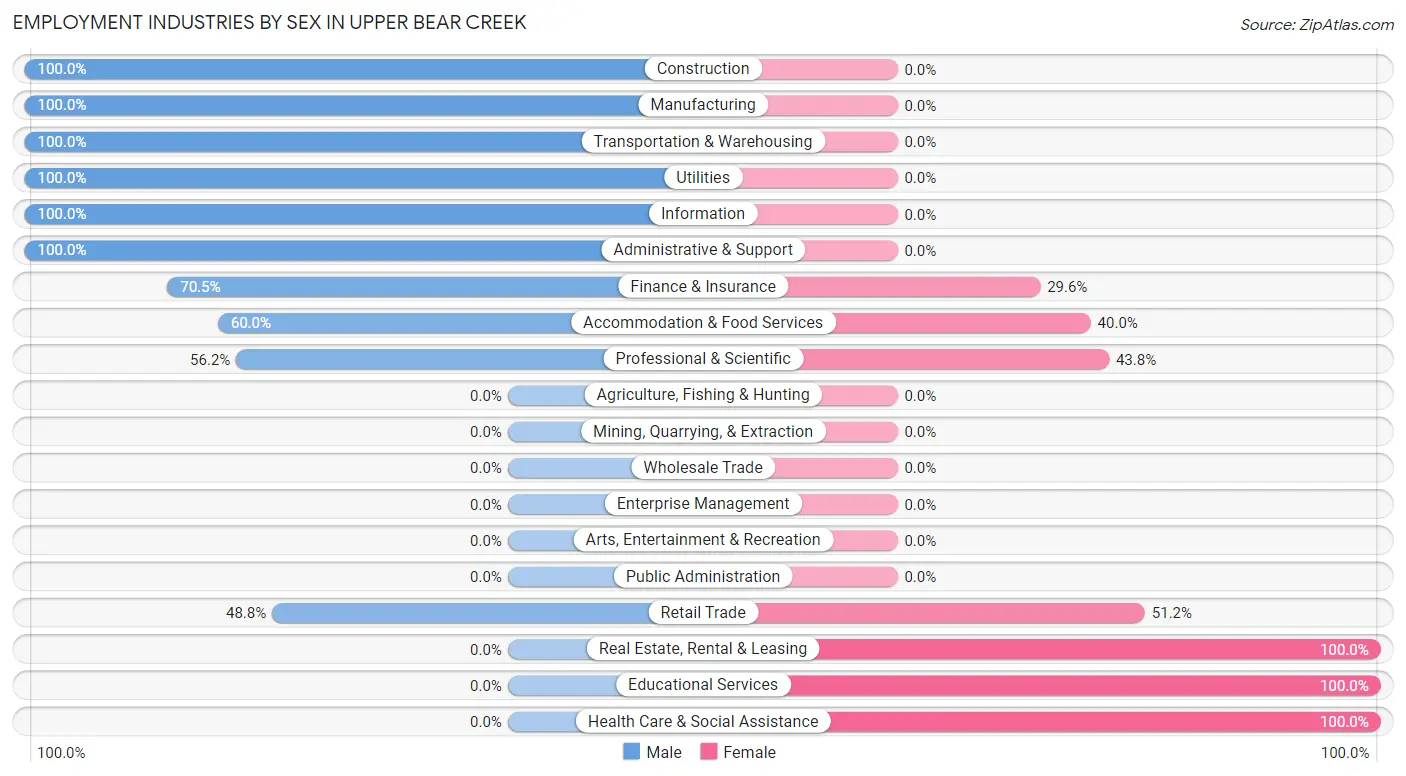
Employment Industries by Sex in Upper Bear Creek
The Upper Bear Creek industries that see more men than women are Construction (100.0%), Manufacturing (100.0%), and Transportation & Warehousing (100.0%), whereas the industries that tend to have a higher number of women are Real Estate, Rental & Leasing (100.0%), Educational Services (100.0%), and Health Care & Social Assistance (100.0%).
| Industry | Male | Female |
| Agriculture, Fishing & Hunting | 0 (0.0%) | 0 (0.0%) |
| Mining, Quarrying, & Extraction | 0 (0.0%) | 0 (0.0%) |
| Construction | 27 (100.0%) | 0 (0.0%) |
| Manufacturing | 22 (100.0%) | 0 (0.0%) |
| Wholesale Trade | 0 (0.0%) | 0 (0.0%) |
| Retail Trade | 20 (48.8%) | 21 (51.2%) |
| Transportation & Warehousing | 18 (100.0%) | 0 (0.0%) |
| Utilities | 7 (100.0%) | 0 (0.0%) |
| Information | 28 (100.0%) | 0 (0.0%) |
| Finance & Insurance | 31 (70.5%) | 13 (29.5%) |
| Real Estate, Rental & Leasing | 0 (0.0%) | 36 (100.0%) |
| Professional & Scientific | 95 (56.2%) | 74 (43.8%) |
| Enterprise Management | 0 (0.0%) | 0 (0.0%) |
| Administrative & Support | 7 (100.0%) | 0 (0.0%) |
| Educational Services | 0 (0.0%) | 39 (100.0%) |
| Health Care & Social Assistance | 0 (0.0%) | 10 (100.0%) |
| Arts, Entertainment & Recreation | 0 (0.0%) | 0 (0.0%) |
| Accommodation & Food Services | 9 (60.0%) | 6 (40.0%) |
| Public Administration | 0 (0.0%) | 0 (0.0%) |
| Total | 264 (57.0%) | 199 (43.0%) |
Education in Upper Bear Creek
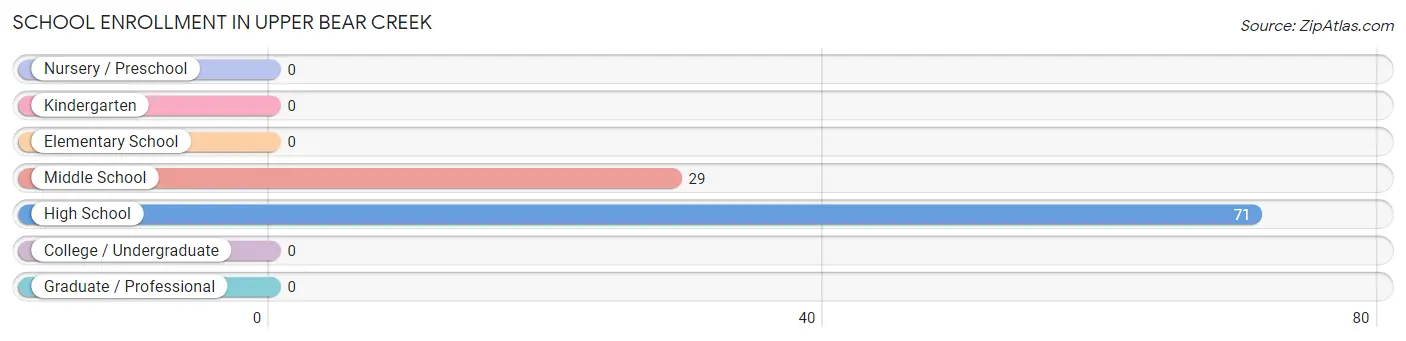
School Enrollment in Upper Bear Creek
The most common levels of schooling among the 100 students in Upper Bear Creek are high school (71 | 71.0%), and middle school (29 | 29.0%).
| School Level | # Students | % Students |
| Nursery / Preschool | 0 | 0.0% |
| Kindergarten | 0 | 0.0% |
| Elementary School | 0 | 0.0% |
| Middle School | 29 | 29.0% |
| High School | 71 | 71.0% |
| College / Undergraduate | 0 | 0.0% |
| Graduate / Professional | 0 | 0.0% |
| Total | 100 | 100.0% |
School Enrollment by Age by Funding Source in Upper Bear Creek
Out of a total of 100 students who are enrolled in schools in Upper Bear Creek, 18 (18.0%) attend a private institution, while the remaining 82 (82.0%) are enrolled in public schools. The age group of 10 to 14 year olds has the highest likelihood of being enrolled in private schools, with 18 (42.9% in the age bracket) enrolled. Conversely, the age group of 15 to 17 year olds has the lowest likelihood of being enrolled in a private school, with 43 (100.0% in the age bracket) attending a public institution.
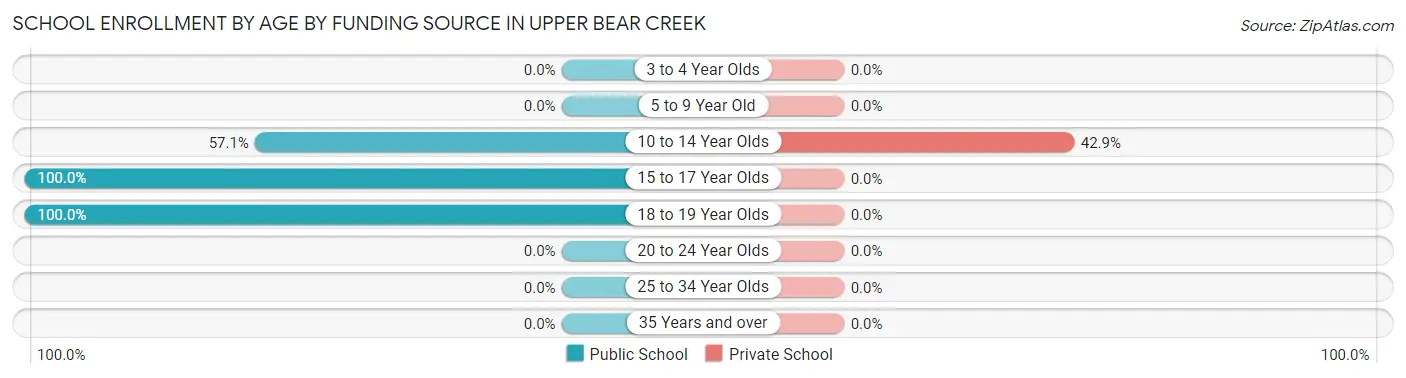
| Age Bracket | Public School | Private School |
| 3 to 4 Year Olds | 0 (0.0%) | 0 (0.0%) |
| 5 to 9 Year Old | 0 (0.0%) | 0 (0.0%) |
| 10 to 14 Year Olds | 24 (57.1%) | 18 (42.9%) |
| 15 to 17 Year Olds | 43 (100.0%) | 0 (0.0%) |
| 18 to 19 Year Olds | 15 (100.0%) | 0 (0.0%) |
| 20 to 24 Year Olds | 0 (0.0%) | 0 (0.0%) |
| 25 to 34 Year Olds | 0 (0.0%) | 0 (0.0%) |
| 35 Years and over | 0 (0.0%) | 0 (0.0%) |
| Total | 82 (82.0%) | 18 (18.0%) |
Educational Attainment by Field of Study in Upper Bear Creek
Physical & health sciences (120 | 25.5%), social sciences (53 | 11.3%), business (51 | 10.8%), engineering (49 | 10.4%), and computers & mathematics (45 | 9.6%) are the most common fields of study among 471 individuals in Upper Bear Creek who have obtained a bachelor's degree or higher.
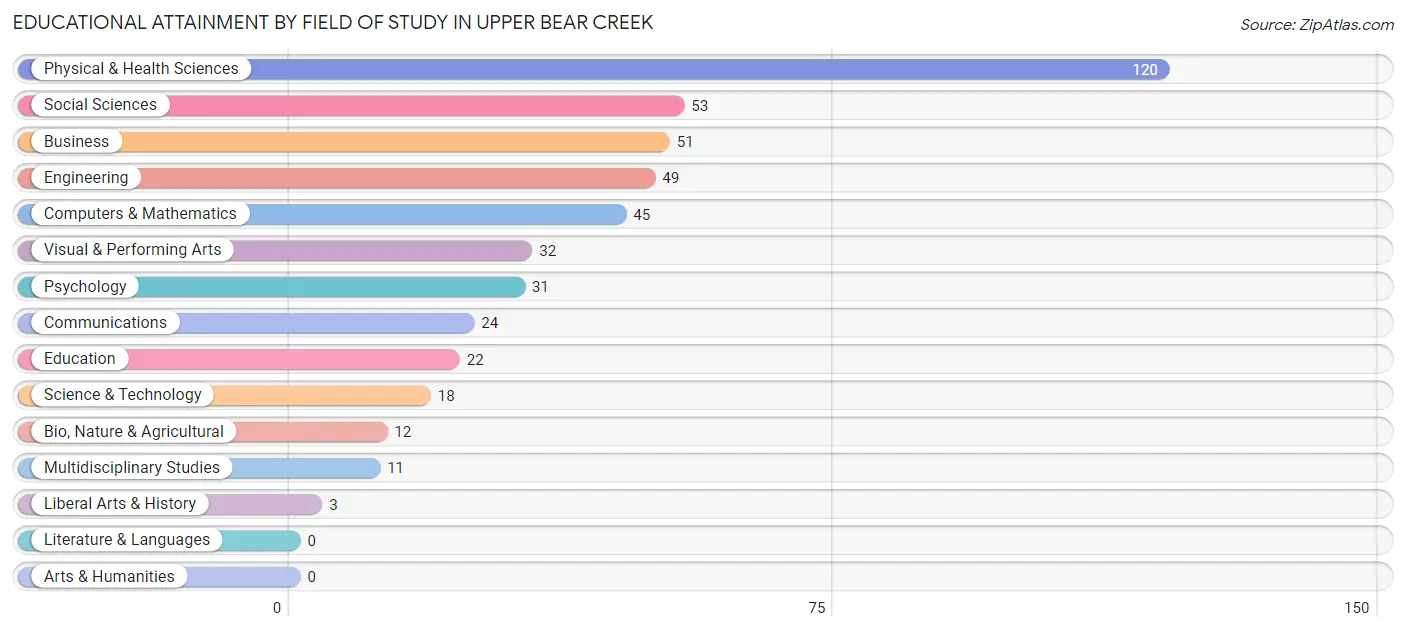
| Field of Study | # Graduates | % Graduates |
| Computers & Mathematics | 45 | 9.6% |
| Bio, Nature & Agricultural | 12 | 2.5% |
| Physical & Health Sciences | 120 | 25.5% |
| Psychology | 31 | 6.6% |
| Social Sciences | 53 | 11.3% |
| Engineering | 49 | 10.4% |
| Multidisciplinary Studies | 11 | 2.3% |
| Science & Technology | 18 | 3.8% |
| Business | 51 | 10.8% |
| Education | 22 | 4.7% |
| Literature & Languages | 0 | 0.0% |
| Liberal Arts & History | 3 | 0.6% |
| Visual & Performing Arts | 32 | 6.8% |
| Communications | 24 | 5.1% |
| Arts & Humanities | 0 | 0.0% |
| Total | 471 | 100.0% |
Transportation & Commute in Upper Bear Creek
Vehicle Availability by Sex in Upper Bear Creek
The most prevalent vehicle ownership categories in Upper Bear Creek are males with 2 vehicles (139, accounting for 52.6%) and females with 2 vehicles (115, making up 69.9%).
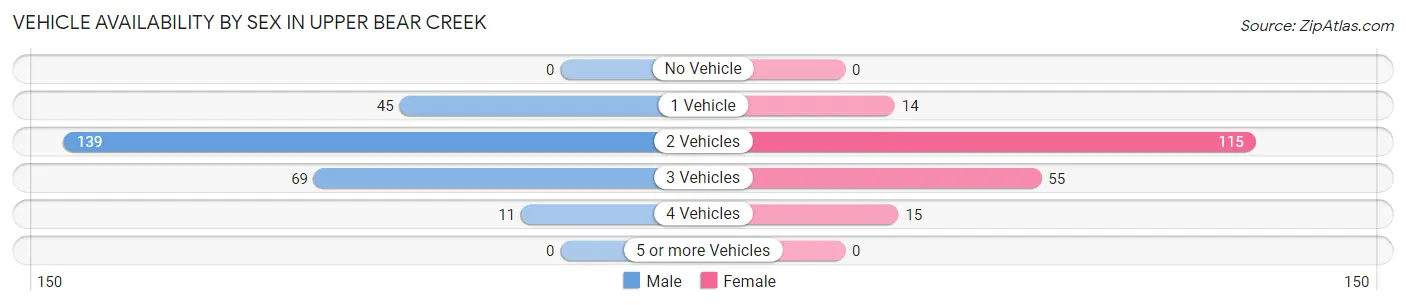
| Vehicles Available | Male | Female |
| No Vehicle | 0 (0.0%) | 0 (0.0%) |
| 1 Vehicle | 45 (17.1%) | 14 (7.0%) |
| 2 Vehicles | 139 (52.6%) | 115 (57.8%) |
| 3 Vehicles | 69 (26.1%) | 55 (27.6%) |
| 4 Vehicles | 11 (4.2%) | 15 (7.5%) |
| 5 or more Vehicles | 0 (0.0%) | 0 (0.0%) |
| Total | 264 (100.0%) | 199 (100.0%) |
Commute Time in Upper Bear Creek
The most frequently occuring commute durations in Upper Bear Creek are 15 to 19 minutes (68 commuters, 27.0%), less than 5 minutes (57 commuters, 22.6%), and 10 to 14 minutes (55 commuters, 21.8%).
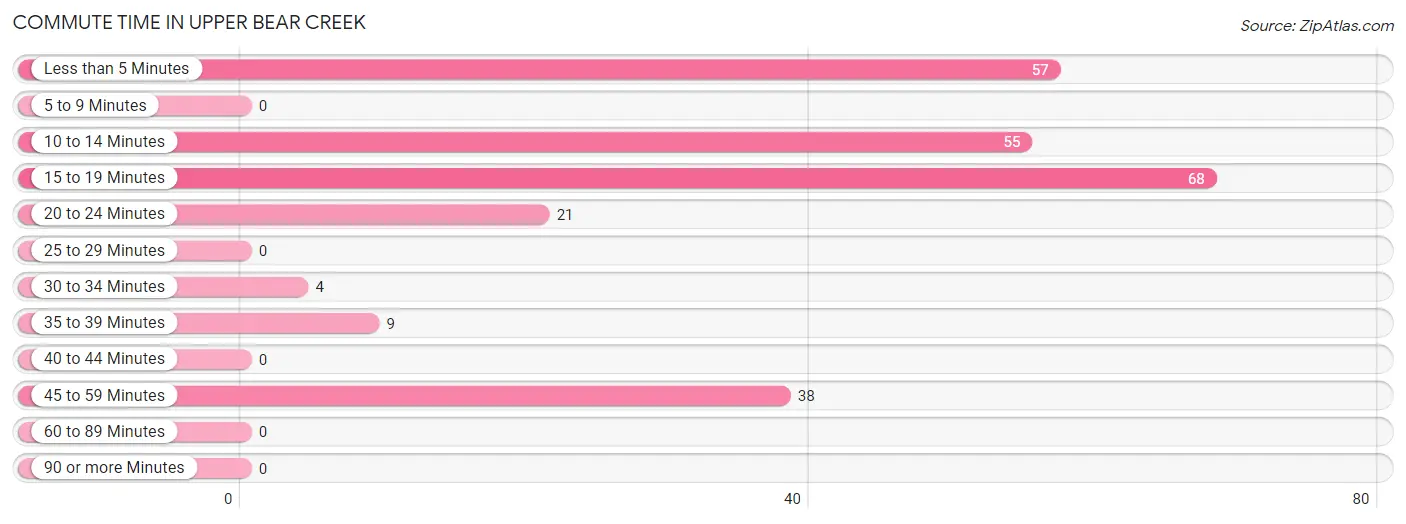
| Commute Time | # Commuters | % Commuters |
| Less than 5 Minutes | 57 | 22.6% |
| 5 to 9 Minutes | 0 | 0.0% |
| 10 to 14 Minutes | 55 | 21.8% |
| 15 to 19 Minutes | 68 | 27.0% |
| 20 to 24 Minutes | 21 | 8.3% |
| 25 to 29 Minutes | 0 | 0.0% |
| 30 to 34 Minutes | 4 | 1.6% |
| 35 to 39 Minutes | 9 | 3.6% |
| 40 to 44 Minutes | 0 | 0.0% |
| 45 to 59 Minutes | 38 | 15.1% |
| 60 to 89 Minutes | 0 | 0.0% |
| 90 or more Minutes | 0 | 0.0% |
Commute Time by Sex in Upper Bear Creek
The most common commute times in Upper Bear Creek are less than 5 minutes (38 commuters, 32.5%) for males and 15 to 19 minutes (49 commuters, 36.3%) for females.
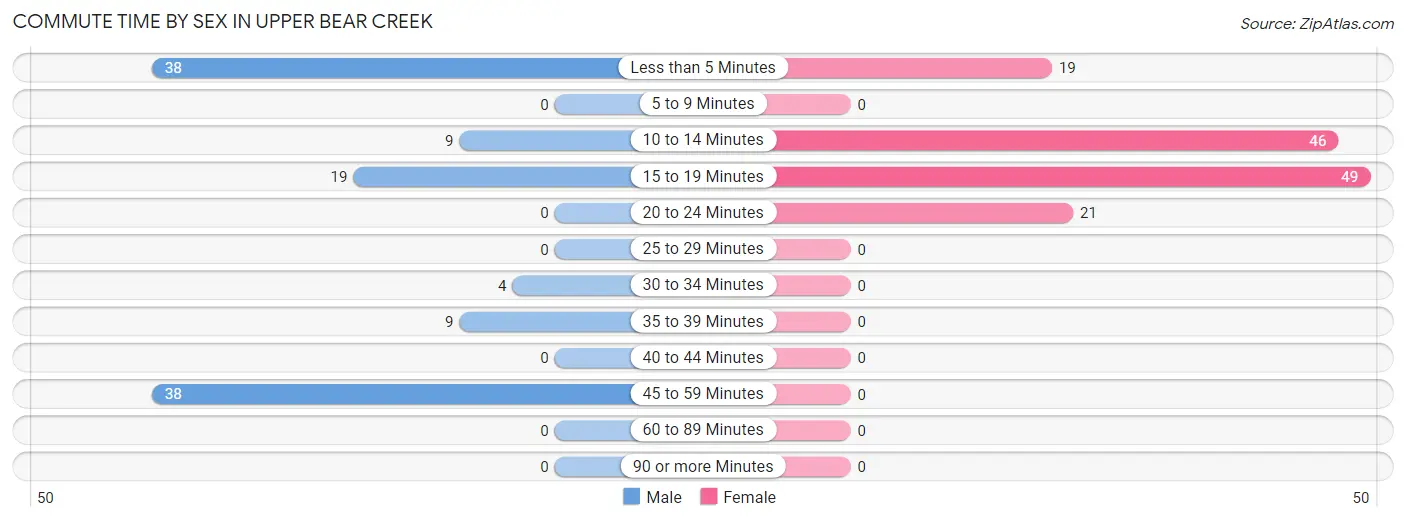
| Commute Time | Male | Female |
| Less than 5 Minutes | 38 (32.5%) | 19 (14.1%) |
| 5 to 9 Minutes | 0 (0.0%) | 0 (0.0%) |
| 10 to 14 Minutes | 9 (7.7%) | 46 (34.1%) |
| 15 to 19 Minutes | 19 (16.2%) | 49 (36.3%) |
| 20 to 24 Minutes | 0 (0.0%) | 21 (15.6%) |
| 25 to 29 Minutes | 0 (0.0%) | 0 (0.0%) |
| 30 to 34 Minutes | 4 (3.4%) | 0 (0.0%) |
| 35 to 39 Minutes | 9 (7.7%) | 0 (0.0%) |
| 40 to 44 Minutes | 0 (0.0%) | 0 (0.0%) |
| 45 to 59 Minutes | 38 (32.5%) | 0 (0.0%) |
| 60 to 89 Minutes | 0 (0.0%) | 0 (0.0%) |
| 90 or more Minutes | 0 (0.0%) | 0 (0.0%) |
Time of Departure to Work by Sex in Upper Bear Creek
The most frequent times of departure to work in Upper Bear Creek are 8:00 AM to 8:29 AM (36, 30.8%) for males and 7:00 AM to 7:29 AM (40, 29.6%) for females.
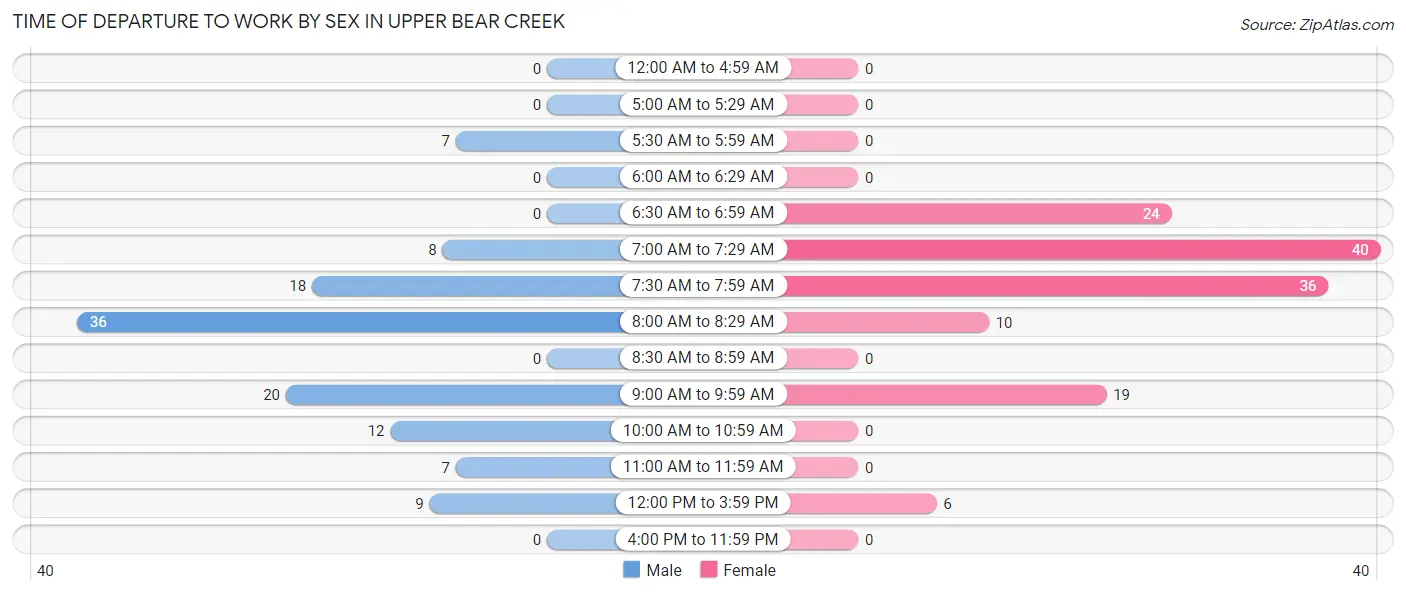
| Time of Departure | Male | Female |
| 12:00 AM to 4:59 AM | 0 (0.0%) | 0 (0.0%) |
| 5:00 AM to 5:29 AM | 0 (0.0%) | 0 (0.0%) |
| 5:30 AM to 5:59 AM | 7 (6.0%) | 0 (0.0%) |
| 6:00 AM to 6:29 AM | 0 (0.0%) | 0 (0.0%) |
| 6:30 AM to 6:59 AM | 0 (0.0%) | 24 (17.8%) |
| 7:00 AM to 7:29 AM | 8 (6.8%) | 40 (29.6%) |
| 7:30 AM to 7:59 AM | 18 (15.4%) | 36 (26.7%) |
| 8:00 AM to 8:29 AM | 36 (30.8%) | 10 (7.4%) |
| 8:30 AM to 8:59 AM | 0 (0.0%) | 0 (0.0%) |
| 9:00 AM to 9:59 AM | 20 (17.1%) | 19 (14.1%) |
| 10:00 AM to 10:59 AM | 12 (10.3%) | 0 (0.0%) |
| 11:00 AM to 11:59 AM | 7 (6.0%) | 0 (0.0%) |
| 12:00 PM to 3:59 PM | 9 (7.7%) | 6 (4.4%) |
| 4:00 PM to 11:59 PM | 0 (0.0%) | 0 (0.0%) |
| Total | 117 (100.0%) | 135 (100.0%) |
Housing Occupancy in Upper Bear Creek
Occupancy by Ownership in Upper Bear Creek
Of the total 495 dwellings in Upper Bear Creek, owner-occupied units account for 432 (87.3%), while renter-occupied units make up 63 (12.7%).
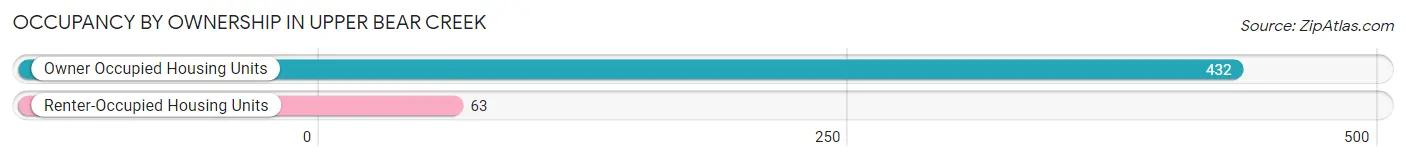
| Occupancy | # Housing Units | % Housing Units |
| Owner Occupied Housing Units | 432 | 87.3% |
| Renter-Occupied Housing Units | 63 | 12.7% |
| Total Occupied Housing Units | 495 | 100.0% |
Occupancy by Household Size in Upper Bear Creek
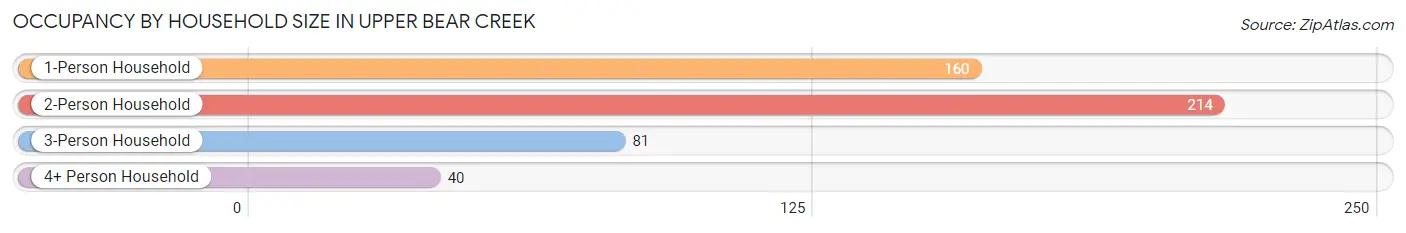
| Household Size | # Housing Units | % Housing Units |
| 1-Person Household | 160 | 32.3% |
| 2-Person Household | 214 | 43.2% |
| 3-Person Household | 81 | 16.4% |
| 4+ Person Household | 40 | 8.1% |
| Total Housing Units | 495 | 100.0% |
Occupancy by Ownership by Household Size in Upper Bear Creek
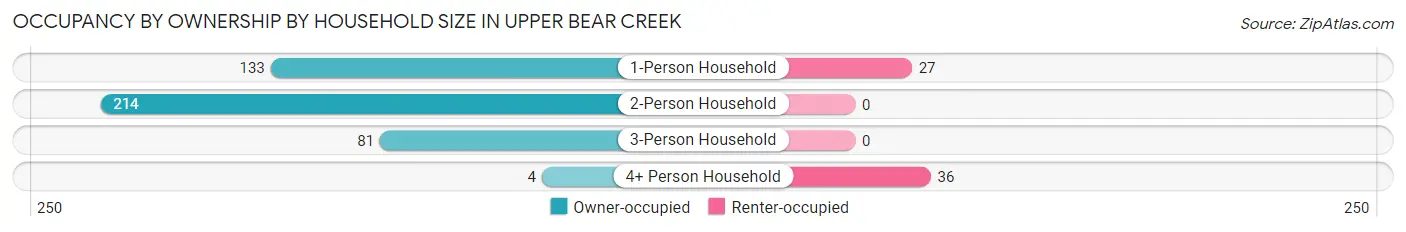
| Household Size | Owner-occupied | Renter-occupied |
| 1-Person Household | 133 (83.1%) | 27 (16.9%) |
| 2-Person Household | 214 (100.0%) | 0 (0.0%) |
| 3-Person Household | 81 (100.0%) | 0 (0.0%) |
| 4+ Person Household | 4 (10.0%) | 36 (90.0%) |
| Total Housing Units | 432 (87.3%) | 63 (12.7%) |
Occupancy by Educational Attainment in Upper Bear Creek
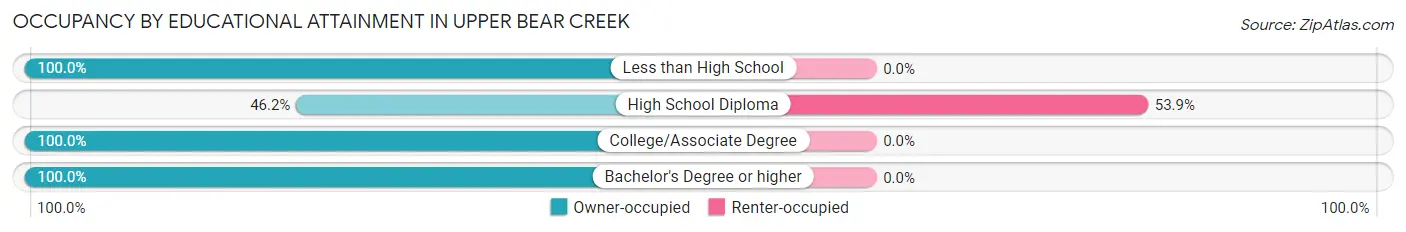
| Household Size | Owner-occupied | Renter-occupied |
| Less than High School | 27 (100.0%) | 0 (0.0%) |
| High School Diploma | 54 (46.2%) | 63 (53.8%) |
| College/Associate Degree | 85 (100.0%) | 0 (0.0%) |
| Bachelor's Degree or higher | 266 (100.0%) | 0 (0.0%) |
Occupancy by Age of Householder in Upper Bear Creek
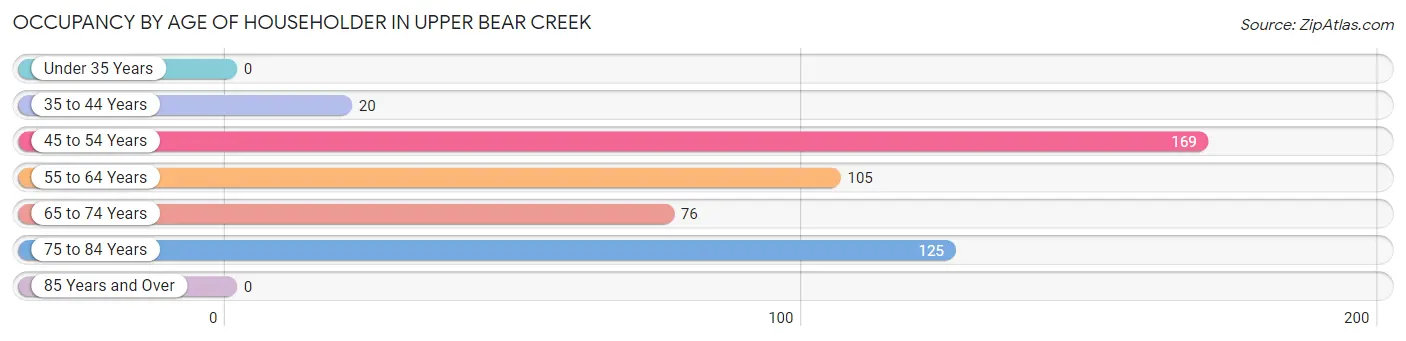
| Age Bracket | # Households | % Households |
| Under 35 Years | 0 | 0.0% |
| 35 to 44 Years | 20 | 4.0% |
| 45 to 54 Years | 169 | 34.1% |
| 55 to 64 Years | 105 | 21.2% |
| 65 to 74 Years | 76 | 15.3% |
| 75 to 84 Years | 125 | 25.3% |
| 85 Years and Over | 0 | 0.0% |
| Total | 495 | 100.0% |
Housing Finances in Upper Bear Creek
Median Income by Occupancy in Upper Bear Creek
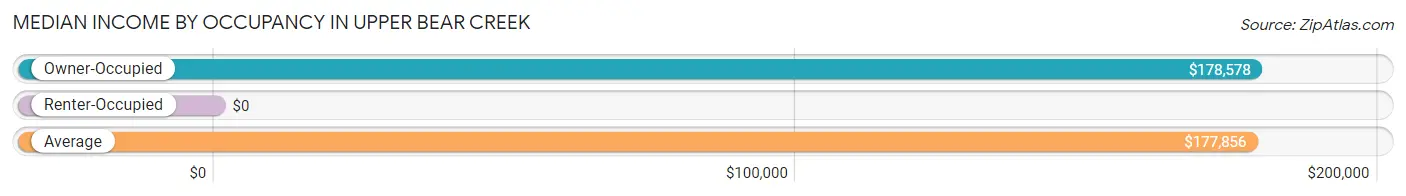
| Occupancy Type | # Households | Median Income |
| Owner-Occupied | 432 (87.3%) | $178,578 |
| Renter-Occupied | 63 (12.7%) | $0 |
| Average | 495 (100.0%) | $177,856 |
Occupancy by Householder Income Bracket in Upper Bear Creek
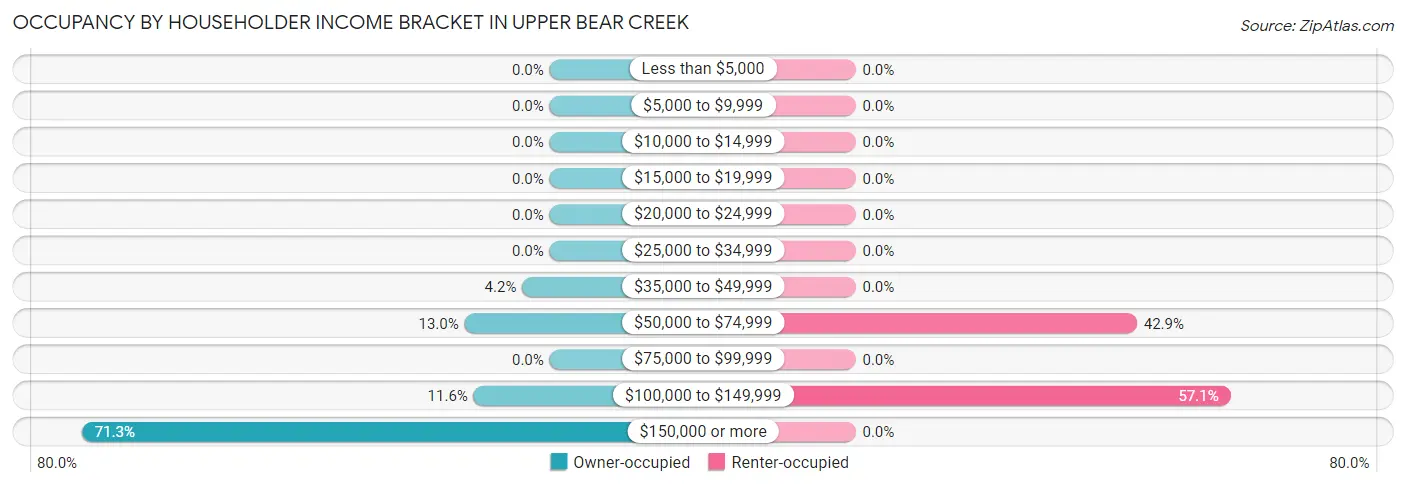
| Income Bracket | Owner-occupied | Renter-occupied |
| Less than $5,000 | 0 (0.0%) | 0 (0.0%) |
| $5,000 to $9,999 | 0 (0.0%) | 0 (0.0%) |
| $10,000 to $14,999 | 0 (0.0%) | 0 (0.0%) |
| $15,000 to $19,999 | 0 (0.0%) | 0 (0.0%) |
| $20,000 to $24,999 | 0 (0.0%) | 0 (0.0%) |
| $25,000 to $34,999 | 0 (0.0%) | 0 (0.0%) |
| $35,000 to $49,999 | 18 (4.2%) | 0 (0.0%) |
| $50,000 to $74,999 | 56 (13.0%) | 27 (42.9%) |
| $75,000 to $99,999 | 0 (0.0%) | 0 (0.0%) |
| $100,000 to $149,999 | 50 (11.6%) | 36 (57.1%) |
| $150,000 or more | 308 (71.3%) | 0 (0.0%) |
| Total | 432 (100.0%) | 63 (100.0%) |
Monthly Housing Cost Tiers in Upper Bear Creek
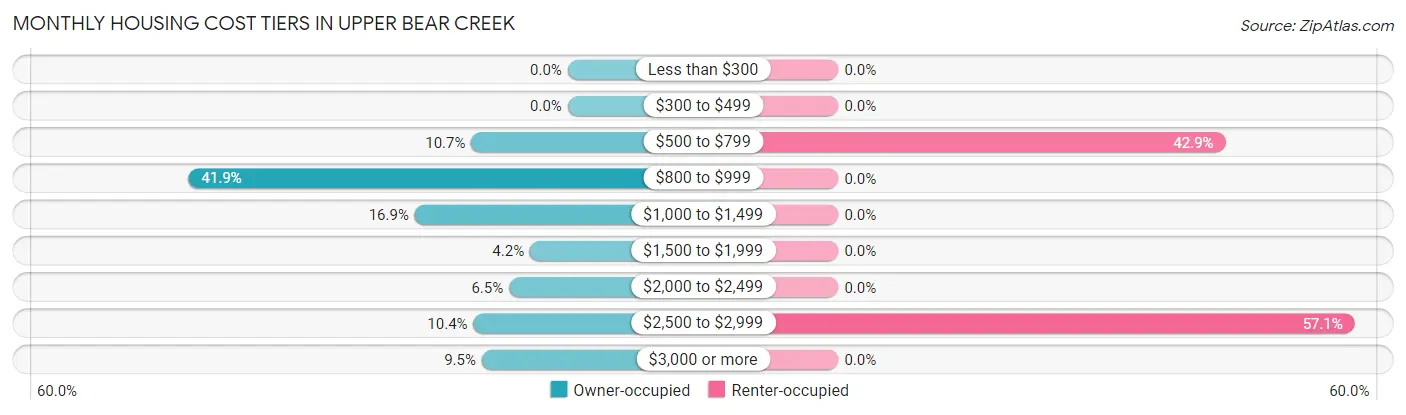
| Monthly Cost | Owner-occupied | Renter-occupied |
| Less than $300 | 0 (0.0%) | 0 (0.0%) |
| $300 to $499 | 0 (0.0%) | 0 (0.0%) |
| $500 to $799 | 46 (10.6%) | 27 (42.9%) |
| $800 to $999 | 181 (41.9%) | 0 (0.0%) |
| $1,000 to $1,499 | 73 (16.9%) | 0 (0.0%) |
| $1,500 to $1,999 | 18 (4.2%) | 0 (0.0%) |
| $2,000 to $2,499 | 28 (6.5%) | 0 (0.0%) |
| $2,500 to $2,999 | 45 (10.4%) | 36 (57.1%) |
| $3,000 or more | 41 (9.5%) | 0 (0.0%) |
| Total | 432 (100.0%) | 63 (100.0%) |
Physical Housing Characteristics in Upper Bear Creek
Housing Structures in Upper Bear Creek
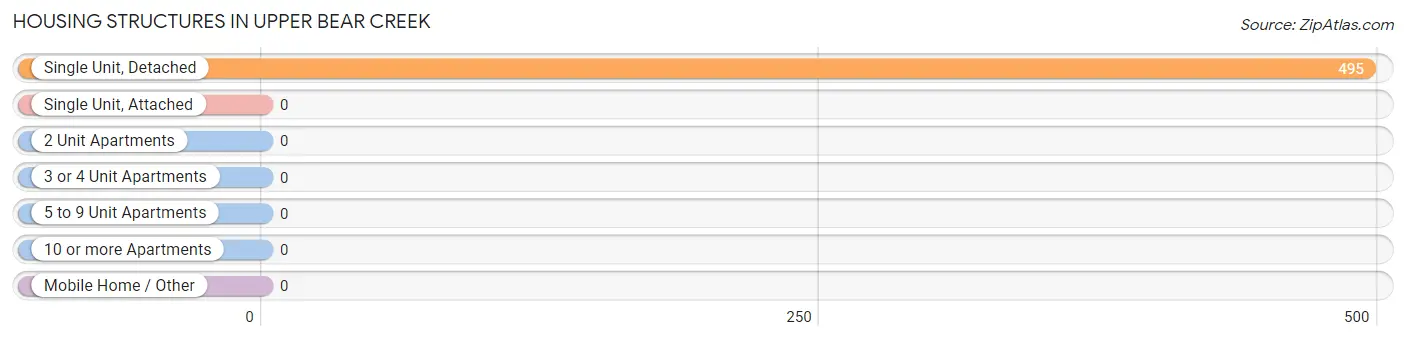
| Structure Type | # Housing Units | % Housing Units |
| Single Unit, Detached | 495 | 100.0% |
| Single Unit, Attached | 0 | 0.0% |
| 2 Unit Apartments | 0 | 0.0% |
| 3 or 4 Unit Apartments | 0 | 0.0% |
| 5 to 9 Unit Apartments | 0 | 0.0% |
| 10 or more Apartments | 0 | 0.0% |
| Mobile Home / Other | 0 | 0.0% |
| Total | 495 | 100.0% |
Housing Structures by Occupancy in Upper Bear Creek
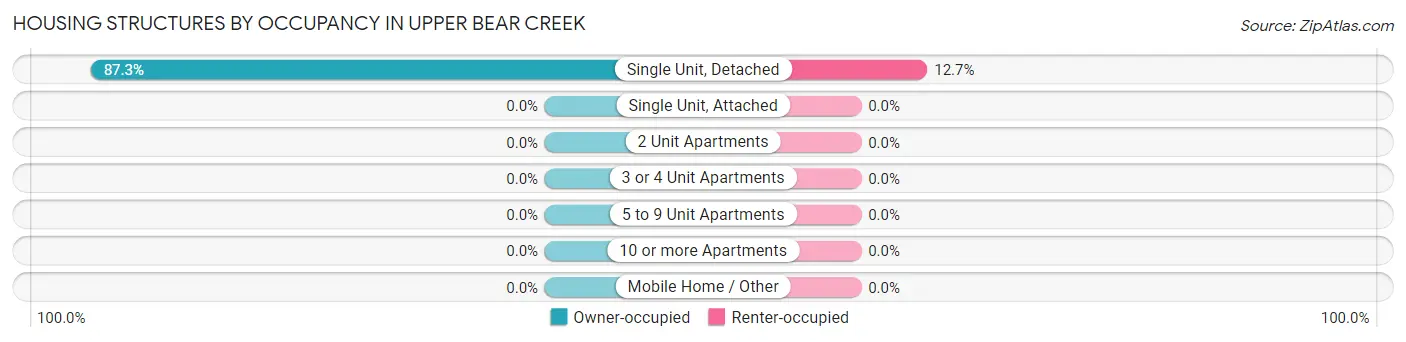
| Structure Type | Owner-occupied | Renter-occupied |
| Single Unit, Detached | 432 (87.3%) | 63 (12.7%) |
| Single Unit, Attached | 0 (0.0%) | 0 (0.0%) |
| 2 Unit Apartments | 0 (0.0%) | 0 (0.0%) |
| 3 or 4 Unit Apartments | 0 (0.0%) | 0 (0.0%) |
| 5 to 9 Unit Apartments | 0 (0.0%) | 0 (0.0%) |
| 10 or more Apartments | 0 (0.0%) | 0 (0.0%) |
| Mobile Home / Other | 0 (0.0%) | 0 (0.0%) |
| Total | 432 (87.3%) | 63 (12.7%) |
Housing Structures by Number of Rooms in Upper Bear Creek
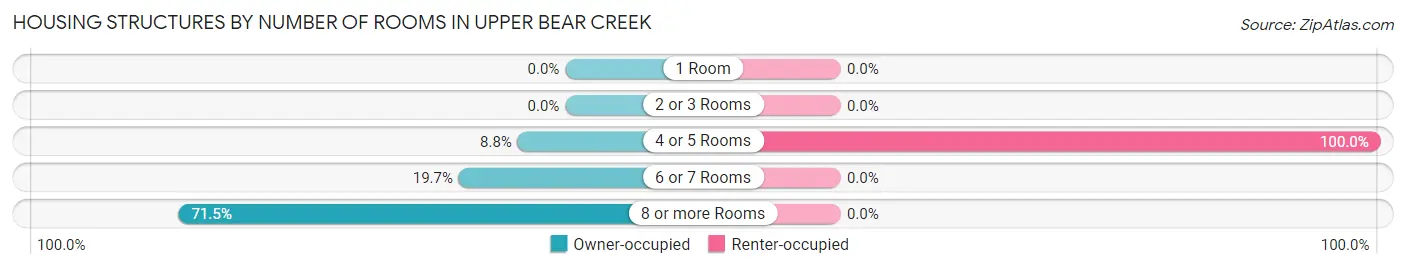
| Number of Rooms | Owner-occupied | Renter-occupied |
| 1 Room | 0 (0.0%) | 0 (0.0%) |
| 2 or 3 Rooms | 0 (0.0%) | 0 (0.0%) |
| 4 or 5 Rooms | 38 (8.8%) | 63 (100.0%) |
| 6 or 7 Rooms | 85 (19.7%) | 0 (0.0%) |
| 8 or more Rooms | 309 (71.5%) | 0 (0.0%) |
| Total | 432 (100.0%) | 63 (100.0%) |
Housing Structure by Heating Type in Upper Bear Creek
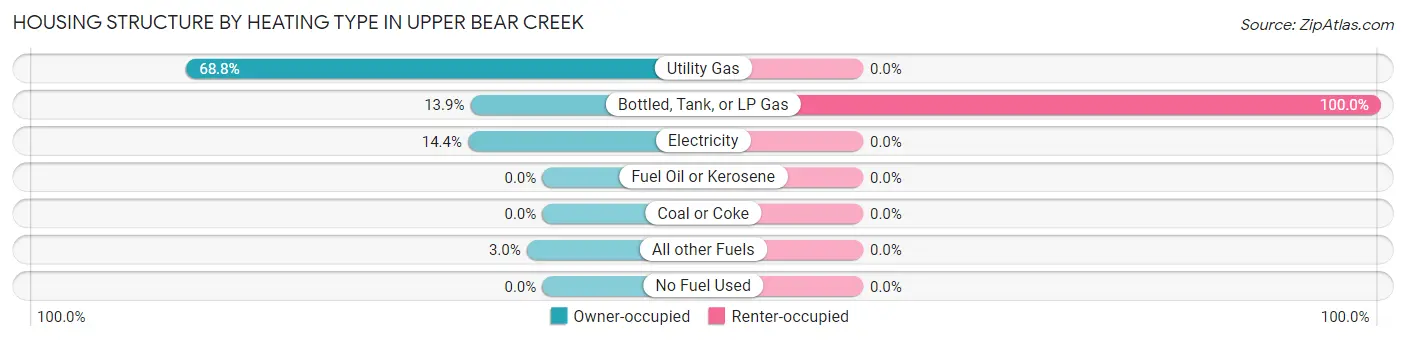
| Heating Type | Owner-occupied | Renter-occupied |
| Utility Gas | 297 (68.8%) | 0 (0.0%) |
| Bottled, Tank, or LP Gas | 60 (13.9%) | 63 (100.0%) |
| Electricity | 62 (14.3%) | 0 (0.0%) |
| Fuel Oil or Kerosene | 0 (0.0%) | 0 (0.0%) |
| Coal or Coke | 0 (0.0%) | 0 (0.0%) |
| All other Fuels | 13 (3.0%) | 0 (0.0%) |
| No Fuel Used | 0 (0.0%) | 0 (0.0%) |
| Total | 432 (100.0%) | 63 (100.0%) |
Household Vehicle Usage in Upper Bear Creek
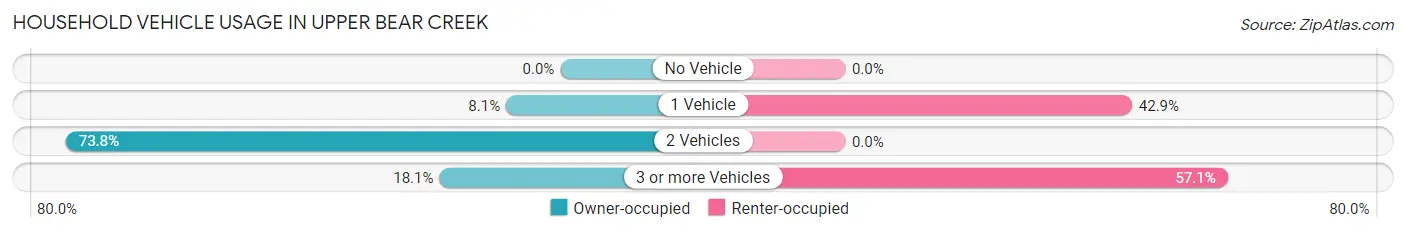
| Vehicles per Household | Owner-occupied | Renter-occupied |
| No Vehicle | 0 (0.0%) | 0 (0.0%) |
| 1 Vehicle | 35 (8.1%) | 27 (42.9%) |
| 2 Vehicles | 319 (73.8%) | 0 (0.0%) |
| 3 or more Vehicles | 78 (18.1%) | 36 (57.1%) |
| Total | 432 (100.0%) | 63 (100.0%) |
Real Estate & Mortgages in Upper Bear Creek
Real Estate and Mortgage Overview in Upper Bear Creek
| Characteristic | Without Mortgage | With Mortgage |
| Housing Units | 266 | 166 |
| Median Property Value | $1,141,300 | $737,500 |
| Median Household Income | $179,197 | $101 |
| Monthly Housing Costs | $871 | $28 |
| Real Estate Taxes | $4,385 | $0 |
Property Value by Mortgage Status in Upper Bear Creek
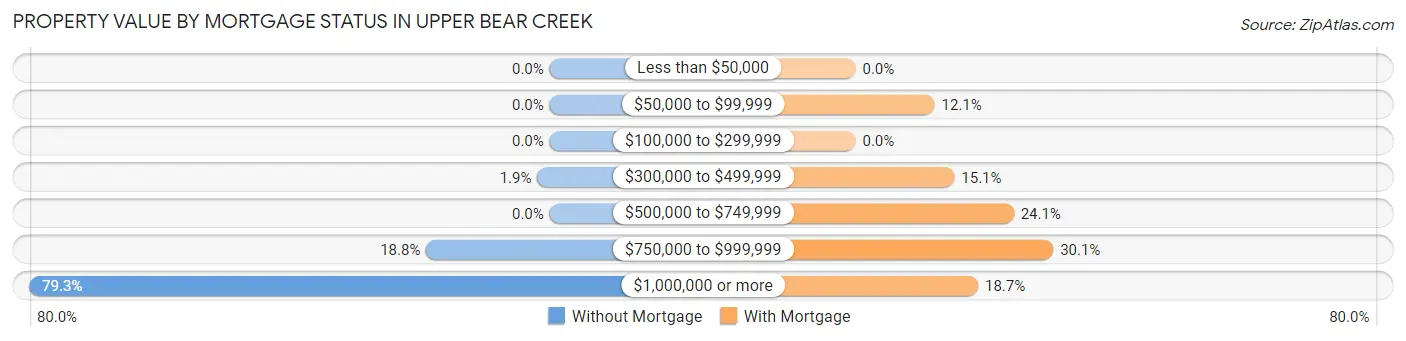
| Property Value | Without Mortgage | With Mortgage |
| Less than $50,000 | 0 (0.0%) | 0 (0.0%) |
| $50,000 to $99,999 | 0 (0.0%) | 20 (12.0%) |
| $100,000 to $299,999 | 0 (0.0%) | 0 (0.0%) |
| $300,000 to $499,999 | 5 (1.9%) | 25 (15.1%) |
| $500,000 to $749,999 | 0 (0.0%) | 40 (24.1%) |
| $750,000 to $999,999 | 50 (18.8%) | 50 (30.1%) |
| $1,000,000 or more | 211 (79.3%) | 31 (18.7%) |
| Total | 266 (100.0%) | 166 (100.0%) |
Household Income by Mortgage Status in Upper Bear Creek
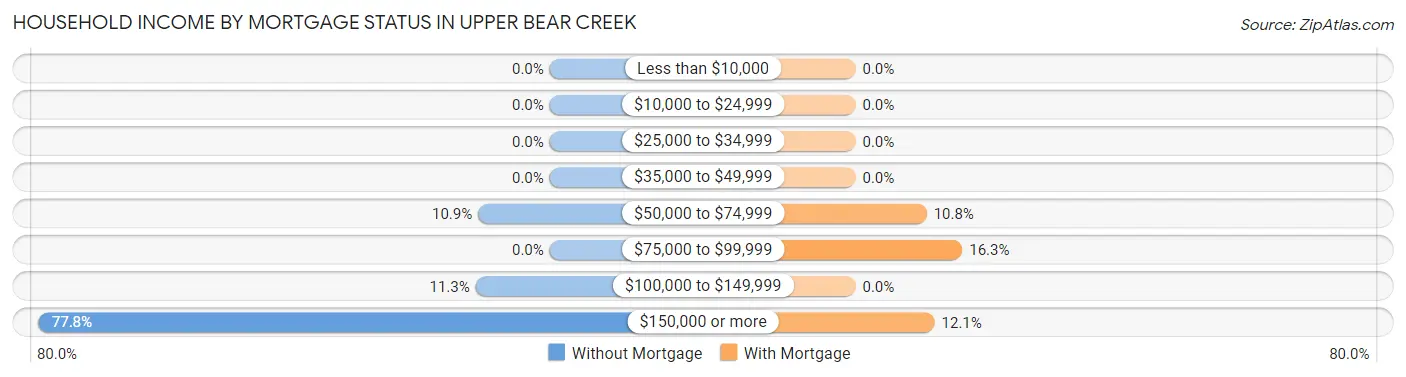
| Household Income | Without Mortgage | With Mortgage |
| Less than $10,000 | 0 (0.0%) | 0 (0.0%) |
| $10,000 to $24,999 | 0 (0.0%) | 0 (0.0%) |
| $25,000 to $34,999 | 0 (0.0%) | 0 (0.0%) |
| $35,000 to $49,999 | 0 (0.0%) | 0 (0.0%) |
| $50,000 to $74,999 | 29 (10.9%) | 18 (10.8%) |
| $75,000 to $99,999 | 0 (0.0%) | 27 (16.3%) |
| $100,000 to $149,999 | 30 (11.3%) | 0 (0.0%) |
| $150,000 or more | 207 (77.8%) | 20 (12.0%) |
| Total | 266 (100.0%) | 166 (100.0%) |
Property Value to Household Income Ratio in Upper Bear Creek
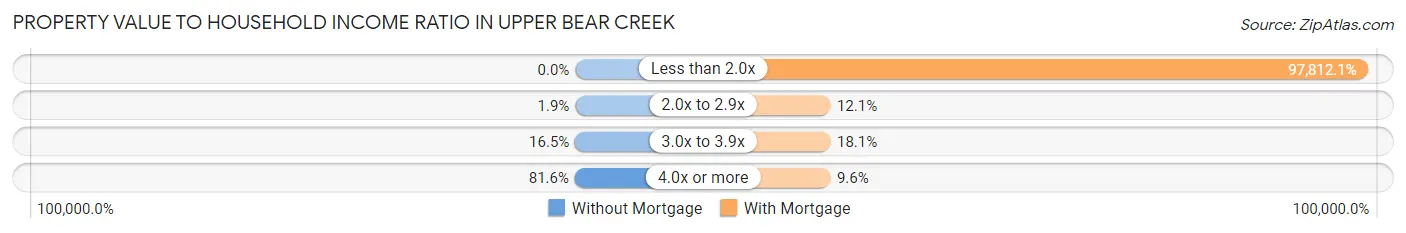
| Value-to-Income Ratio | Without Mortgage | With Mortgage |
| Less than 2.0x | 0 (0.0%) | 162,368 (97,812.0%) |
| 2.0x to 2.9x | 5 (1.9%) | 20 (12.0%) |
| 3.0x to 3.9x | 44 (16.5%) | 30 (18.1%) |
| 4.0x or more | 217 (81.6%) | 16 (9.6%) |
| Total | 266 (100.0%) | 166 (100.0%) |
Real Estate Taxes by Mortgage Status in Upper Bear Creek
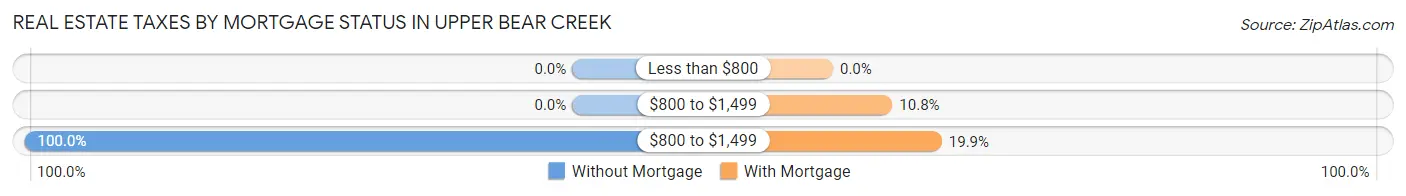
| Property Taxes | Without Mortgage | With Mortgage |
| Less than $800 | 0 (0.0%) | 0 (0.0%) |
| $800 to $1,499 | 0 (0.0%) | 18 (10.8%) |
| $800 to $1,499 | 266 (100.0%) | 33 (19.9%) |
| Total | 266 (100.0%) | 166 (100.0%) |
Health & Disability in Upper Bear Creek
Health Insurance Coverage by Age in Upper Bear Creek
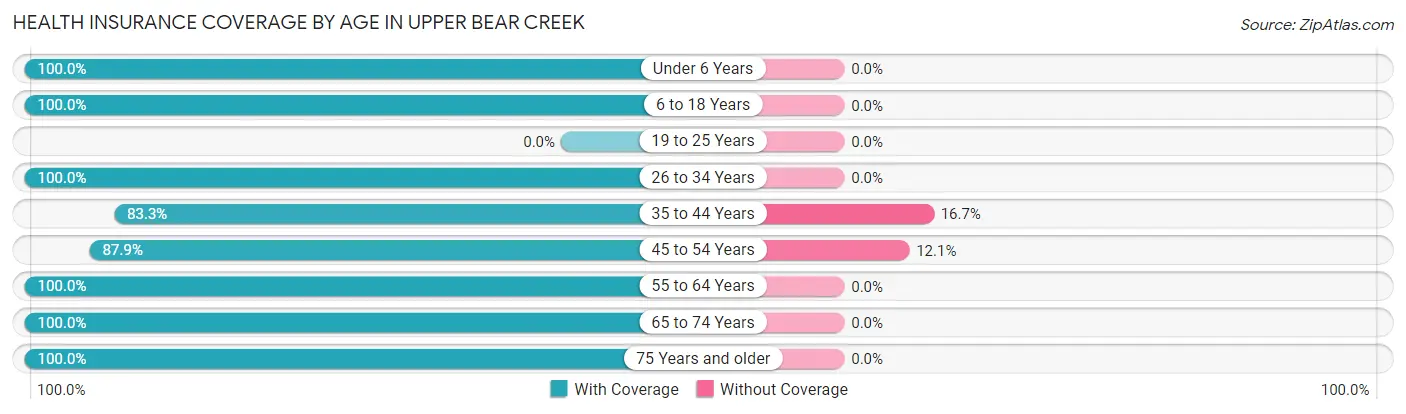
| Age Bracket | With Coverage | Without Coverage |
| Under 6 Years | 16 (100.0%) | 0 (0.0%) |
| 6 to 18 Years | 100 (100.0%) | 0 (0.0%) |
| 19 to 25 Years | 0 (0.0%) | 0 (0.0%) |
| 26 to 34 Years | 37 (100.0%) | 0 (0.0%) |
| 35 to 44 Years | 20 (83.3%) | 4 (16.7%) |
| 45 to 54 Years | 196 (87.9%) | 27 (12.1%) |
| 55 to 64 Years | 261 (100.0%) | 0 (0.0%) |
| 65 to 74 Years | 128 (100.0%) | 0 (0.0%) |
| 75 Years and older | 132 (100.0%) | 0 (0.0%) |
| Total | 890 (96.6%) | 31 (3.4%) |
Health Insurance Coverage by Citizenship Status in Upper Bear Creek
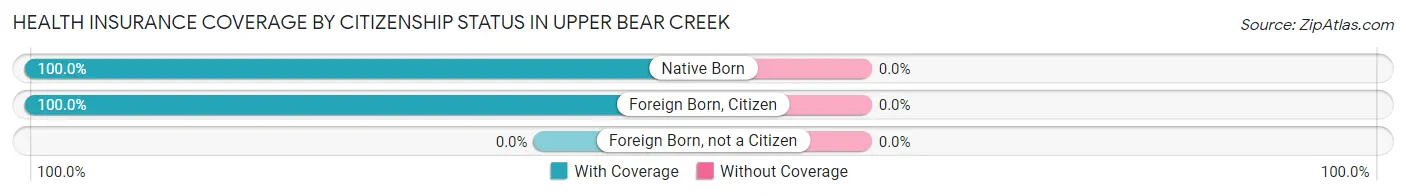
| Citizenship Status | With Coverage | Without Coverage |
| Native Born | 16 (100.0%) | 0 (0.0%) |
| Foreign Born, Citizen | 100 (100.0%) | 0 (0.0%) |
| Foreign Born, not a Citizen | 0 (0.0%) | 0 (0.0%) |
Health Insurance Coverage by Household Income in Upper Bear Creek
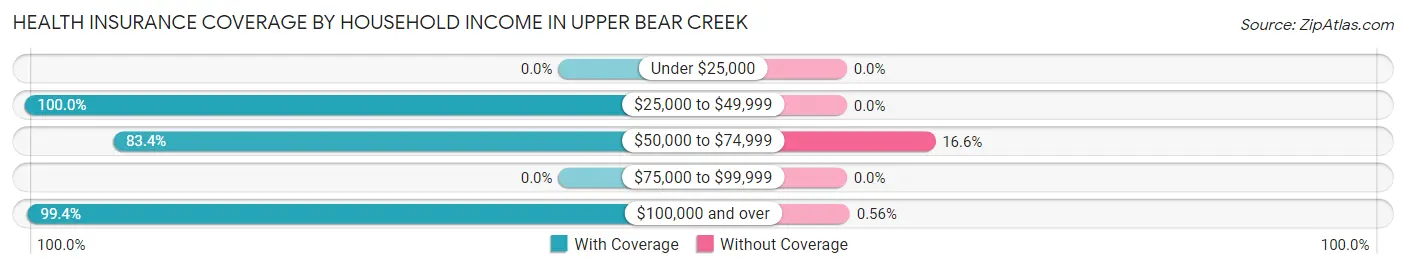
| Household Income | With Coverage | Without Coverage |
| Under $25,000 | 0 (0.0%) | 0 (0.0%) |
| $25,000 to $49,999 | 39 (100.0%) | 0 (0.0%) |
| $50,000 to $74,999 | 136 (83.4%) | 27 (16.6%) |
| $75,000 to $99,999 | 0 (0.0%) | 0 (0.0%) |
| $100,000 and over | 715 (99.4%) | 4 (0.6%) |
Public vs Private Health Insurance Coverage by Age in Upper Bear Creek
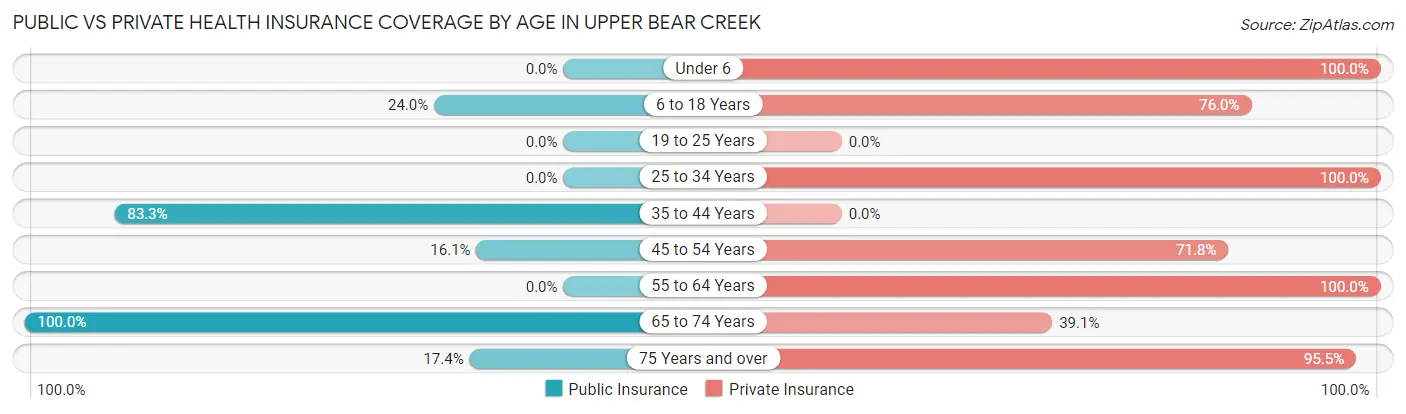
| Age Bracket | Public Insurance | Private Insurance |
| Under 6 | 0 (0.0%) | 16 (100.0%) |
| 6 to 18 Years | 24 (24.0%) | 76 (76.0%) |
| 19 to 25 Years | 0 (0.0%) | 0 (0.0%) |
| 25 to 34 Years | 0 (0.0%) | 37 (100.0%) |
| 35 to 44 Years | 20 (83.3%) | 0 (0.0%) |
| 45 to 54 Years | 36 (16.1%) | 160 (71.8%) |
| 55 to 64 Years | 0 (0.0%) | 261 (100.0%) |
| 65 to 74 Years | 128 (100.0%) | 50 (39.1%) |
| 75 Years and over | 23 (17.4%) | 126 (95.5%) |
| Total | 231 (25.1%) | 726 (78.8%) |
Disability Status by Sex by Age in Upper Bear Creek
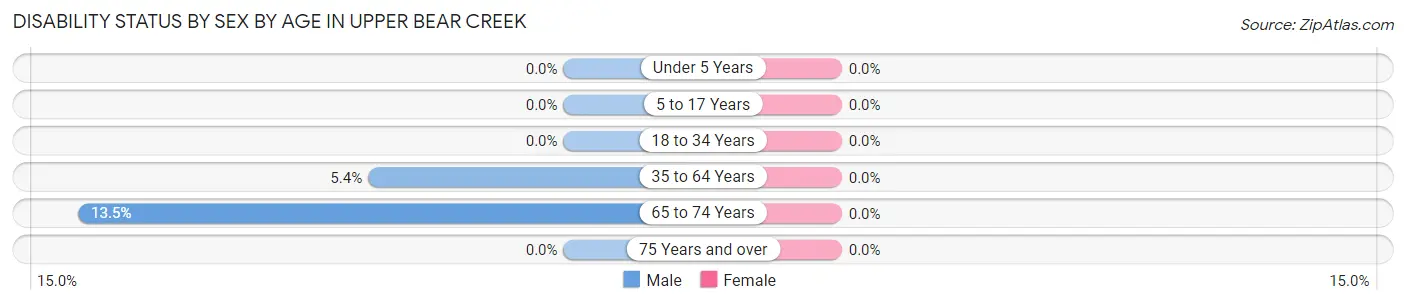
| Age Bracket | Male | Female |
| Under 5 Years | 0 (0.0%) | 0 (0.0%) |
| 5 to 17 Years | 0 (0.0%) | 0 (0.0%) |
| 18 to 34 Years | 0 (0.0%) | 0 (0.0%) |
| 35 to 64 Years | 13 (5.4%) | 0 (0.0%) |
| 65 to 74 Years | 5 (13.5%) | 0 (0.0%) |
| 75 Years and over | 0 (0.0%) | 0 (0.0%) |
Disability Class by Sex by Age in Upper Bear Creek
Disability Class: Hearing Difficulty
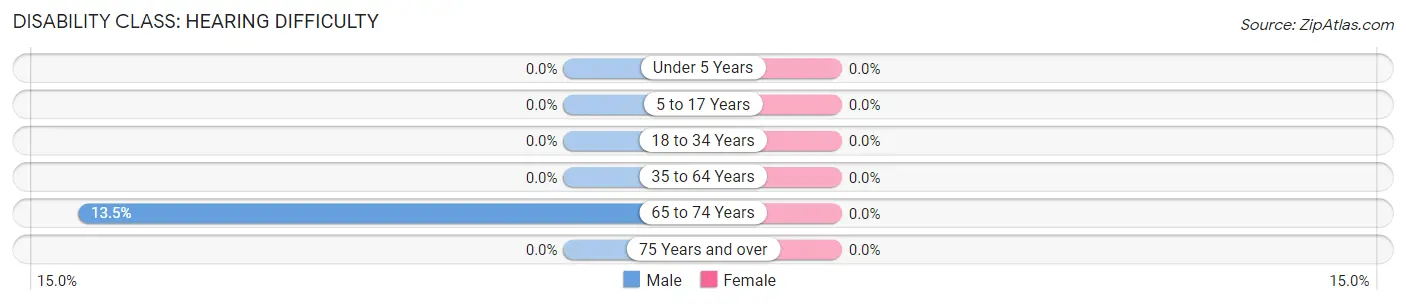
| Age Bracket | Male | Female |
| Under 5 Years | 0 (0.0%) | 0 (0.0%) |
| 5 to 17 Years | 0 (0.0%) | 0 (0.0%) |
| 18 to 34 Years | 0 (0.0%) | 0 (0.0%) |
| 35 to 64 Years | 0 (0.0%) | 0 (0.0%) |
| 65 to 74 Years | 5 (13.5%) | 0 (0.0%) |
| 75 Years and over | 0 (0.0%) | 0 (0.0%) |
Disability Class: Vision Difficulty
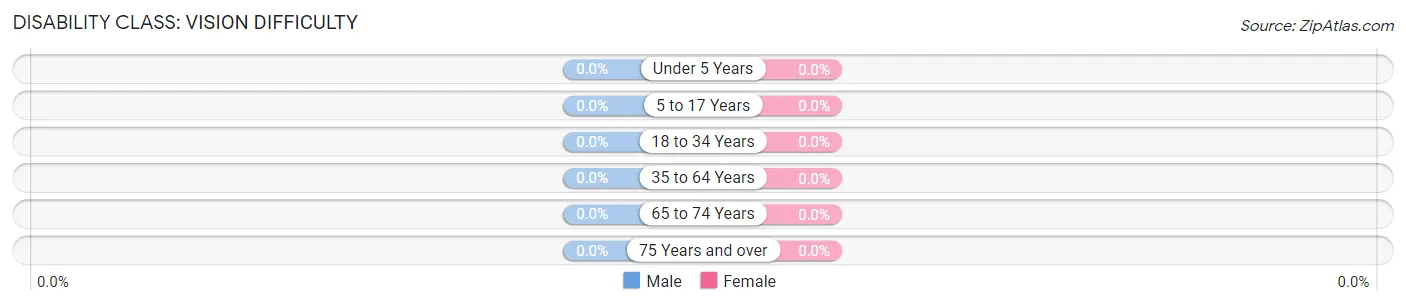
| Age Bracket | Male | Female |
| Under 5 Years | 0 (0.0%) | 0 (0.0%) |
| 5 to 17 Years | 0 (0.0%) | 0 (0.0%) |
| 18 to 34 Years | 0 (0.0%) | 0 (0.0%) |
| 35 to 64 Years | 0 (0.0%) | 0 (0.0%) |
| 65 to 74 Years | 0 (0.0%) | 0 (0.0%) |
| 75 Years and over | 0 (0.0%) | 0 (0.0%) |
Disability Class: Cognitive Difficulty
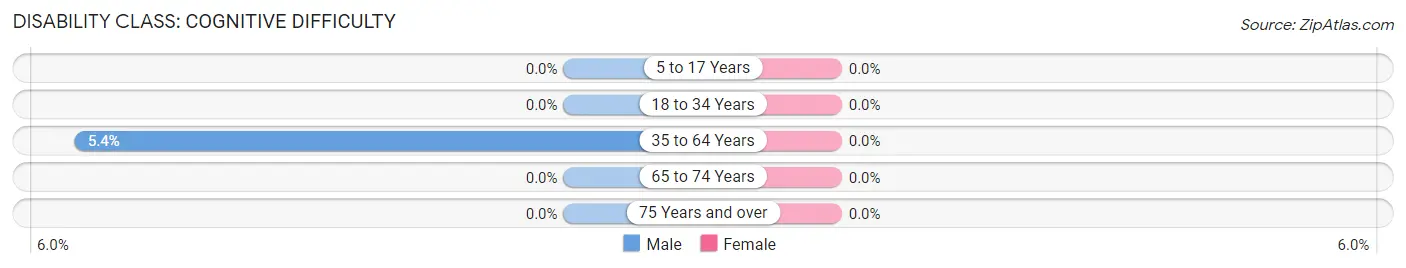
| Age Bracket | Male | Female |
| 5 to 17 Years | 0 (0.0%) | 0 (0.0%) |
| 18 to 34 Years | 0 (0.0%) | 0 (0.0%) |
| 35 to 64 Years | 13 (5.4%) | 0 (0.0%) |
| 65 to 74 Years | 0 (0.0%) | 0 (0.0%) |
| 75 Years and over | 0 (0.0%) | 0 (0.0%) |
Disability Class: Ambulatory Difficulty
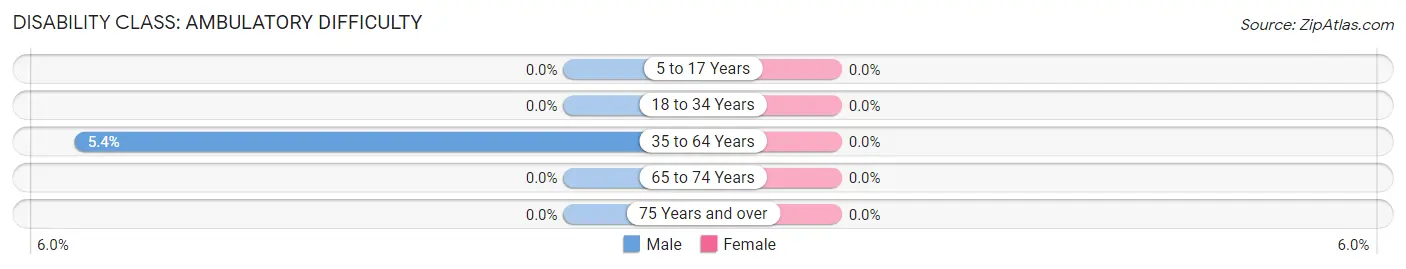
| Age Bracket | Male | Female |
| 5 to 17 Years | 0 (0.0%) | 0 (0.0%) |
| 18 to 34 Years | 0 (0.0%) | 0 (0.0%) |
| 35 to 64 Years | 13 (5.4%) | 0 (0.0%) |
| 65 to 74 Years | 0 (0.0%) | 0 (0.0%) |
| 75 Years and over | 0 (0.0%) | 0 (0.0%) |
Disability Class: Self-Care Difficulty
| Age Bracket | Male | Female |
| 5 to 17 Years | 0 (0.0%) | 0 (0.0%) |
| 18 to 34 Years | 0 (0.0%) | 0 (0.0%) |
| 35 to 64 Years | 0 (0.0%) | 0 (0.0%) |
| 65 to 74 Years | 0 (0.0%) | 0 (0.0%) |
| 75 Years and over | 0 (0.0%) | 0 (0.0%) |
Technology Access in Upper Bear Creek
Computing Device Access in Upper Bear Creek
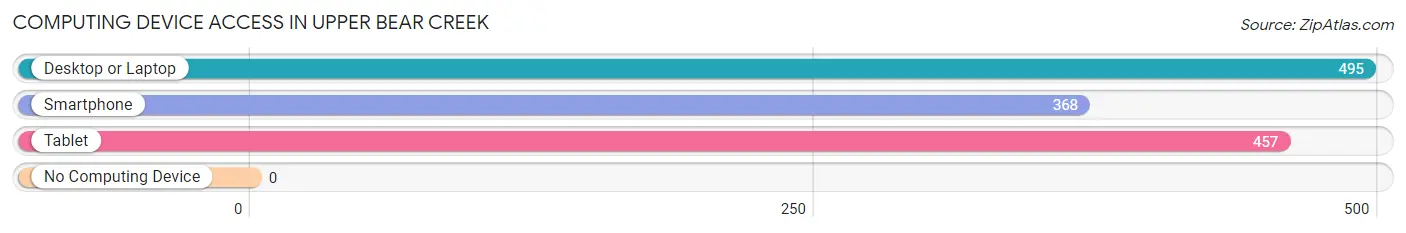
| Device Type | # Households | % Households |
| Desktop or Laptop | 495 | 100.0% |
| Smartphone | 368 | 74.3% |
| Tablet | 457 | 92.3% |
| No Computing Device | 0 | 0.0% |
| Total | 495 | 100.0% |
Internet Access in Upper Bear Creek
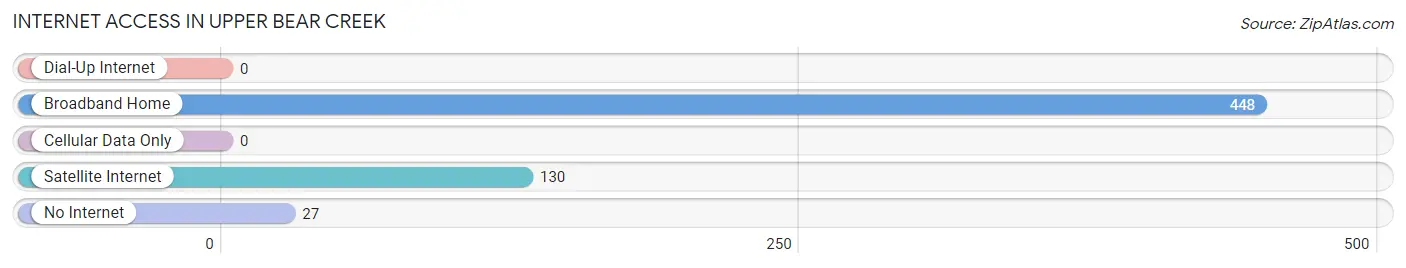
| Internet Type | # Households | % Households |
| Dial-Up Internet | 0 | 0.0% |
| Broadband Home | 448 | 90.5% |
| Cellular Data Only | 0 | 0.0% |
| Satellite Internet | 130 | 26.3% |
| No Internet | 27 | 5.4% |
| Total | 495 | 100.0% |
Upper Bear Creek Summary
Upper Bear Creek is a small unincorporated community located in the foothills of the Rocky Mountains in Jefferson County, Colorado. It is situated at an elevation of 8,000 feet and is surrounded by the Arapaho National Forest. The community is located approximately 25 miles west of Denver and is home to approximately 1,000 people.
History
Upper Bear Creek was first settled in the late 1800s by miners and ranchers. The area was originally known as Bear Creek Valley, and the town was named after the nearby Bear Creek. The area was home to several small mining operations, and the town was a popular stop for travelers heading to the nearby mining towns of Central City and Black Hawk.
In the early 1900s, the town began to grow as more people moved to the area. The town was incorporated in 1909 and was home to several businesses, including a general store, a post office, a hotel, and a saloon.
Geography
Upper Bear Creek is located in the foothills of the Rocky Mountains in Jefferson County, Colorado. The town is situated at an elevation of 8,000 feet and is surrounded by the Arapaho National Forest. The area is known for its scenic beauty and is home to several hiking trails, including the popular Bear Creek Trail.
The town is located approximately 25 miles west of Denver and is accessible via Highway 285. The closest major cities are Boulder, Colorado Springs, and Fort Collins.
Economy
Upper Bear Creek is a small, rural community with a limited economy. The town is home to several small businesses, including a general store, a post office, a hotel, and a saloon. The town is also home to several small farms and ranches.
The town is also home to several tourist attractions, including the nearby Arapaho National Forest and the Bear Creek Trail. The town is also home to several ski resorts, including the popular Winter Park Ski Resort.
Demographics
As of the 2010 census, the population of Upper Bear Creek was 1,000. The racial makeup of the town was 97.2% White, 0.7% African American, 0.3% Native American, 0.2% Asian, 0.1% Pacific Islander, 0.7% from other races, and 0.9% from two or more races. Hispanic or Latino of any race were 2.2% of the population.
The median household income in Upper Bear Creek was $50,000, and the median family income was $54,000. The per capita income for the town was $25,000. About 8.3% of families and 10.2% of the population were below the poverty line, including 11.3% of those under age 18 and 8.3% of those age 65 or over.
Common Questions
What is Per Capita Income in Upper Bear Creek?
Per Capita income in Upper Bear Creek is $106,471.
What is the Median Family Income in Upper Bear Creek?
Median Family Income in Upper Bear Creek is $160,592.
What is the Median Household income in Upper Bear Creek?
Median Household Income in Upper Bear Creek is $177,856.
What is Income or Wage Gap in Upper Bear Creek?
Income or Wage Gap in Upper Bear Creek is 24.8%.
Women in Upper Bear Creek earn 75.2 cents for every dollar earned by a man.
What is Inequality or Gini Index in Upper Bear Creek?
Inequality or Gini Index in Upper Bear Creek is 0.38.
What is the Total Population of Upper Bear Creek?
Total Population of Upper Bear Creek is 921.
What is the Total Male Population of Upper Bear Creek?
Total Male Population of Upper Bear Creek is 480.
What is the Total Female Population of Upper Bear Creek?
Total Female Population of Upper Bear Creek is 441.
What is the Ratio of Males per 100 Females in Upper Bear Creek?
There are 108.84 Males per 100 Females in Upper Bear Creek.
What is the Ratio of Females per 100 Males in Upper Bear Creek?
There are 91.88 Females per 100 Males in Upper Bear Creek.
What is the Median Population Age in Upper Bear Creek?
Median Population Age in Upper Bear Creek is 57.2 Years.
What is the Average Family Size in Upper Bear Creek
Average Family Size in Upper Bear Creek is 2.2 People.
What is the Average Household Size in Upper Bear Creek
Average Household Size in Upper Bear Creek is 1.9 People.
How Large is the Labor Force in Upper Bear Creek?
There are 463 People in the Labor Forcein in Upper Bear Creek.
What is the Percentage of People in the Labor Force in Upper Bear Creek?
55.1% of People are in the Labor Force in Upper Bear Creek.