Valmont, CO Map & Demographics
Valmont Map
Valmont Overview
$36,430
PER CAPITA INCOME
$73,750
AVG FAMILY INCOME
$42,083
AVG HOUSEHOLD INCOME
26.5%
WAGE / INCOME GAP [ % ]
73.5¢/ $1
WAGE / INCOME GAP [ $ ]
0.32
INEQUALITY / GINI INDEX
81
TOTAL POPULATION
56
MALE POPULATION
25
FEMALE POPULATION
224.00
MALES / 100 FEMALES
44.64
FEMALES / 100 MALES
28.1
MEDIAN AGE
2.7
AVG FAMILY SIZE
1.6
AVG HOUSEHOLD SIZE
65
LABOR FORCE [ PEOPLE ]
86.7%
PERCENT IN LABOR FORCE
Income in Valmont
Income Overview in Valmont
Per Capita Income in Valmont is $36,430, while median incomes of families and households are $73,750 and $42,083 respectively.
| Characteristic | Number | Measure |
| Per Capita Income | 81 | $36,430 |
| Median Family Income | 14 | $73,750 |
| Mean Family Income | 14 | $84,271 |
| Median Household Income | 49 | $42,083 |
| Mean Household Income | 49 | $59,853 |
| Income Deficit | 14 | $0 |
| Wage / Income Gap (%) | 81 | 26.52% |
| Wage / Income Gap ($) | 81 | 73.48¢ per $1 |
| Gini / Inequality Index | 81 | 0.32 |
Earnings by Sex in Valmont
Average Earnings in Valmont are $40,602, $41,111 for men and $30,208 for women, a difference of 26.5%.
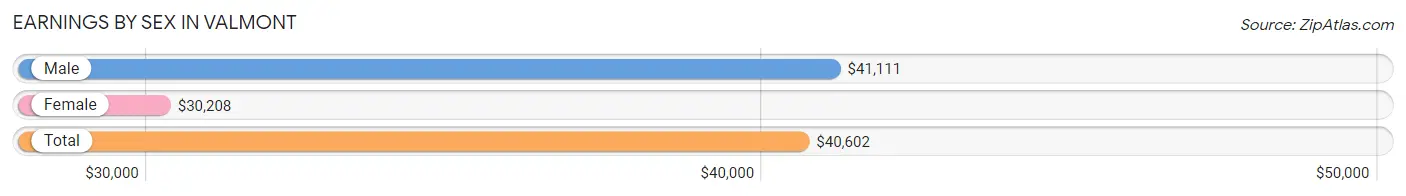
| Sex | Number | Average Earnings |
| Male | 50 (72.5%) | $41,111 |
| Female | 19 (27.5%) | $30,208 |
| Total | 69 (100.0%) | $40,602 |
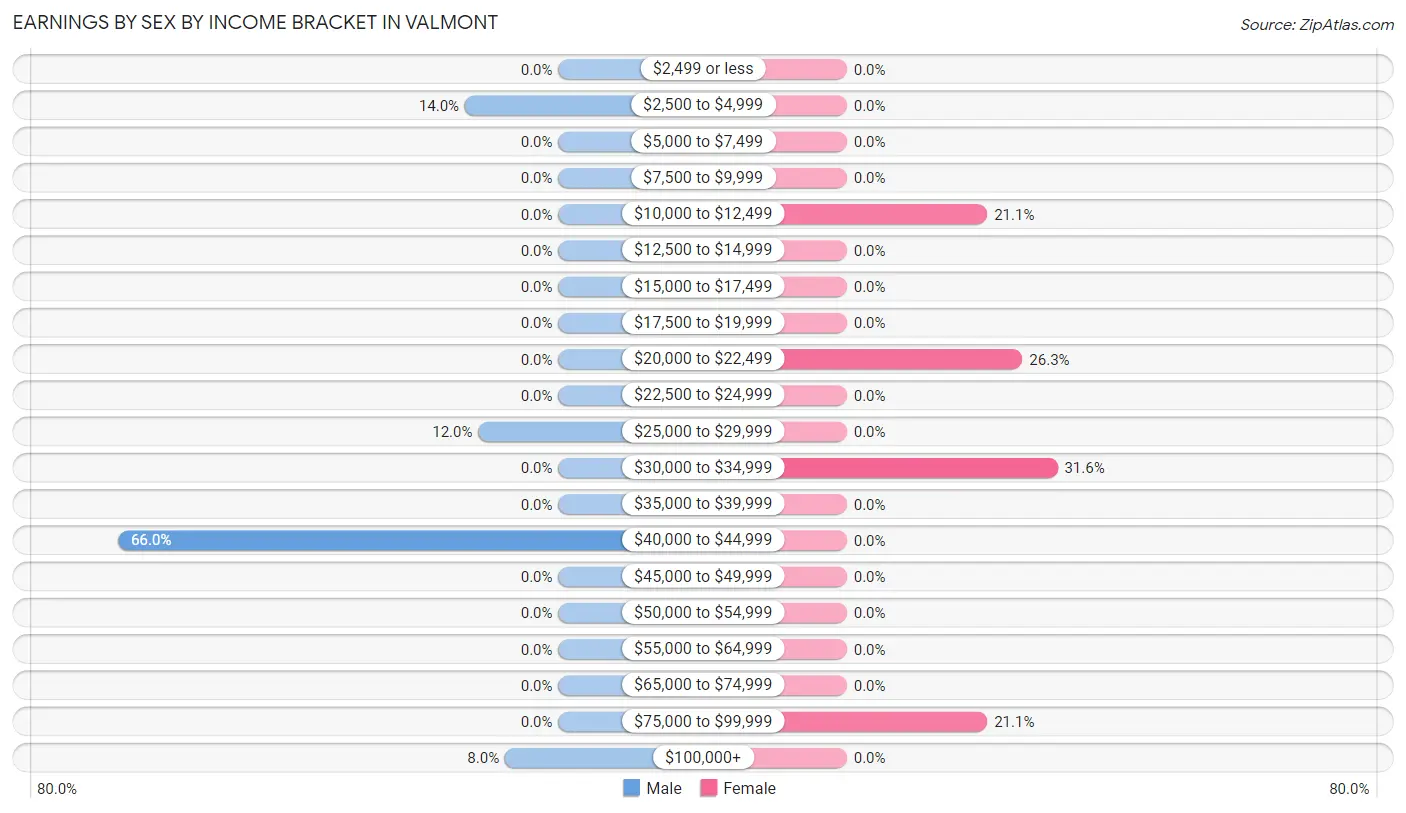
Earnings by Sex by Income Bracket in Valmont
The most common earnings brackets in Valmont are $40,000 to $44,999 for men (33 | 66.0%) and $30,000 to $34,999 for women (6 | 31.6%).
| Income | Male | Female |
| $2,499 or less | 0 (0.0%) | 0 (0.0%) |
| $2,500 to $4,999 | 7 (14.0%) | 0 (0.0%) |
| $5,000 to $7,499 | 0 (0.0%) | 0 (0.0%) |
| $7,500 to $9,999 | 0 (0.0%) | 0 (0.0%) |
| $10,000 to $12,499 | 0 (0.0%) | 4 (21.0%) |
| $12,500 to $14,999 | 0 (0.0%) | 0 (0.0%) |
| $15,000 to $17,499 | 0 (0.0%) | 0 (0.0%) |
| $17,500 to $19,999 | 0 (0.0%) | 0 (0.0%) |
| $20,000 to $22,499 | 0 (0.0%) | 5 (26.3%) |
| $22,500 to $24,999 | 0 (0.0%) | 0 (0.0%) |
| $25,000 to $29,999 | 6 (12.0%) | 0 (0.0%) |
| $30,000 to $34,999 | 0 (0.0%) | 6 (31.6%) |
| $35,000 to $39,999 | 0 (0.0%) | 0 (0.0%) |
| $40,000 to $44,999 | 33 (66.0%) | 0 (0.0%) |
| $45,000 to $49,999 | 0 (0.0%) | 0 (0.0%) |
| $50,000 to $54,999 | 0 (0.0%) | 0 (0.0%) |
| $55,000 to $64,999 | 0 (0.0%) | 0 (0.0%) |
| $65,000 to $74,999 | 0 (0.0%) | 0 (0.0%) |
| $75,000 to $99,999 | 0 (0.0%) | 4 (21.0%) |
| $100,000+ | 4 (8.0%) | 0 (0.0%) |
| Total | 50 (100.0%) | 19 (100.0%) |
Earnings by Sex by Educational Attainment in Valmont
| Educational Attainment | Male Income | Female Income |
| Less than High School | - | - |
| High School Diploma | - | - |
| College or Associate's Degree | - | - |
| Bachelor's Degree | - | - |
| Graduate Degree | - | - |
| Total | - | - |
Family Income in Valmont
Family Income Brackets in Valmont
According to the Valmont family income data, there are 10 families falling into the $50,000 to $74,999 income range, which is the most common income bracket and makes up 71.4% of all families.
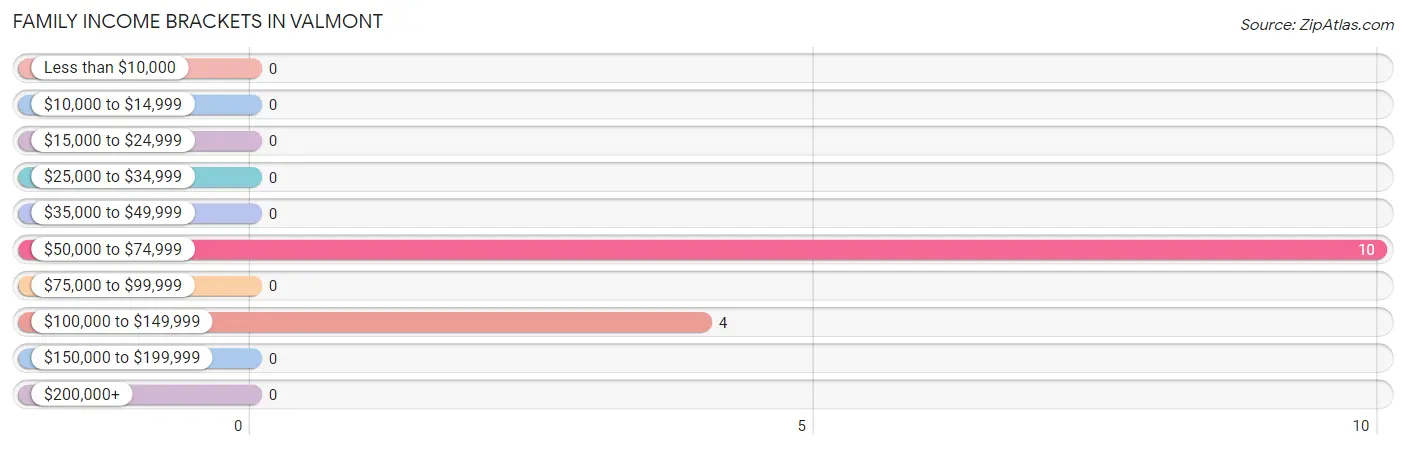
| Income Bracket | # Families | % Families |
| Less than $10,000 | 0 | 0.0% |
| $10,000 to $14,999 | 0 | 0.0% |
| $15,000 to $24,999 | 0 | 0.0% |
| $25,000 to $34,999 | 0 | 0.0% |
| $35,000 to $49,999 | 0 | 0.0% |
| $50,000 to $74,999 | 10 | 71.4% |
| $75,000 to $99,999 | 0 | 0.0% |
| $100,000 to $149,999 | 4 | 28.6% |
| $150,000 to $199,999 | 0 | 0.0% |
| $200,000+ | 0 | 0.0% |
Family Income by Famaliy Size in Valmont
| Income Bracket | # Families | Median Income |
| 2-Person Families | 4 (28.6%) | $0 |
| 3-Person Families | 10 (71.4%) | $0 |
| 4-Person Families | 0 (0.0%) | $0 |
| 5-Person Families | 0 (0.0%) | $0 |
| 6-Person Families | 0 (0.0%) | $0 |
| 7+ Person Families | 0 (0.0%) | $0 |
| Total | 14 (100.0%) | $73,750 |
Family Income by Number of Earners in Valmont
| Number of Earners | # Families | Median Income |
| No Earners | 0 (0.0%) | $0 |
| 1 Earner | 0 (0.0%) | $0 |
| 2 Earners | 10 (71.4%) | $0 |
| 3+ Earners | 4 (28.6%) | $0 |
| Total | 14 (100.0%) | $73,750 |
Household Income in Valmont
Household Income Brackets in Valmont
With 27 households falling in the category, the $35,000 to $49,999 income range is the most frequent in Valmont, accounting for 55.1% of all households.
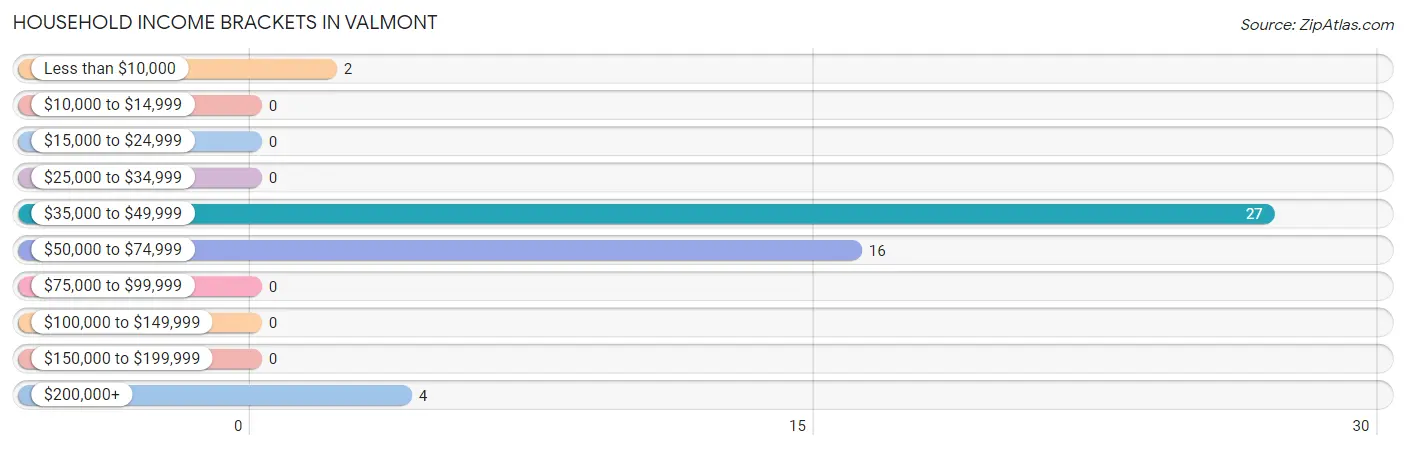
| Income Bracket | # Households | % Households |
| Less than $10,000 | 2 | 4.1% |
| $10,000 to $14,999 | 0 | 0.0% |
| $15,000 to $24,999 | 0 | 0.0% |
| $25,000 to $34,999 | 0 | 0.0% |
| $35,000 to $49,999 | 27 | 55.1% |
| $50,000 to $74,999 | 16 | 32.7% |
| $75,000 to $99,999 | 0 | 0.0% |
| $100,000 to $149,999 | 0 | 0.0% |
| $150,000 to $199,999 | 0 | 0.0% |
| $200,000+ | 4 | 8.2% |
Household Income by Householder Age in Valmont
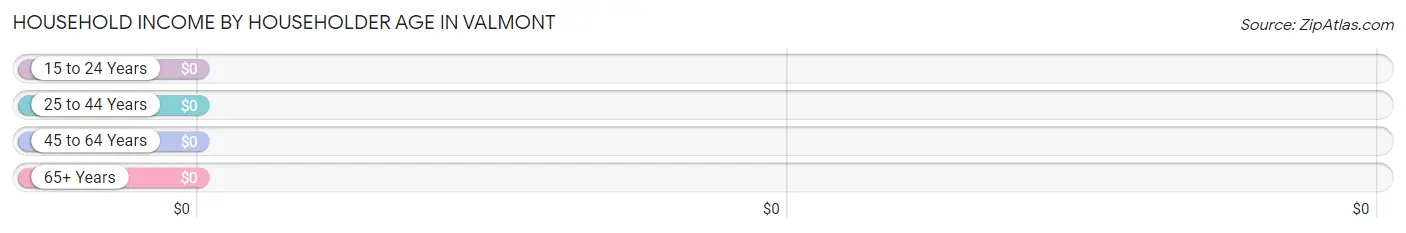
| Income Bracket | # Households | Median Income |
| 15 to 24 Years | 27 (55.1%) | $0 |
| 25 to 44 Years | 6 (12.2%) | $0 |
| 45 to 64 Years | 6 (12.2%) | $0 |
| 65+ Years | 10 (20.4%) | $0 |
| Total | 49 (100.0%) | $42,083 |
Poverty in Valmont
Income Below Poverty by Sex and Age in Valmont
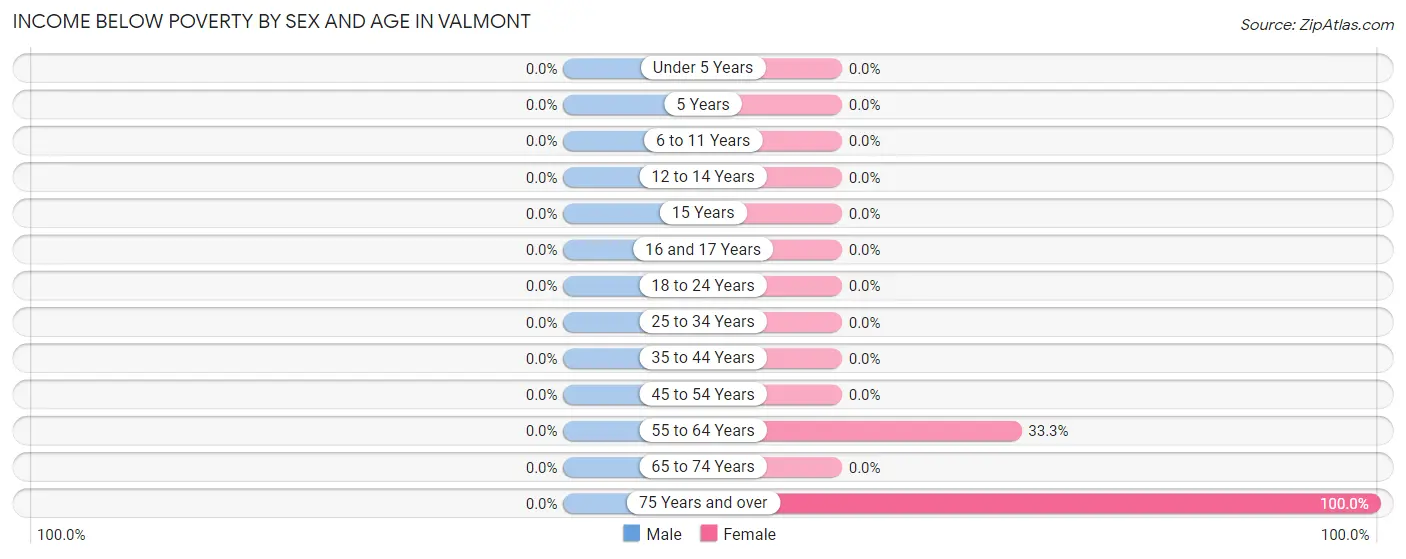
| Age Bracket | Male | Female |
| Under 5 Years | 0 (0.0%) | 0 (0.0%) |
| 5 Years | 0 (0.0%) | 0 (0.0%) |
| 6 to 11 Years | 0 (0.0%) | 0 (0.0%) |
| 12 to 14 Years | 0 (0.0%) | 0 (0.0%) |
| 15 Years | 0 (0.0%) | 0 (0.0%) |
| 16 and 17 Years | 0 (0.0%) | 0 (0.0%) |
| 18 to 24 Years | 0 (0.0%) | 0 (0.0%) |
| 25 to 34 Years | 0 (0.0%) | 0 (0.0%) |
| 35 to 44 Years | 0 (0.0%) | 0 (0.0%) |
| 45 to 54 Years | 0 (0.0%) | 0 (0.0%) |
| 55 to 64 Years | 0 (0.0%) | 2 (33.3%) |
| 65 to 74 Years | 0 (0.0%) | 0 (0.0%) |
| 75 Years and over | 0 (0.0%) | 4 (100.0%) |
| Total | 0 (0.0%) | 6 (24.0%) |
Income Above Poverty by Sex and Age in Valmont
According to the poverty statistics in Valmont, males aged under 5 years and females aged 18 to 24 years are the age groups that are most secure financially, with 100.0% of males and 100.0% of females in these age groups living above the poverty line.
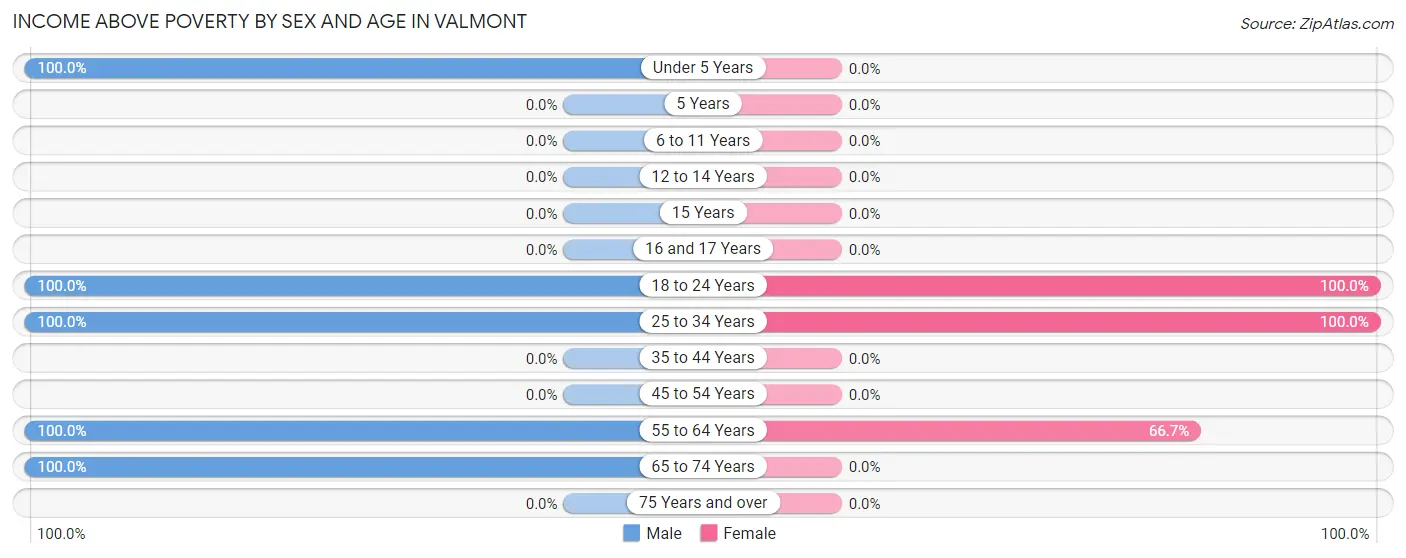
| Age Bracket | Male | Female |
| Under 5 Years | 6 (100.0%) | 0 (0.0%) |
| 5 Years | 0 (0.0%) | 0 (0.0%) |
| 6 to 11 Years | 0 (0.0%) | 0 (0.0%) |
| 12 to 14 Years | 0 (0.0%) | 0 (0.0%) |
| 15 Years | 0 (0.0%) | 0 (0.0%) |
| 16 and 17 Years | 0 (0.0%) | 0 (0.0%) |
| 18 to 24 Years | 27 (100.0%) | 4 (100.0%) |
| 25 to 34 Years | 9 (100.0%) | 11 (100.0%) |
| 35 to 44 Years | 0 (0.0%) | 0 (0.0%) |
| 45 to 54 Years | 0 (0.0%) | 0 (0.0%) |
| 55 to 64 Years | 4 (100.0%) | 4 (66.7%) |
| 65 to 74 Years | 10 (100.0%) | 0 (0.0%) |
| 75 Years and over | 0 (0.0%) | 0 (0.0%) |
| Total | 56 (100.0%) | 19 (76.0%) |
Income Below Poverty Among Married-Couple Families in Valmont
| Children | Above Poverty | Below Poverty |
| No Children | 0 (0.0%) | 0 (0.0%) |
| 1 or 2 Children | 6 (100.0%) | 0 (0.0%) |
| 3 or 4 Children | 0 (0.0%) | 0 (0.0%) |
| 5 or more Children | 0 (0.0%) | 0 (0.0%) |
| Total | 6 (100.0%) | 0 (0.0%) |
Income Below Poverty Among Single-Parent Households in Valmont
| Children | Single Father | Single Mother |
| No Children | 0 (0.0%) | 0 (0.0%) |
| 1 or 2 Children | 0 (0.0%) | 0 (0.0%) |
| 3 or 4 Children | 0 (0.0%) | 0 (0.0%) |
| 5 or more Children | 0 (0.0%) | 0 (0.0%) |
| Total | 0 (0.0%) | 0 (0.0%) |
Income Below Poverty Among Married-Couple vs Single-Parent Households in Valmont
| Children | Married-Couple Families | Single-Parent Households |
| No Children | 0 (0.0%) | 0 (0.0%) |
| 1 or 2 Children | 0 (0.0%) | 0 (0.0%) |
| 3 or 4 Children | 0 (0.0%) | 0 (0.0%) |
| 5 or more Children | 0 (0.0%) | 0 (0.0%) |
| Total | 0 (0.0%) | 0 (0.0%) |
Race in Valmont
The most populous races in Valmont are White / Caucasian (74 | 91.4%), and Asian (7 | 8.6%).
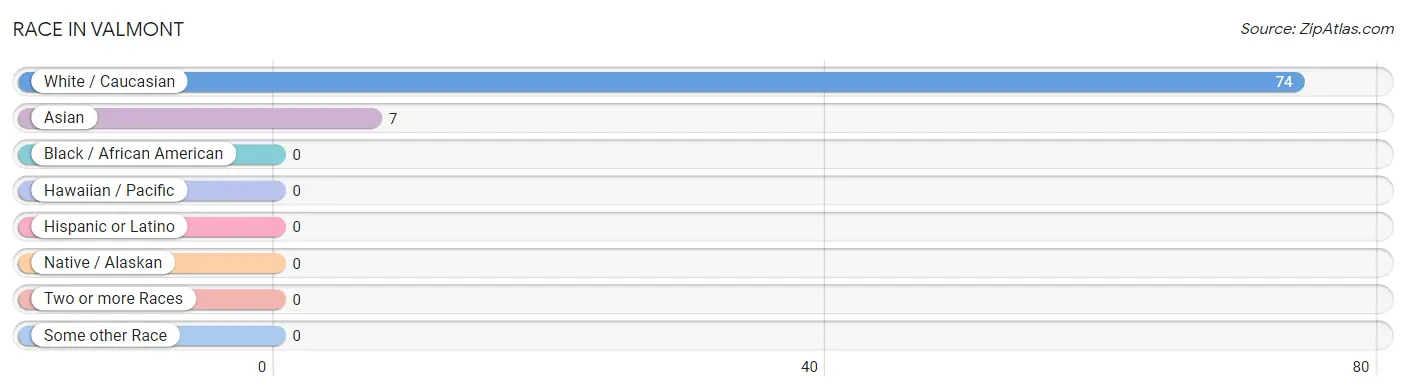
| Race | # Population | % Population |
| Asian | 7 | 8.6% |
| Black / African American | 0 | 0.0% |
| Hawaiian / Pacific | 0 | 0.0% |
| Hispanic or Latino | 0 | 0.0% |
| Native / Alaskan | 0 | 0.0% |
| White / Caucasian | 74 | 91.4% |
| Two or more Races | 0 | 0.0% |
| Some other Race | 0 | 0.0% |
| Total | 81 | 100.0% |
Ancestry in Valmont
The most populous ancestries reported in Valmont are Polish (33 | 40.7%), German (10 | 12.3%), Thai (7 | 8.6%), Scottish (4 | 4.9%), and Swedish (2 | 2.5%), together accounting for 69.1% of all Valmont residents.
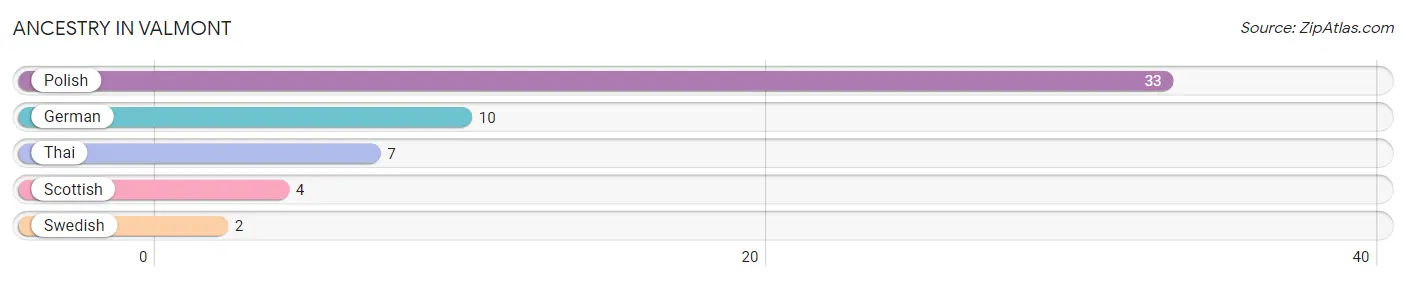
| Ancestry | # Population | % Population |
| German | 10 | 12.3% |
| Polish | 33 | 40.7% |
| Scottish | 4 | 4.9% |
| Swedish | 2 | 2.5% |
| Thai | 7 | 8.6% | View All 5 Rows |
Immigrants in Valmont
The most numerous immigrant groups reported in Valmont came from Asia (7 | 8.6%), India (7 | 8.6%), and South Central Asia (7 | 8.6%), together accounting for 25.9% of all Valmont residents.
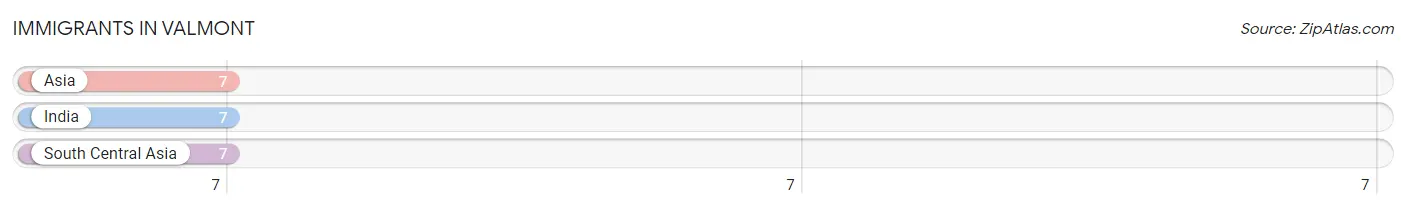
| Immigration Origin | # Population | % Population |
| Asia | 7 | 8.6% |
| India | 7 | 8.6% |
| South Central Asia | 7 | 8.6% | View All 3 Rows |
Sex and Age in Valmont
Sex and Age in Valmont
The most populous age groups in Valmont are 20 to 24 Years (27 | 48.2%) for men and 25 to 29 Years (6 | 24.0%) for women.
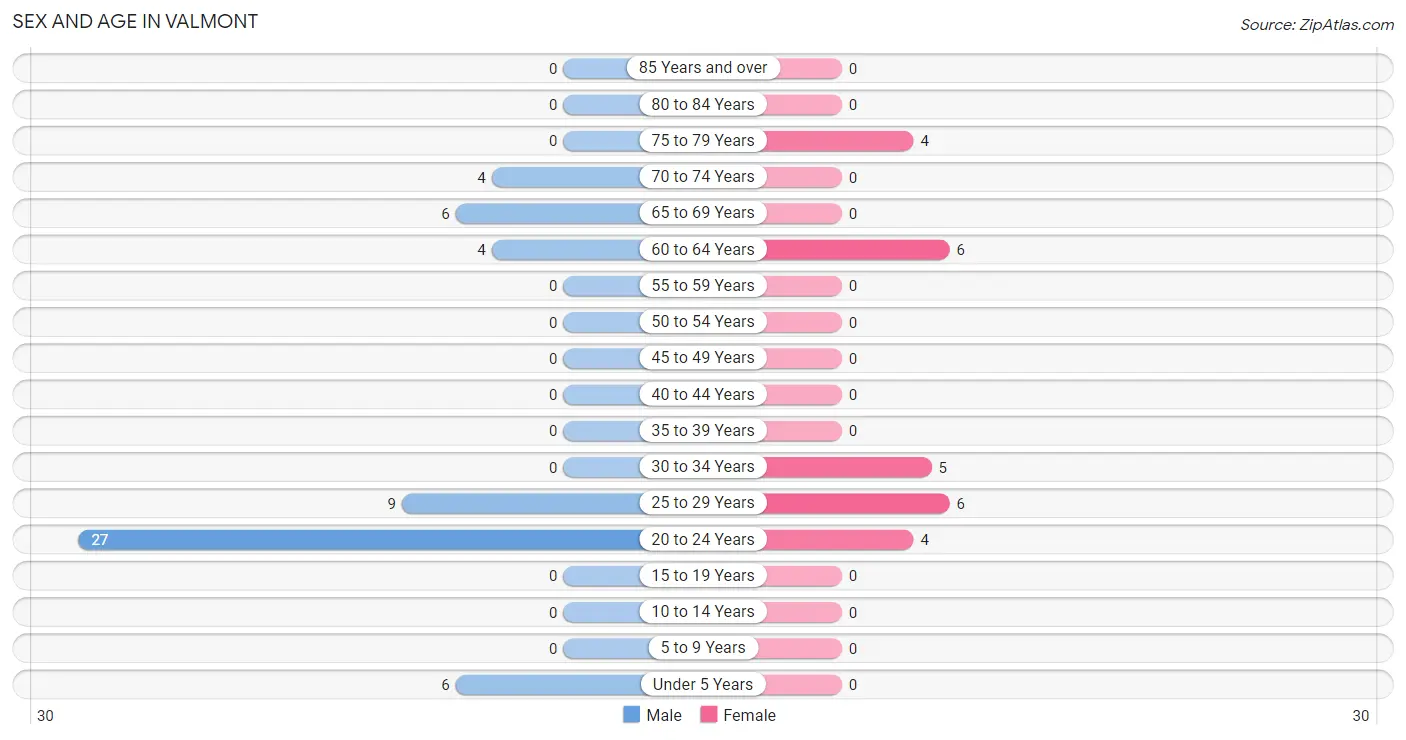
| Age Bracket | Male | Female |
| Under 5 Years | 6 (10.7%) | 0 (0.0%) |
| 5 to 9 Years | 0 (0.0%) | 0 (0.0%) |
| 10 to 14 Years | 0 (0.0%) | 0 (0.0%) |
| 15 to 19 Years | 0 (0.0%) | 0 (0.0%) |
| 20 to 24 Years | 27 (48.2%) | 4 (16.0%) |
| 25 to 29 Years | 9 (16.1%) | 6 (24.0%) |
| 30 to 34 Years | 0 (0.0%) | 5 (20.0%) |
| 35 to 39 Years | 0 (0.0%) | 0 (0.0%) |
| 40 to 44 Years | 0 (0.0%) | 0 (0.0%) |
| 45 to 49 Years | 0 (0.0%) | 0 (0.0%) |
| 50 to 54 Years | 0 (0.0%) | 0 (0.0%) |
| 55 to 59 Years | 0 (0.0%) | 0 (0.0%) |
| 60 to 64 Years | 4 (7.1%) | 6 (24.0%) |
| 65 to 69 Years | 6 (10.7%) | 0 (0.0%) |
| 70 to 74 Years | 4 (7.1%) | 0 (0.0%) |
| 75 to 79 Years | 0 (0.0%) | 4 (16.0%) |
| 80 to 84 Years | 0 (0.0%) | 0 (0.0%) |
| 85 Years and over | 0 (0.0%) | 0 (0.0%) |
| Total | 56 (100.0%) | 25 (100.0%) |
Families and Households in Valmont
Median Family Size in Valmont
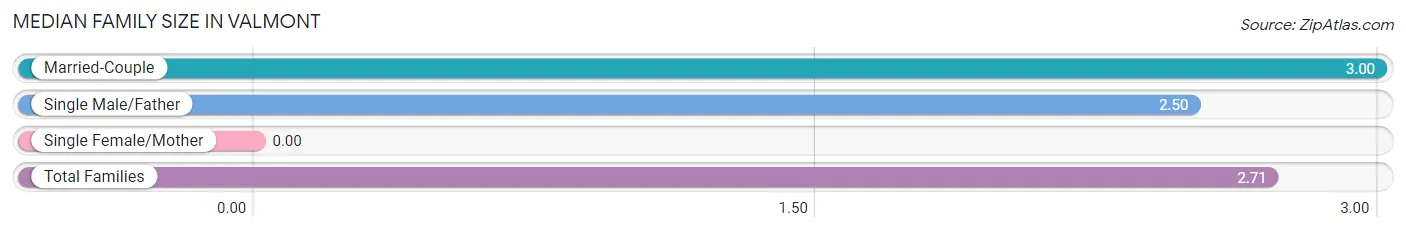
| Family Type | # Families | Family Size |
| Married-Couple | 6 (42.9%) | 3.00 |
| Single Male/Father | 8 (57.1%) | 2.50 |
| Single Female/Mother | 0 (0.0%) | - |
| Total Families | 14 (100.0%) | 2.71 |
Median Household Size in Valmont
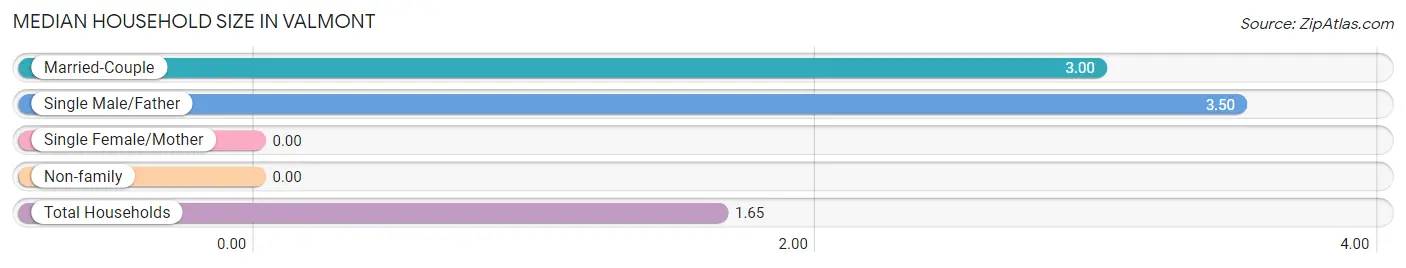
| Household Type | # Households | Household Size |
| Married-Couple | 6 (12.2%) | 3.00 |
| Single Male/Father | 8 (16.3%) | 3.50 |
| Single Female/Mother | 0 (0.0%) | - |
| Non-family | 35 (71.4%) | - |
| Total Households | 49 (100.0%) | 1.65 |
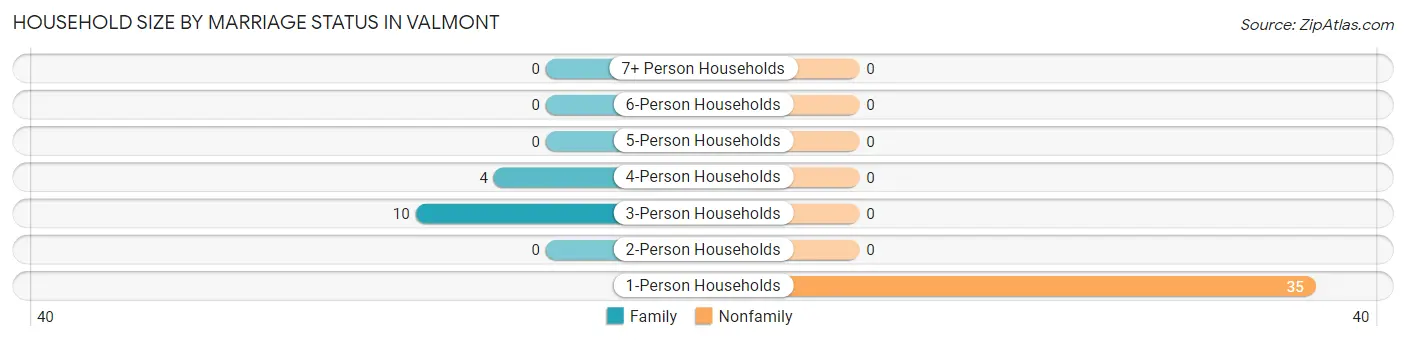
Household Size by Marriage Status in Valmont
Out of a total of 49 households in Valmont, 14 (28.6%) are family households, while 35 (71.4%) are nonfamily households. The most numerous type of family households are 3-person households, comprising 10, and the most common type of nonfamily households are 1-person households, comprising 35.
| Household Size | Family Households | Nonfamily Households |
| 1-Person Households | - | 35 (71.4%) |
| 2-Person Households | 0 (0.0%) | 0 (0.0%) |
| 3-Person Households | 10 (20.4%) | 0 (0.0%) |
| 4-Person Households | 4 (8.2%) | 0 (0.0%) |
| 5-Person Households | 0 (0.0%) | 0 (0.0%) |
| 6-Person Households | 0 (0.0%) | 0 (0.0%) |
| 7+ Person Households | 0 (0.0%) | 0 (0.0%) |
| Total | 14 (28.6%) | 35 (71.4%) |
Female Fertility in Valmont
Fertility by Age in Valmont
| Age Bracket | Women with Births | Births / 1,000 Women |
| 15 to 19 years | 0 (0.0%) | 0.0 |
| 20 to 34 years | 0 (0.0%) | 0.0 |
| 35 to 50 years | 0 (0.0%) | 0.0 |
| Total | 0 (0.0%) | 0.0 |
Fertility by Age by Marriage Status in Valmont
| Age Bracket | Married | Unmarried |
| 15 to 19 years | 0 (0.0%) | 0 (0.0%) |
| 20 to 34 years | 0 (0.0%) | 0 (0.0%) |
| 35 to 50 years | 0 (0.0%) | 0 (0.0%) |
| Total | 0 (0.0%) | 0 (0.0%) |
Fertility by Education in Valmont
| Educational Attainment | Women with Births | Births / 1,000 Women |
| Less than High School | 0 (0.0%) | 0.0 |
| High School Diploma | 0 (0.0%) | 0.0 |
| College or Associate's Degree | 0 (0.0%) | 0.0 |
| Bachelor's Degree | 0 (0.0%) | 0.0 |
| Graduate Degree | 0 (0.0%) | 0.0 |
| Total | 0 (0.0%) | 0.0 |
Fertility by Education by Marriage Status in Valmont
| Educational Attainment | Married | Unmarried |
| Less than High School | 0 (0.0%) | 0 (0.0%) |
| High School Diploma | 0 (0.0%) | 0 (0.0%) |
| College or Associate's Degree | 0 (0.0%) | 0 (0.0%) |
| Bachelor's Degree | 0 (0.0%) | 0 (0.0%) |
| Graduate Degree | 0 (0.0%) | 0 (0.0%) |
| Total | 0 (0.0%) | 0 (0.0%) |
Employment Characteristics in Valmont
Employment by Class of Employer in Valmont
Among the 65 employed individuals in Valmont, private company employees (49 | 75.4%), self-employed (incorporated) (6 | 9.2%), and local government employees (6 | 9.2%) make up the most common classes of employment.
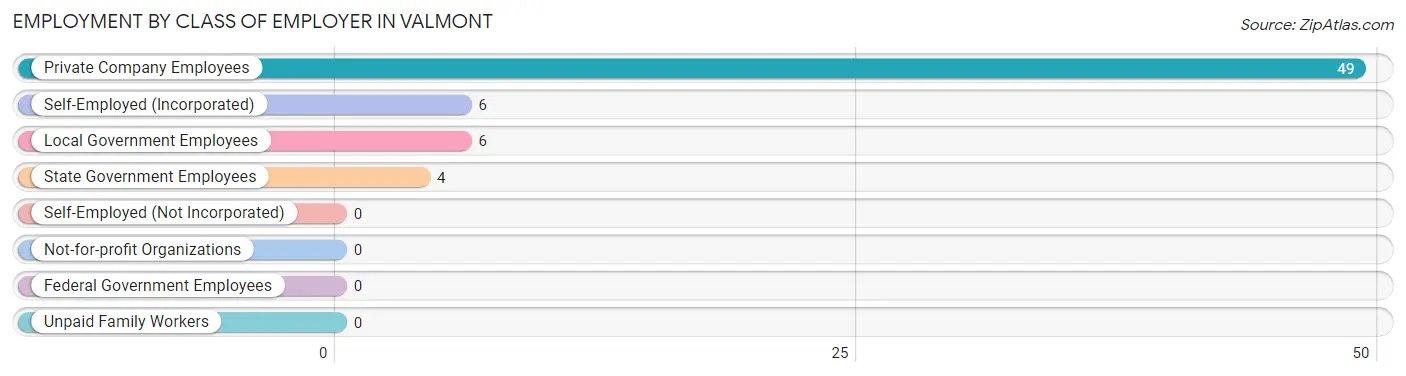
| Employer Class | # Employees | % Employees |
| Private Company Employees | 49 | 75.4% |
| Self-Employed (Incorporated) | 6 | 9.2% |
| Self-Employed (Not Incorporated) | 0 | 0.0% |
| Not-for-profit Organizations | 0 | 0.0% |
| Local Government Employees | 6 | 9.2% |
| State Government Employees | 4 | 6.1% |
| Federal Government Employees | 0 | 0.0% |
| Unpaid Family Workers | 0 | 0.0% |
| Total | 65 | 100.0% |
Employment Status by Age in Valmont
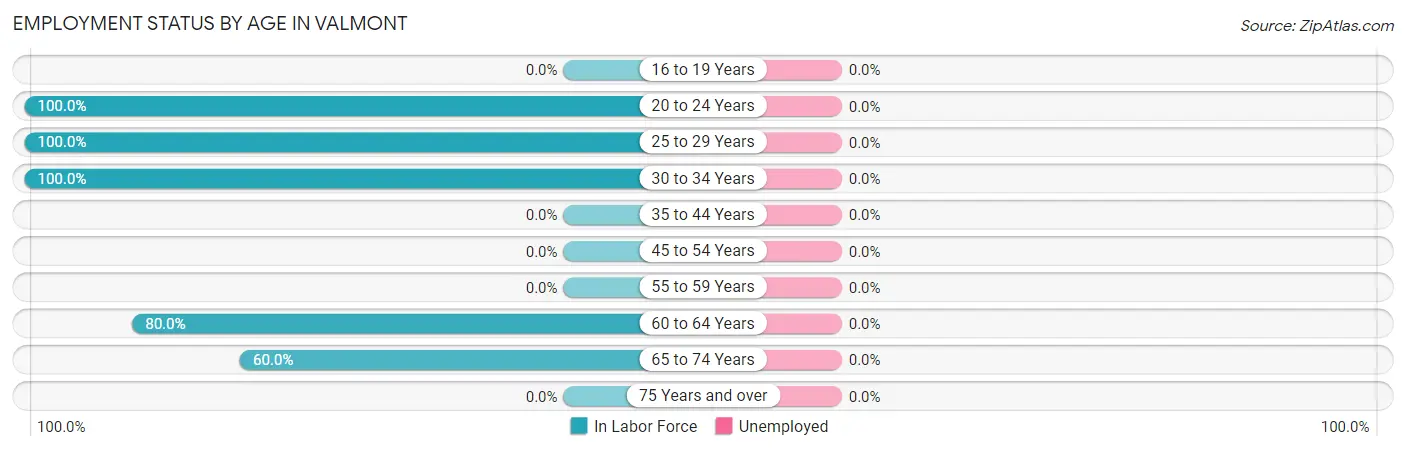
| Age Bracket | In Labor Force | Unemployed |
| 16 to 19 Years | 0 (0.0%) | 0 (0.0%) |
| 20 to 24 Years | 31 (100.0%) | 0 (0.0%) |
| 25 to 29 Years | 15 (100.0%) | 0 (0.0%) |
| 30 to 34 Years | 5 (100.0%) | 0 (0.0%) |
| 35 to 44 Years | 0 (0.0%) | 0 (0.0%) |
| 45 to 54 Years | 0 (0.0%) | 0 (0.0%) |
| 55 to 59 Years | 0 (0.0%) | 0 (0.0%) |
| 60 to 64 Years | 8 (80.0%) | 0 (0.0%) |
| 65 to 74 Years | 6 (60.0%) | 0 (0.0%) |
| 75 Years and over | 0 (0.0%) | 0 (0.0%) |
| Total | 65 (86.7%) | 0 (0.0%) |
Employment Status by Educational Attainment in Valmont
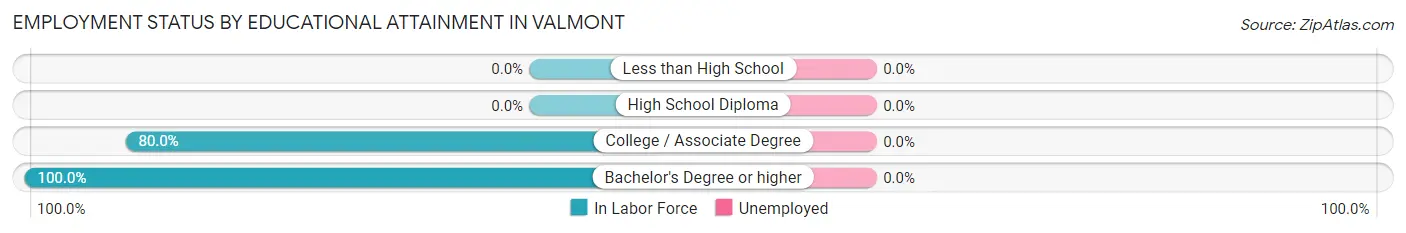
| Educational Attainment | In Labor Force | Unemployed |
| Less than High School | 0 (0.0%) | 0 (0.0%) |
| High School Diploma | 0 (0.0%) | 0 (0.0%) |
| College / Associate Degree | 8 (80.0%) | 0 (0.0%) |
| Bachelor's Degree or higher | 20 (100.0%) | 0 (0.0%) |
| Total | 28 (93.3%) | 0 (0.0%) |
Employment Occupations by Sex in Valmont
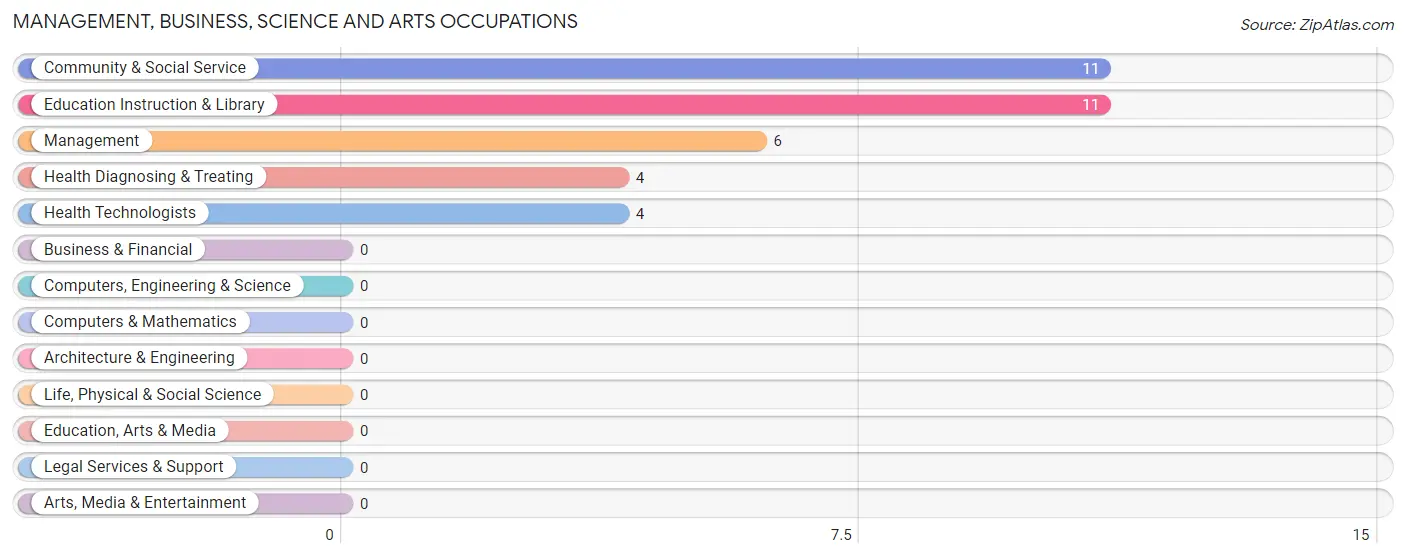
Management, Business, Science and Arts Occupations
The most common Management, Business, Science and Arts occupations in Valmont are Community & Social Service (11 | 16.9%), Education Instruction & Library (11 | 16.9%), Management (6 | 9.2%), Health Diagnosing & Treating (4 | 6.1%), and Health Technologists (4 | 6.1%).
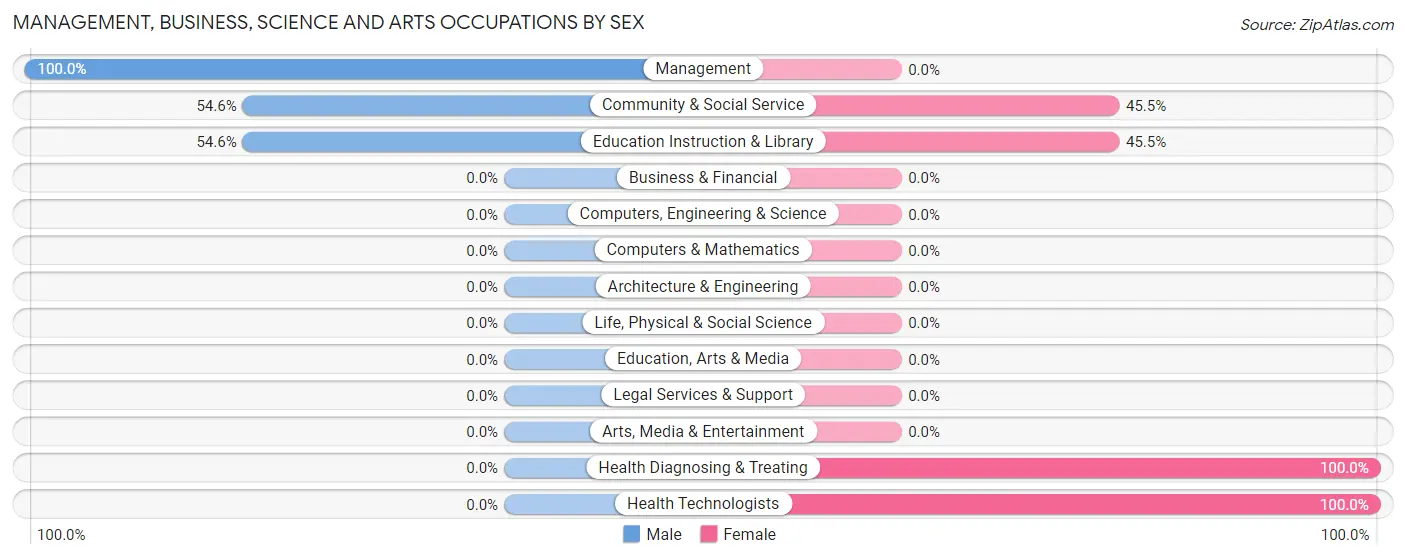
Management, Business, Science and Arts Occupations by Sex
Within the Management, Business, Science and Arts occupations in Valmont, the most male-oriented occupations are Management (100.0%), Community & Social Service (54.5%), and Education Instruction & Library (54.5%), while the most female-oriented occupations are Health Diagnosing & Treating (100.0%), Health Technologists (100.0%), and Community & Social Service (45.5%).
| Occupation | Male | Female |
| Management | 6 (100.0%) | 0 (0.0%) |
| Business & Financial | 0 (0.0%) | 0 (0.0%) |
| Computers, Engineering & Science | 0 (0.0%) | 0 (0.0%) |
| Computers & Mathematics | 0 (0.0%) | 0 (0.0%) |
| Architecture & Engineering | 0 (0.0%) | 0 (0.0%) |
| Life, Physical & Social Science | 0 (0.0%) | 0 (0.0%) |
| Community & Social Service | 6 (54.5%) | 5 (45.5%) |
| Education, Arts & Media | 0 (0.0%) | 0 (0.0%) |
| Legal Services & Support | 0 (0.0%) | 0 (0.0%) |
| Education Instruction & Library | 6 (54.5%) | 5 (45.5%) |
| Arts, Media & Entertainment | 0 (0.0%) | 0 (0.0%) |
| Health Diagnosing & Treating | 0 (0.0%) | 4 (100.0%) |
| Health Technologists | 0 (0.0%) | 4 (100.0%) |
| Total (Category) | 12 (57.1%) | 9 (42.9%) |
| Total (Overall) | 46 (70.8%) | 19 (29.2%) |
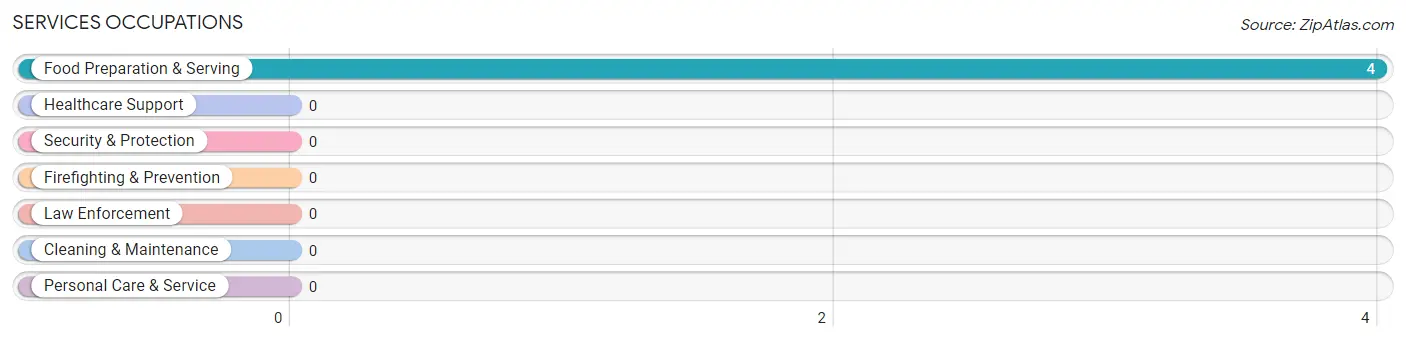
Services Occupations
The most common Services occupations in Valmont are , and Food Preparation & Serving (4 | 6.1%).
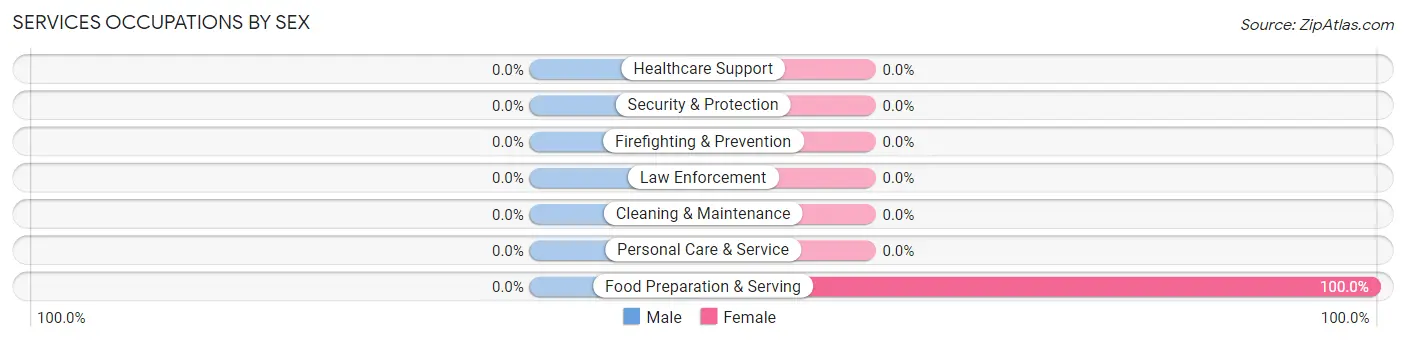
Services Occupations by Sex
| Occupation | Male | Female |
| Healthcare Support | 0 (0.0%) | 0 (0.0%) |
| Security & Protection | 0 (0.0%) | 0 (0.0%) |
| Firefighting & Prevention | 0 (0.0%) | 0 (0.0%) |
| Law Enforcement | 0 (0.0%) | 0 (0.0%) |
| Food Preparation & Serving | 0 (0.0%) | 4 (100.0%) |
| Cleaning & Maintenance | 0 (0.0%) | 0 (0.0%) |
| Personal Care & Service | 0 (0.0%) | 0 (0.0%) |
| Total (Category) | 0 (0.0%) | 4 (100.0%) |
| Total (Overall) | 46 (70.8%) | 19 (29.2%) |
Sales and Office Occupations
The most common Sales and Office occupations in Valmont are Sales & Related (6 | 9.2%), and Office & Administration (4 | 6.1%).
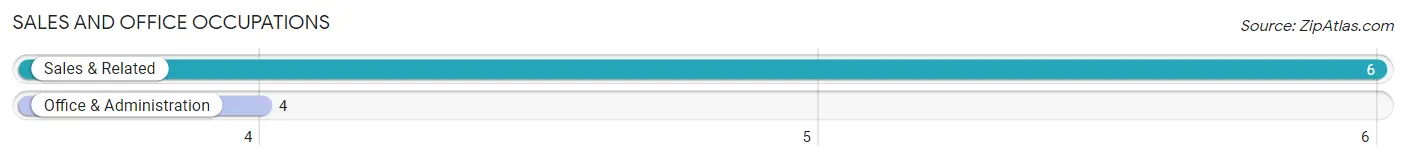
Sales and Office Occupations by Sex

| Occupation | Male | Female |
| Sales & Related | 0 (0.0%) | 6 (100.0%) |
| Office & Administration | 4 (100.0%) | 0 (0.0%) |
| Total (Category) | 4 (40.0%) | 6 (60.0%) |
| Total (Overall) | 46 (70.8%) | 19 (29.2%) |
Natural Resources, Construction and Maintenance Occupations
The most common Natural Resources, Construction and Maintenance occupations in Valmont are , and Installation, Maintenance & Repair (27 | 41.5%).
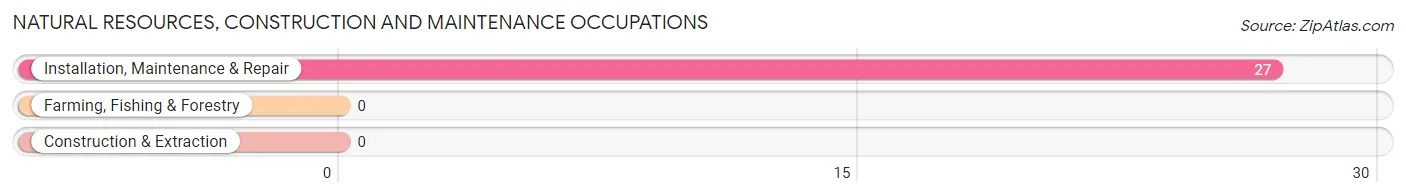
Natural Resources, Construction and Maintenance Occupations by Sex
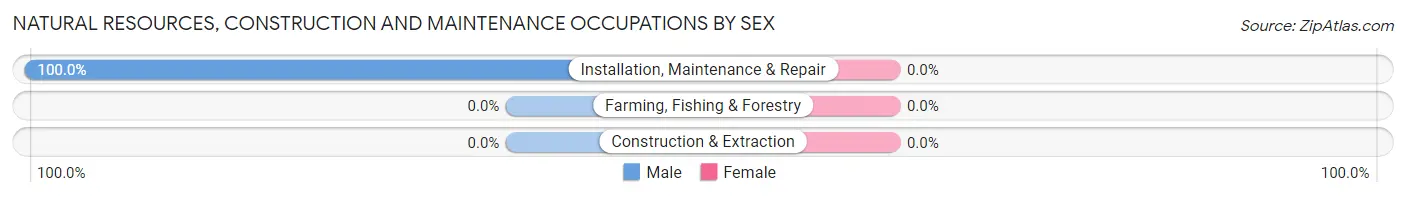
| Occupation | Male | Female |
| Farming, Fishing & Forestry | 0 (0.0%) | 0 (0.0%) |
| Construction & Extraction | 0 (0.0%) | 0 (0.0%) |
| Installation, Maintenance & Repair | 27 (100.0%) | 0 (0.0%) |
| Total (Category) | 27 (100.0%) | 0 (0.0%) |
| Total (Overall) | 46 (70.8%) | 19 (29.2%) |
Production, Transportation and Moving Occupations
The most common Production, Transportation and Moving occupations in Valmont are , and Material Moving (3 | 4.6%).
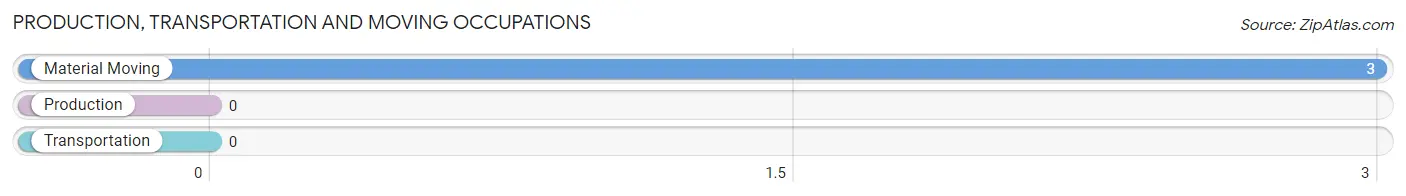
Production, Transportation and Moving Occupations by Sex
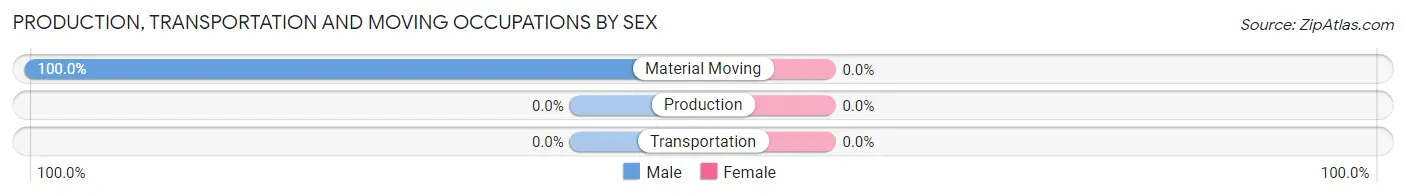
| Occupation | Male | Female |
| Production | 0 (0.0%) | 0 (0.0%) |
| Transportation | 0 (0.0%) | 0 (0.0%) |
| Material Moving | 3 (100.0%) | 0 (0.0%) |
| Total (Category) | 3 (100.0%) | 0 (0.0%) |
| Total (Overall) | 46 (70.8%) | 19 (29.2%) |
Employment Industries by Sex in Valmont
Employment Industries in Valmont
The major employment industries in Valmont include Health Care & Social Assistance (9 | 13.9%), Construction (6 | 9.2%), Retail Trade (6 | 9.2%), Educational Services (6 | 9.2%), and Manufacturing (4 | 6.1%).
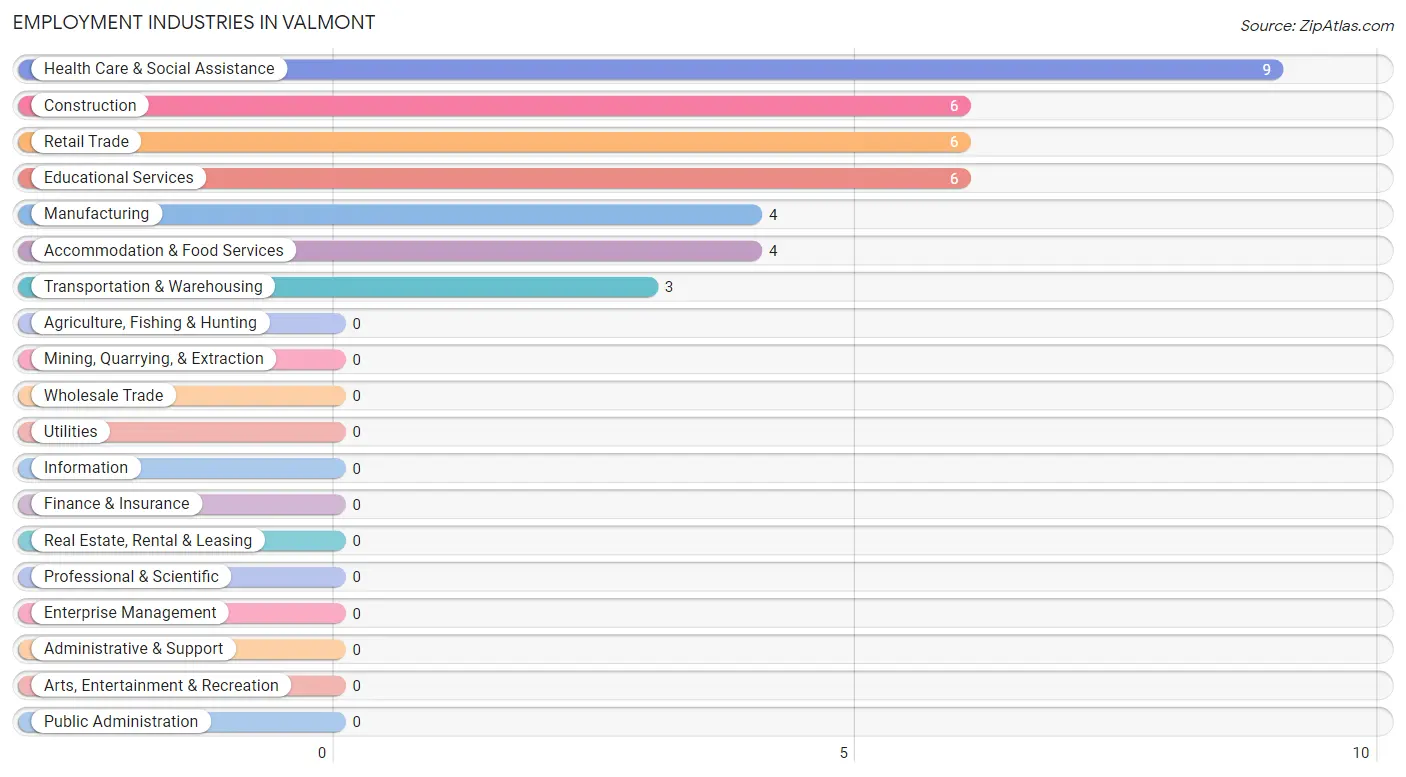
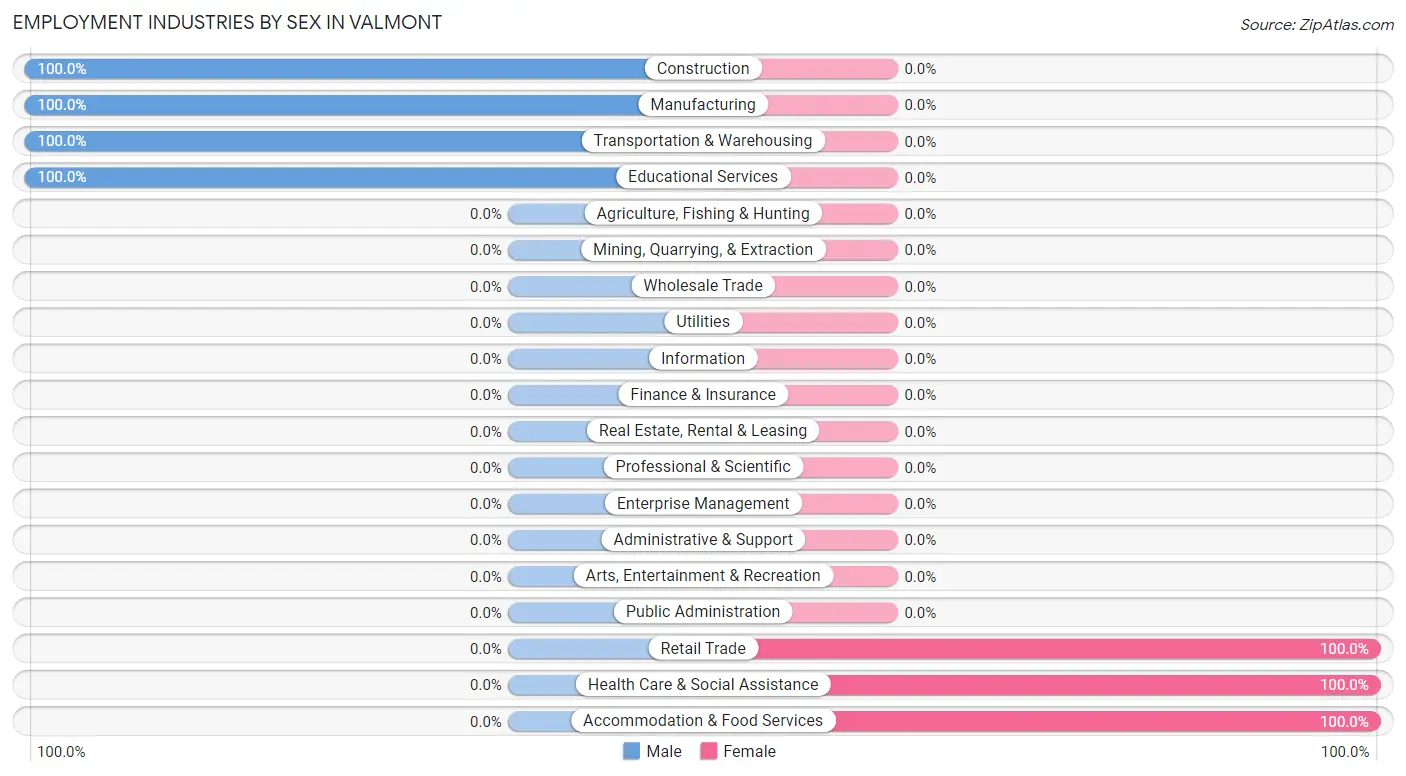
Employment Industries by Sex in Valmont
The Valmont industries that see more men than women are Construction (100.0%), Manufacturing (100.0%), and Transportation & Warehousing (100.0%), whereas the industries that tend to have a higher number of women are Retail Trade (100.0%), Health Care & Social Assistance (100.0%), and Accommodation & Food Services (100.0%).
| Industry | Male | Female |
| Agriculture, Fishing & Hunting | 0 (0.0%) | 0 (0.0%) |
| Mining, Quarrying, & Extraction | 0 (0.0%) | 0 (0.0%) |
| Construction | 6 (100.0%) | 0 (0.0%) |
| Manufacturing | 4 (100.0%) | 0 (0.0%) |
| Wholesale Trade | 0 (0.0%) | 0 (0.0%) |
| Retail Trade | 0 (0.0%) | 6 (100.0%) |
| Transportation & Warehousing | 3 (100.0%) | 0 (0.0%) |
| Utilities | 0 (0.0%) | 0 (0.0%) |
| Information | 0 (0.0%) | 0 (0.0%) |
| Finance & Insurance | 0 (0.0%) | 0 (0.0%) |
| Real Estate, Rental & Leasing | 0 (0.0%) | 0 (0.0%) |
| Professional & Scientific | 0 (0.0%) | 0 (0.0%) |
| Enterprise Management | 0 (0.0%) | 0 (0.0%) |
| Administrative & Support | 0 (0.0%) | 0 (0.0%) |
| Educational Services | 6 (100.0%) | 0 (0.0%) |
| Health Care & Social Assistance | 0 (0.0%) | 9 (100.0%) |
| Arts, Entertainment & Recreation | 0 (0.0%) | 0 (0.0%) |
| Accommodation & Food Services | 0 (0.0%) | 4 (100.0%) |
| Public Administration | 0 (0.0%) | 0 (0.0%) |
| Total | 46 (70.8%) | 19 (29.2%) |
Education in Valmont
School Enrollment in Valmont
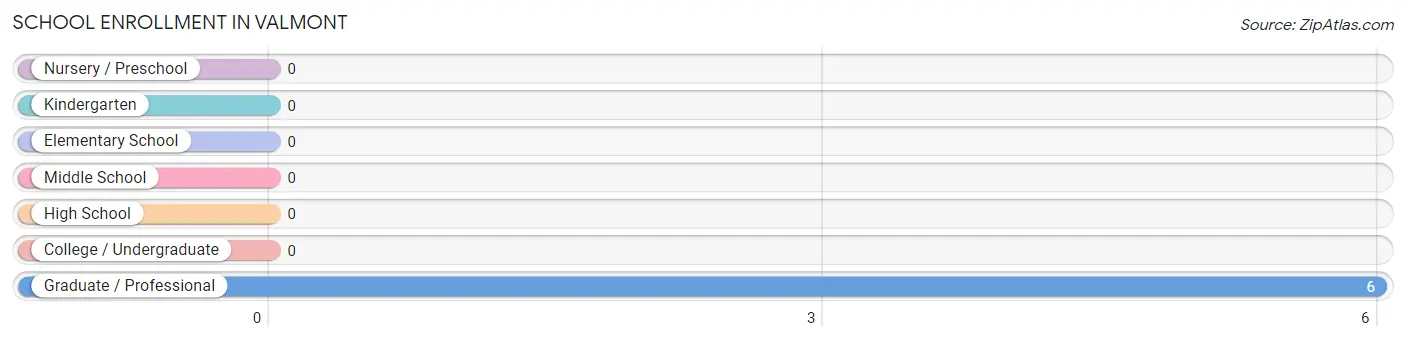
| School Level | # Students | % Students |
| Nursery / Preschool | 0 | 0.0% |
| Kindergarten | 0 | 0.0% |
| Elementary School | 0 | 0.0% |
| Middle School | 0 | 0.0% |
| High School | 0 | 0.0% |
| College / Undergraduate | 0 | 0.0% |
| Graduate / Professional | 6 | 100.0% |
| Total | 6 | 100.0% |
School Enrollment by Age by Funding Source in Valmont
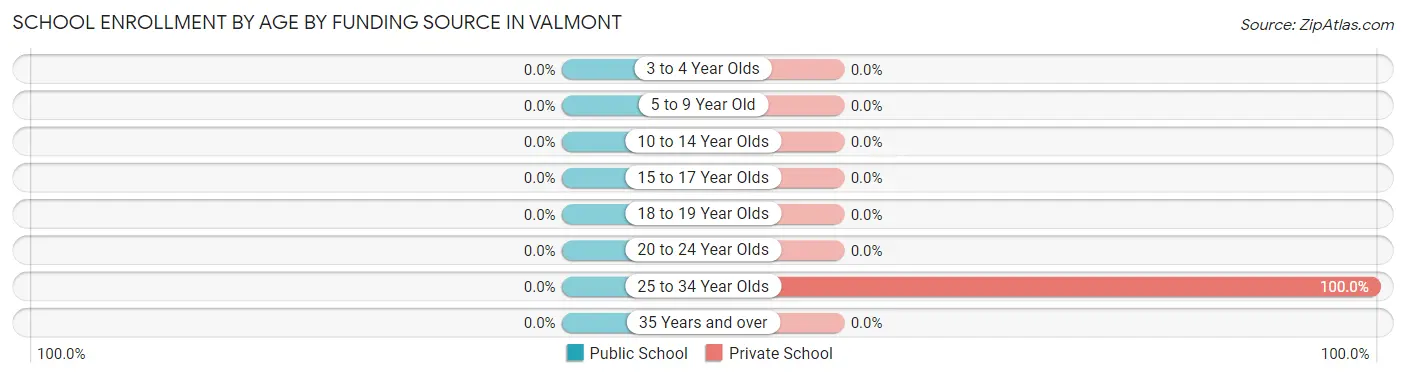
| Age Bracket | Public School | Private School |
| 3 to 4 Year Olds | 0 (0.0%) | 0 (0.0%) |
| 5 to 9 Year Old | 0 (0.0%) | 0 (0.0%) |
| 10 to 14 Year Olds | 0 (0.0%) | 0 (0.0%) |
| 15 to 17 Year Olds | 0 (0.0%) | 0 (0.0%) |
| 18 to 19 Year Olds | 0 (0.0%) | 0 (0.0%) |
| 20 to 24 Year Olds | 0 (0.0%) | 0 (0.0%) |
| 25 to 34 Year Olds | 0 (0.0%) | 6 (100.0%) |
| 35 Years and over | 0 (0.0%) | 0 (0.0%) |
| Total | 0 (0.0%) | 6 (100.0%) |
Educational Attainment by Field of Study in Valmont
Psychology (6 | 16.7%), science & technology (6 | 16.7%), business (6 | 16.7%), visual & performing arts (6 | 16.7%), and computers & mathematics (4 | 11.1%) are the most common fields of study among 36 individuals in Valmont who have obtained a bachelor's degree or higher.
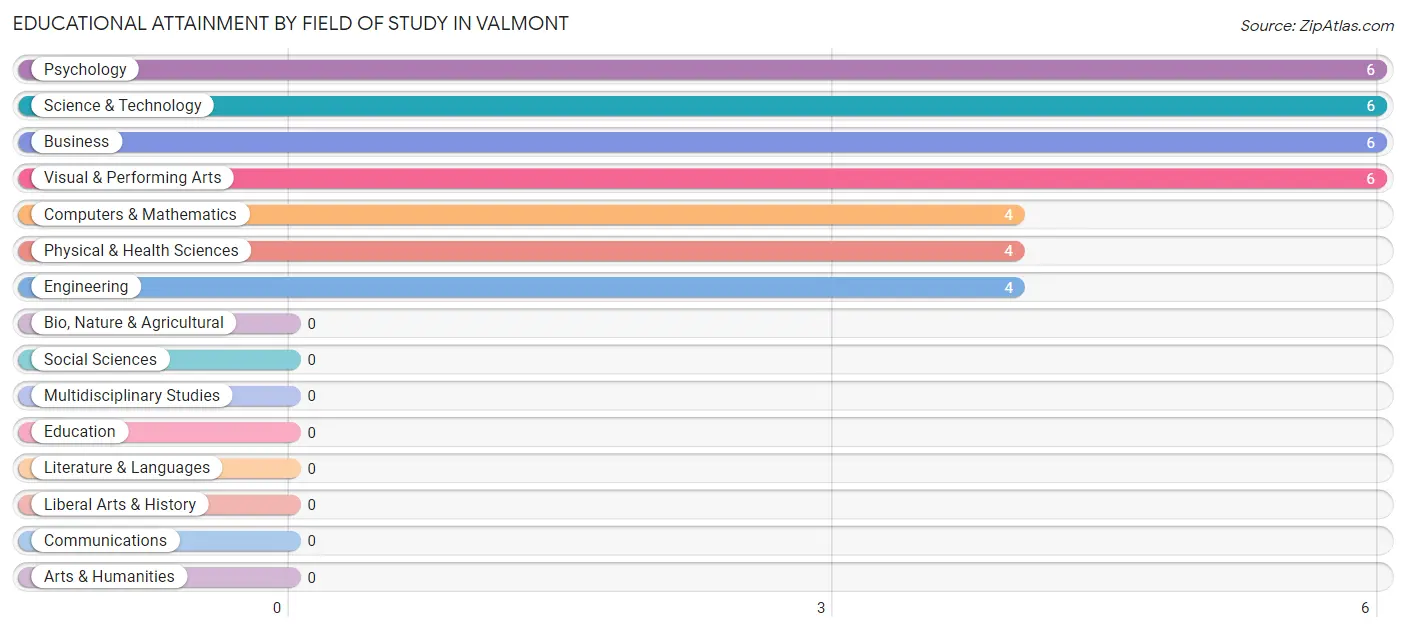
| Field of Study | # Graduates | % Graduates |
| Computers & Mathematics | 4 | 11.1% |
| Bio, Nature & Agricultural | 0 | 0.0% |
| Physical & Health Sciences | 4 | 11.1% |
| Psychology | 6 | 16.7% |
| Social Sciences | 0 | 0.0% |
| Engineering | 4 | 11.1% |
| Multidisciplinary Studies | 0 | 0.0% |
| Science & Technology | 6 | 16.7% |
| Business | 6 | 16.7% |
| Education | 0 | 0.0% |
| Literature & Languages | 0 | 0.0% |
| Liberal Arts & History | 0 | 0.0% |
| Visual & Performing Arts | 6 | 16.7% |
| Communications | 0 | 0.0% |
| Arts & Humanities | 0 | 0.0% |
| Total | 36 | 100.0% |
Transportation & Commute in Valmont
Vehicle Availability by Sex in Valmont
The most prevalent vehicle ownership categories in Valmont are males with 1 vehicle (27, accounting for 58.7%) and females with 1 vehicle (0, making up 142.1%).
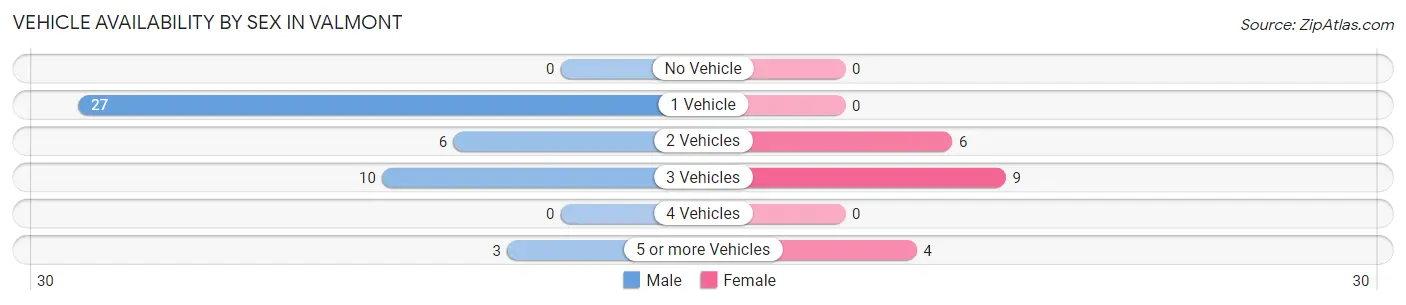
| Vehicles Available | Male | Female |
| No Vehicle | 0 (0.0%) | 0 (0.0%) |
| 1 Vehicle | 27 (58.7%) | 0 (0.0%) |
| 2 Vehicles | 6 (13.0%) | 6 (31.6%) |
| 3 Vehicles | 10 (21.7%) | 9 (47.4%) |
| 4 Vehicles | 0 (0.0%) | 0 (0.0%) |
| 5 or more Vehicles | 3 (6.5%) | 4 (21.0%) |
| Total | 46 (100.0%) | 19 (100.0%) |
Commute Time in Valmont
The most frequently occuring commute durations in Valmont are 10 to 14 minutes (37 commuters, 56.9%), 25 to 29 minutes (11 commuters, 16.9%), and 15 to 19 minutes (7 commuters, 10.8%).
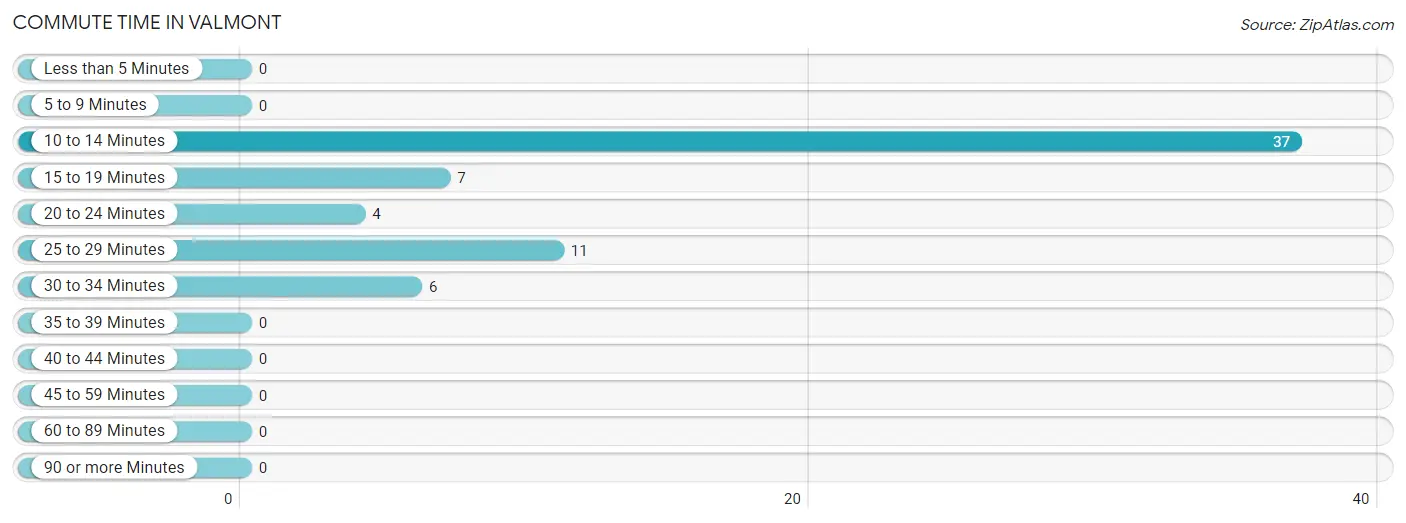
| Commute Time | # Commuters | % Commuters |
| Less than 5 Minutes | 0 | 0.0% |
| 5 to 9 Minutes | 0 | 0.0% |
| 10 to 14 Minutes | 37 | 56.9% |
| 15 to 19 Minutes | 7 | 10.8% |
| 20 to 24 Minutes | 4 | 6.1% |
| 25 to 29 Minutes | 11 | 16.9% |
| 30 to 34 Minutes | 6 | 9.2% |
| 35 to 39 Minutes | 0 | 0.0% |
| 40 to 44 Minutes | 0 | 0.0% |
| 45 to 59 Minutes | 0 | 0.0% |
| 60 to 89 Minutes | 0 | 0.0% |
| 90 or more Minutes | 0 | 0.0% |
Commute Time by Sex in Valmont
The most common commute times in Valmont are 10 to 14 minutes (37 commuters, 80.4%) for males and 25 to 29 minutes (11 commuters, 57.9%) for females.
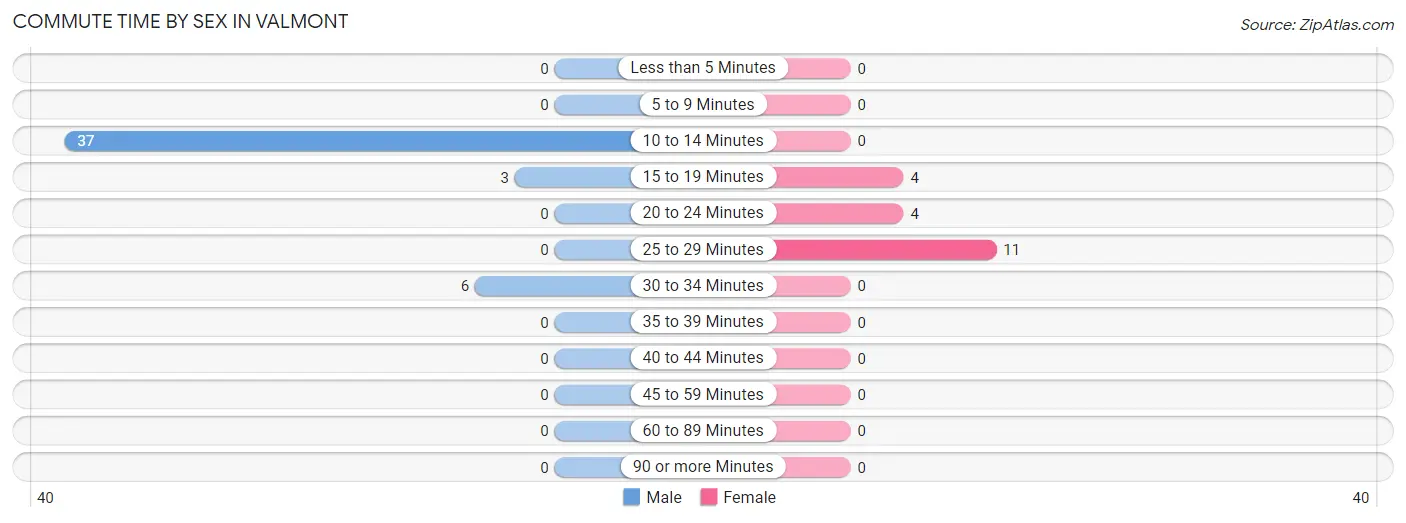
| Commute Time | Male | Female |
| Less than 5 Minutes | 0 (0.0%) | 0 (0.0%) |
| 5 to 9 Minutes | 0 (0.0%) | 0 (0.0%) |
| 10 to 14 Minutes | 37 (80.4%) | 0 (0.0%) |
| 15 to 19 Minutes | 3 (6.5%) | 4 (21.0%) |
| 20 to 24 Minutes | 0 (0.0%) | 4 (21.0%) |
| 25 to 29 Minutes | 0 (0.0%) | 11 (57.9%) |
| 30 to 34 Minutes | 6 (13.0%) | 0 (0.0%) |
| 35 to 39 Minutes | 0 (0.0%) | 0 (0.0%) |
| 40 to 44 Minutes | 0 (0.0%) | 0 (0.0%) |
| 45 to 59 Minutes | 0 (0.0%) | 0 (0.0%) |
| 60 to 89 Minutes | 0 (0.0%) | 0 (0.0%) |
| 90 or more Minutes | 0 (0.0%) | 0 (0.0%) |
Time of Departure to Work by Sex in Valmont
The most frequent times of departure to work in Valmont are 6:30 AM to 6:59 AM (27, 58.7%) for males and 6:00 AM to 6:29 AM (6, 31.6%) for females.
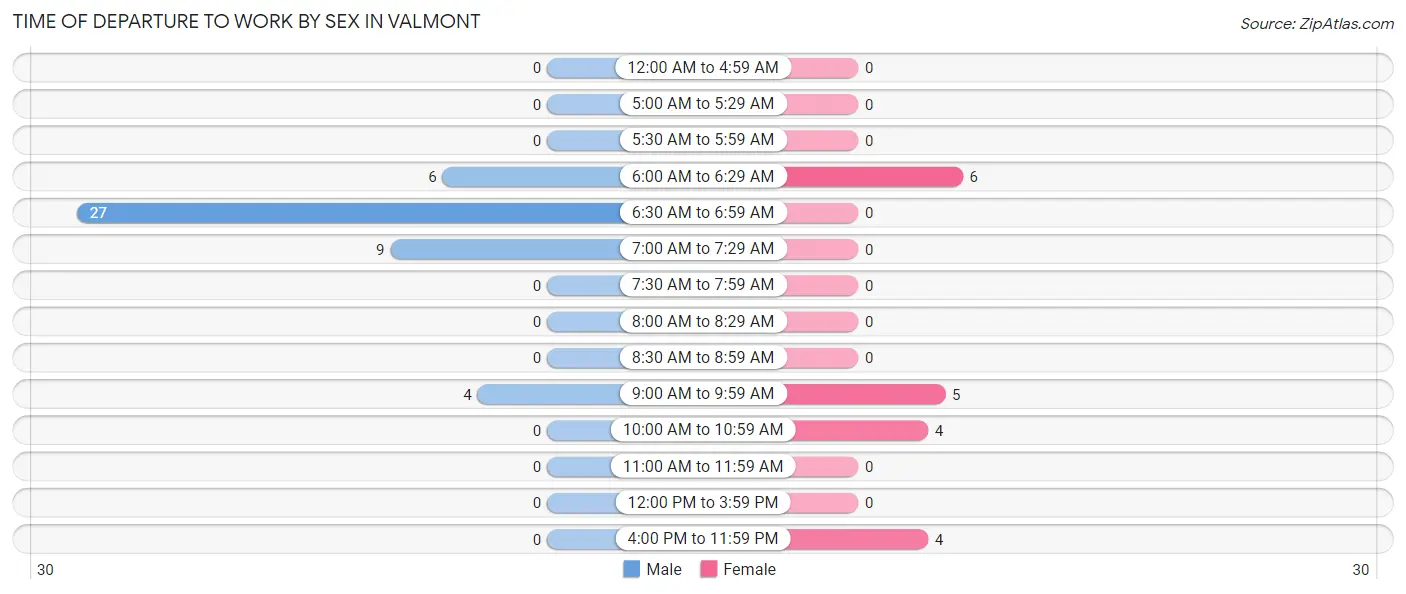
| Time of Departure | Male | Female |
| 12:00 AM to 4:59 AM | 0 (0.0%) | 0 (0.0%) |
| 5:00 AM to 5:29 AM | 0 (0.0%) | 0 (0.0%) |
| 5:30 AM to 5:59 AM | 0 (0.0%) | 0 (0.0%) |
| 6:00 AM to 6:29 AM | 6 (13.0%) | 6 (31.6%) |
| 6:30 AM to 6:59 AM | 27 (58.7%) | 0 (0.0%) |
| 7:00 AM to 7:29 AM | 9 (19.6%) | 0 (0.0%) |
| 7:30 AM to 7:59 AM | 0 (0.0%) | 0 (0.0%) |
| 8:00 AM to 8:29 AM | 0 (0.0%) | 0 (0.0%) |
| 8:30 AM to 8:59 AM | 0 (0.0%) | 0 (0.0%) |
| 9:00 AM to 9:59 AM | 4 (8.7%) | 5 (26.3%) |
| 10:00 AM to 10:59 AM | 0 (0.0%) | 4 (21.0%) |
| 11:00 AM to 11:59 AM | 0 (0.0%) | 0 (0.0%) |
| 12:00 PM to 3:59 PM | 0 (0.0%) | 0 (0.0%) |
| 4:00 PM to 11:59 PM | 0 (0.0%) | 4 (21.0%) |
| Total | 46 (100.0%) | 19 (100.0%) |
Housing Occupancy in Valmont
Occupancy by Ownership in Valmont
Of the total 49 dwellings in Valmont, owner-occupied units account for 16 (32.7%), while renter-occupied units make up 33 (67.3%).
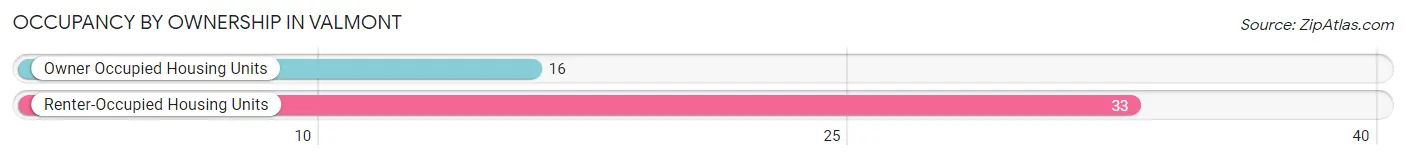
| Occupancy | # Housing Units | % Housing Units |
| Owner Occupied Housing Units | 16 | 32.7% |
| Renter-Occupied Housing Units | 33 | 67.3% |
| Total Occupied Housing Units | 49 | 100.0% |
Occupancy by Household Size in Valmont
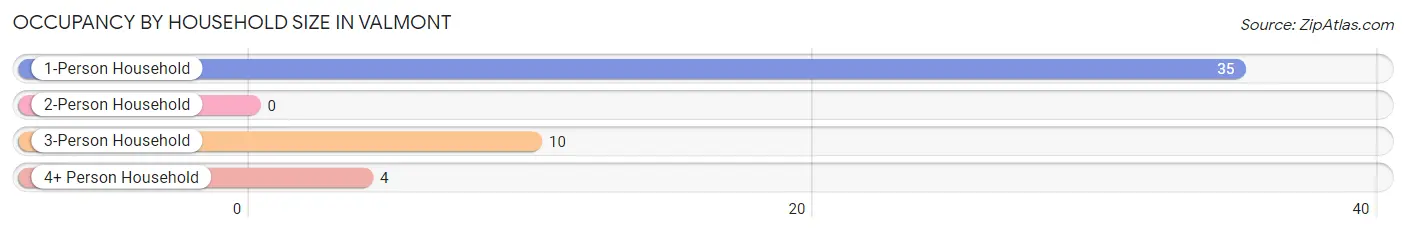
| Household Size | # Housing Units | % Housing Units |
| 1-Person Household | 35 | 71.4% |
| 2-Person Household | 0 | 0.0% |
| 3-Person Household | 10 | 20.4% |
| 4+ Person Household | 4 | 8.2% |
| Total Housing Units | 49 | 100.0% |
Occupancy by Ownership by Household Size in Valmont
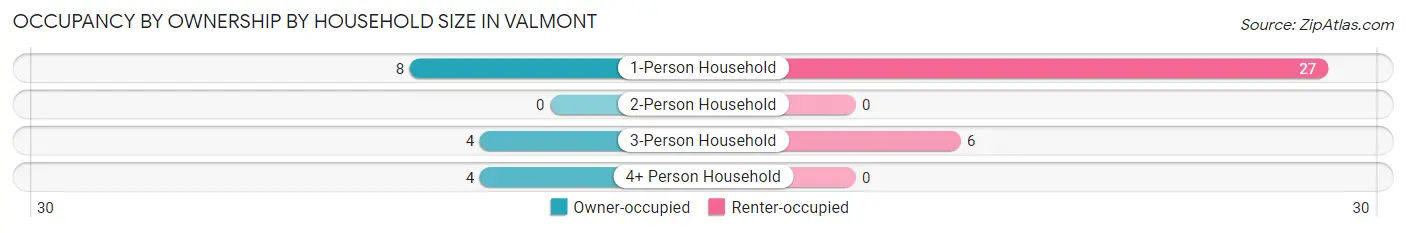
| Household Size | Owner-occupied | Renter-occupied |
| 1-Person Household | 8 (22.9%) | 27 (77.1%) |
| 2-Person Household | 0 (0.0%) | 0 (0.0%) |
| 3-Person Household | 4 (40.0%) | 6 (60.0%) |
| 4+ Person Household | 4 (100.0%) | 0 (0.0%) |
| Total Housing Units | 16 (32.7%) | 33 (67.3%) |
Occupancy by Educational Attainment in Valmont
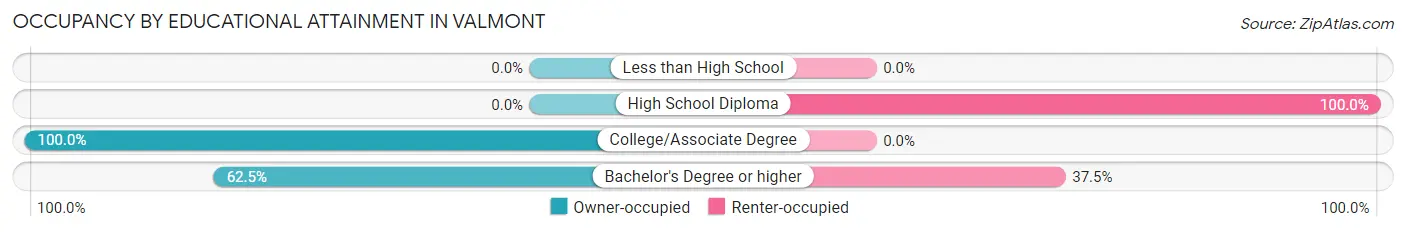
| Household Size | Owner-occupied | Renter-occupied |
| Less than High School | 0 (0.0%) | 0 (0.0%) |
| High School Diploma | 0 (0.0%) | 27 (100.0%) |
| College/Associate Degree | 6 (100.0%) | 0 (0.0%) |
| Bachelor's Degree or higher | 10 (62.5%) | 6 (37.5%) |
Occupancy by Age of Householder in Valmont
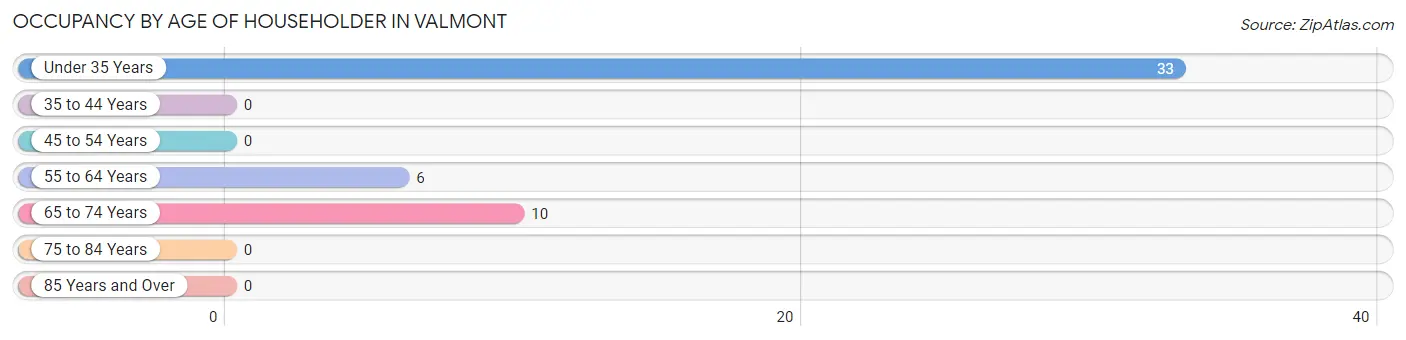
| Age Bracket | # Households | % Households |
| Under 35 Years | 33 | 67.3% |
| 35 to 44 Years | 0 | 0.0% |
| 45 to 54 Years | 0 | 0.0% |
| 55 to 64 Years | 6 | 12.2% |
| 65 to 74 Years | 10 | 20.4% |
| 75 to 84 Years | 0 | 0.0% |
| 85 Years and Over | 0 | 0.0% |
| Total | 49 | 100.0% |
Housing Finances in Valmont
Median Income by Occupancy in Valmont
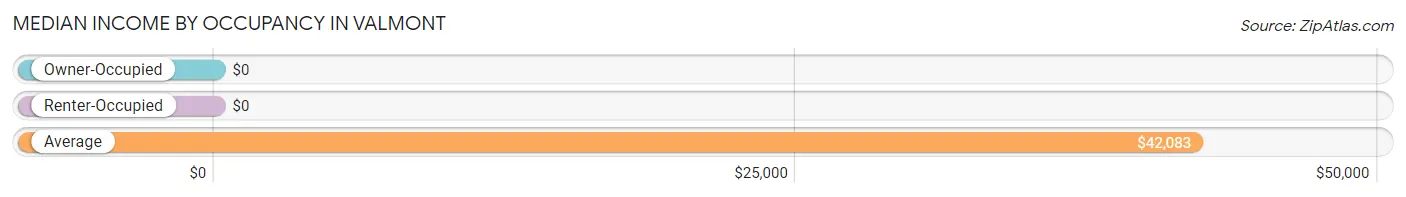
| Occupancy Type | # Households | Median Income |
| Owner-Occupied | 16 (32.7%) | $0 |
| Renter-Occupied | 33 (67.3%) | $0 |
| Average | 49 (100.0%) | $42,083 |
Occupancy by Householder Income Bracket in Valmont
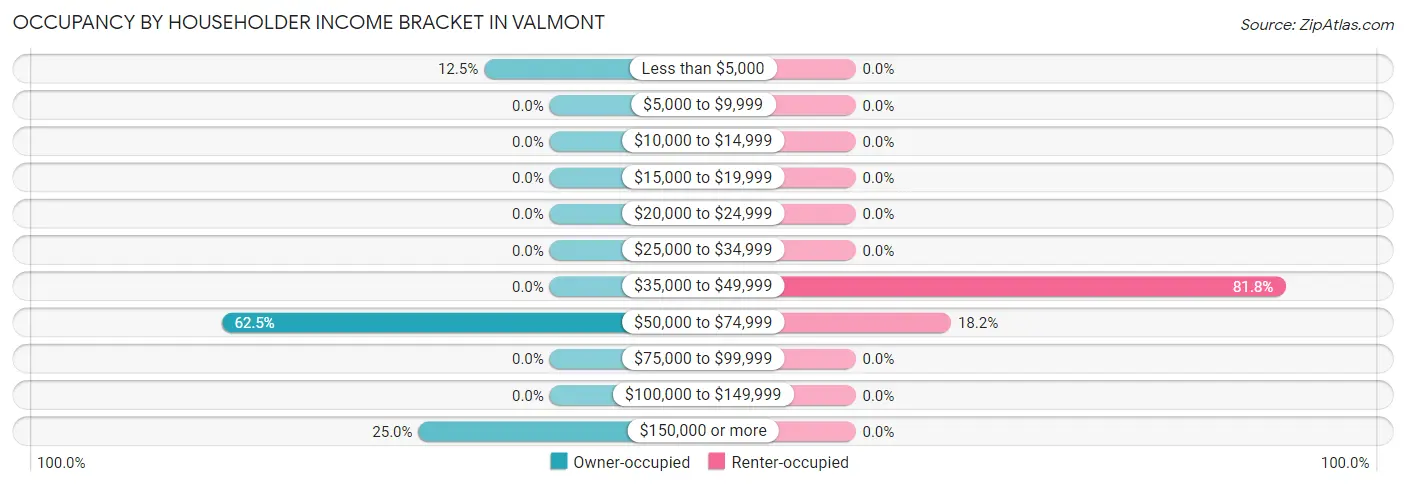
| Income Bracket | Owner-occupied | Renter-occupied |
| Less than $5,000 | 2 (12.5%) | 0 (0.0%) |
| $5,000 to $9,999 | 0 (0.0%) | 0 (0.0%) |
| $10,000 to $14,999 | 0 (0.0%) | 0 (0.0%) |
| $15,000 to $19,999 | 0 (0.0%) | 0 (0.0%) |
| $20,000 to $24,999 | 0 (0.0%) | 0 (0.0%) |
| $25,000 to $34,999 | 0 (0.0%) | 0 (0.0%) |
| $35,000 to $49,999 | 0 (0.0%) | 27 (81.8%) |
| $50,000 to $74,999 | 10 (62.5%) | 6 (18.2%) |
| $75,000 to $99,999 | 0 (0.0%) | 0 (0.0%) |
| $100,000 to $149,999 | 0 (0.0%) | 0 (0.0%) |
| $150,000 or more | 4 (25.0%) | 0 (0.0%) |
| Total | 16 (100.0%) | 33 (100.0%) |
Monthly Housing Cost Tiers in Valmont
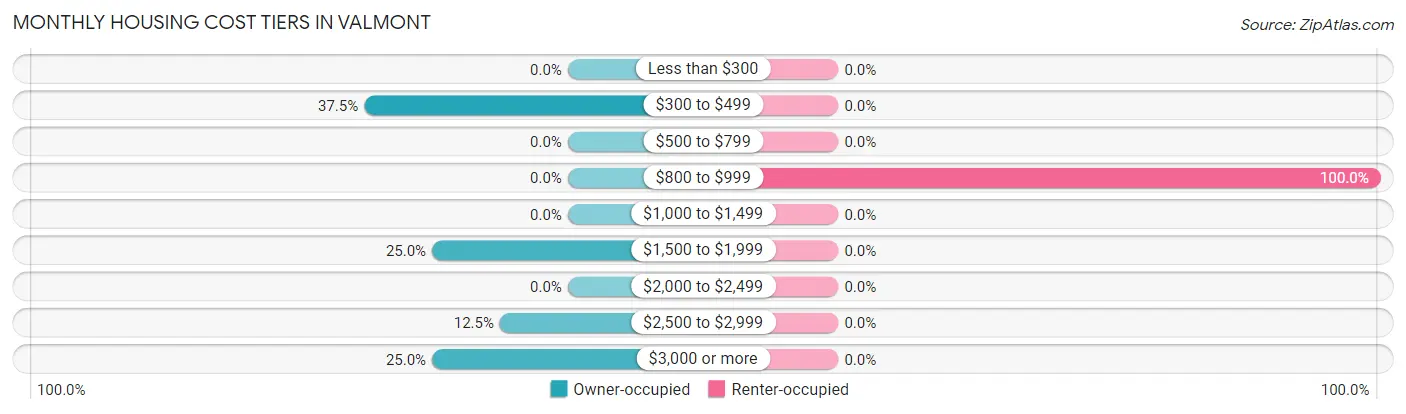
| Monthly Cost | Owner-occupied | Renter-occupied |
| Less than $300 | 0 (0.0%) | 0 (0.0%) |
| $300 to $499 | 6 (37.5%) | 0 (0.0%) |
| $500 to $799 | 0 (0.0%) | 0 (0.0%) |
| $800 to $999 | 0 (0.0%) | 33 (100.0%) |
| $1,000 to $1,499 | 0 (0.0%) | 0 (0.0%) |
| $1,500 to $1,999 | 4 (25.0%) | 0 (0.0%) |
| $2,000 to $2,499 | 0 (0.0%) | 0 (0.0%) |
| $2,500 to $2,999 | 2 (12.5%) | 0 (0.0%) |
| $3,000 or more | 4 (25.0%) | 0 (0.0%) |
| Total | 16 (100.0%) | 33 (100.0%) |
Physical Housing Characteristics in Valmont
Housing Structures in Valmont
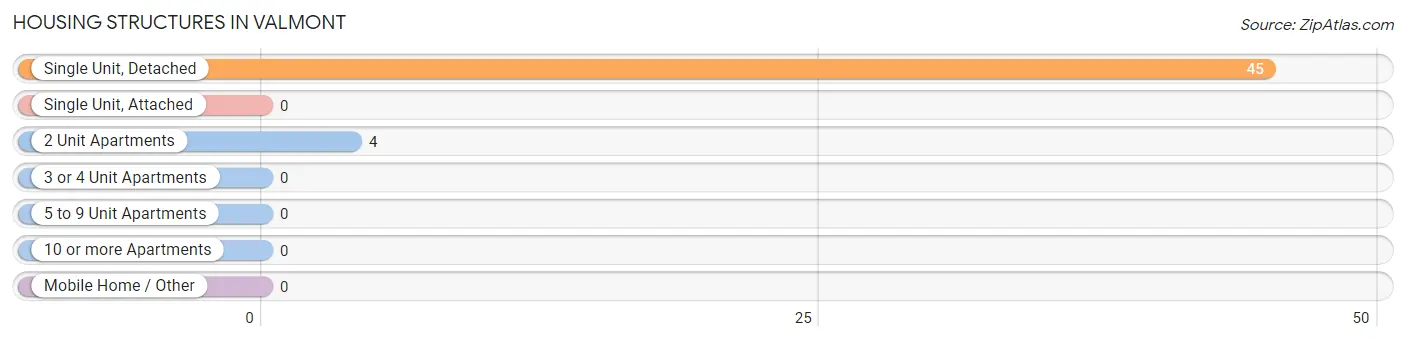
| Structure Type | # Housing Units | % Housing Units |
| Single Unit, Detached | 45 | 91.8% |
| Single Unit, Attached | 0 | 0.0% |
| 2 Unit Apartments | 4 | 8.2% |
| 3 or 4 Unit Apartments | 0 | 0.0% |
| 5 to 9 Unit Apartments | 0 | 0.0% |
| 10 or more Apartments | 0 | 0.0% |
| Mobile Home / Other | 0 | 0.0% |
| Total | 49 | 100.0% |
Housing Structures by Occupancy in Valmont
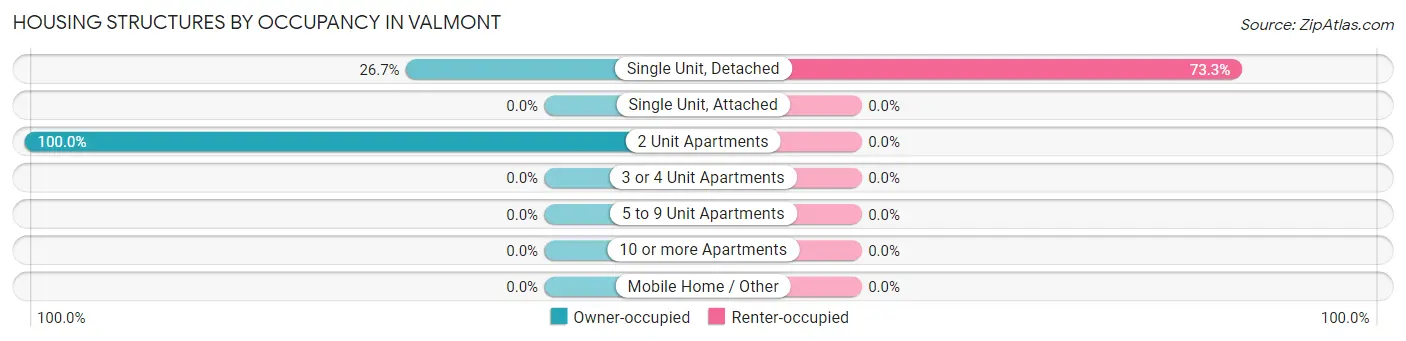
| Structure Type | Owner-occupied | Renter-occupied |
| Single Unit, Detached | 12 (26.7%) | 33 (73.3%) |
| Single Unit, Attached | 0 (0.0%) | 0 (0.0%) |
| 2 Unit Apartments | 4 (100.0%) | 0 (0.0%) |
| 3 or 4 Unit Apartments | 0 (0.0%) | 0 (0.0%) |
| 5 to 9 Unit Apartments | 0 (0.0%) | 0 (0.0%) |
| 10 or more Apartments | 0 (0.0%) | 0 (0.0%) |
| Mobile Home / Other | 0 (0.0%) | 0 (0.0%) |
| Total | 16 (32.7%) | 33 (67.3%) |
Housing Structures by Number of Rooms in Valmont
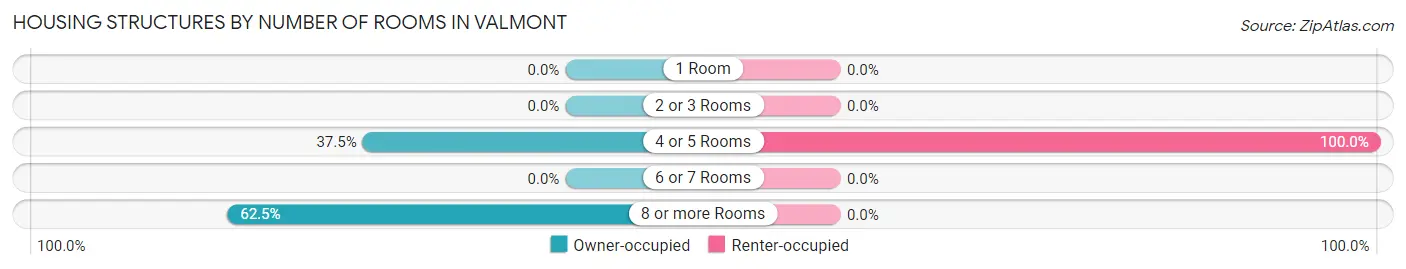
| Number of Rooms | Owner-occupied | Renter-occupied |
| 1 Room | 0 (0.0%) | 0 (0.0%) |
| 2 or 3 Rooms | 0 (0.0%) | 0 (0.0%) |
| 4 or 5 Rooms | 6 (37.5%) | 33 (100.0%) |
| 6 or 7 Rooms | 0 (0.0%) | 0 (0.0%) |
| 8 or more Rooms | 10 (62.5%) | 0 (0.0%) |
| Total | 16 (100.0%) | 33 (100.0%) |
Housing Structure by Heating Type in Valmont
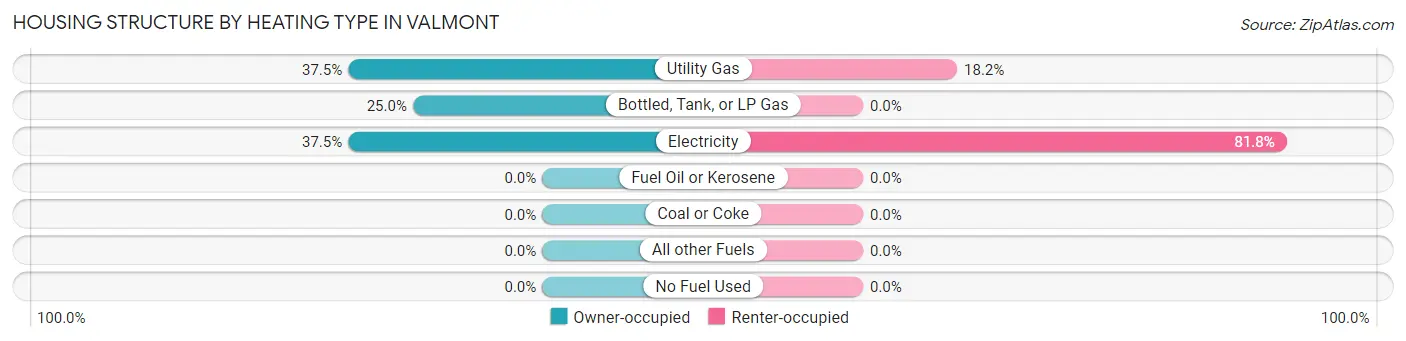
| Heating Type | Owner-occupied | Renter-occupied |
| Utility Gas | 6 (37.5%) | 6 (18.2%) |
| Bottled, Tank, or LP Gas | 4 (25.0%) | 0 (0.0%) |
| Electricity | 6 (37.5%) | 27 (81.8%) |
| Fuel Oil or Kerosene | 0 (0.0%) | 0 (0.0%) |
| Coal or Coke | 0 (0.0%) | 0 (0.0%) |
| All other Fuels | 0 (0.0%) | 0 (0.0%) |
| No Fuel Used | 0 (0.0%) | 0 (0.0%) |
| Total | 16 (100.0%) | 33 (100.0%) |
Household Vehicle Usage in Valmont
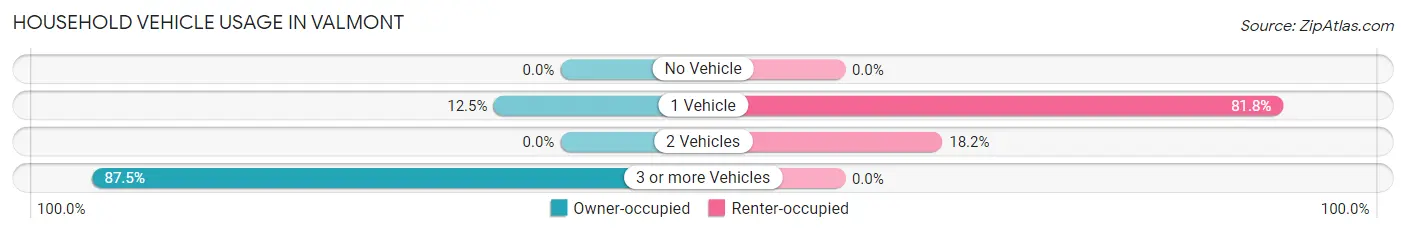
| Vehicles per Household | Owner-occupied | Renter-occupied |
| No Vehicle | 0 (0.0%) | 0 (0.0%) |
| 1 Vehicle | 2 (12.5%) | 27 (81.8%) |
| 2 Vehicles | 0 (0.0%) | 6 (18.2%) |
| 3 or more Vehicles | 14 (87.5%) | 0 (0.0%) |
| Total | 16 (100.0%) | 33 (100.0%) |
Real Estate & Mortgages in Valmont
Real Estate and Mortgage Overview in Valmont
| Characteristic | Without Mortgage | With Mortgage |
| Housing Units | 12 | 4 |
| Median Property Value | - | - |
| Median Household Income | $51,667 | $4 |
| Monthly Housing Costs | - | - |
| Real Estate Taxes | - | - |
Property Value by Mortgage Status in Valmont
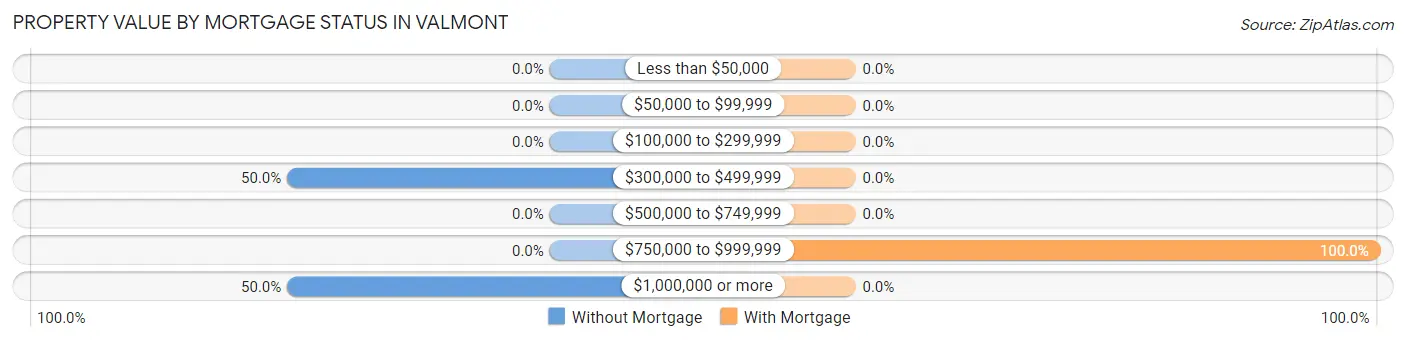
| Property Value | Without Mortgage | With Mortgage |
| Less than $50,000 | 0 (0.0%) | 0 (0.0%) |
| $50,000 to $99,999 | 0 (0.0%) | 0 (0.0%) |
| $100,000 to $299,999 | 0 (0.0%) | 0 (0.0%) |
| $300,000 to $499,999 | 6 (50.0%) | 0 (0.0%) |
| $500,000 to $749,999 | 0 (0.0%) | 0 (0.0%) |
| $750,000 to $999,999 | 0 (0.0%) | 4 (100.0%) |
| $1,000,000 or more | 6 (50.0%) | 0 (0.0%) |
| Total | 12 (100.0%) | 4 (100.0%) |
Household Income by Mortgage Status in Valmont
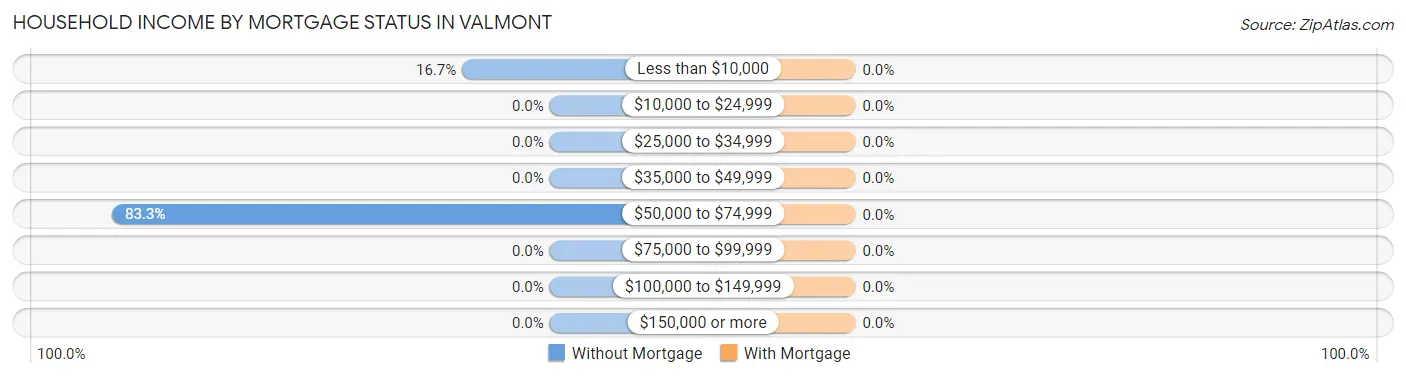
| Household Income | Without Mortgage | With Mortgage |
| Less than $10,000 | 2 (16.7%) | 0 (0.0%) |
| $10,000 to $24,999 | 0 (0.0%) | 0 (0.0%) |
| $25,000 to $34,999 | 0 (0.0%) | 0 (0.0%) |
| $35,000 to $49,999 | 0 (0.0%) | 0 (0.0%) |
| $50,000 to $74,999 | 10 (83.3%) | 0 (0.0%) |
| $75,000 to $99,999 | 0 (0.0%) | 0 (0.0%) |
| $100,000 to $149,999 | 0 (0.0%) | 0 (0.0%) |
| $150,000 or more | 0 (0.0%) | 0 (0.0%) |
| Total | 12 (100.0%) | 4 (100.0%) |
Property Value to Household Income Ratio in Valmont
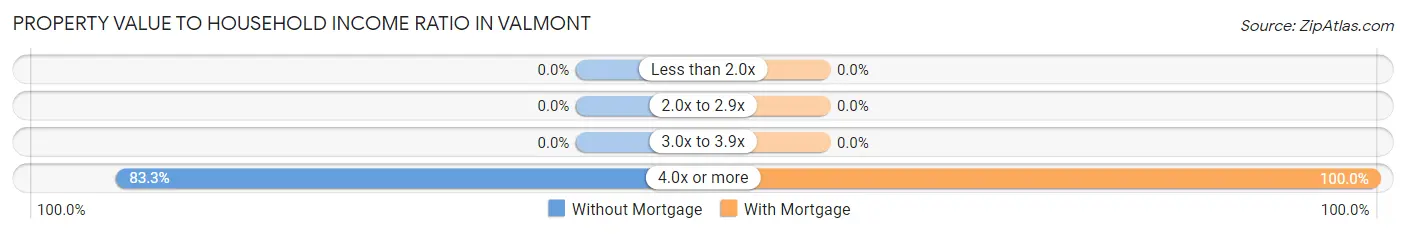
| Value-to-Income Ratio | Without Mortgage | With Mortgage |
| Less than 2.0x | 0 (0.0%) | 0 (0.0%) |
| 2.0x to 2.9x | 0 (0.0%) | 0 (0.0%) |
| 3.0x to 3.9x | 0 (0.0%) | 0 (0.0%) |
| 4.0x or more | 10 (83.3%) | 4 (100.0%) |
| Total | 12 (100.0%) | 4 (100.0%) |
Real Estate Taxes by Mortgage Status in Valmont
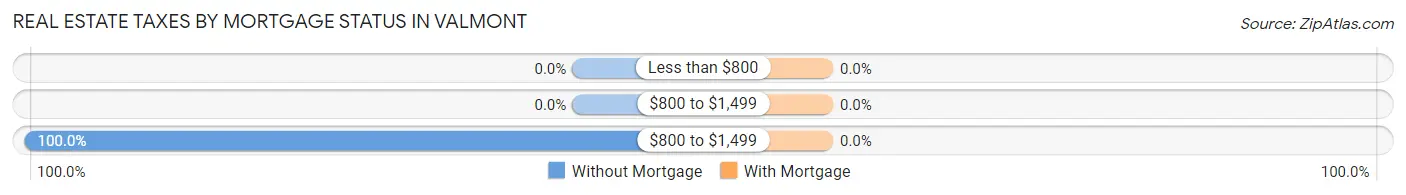
| Property Taxes | Without Mortgage | With Mortgage |
| Less than $800 | 0 (0.0%) | 0 (0.0%) |
| $800 to $1,499 | 0 (0.0%) | 0 (0.0%) |
| $800 to $1,499 | 12 (100.0%) | 0 (0.0%) |
| Total | 12 (100.0%) | 4 (100.0%) |
Health & Disability in Valmont
Health Insurance Coverage by Age in Valmont
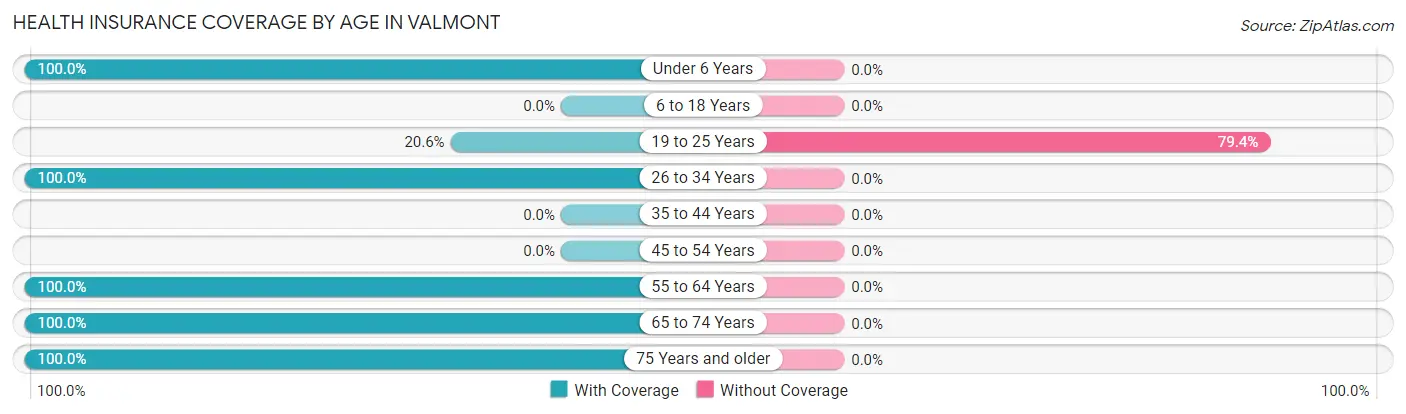
| Age Bracket | With Coverage | Without Coverage |
| Under 6 Years | 6 (100.0%) | 0 (0.0%) |
| 6 to 18 Years | 0 (0.0%) | 0 (0.0%) |
| 19 to 25 Years | 7 (20.6%) | 27 (79.4%) |
| 26 to 34 Years | 17 (100.0%) | 0 (0.0%) |
| 35 to 44 Years | 0 (0.0%) | 0 (0.0%) |
| 45 to 54 Years | 0 (0.0%) | 0 (0.0%) |
| 55 to 64 Years | 10 (100.0%) | 0 (0.0%) |
| 65 to 74 Years | 10 (100.0%) | 0 (0.0%) |
| 75 Years and older | 4 (100.0%) | 0 (0.0%) |
| Total | 54 (66.7%) | 27 (33.3%) |
Health Insurance Coverage by Citizenship Status in Valmont
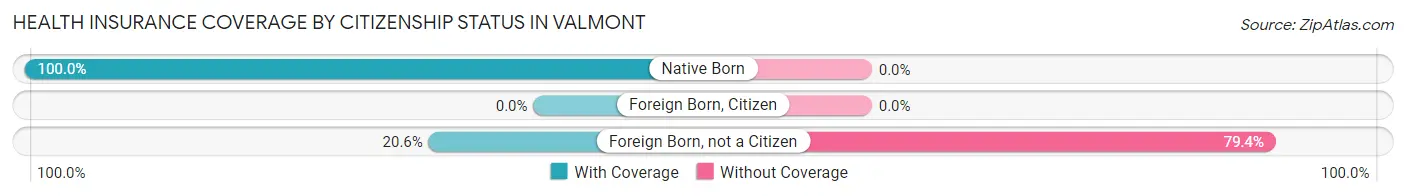
| Citizenship Status | With Coverage | Without Coverage |
| Native Born | 6 (100.0%) | 0 (0.0%) |
| Foreign Born, Citizen | 0 (0.0%) | 0 (0.0%) |
| Foreign Born, not a Citizen | 7 (20.6%) | 27 (79.4%) |
Health Insurance Coverage by Household Income in Valmont
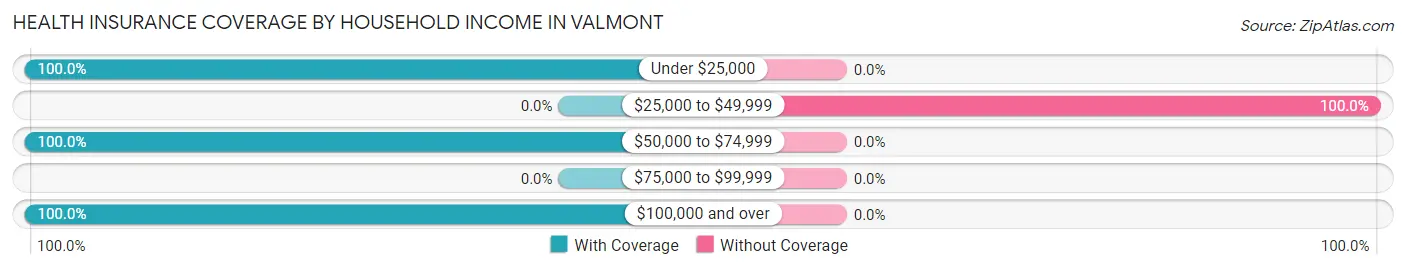
| Household Income | With Coverage | Without Coverage |
| Under $25,000 | 2 (100.0%) | 0 (0.0%) |
| $25,000 to $49,999 | 0 (0.0%) | 27 (100.0%) |
| $50,000 to $74,999 | 39 (100.0%) | 0 (0.0%) |
| $75,000 to $99,999 | 0 (0.0%) | 0 (0.0%) |
| $100,000 and over | 13 (100.0%) | 0 (0.0%) |
Public vs Private Health Insurance Coverage by Age in Valmont
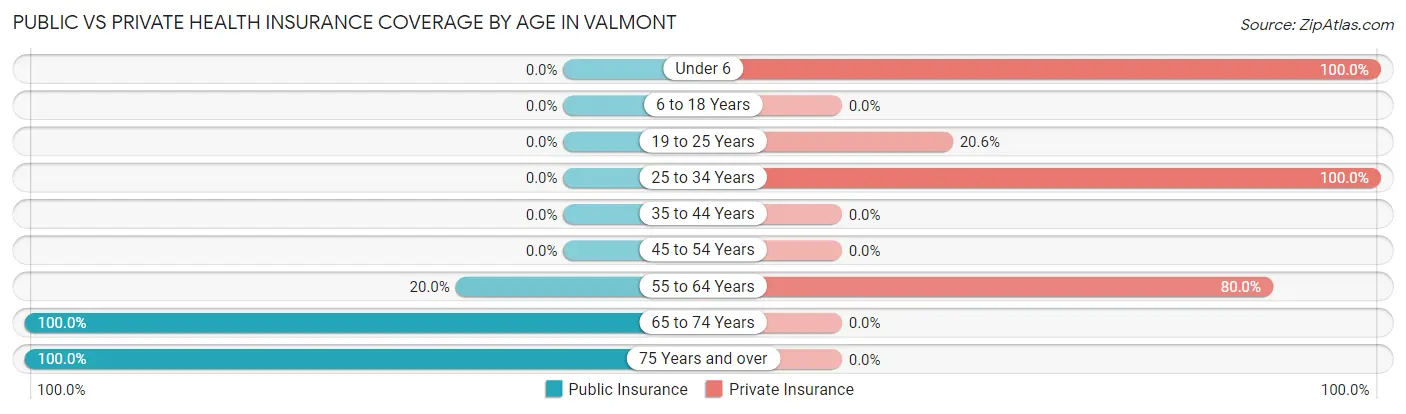
| Age Bracket | Public Insurance | Private Insurance |
| Under 6 | 0 (0.0%) | 6 (100.0%) |
| 6 to 18 Years | 0 (0.0%) | 0 (0.0%) |
| 19 to 25 Years | 0 (0.0%) | 7 (20.6%) |
| 25 to 34 Years | 0 (0.0%) | 17 (100.0%) |
| 35 to 44 Years | 0 (0.0%) | 0 (0.0%) |
| 45 to 54 Years | 0 (0.0%) | 0 (0.0%) |
| 55 to 64 Years | 2 (20.0%) | 8 (80.0%) |
| 65 to 74 Years | 10 (100.0%) | 0 (0.0%) |
| 75 Years and over | 4 (100.0%) | 0 (0.0%) |
| Total | 16 (19.8%) | 38 (46.9%) |
Disability Status by Sex by Age in Valmont
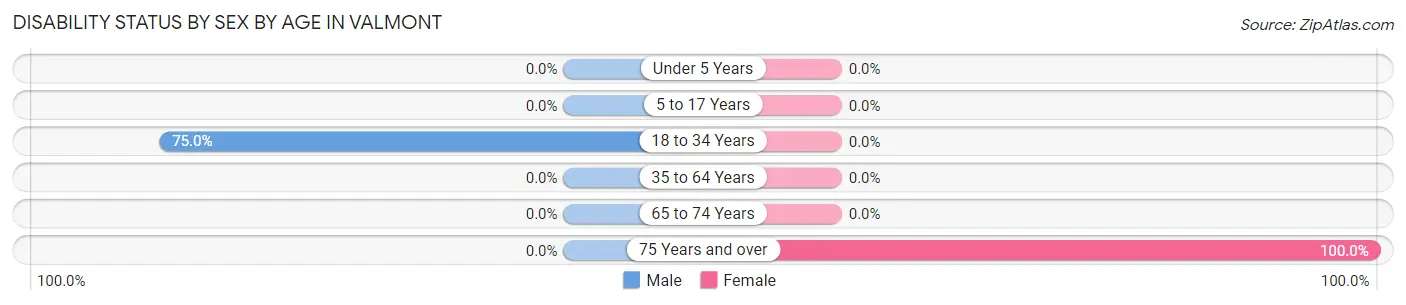
| Age Bracket | Male | Female |
| Under 5 Years | 0 (0.0%) | 0 (0.0%) |
| 5 to 17 Years | 0 (0.0%) | 0 (0.0%) |
| 18 to 34 Years | 27 (75.0%) | 0 (0.0%) |
| 35 to 64 Years | 0 (0.0%) | 0 (0.0%) |
| 65 to 74 Years | 0 (0.0%) | 0 (0.0%) |
| 75 Years and over | 0 (0.0%) | 4 (100.0%) |
Disability Class by Sex by Age in Valmont
Disability Class: Hearing Difficulty
| Age Bracket | Male | Female |
| Under 5 Years | 0 (0.0%) | 0 (0.0%) |
| 5 to 17 Years | 0 (0.0%) | 0 (0.0%) |
| 18 to 34 Years | 0 (0.0%) | 0 (0.0%) |
| 35 to 64 Years | 0 (0.0%) | 0 (0.0%) |
| 65 to 74 Years | 0 (0.0%) | 0 (0.0%) |
| 75 Years and over | 0 (0.0%) | 0 (0.0%) |
Disability Class: Vision Difficulty
| Age Bracket | Male | Female |
| Under 5 Years | 0 (0.0%) | 0 (0.0%) |
| 5 to 17 Years | 0 (0.0%) | 0 (0.0%) |
| 18 to 34 Years | 0 (0.0%) | 0 (0.0%) |
| 35 to 64 Years | 0 (0.0%) | 0 (0.0%) |
| 65 to 74 Years | 0 (0.0%) | 0 (0.0%) |
| 75 Years and over | 0 (0.0%) | 0 (0.0%) |
Disability Class: Cognitive Difficulty
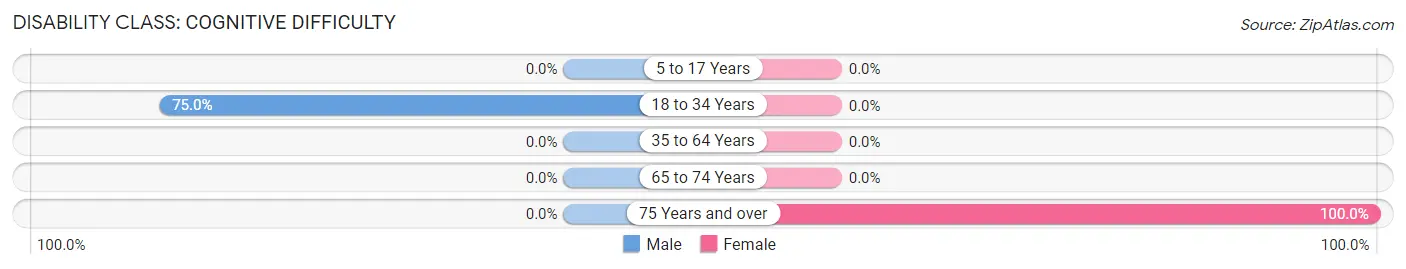
| Age Bracket | Male | Female |
| 5 to 17 Years | 0 (0.0%) | 0 (0.0%) |
| 18 to 34 Years | 27 (75.0%) | 0 (0.0%) |
| 35 to 64 Years | 0 (0.0%) | 0 (0.0%) |
| 65 to 74 Years | 0 (0.0%) | 0 (0.0%) |
| 75 Years and over | 0 (0.0%) | 4 (100.0%) |
Disability Class: Ambulatory Difficulty
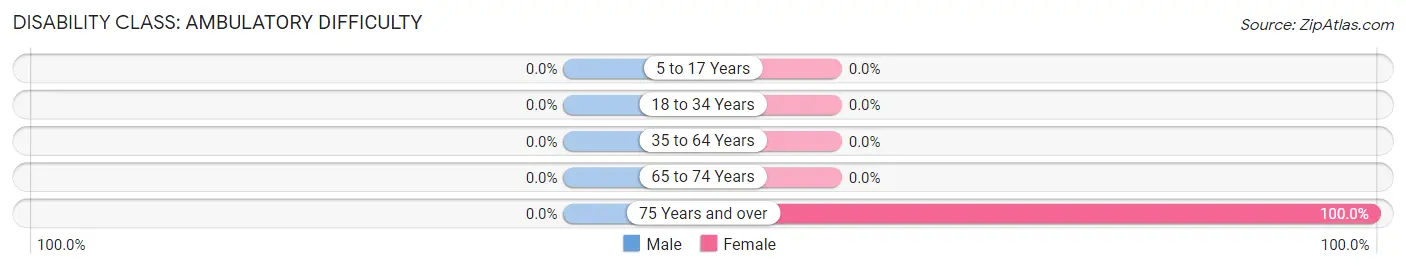
| Age Bracket | Male | Female |
| 5 to 17 Years | 0 (0.0%) | 0 (0.0%) |
| 18 to 34 Years | 0 (0.0%) | 0 (0.0%) |
| 35 to 64 Years | 0 (0.0%) | 0 (0.0%) |
| 65 to 74 Years | 0 (0.0%) | 0 (0.0%) |
| 75 Years and over | 0 (0.0%) | 4 (100.0%) |
Disability Class: Self-Care Difficulty
| Age Bracket | Male | Female |
| 5 to 17 Years | 0 (0.0%) | 0 (0.0%) |
| 18 to 34 Years | 0 (0.0%) | 0 (0.0%) |
| 35 to 64 Years | 0 (0.0%) | 0 (0.0%) |
| 65 to 74 Years | 0 (0.0%) | 0 (0.0%) |
| 75 Years and over | 0 (0.0%) | 0 (0.0%) |
Technology Access in Valmont
Computing Device Access in Valmont
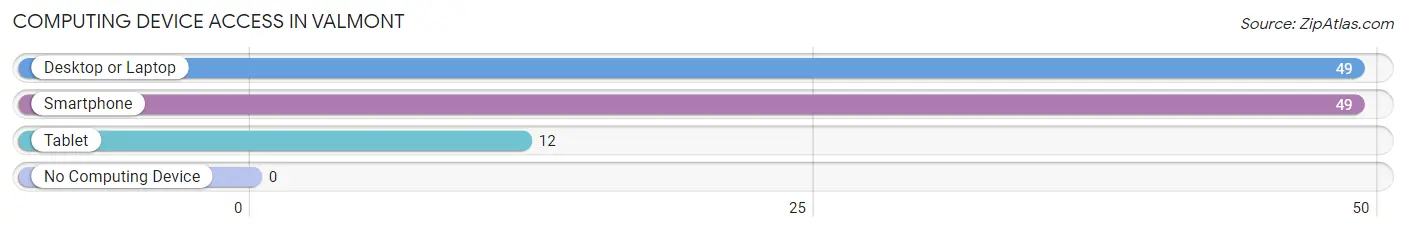
| Device Type | # Households | % Households |
| Desktop or Laptop | 49 | 100.0% |
| Smartphone | 49 | 100.0% |
| Tablet | 12 | 24.5% |
| No Computing Device | 0 | 0.0% |
| Total | 49 | 100.0% |
Internet Access in Valmont
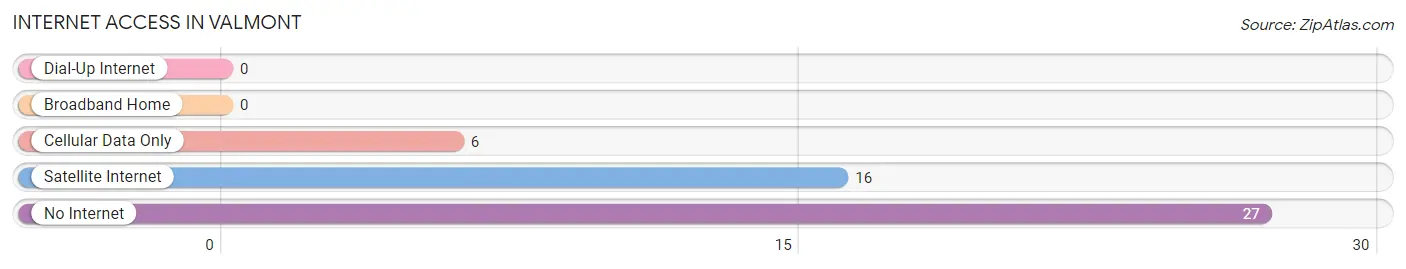
| Internet Type | # Households | % Households |
| Dial-Up Internet | 0 | 0.0% |
| Broadband Home | 0 | 0.0% |
| Cellular Data Only | 6 | 12.2% |
| Satellite Internet | 16 | 32.7% |
| No Internet | 27 | 55.1% |
| Total | 49 | 100.0% |
Valmont Summary
Valmont, Colorado is a small town located in Boulder County, Colorado. It is situated in the foothills of the Rocky Mountains, approximately 25 miles northwest of Denver. Valmont was founded in 1875 and is named after the French city of Valmont. The town has a population of approximately 1,500 people and is known for its rural charm and small-town atmosphere.
Geography
Valmont is located in the foothills of the Rocky Mountains, approximately 25 miles northwest of Denver. The town is situated at an elevation of 5,400 feet and is surrounded by rolling hills and open fields. The town is located in the South Platte River Valley, which is known for its fertile soil and abundant wildlife. Valmont is also located near the Boulder Reservoir, which provides recreational opportunities for residents and visitors alike.
Climate
Valmont has a semi-arid climate, with hot summers and cold winters. The average high temperature in the summer is around 85 degrees Fahrenheit, while the average low temperature in the winter is around 20 degrees Fahrenheit. The town receives an average of 16 inches of precipitation per year, with most of it falling in the spring and summer months.
Economy
Valmont’s economy is largely based on agriculture and tourism. The town is home to several farms and ranches, which produce a variety of crops and livestock. Valmont is also home to several wineries, which produce award-winning wines. The town is also a popular destination for outdoor enthusiasts, who come to enjoy the area’s hiking trails, fishing spots, and camping sites.
Demographics
As of the 2010 census, Valmont had a population of 1,500 people. The town is predominantly white, with approximately 90% of the population identifying as Caucasian. The median household income in Valmont is $50,000, and the median age is 40 years old.
Valmont is a small town with a big heart. It is a place where people come to enjoy the rural charm and small-town atmosphere. The town is home to a variety of businesses and attractions, and its residents are proud of their community and its history. Valmont is a great place to live, work, and play.
Common Questions
What is Per Capita Income in Valmont?
Per Capita income in Valmont is $36,430.
What is the Median Family Income in Valmont?
Median Family Income in Valmont is $73,750.
What is the Median Household income in Valmont?
Median Household Income in Valmont is $42,083.
What is Income or Wage Gap in Valmont?
Income or Wage Gap in Valmont is 26.5%.
Women in Valmont earn 73.5 cents for every dollar earned by a man.
What is Inequality or Gini Index in Valmont?
Inequality or Gini Index in Valmont is 0.32.
What is the Total Population of Valmont?
Total Population of Valmont is 81.
What is the Total Male Population of Valmont?
Total Male Population of Valmont is 56.
What is the Total Female Population of Valmont?
Total Female Population of Valmont is 25.
What is the Ratio of Males per 100 Females in Valmont?
There are 224.00 Males per 100 Females in Valmont.
What is the Ratio of Females per 100 Males in Valmont?
There are 44.64 Females per 100 Males in Valmont.
What is the Median Population Age in Valmont?
Median Population Age in Valmont is 28.1 Years.
What is the Average Family Size in Valmont
Average Family Size in Valmont is 2.7 People.
What is the Average Household Size in Valmont
Average Household Size in Valmont is 1.6 People.
How Large is the Labor Force in Valmont?
There are 65 People in the Labor Forcein in Valmont.
What is the Percentage of People in the Labor Force in Valmont?
86.7% of People are in the Labor Force in Valmont.