Zip Codes with the Highest Percentage of Population with a Degree in Computers and Mathematics in Colorado
RELATED REPORTS & OPTIONS
Computers and Mathematics
Colorado
Compare Zip Codes
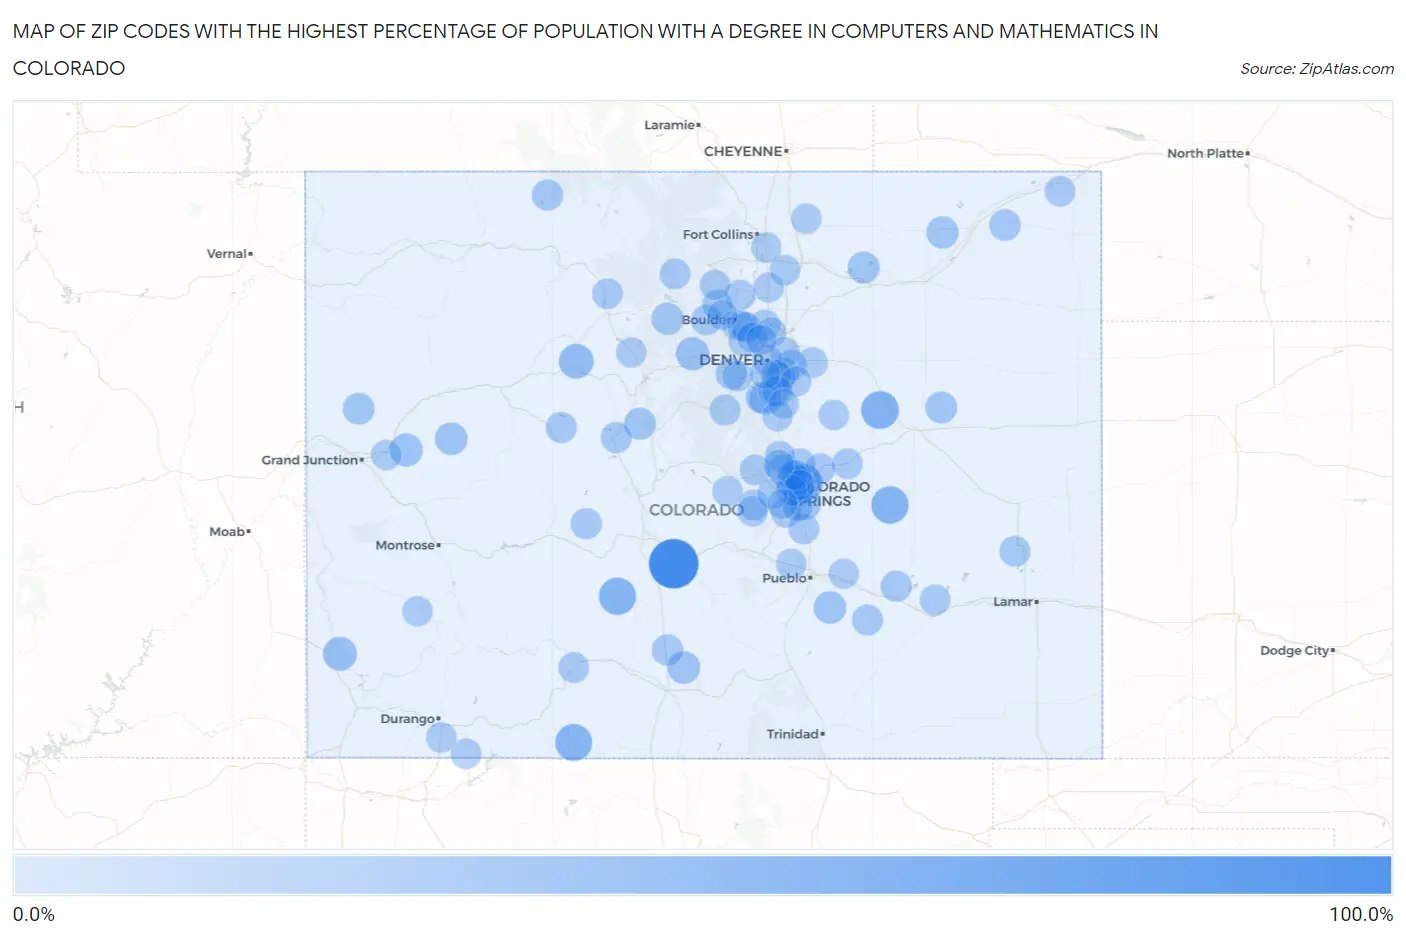
Map of Zip Codes with the Highest Percentage of Population with a Degree in Computers and Mathematics in Colorado
0.0%
100.0%
Zip Codes with the Highest Percentage of Population with a Degree in Computers and Mathematics in Colorado
| Zip Code | % Graduates | vs State | vs National | |
| 1. | 81222 | 100.0% | 5.2%(+94.8)#1 | 4.9%(+95.1)#10 |
| 2. | 80101 | 42.0% | 5.2%(+36.8)#2 | 4.9%(+37.1)#123 |
| 3. | 80833 | 40.1% | 5.2%(+34.9)#3 | 4.9%(+35.2)#129 |
| 4. | 81149 | 39.5% | 5.2%(+34.4)#4 | 4.9%(+34.6)#138 |
| 5. | 81128 | 38.1% | 5.2%(+32.9)#5 | 4.9%(+33.2)#146 |
| 6. | 80938 | 33.2% | 5.2%(+28.1)#6 | 4.9%(+28.3)#195 |
| 7. | 81655 | 27.6% | 5.2%(+22.5)#7 | 4.9%(+22.7)#254 |
| 8. | 81320 | 23.2% | 5.2%(+18.0)#8 | 4.9%(+18.3)#355 |
| 9. | 80436 | 20.5% | 5.2%(+15.4)#9 | 4.9%(+15.7)#444 |
| 10. | 81643 | 18.8% | 5.2%(+13.7)#10 | 4.9%(+14.0)#517 |
| 11. | 81146 | 17.6% | 5.2%(+12.4)#11 | 4.9%(+12.7)#582 |
| 12. | 81022 | 17.4% | 5.2%(+12.2)#12 | 4.9%(+12.5)#594 |
| 13. | 81624 | 17.1% | 5.2%(+11.9)#13 | 4.9%(+12.2)#625 |
| 14. | 80925 | 16.3% | 5.2%(+11.1)#14 | 4.9%(+11.4)#679 |
| 15. | 80741 | 15.1% | 5.2%(+9.92)#15 | 4.9%(+10.2)#780 |
| 16. | 80649 | 14.3% | 5.2%(+9.12)#16 | 4.9%(+9.39)#874 |
| 17. | 80478 | 14.3% | 5.2%(+9.09)#17 | 4.9%(+9.36)#885 |
| 18. | 80420 | 14.0% | 5.2%(+8.81)#18 | 4.9%(+9.08)#911 |
| 19. | 80818 | 13.8% | 5.2%(+8.58)#19 | 4.9%(+8.86)#938 |
| 20. | 81630 | 13.4% | 5.2%(+8.25)#20 | 4.9%(+8.52)#993 |
| 21. | 80131 | 13.2% | 5.2%(+8.04)#21 | 4.9%(+8.31)#1,022 |
| 22. | 80728 | 12.4% | 5.2%(+7.27)#22 | 4.9%(+7.54)#1,147 |
| 23. | 80927 | 11.5% | 5.2%(+6.32)#23 | 4.9%(+6.59)#1,331 |
| 24. | 80428 | 11.3% | 5.2%(+6.17)#24 | 4.9%(+6.45)#1,365 |
| 25. | 80457 | 11.2% | 5.2%(+6.00)#25 | 4.9%(+6.28)#1,406 |
| 26. | 81136 | 11.1% | 5.2%(+5.94)#26 | 4.9%(+6.22)#1,428 |
| 27. | 81656 | 10.5% | 5.2%(+5.29)#27 | 4.9%(+5.56)#1,595 |
| 28. | 80461 | 10.4% | 5.2%(+5.27)#28 | 4.9%(+5.55)#1,604 |
| 29. | 80125 | 10.2% | 5.2%(+5.07)#29 | 4.9%(+5.35)#1,676 |
| 30. | 81033 | 10.0% | 5.2%(+4.83)#30 | 4.9%(+5.11)#1,762 |
| 31. | 81036 | 9.8% | 5.2%(+4.67)#31 | 4.9%(+4.94)#1,818 |
| 32. | 81237 | 9.8% | 5.2%(+4.59)#32 | 4.9%(+4.86)#1,858 |
| 33. | 81039 | 9.7% | 5.2%(+4.50)#33 | 4.9%(+4.77)#1,897 |
| 34. | 80017 | 9.3% | 5.2%(+4.18)#34 | 4.9%(+4.45)#2,042 |
| 35. | 80503 | 9.3% | 5.2%(+4.09)#35 | 4.9%(+4.36)#2,093 |
| 36. | 80470 | 9.2% | 5.2%(+4.01)#36 | 4.9%(+4.28)#2,132 |
| 37. | 80817 | 9.2% | 5.2%(+3.99)#37 | 4.9%(+4.26)#2,150 |
| 38. | 80813 | 9.1% | 5.2%(+3.90)#38 | 4.9%(+4.17)#2,220 |
| 39. | 80840 | 8.9% | 5.2%(+3.73)#39 | 4.9%(+4.01)#2,312 |
| 40. | 81154 | 8.8% | 5.2%(+3.62)#40 | 4.9%(+3.89)#2,380 |
| 41. | 80902 | 8.7% | 5.2%(+3.50)#41 | 4.9%(+3.77)#2,443 |
| 42. | 80459 | 8.5% | 5.2%(+3.30)#42 | 4.9%(+3.58)#2,560 |
| 43. | 80908 | 8.3% | 5.2%(+3.16)#43 | 4.9%(+3.43)#2,652 |
| 44. | 80023 | 8.3% | 5.2%(+3.15)#44 | 4.9%(+3.42)#2,657 |
| 45. | 80466 | 8.3% | 5.2%(+3.15)#45 | 4.9%(+3.42)#2,658 |
| 46. | 80915 | 8.3% | 5.2%(+3.11)#46 | 4.9%(+3.39)#2,685 |
| 47. | 80305 | 8.2% | 5.2%(+3.02)#47 | 4.9%(+3.30)#2,752 |
| 48. | 80863 | 8.2% | 5.2%(+3.01)#48 | 4.9%(+3.29)#2,757 |
| 49. | 80007 | 8.1% | 5.2%(+2.92)#49 | 4.9%(+3.19)#2,831 |
| 50. | 80918 | 8.1% | 5.2%(+2.91)#50 | 4.9%(+3.18)#2,841 |
| 51. | 80447 | 8.0% | 5.2%(+2.86)#51 | 4.9%(+3.14)#2,877 |
| 52. | 80137 | 8.0% | 5.2%(+2.83)#52 | 4.9%(+3.11)#2,893 |
| 53. | 81030 | 8.0% | 5.2%(+2.83)#53 | 4.9%(+3.11)#2,900 |
| 54. | 80808 | 7.9% | 5.2%(+2.75)#54 | 4.9%(+3.03)#2,963 |
| 55. | 80911 | 7.9% | 5.2%(+2.70)#55 | 4.9%(+2.97)#3,006 |
| 56. | 80831 | 7.9% | 5.2%(+2.69)#56 | 4.9%(+2.96)#3,018 |
| 57. | 80132 | 7.8% | 5.2%(+2.65)#57 | 4.9%(+2.92)#3,050 |
| 58. | 80744 | 7.8% | 5.2%(+2.63)#58 | 4.9%(+2.90)#3,073 |
| 59. | 80455 | 7.8% | 5.2%(+2.61)#59 | 4.9%(+2.89)#3,081 |
| 60. | 80860 | 7.6% | 5.2%(+2.44)#60 | 4.9%(+2.71)#3,231 |
| 61. | 80610 | 7.4% | 5.2%(+2.23)#61 | 4.9%(+2.51)#3,434 |
| 62. | 80117 | 7.4% | 5.2%(+2.22)#62 | 4.9%(+2.49)#3,448 |
| 63. | 80923 | 7.4% | 5.2%(+2.21)#63 | 4.9%(+2.49)#3,456 |
| 64. | 80543 | 7.3% | 5.2%(+2.16)#64 | 4.9%(+2.43)#3,495 |
| 65. | 80130 | 7.3% | 5.2%(+2.16)#65 | 4.9%(+2.43)#3,498 |
| 66. | 80014 | 7.3% | 5.2%(+2.13)#66 | 4.9%(+2.41)#3,524 |
| 67. | 80303 | 7.3% | 5.2%(+2.08)#67 | 4.9%(+2.36)#3,568 |
| 68. | 80239 | 7.2% | 5.2%(+2.07)#68 | 4.9%(+2.34)#3,585 |
| 69. | 80290 | 7.2% | 5.2%(+2.07)#69 | 4.9%(+2.34)#3,590 |
| 70. | 80924 | 7.2% | 5.2%(+2.06)#70 | 4.9%(+2.33)#3,597 |
| 71. | 80454 | 7.2% | 5.2%(+2.06)#71 | 4.9%(+2.33)#3,601 |
| 72. | 80027 | 7.2% | 5.2%(+2.05)#72 | 4.9%(+2.32)#3,612 |
| 73. | 80241 | 7.2% | 5.2%(+2.04)#73 | 4.9%(+2.32)#3,617 |
| 74. | 81137 | 7.2% | 5.2%(+2.04)#74 | 4.9%(+2.31)#3,622 |
| 75. | 80540 | 7.2% | 5.2%(+2.03)#75 | 4.9%(+2.30)#3,629 |
| 76. | 80528 | 7.2% | 5.2%(+2.02)#76 | 4.9%(+2.29)#3,637 |
| 77. | 80816 | 7.2% | 5.2%(+1.99)#77 | 4.9%(+2.26)#3,672 |
| 78. | 80021 | 7.1% | 5.2%(+1.93)#78 | 4.9%(+2.21)#3,724 |
| 79. | 80111 | 7.1% | 5.2%(+1.90)#79 | 4.9%(+2.18)#3,750 |
| 80. | 80031 | 7.1% | 5.2%(+1.89)#80 | 4.9%(+2.16)#3,767 |
| 81. | 81007 | 7.0% | 5.2%(+1.88)#81 | 4.9%(+2.15)#3,772 |
| 82. | 80920 | 7.0% | 5.2%(+1.86)#82 | 4.9%(+2.13)#3,792 |
| 83. | 80498 | 7.0% | 5.2%(+1.84)#83 | 4.9%(+2.11)#3,822 |
| 84. | 80909 | 7.0% | 5.2%(+1.84)#84 | 4.9%(+2.11)#3,823 |
| 85. | 80237 | 7.0% | 5.2%(+1.79)#85 | 4.9%(+2.07)#3,880 |
| 86. | 81303 | 6.9% | 5.2%(+1.78)#86 | 4.9%(+2.05)#3,895 |
| 87. | 81430 | 6.9% | 5.2%(+1.75)#87 | 4.9%(+2.02)#3,930 |
| 88. | 80016 | 6.9% | 5.2%(+1.73)#88 | 4.9%(+2.00)#3,947 |
| 89. | 80302 | 6.9% | 5.2%(+1.71)#89 | 4.9%(+1.98)#3,973 |
| 90. | 80124 | 6.9% | 5.2%(+1.70)#90 | 4.9%(+1.97)#3,979 |
| 91. | 81025 | 6.8% | 5.2%(+1.67)#91 | 4.9%(+1.94)#4,011 |
| 92. | 80829 | 6.8% | 5.2%(+1.66)#92 | 4.9%(+1.93)#4,031 |
| 93. | 81526 | 6.8% | 5.2%(+1.63)#93 | 4.9%(+1.90)#4,072 |
| 94. | 80109 | 6.8% | 5.2%(+1.62)#94 | 4.9%(+1.89)#4,091 |
| 95. | 80108 | 6.8% | 5.2%(+1.59)#95 | 4.9%(+1.86)#4,136 |
| 96. | 80542 | 6.7% | 5.2%(+1.58)#96 | 4.9%(+1.85)#4,141 |
| 97. | 80922 | 6.7% | 5.2%(+1.57)#97 | 4.9%(+1.85)#4,155 |
| 98. | 80921 | 6.7% | 5.2%(+1.54)#98 | 4.9%(+1.81)#4,198 |
| 99. | 80906 | 6.7% | 5.2%(+1.50)#99 | 4.9%(+1.77)#4,237 |
| 100. | 80110 | 6.6% | 5.2%(+1.46)#100 | 4.9%(+1.74)#4,297 |
Common Questions
What are the Top 10 Zip Codes with the Highest Percentage of Population with a Degree in Computers and Mathematics in Colorado?
Top 10 Zip Codes with the Highest Percentage of Population with a Degree in Computers and Mathematics in Colorado are:
What zip code has the Highest Percentage of Population with a Degree in Computers and Mathematics in Colorado?
81222 has the Highest Percentage of Population with a Degree in Computers and Mathematics in Colorado with 100.0%.
What is the Percentage of Population with a Degree in Computers and Mathematics in the State of Colorado?
Percentage of Population with a Degree in Computers and Mathematics in Colorado is 5.2%.
What is the Percentage of Population with a Degree in Computers and Mathematics in the United States?
Percentage of Population with a Degree in Computers and Mathematics in the United States is 4.9%.