Alpine, CO Map & Demographics
Alpine Map
Alpine Overview
$27,922
PER CAPITA INCOME
0.36
INEQUALITY / GINI INDEX
219
TOTAL POPULATION
127
MALE POPULATION
92
FEMALE POPULATION
138.04
MALES / 100 FEMALES
72.44
FEMALES / 100 MALES
58.3
MEDIAN AGE
2.4
AVG FAMILY SIZE
2.4
AVG HOUSEHOLD SIZE
59
LABOR FORCE [ PEOPLE ]
30.3%
PERCENT IN LABOR FORCE
Income in Alpine
Income Overview in Alpine
| Characteristic | Number | Measure |
| Per Capita Income | 219 | $27,922 |
| Median Family Income | 92 | $0 |
| Mean Family Income | 92 | $71,853 |
| Median Household Income | 92 | $0 |
| Mean Household Income | 92 | $71,853 |
| Income Deficit | 92 | $0 |
| Wage / Income Gap (%) | 219 | 0.00% |
| Wage / Income Gap ($) | 219 | 100.00¢ per $1 |
| Gini / Inequality Index | 219 | 0.36 |
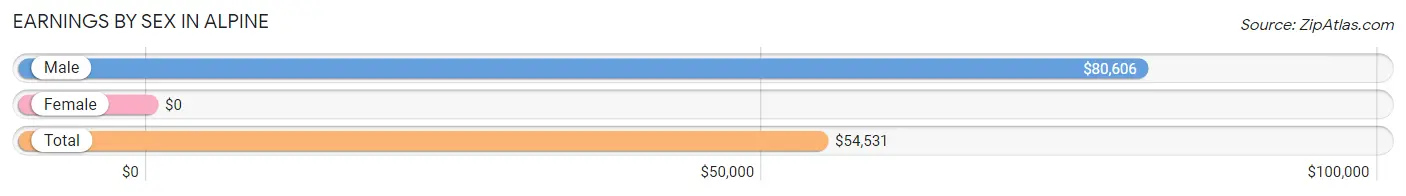
Earnings by Sex in Alpine
| Sex | Number | Average Earnings |
| Male | 50 (66.7%) | $80,606 |
| Female | 25 (33.3%) | $0 |
| Total | 75 (100.0%) | $54,531 |
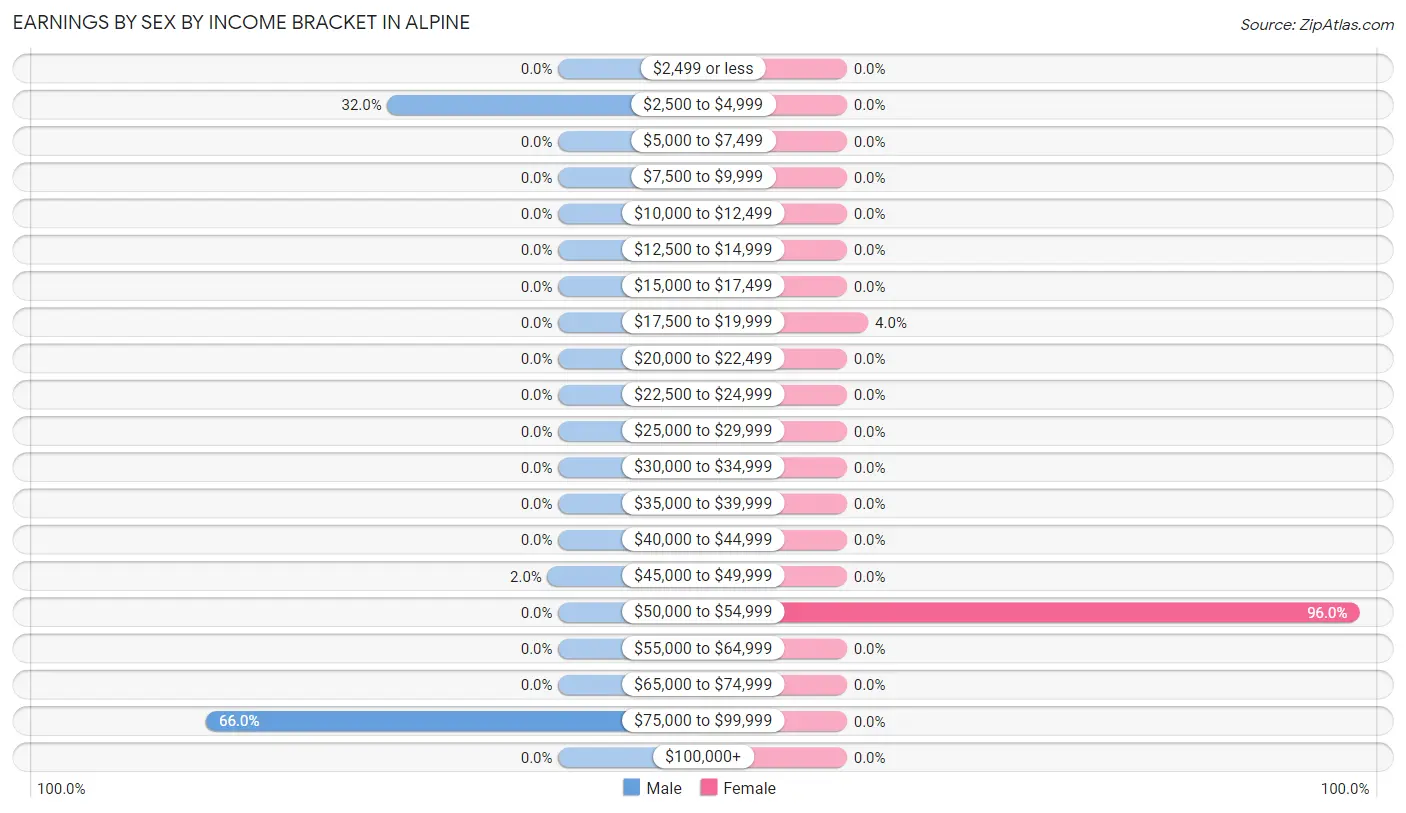
Earnings by Sex by Income Bracket in Alpine
The most common earnings brackets in Alpine are $75,000 to $99,999 for men (33 | 66.0%) and $50,000 to $54,999 for women (24 | 96.0%).
| Income | Male | Female |
| $2,499 or less | 0 (0.0%) | 0 (0.0%) |
| $2,500 to $4,999 | 16 (32.0%) | 0 (0.0%) |
| $5,000 to $7,499 | 0 (0.0%) | 0 (0.0%) |
| $7,500 to $9,999 | 0 (0.0%) | 0 (0.0%) |
| $10,000 to $12,499 | 0 (0.0%) | 0 (0.0%) |
| $12,500 to $14,999 | 0 (0.0%) | 0 (0.0%) |
| $15,000 to $17,499 | 0 (0.0%) | 0 (0.0%) |
| $17,500 to $19,999 | 0 (0.0%) | 1 (4.0%) |
| $20,000 to $22,499 | 0 (0.0%) | 0 (0.0%) |
| $22,500 to $24,999 | 0 (0.0%) | 0 (0.0%) |
| $25,000 to $29,999 | 0 (0.0%) | 0 (0.0%) |
| $30,000 to $34,999 | 0 (0.0%) | 0 (0.0%) |
| $35,000 to $39,999 | 0 (0.0%) | 0 (0.0%) |
| $40,000 to $44,999 | 0 (0.0%) | 0 (0.0%) |
| $45,000 to $49,999 | 1 (2.0%) | 0 (0.0%) |
| $50,000 to $54,999 | 0 (0.0%) | 24 (96.0%) |
| $55,000 to $64,999 | 0 (0.0%) | 0 (0.0%) |
| $65,000 to $74,999 | 0 (0.0%) | 0 (0.0%) |
| $75,000 to $99,999 | 33 (66.0%) | 0 (0.0%) |
| $100,000+ | 0 (0.0%) | 0 (0.0%) |
| Total | 50 (100.0%) | 25 (100.0%) |
Earnings by Sex by Educational Attainment in Alpine
| Educational Attainment | Male Income | Female Income |
| Less than High School | - | - |
| High School Diploma | - | - |
| College or Associate's Degree | - | - |
| Bachelor's Degree | - | - |
| Graduate Degree | - | - |
| Total | - | - |
Family Income in Alpine
Family Income Brackets in Alpine
According to the Alpine family income data, there are 47 families falling into the $25,000 to $34,999 income range, which is the most common income bracket and makes up 51.1% of all families.
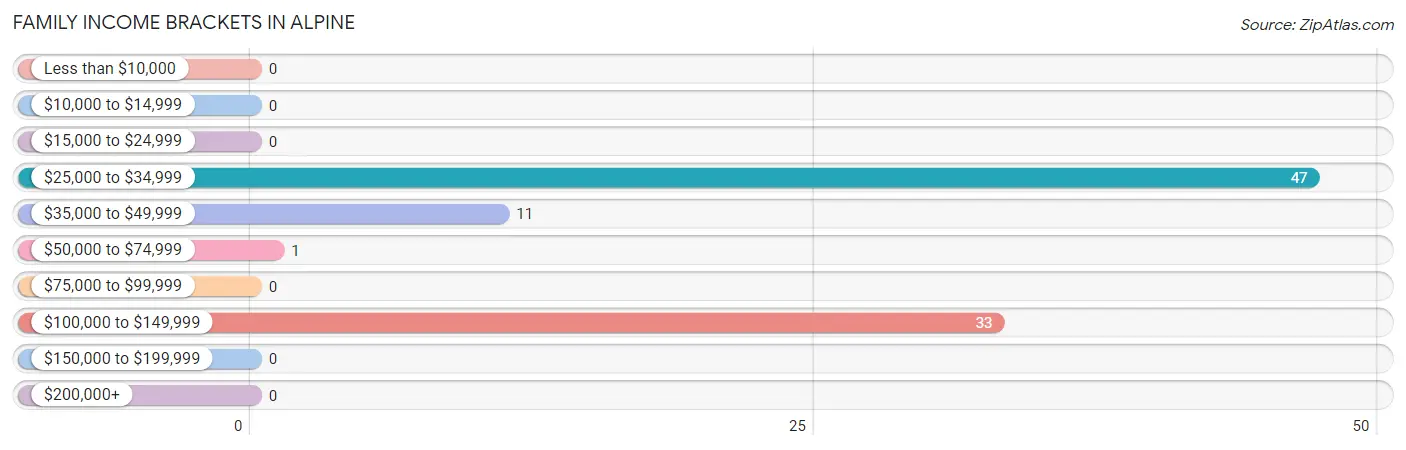
| Income Bracket | # Families | % Families |
| Less than $10,000 | 0 | 0.0% |
| $10,000 to $14,999 | 0 | 0.0% |
| $15,000 to $24,999 | 0 | 0.0% |
| $25,000 to $34,999 | 47 | 51.1% |
| $35,000 to $49,999 | 11 | 12.0% |
| $50,000 to $74,999 | 1 | 1.1% |
| $75,000 to $99,999 | 0 | 0.0% |
| $100,000 to $149,999 | 33 | 35.9% |
| $150,000 to $199,999 | 0 | 0.0% |
| $200,000+ | 0 | 0.0% |
Family Income by Famaliy Size in Alpine
2-person families (58 | 63.0%) account for the highest median family income in Alpine with $29,766 per family, while 2-person families (58 | 63.0%) have the highest median income of $14,883 per family member.
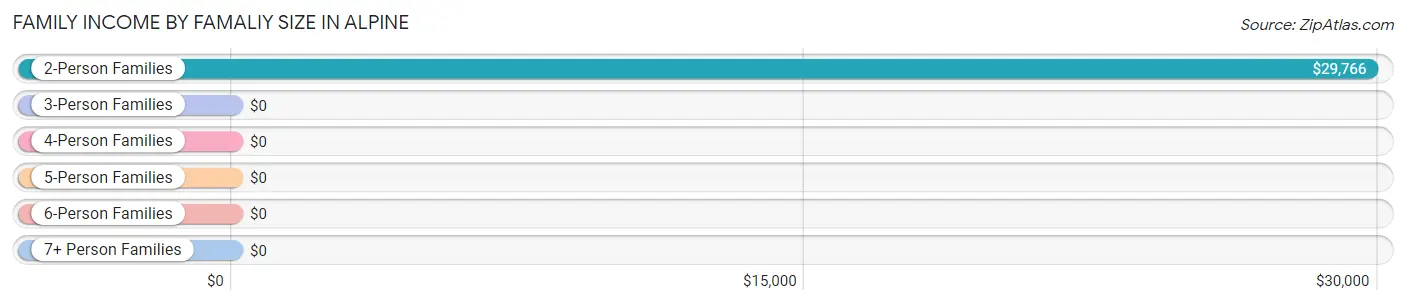
| Income Bracket | # Families | Median Income |
| 2-Person Families | 58 (63.0%) | $29,766 |
| 3-Person Families | 0 (0.0%) | $0 |
| 4-Person Families | 34 (37.0%) | $0 |
| 5-Person Families | 0 (0.0%) | $0 |
| 6-Person Families | 0 (0.0%) | $0 |
| 7+ Person Families | 0 (0.0%) | $0 |
| Total | 92 (100.0%) | $0 |
Family Income by Number of Earners in Alpine
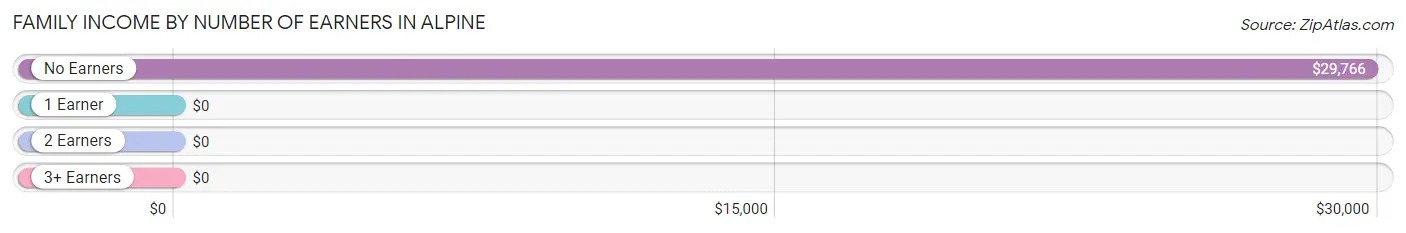
| Number of Earners | # Families | Median Income |
| No Earners | 58 (63.0%) | $29,766 |
| 1 Earner | 0 (0.0%) | $0 |
| 2 Earners | 1 (1.1%) | $0 |
| 3+ Earners | 33 (35.9%) | $0 |
| Total | 92 (100.0%) | $0 |
Household Income in Alpine
Household Income Brackets in Alpine
With 47 households falling in the category, the $25,000 to $34,999 income range is the most frequent in Alpine, accounting for 51.1% of all households.
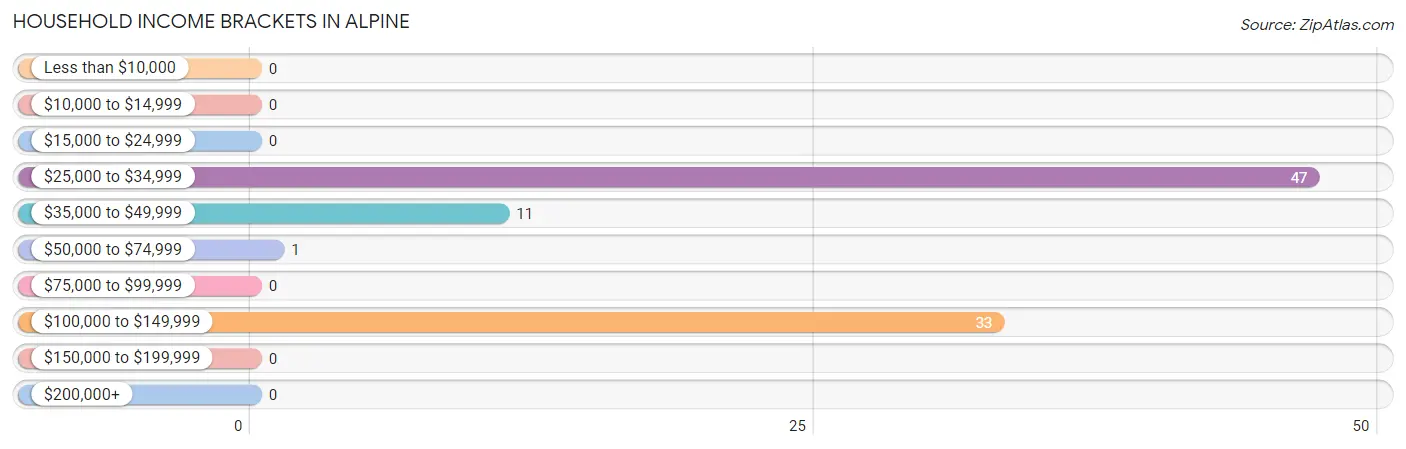
| Income Bracket | # Households | % Households |
| Less than $10,000 | 0 | 0.0% |
| $10,000 to $14,999 | 0 | 0.0% |
| $15,000 to $24,999 | 0 | 0.0% |
| $25,000 to $34,999 | 47 | 51.1% |
| $35,000 to $49,999 | 11 | 12.0% |
| $50,000 to $74,999 | 1 | 1.1% |
| $75,000 to $99,999 | 0 | 0.0% |
| $100,000 to $149,999 | 33 | 35.9% |
| $150,000 to $199,999 | 0 | 0.0% |
| $200,000+ | 0 | 0.0% |
Household Income by Householder Age in Alpine
| Income Bracket | # Households | Median Income |
| 15 to 24 Years | 0 (0.0%) | $0 |
| 25 to 44 Years | 0 (0.0%) | $0 |
| 45 to 64 Years | 66 (71.7%) | $0 |
| 65+ Years | 26 (28.3%) | $0 |
| Total | 92 (100.0%) | $0 |
Poverty in Alpine
Income Below Poverty by Sex and Age in Alpine
| Age Bracket | Male | Female |
| Under 5 Years | 0 (0.0%) | 0 (0.0%) |
| 5 Years | 0 (0.0%) | 0 (0.0%) |
| 6 to 11 Years | 0 (0.0%) | 0 (0.0%) |
| 12 to 14 Years | 0 (0.0%) | 0 (0.0%) |
| 15 Years | 0 (0.0%) | 0 (0.0%) |
| 16 and 17 Years | 0 (0.0%) | 0 (0.0%) |
| 18 to 24 Years | 0 (0.0%) | 0 (0.0%) |
| 25 to 34 Years | 0 (0.0%) | 0 (0.0%) |
| 35 to 44 Years | 0 (0.0%) | 0 (0.0%) |
| 45 to 54 Years | 0 (0.0%) | 0 (0.0%) |
| 55 to 64 Years | 0 (0.0%) | 0 (0.0%) |
| 65 to 74 Years | 0 (0.0%) | 0 (0.0%) |
| 75 Years and over | 0 (0.0%) | 0 (0.0%) |
| Total | 0 (0.0%) | 0 (0.0%) |
Income Above Poverty by Sex and Age in Alpine
According to the poverty statistics in Alpine, males aged 12 to 14 years and females aged 6 to 11 years are the age groups that are most secure financially, with 100.0% of males and 100.0% of females in these age groups living above the poverty line.
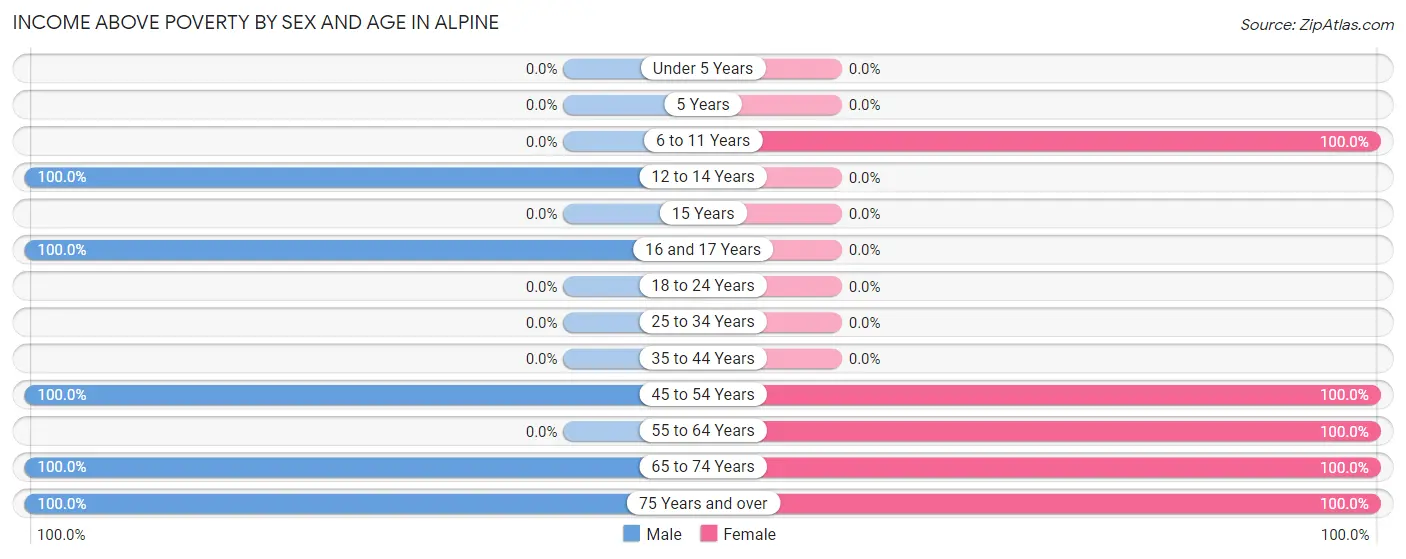
| Age Bracket | Male | Female |
| Under 5 Years | 0 (0.0%) | 0 (0.0%) |
| 5 Years | 0 (0.0%) | 0 (0.0%) |
| 6 to 11 Years | 0 (0.0%) | 1 (100.0%) |
| 12 to 14 Years | 23 (100.0%) | 0 (0.0%) |
| 15 Years | 0 (0.0%) | 0 (0.0%) |
| 16 and 17 Years | 16 (100.0%) | 0 (0.0%) |
| 18 to 24 Years | 0 (0.0%) | 0 (0.0%) |
| 25 to 34 Years | 0 (0.0%) | 0 (0.0%) |
| 35 to 44 Years | 0 (0.0%) | 0 (0.0%) |
| 45 to 54 Years | 34 (100.0%) | 25 (100.0%) |
| 55 to 64 Years | 0 (0.0%) | 32 (100.0%) |
| 65 to 74 Years | 43 (100.0%) | 19 (100.0%) |
| 75 Years and over | 11 (100.0%) | 15 (100.0%) |
| Total | 127 (100.0%) | 92 (100.0%) |
Income Below Poverty Among Married-Couple Families in Alpine
| Children | Above Poverty | Below Poverty |
| No Children | 58 (100.0%) | 0 (0.0%) |
| 1 or 2 Children | 34 (100.0%) | 0 (0.0%) |
| 3 or 4 Children | 0 (0.0%) | 0 (0.0%) |
| 5 or more Children | 0 (0.0%) | 0 (0.0%) |
| Total | 92 (100.0%) | 0 (0.0%) |
Income Below Poverty Among Single-Parent Households in Alpine
| Children | Single Father | Single Mother |
| No Children | 0 (0.0%) | 0 (0.0%) |
| 1 or 2 Children | 0 (0.0%) | 0 (0.0%) |
| 3 or 4 Children | 0 (0.0%) | 0 (0.0%) |
| 5 or more Children | 0 (0.0%) | 0 (0.0%) |
| Total | 0 (0.0%) | 0 (0.0%) |
Income Below Poverty Among Married-Couple vs Single-Parent Households in Alpine
| Children | Married-Couple Families | Single-Parent Households |
| No Children | 0 (0.0%) | 0 (0.0%) |
| 1 or 2 Children | 0 (0.0%) | 0 (0.0%) |
| 3 or 4 Children | 0 (0.0%) | 0 (0.0%) |
| 5 or more Children | 0 (0.0%) | 0 (0.0%) |
| Total | 0 (0.0%) | 0 (0.0%) |
Race in Alpine
The most populous races in Alpine are White / Caucasian (216 | 98.6%), Hispanic or Latino (3 | 1.4%), and Two or more Races (3 | 1.4%).
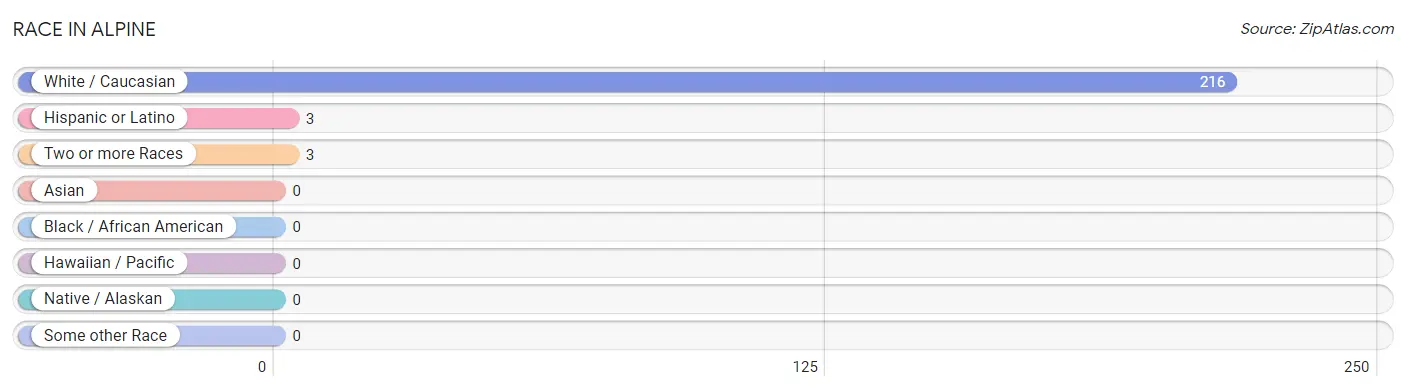
| Race | # Population | % Population |
| Asian | 0 | 0.0% |
| Black / African American | 0 | 0.0% |
| Hawaiian / Pacific | 0 | 0.0% |
| Hispanic or Latino | 3 | 1.4% |
| Native / Alaskan | 0 | 0.0% |
| White / Caucasian | 216 | 98.6% |
| Two or more Races | 3 | 1.4% |
| Some other Race | 0 | 0.0% |
| Total | 219 | 100.0% |
Ancestry in Alpine
The most populous ancestries reported in Alpine are German (86 | 39.3%), Scottish (71 | 32.4%), English (24 | 11.0%), Mexican (3 | 1.4%), and Irish (1 | 0.5%), together accounting for 84.5% of all Alpine residents.
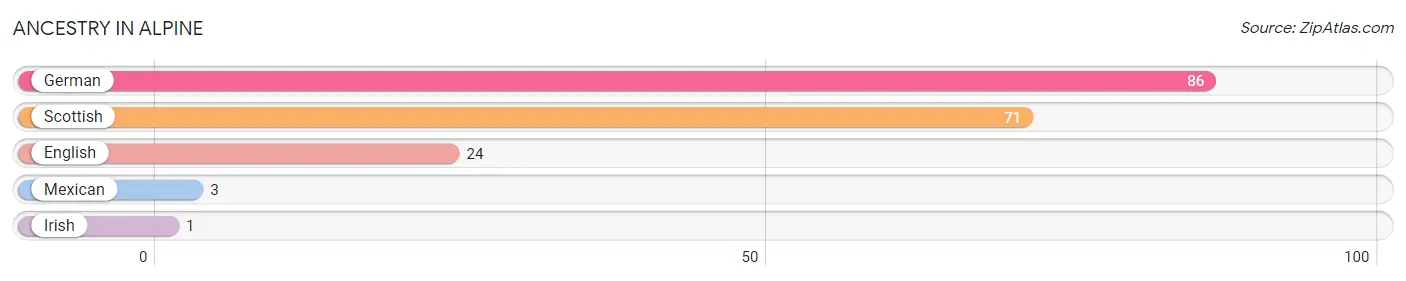
| Ancestry | # Population | % Population |
| English | 24 | 11.0% |
| German | 86 | 39.3% |
| Irish | 1 | 0.5% |
| Mexican | 3 | 1.4% |
| Scottish | 71 | 32.4% | View All 5 Rows |
Immigrants in Alpine

| Immigration Origin | # Population | % Population | View All 0 Rows |
Sex and Age in Alpine
Sex and Age in Alpine
The most populous age groups in Alpine are 70 to 74 Years (43 | 33.9%) for men and 55 to 59 Years (32 | 34.8%) for women.

| Age Bracket | Male | Female |
| Under 5 Years | 0 (0.0%) | 0 (0.0%) |
| 5 to 9 Years | 0 (0.0%) | 1 (1.1%) |
| 10 to 14 Years | 23 (18.1%) | 0 (0.0%) |
| 15 to 19 Years | 16 (12.6%) | 0 (0.0%) |
| 20 to 24 Years | 0 (0.0%) | 0 (0.0%) |
| 25 to 29 Years | 0 (0.0%) | 0 (0.0%) |
| 30 to 34 Years | 0 (0.0%) | 0 (0.0%) |
| 35 to 39 Years | 0 (0.0%) | 0 (0.0%) |
| 40 to 44 Years | 0 (0.0%) | 0 (0.0%) |
| 45 to 49 Years | 34 (26.8%) | 25 (27.2%) |
| 50 to 54 Years | 0 (0.0%) | 0 (0.0%) |
| 55 to 59 Years | 0 (0.0%) | 32 (34.8%) |
| 60 to 64 Years | 0 (0.0%) | 0 (0.0%) |
| 65 to 69 Years | 0 (0.0%) | 0 (0.0%) |
| 70 to 74 Years | 43 (33.9%) | 19 (20.6%) |
| 75 to 79 Years | 0 (0.0%) | 15 (16.3%) |
| 80 to 84 Years | 11 (8.7%) | 0 (0.0%) |
| 85 Years and over | 0 (0.0%) | 0 (0.0%) |
| Total | 127 (100.0%) | 92 (100.0%) |
Families and Households in Alpine
Median Family Size in Alpine
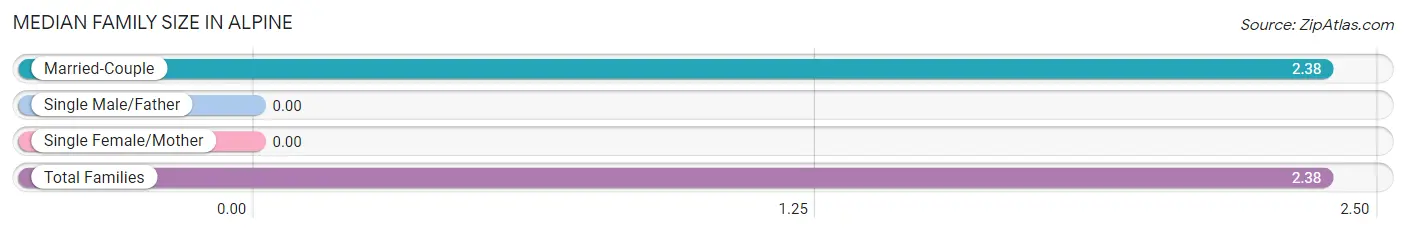
| Family Type | # Families | Family Size |
| Married-Couple | 92 (100.0%) | 2.38 |
| Single Male/Father | 0 (0.0%) | - |
| Single Female/Mother | 0 (0.0%) | - |
| Total Families | 92 (100.0%) | 2.38 |
Median Household Size in Alpine
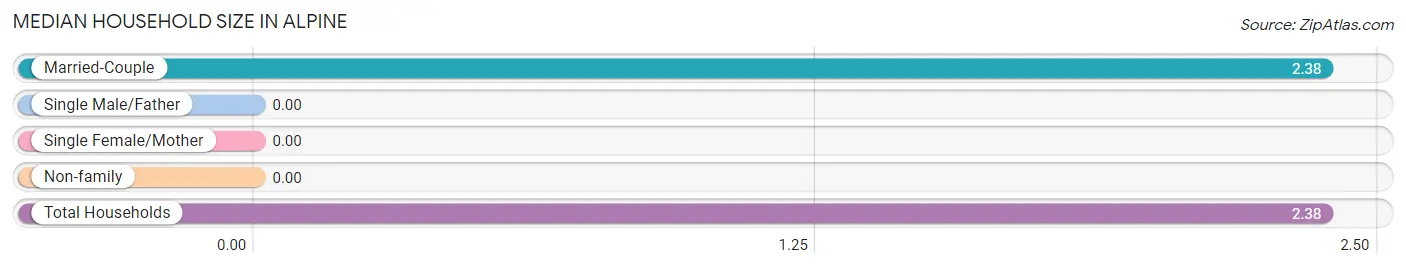
| Household Type | # Households | Household Size |
| Married-Couple | 92 (100.0%) | 2.38 |
| Single Male/Father | 0 (0.0%) | - |
| Single Female/Mother | 0 (0.0%) | - |
| Non-family | 0 (0.0%) | - |
| Total Households | 92 (100.0%) | 2.38 |
Household Size by Marriage Status in Alpine
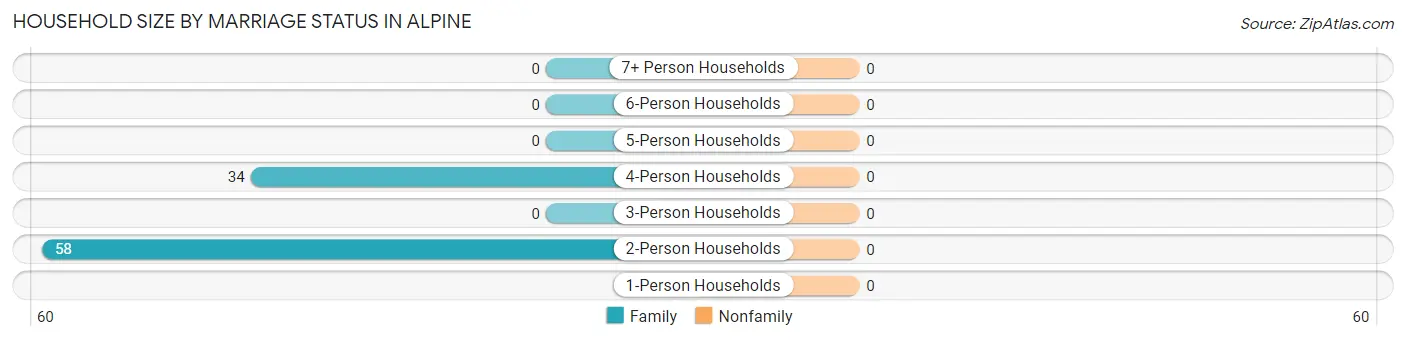
| Household Size | Family Households | Nonfamily Households |
| 1-Person Households | - | 0 (0.0%) |
| 2-Person Households | 58 (63.0%) | 0 (0.0%) |
| 3-Person Households | 0 (0.0%) | 0 (0.0%) |
| 4-Person Households | 34 (37.0%) | 0 (0.0%) |
| 5-Person Households | 0 (0.0%) | 0 (0.0%) |
| 6-Person Households | 0 (0.0%) | 0 (0.0%) |
| 7+ Person Households | 0 (0.0%) | 0 (0.0%) |
| Total | 92 (100.0%) | 0 (0.0%) |
Female Fertility in Alpine
Fertility by Age in Alpine
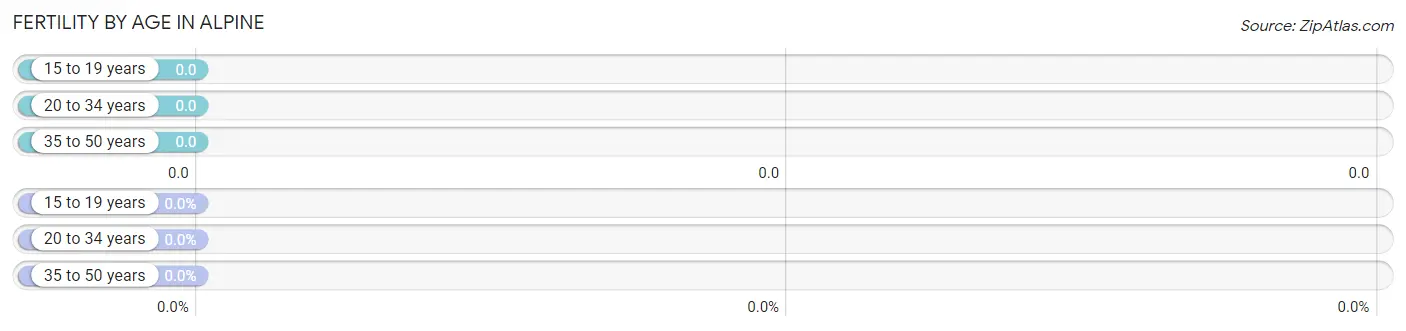
| Age Bracket | Women with Births | Births / 1,000 Women |
| 15 to 19 years | 0 (0.0%) | 0.0 |
| 20 to 34 years | 0 (0.0%) | 0.0 |
| 35 to 50 years | 0 (0.0%) | 0.0 |
| Total | 0 (0.0%) | 0.0 |
Fertility by Age by Marriage Status in Alpine
| Age Bracket | Married | Unmarried |
| 15 to 19 years | 0 (0.0%) | 0 (0.0%) |
| 20 to 34 years | 0 (0.0%) | 0 (0.0%) |
| 35 to 50 years | 0 (0.0%) | 0 (0.0%) |
| Total | 0 (0.0%) | 0 (0.0%) |
Fertility by Education in Alpine
| Educational Attainment | Women with Births | Births / 1,000 Women |
| Less than High School | 0 (0.0%) | 0.0 |
| High School Diploma | 0 (0.0%) | 0.0 |
| College or Associate's Degree | 0 (0.0%) | 0.0 |
| Bachelor's Degree | 0 (0.0%) | 0.0 |
| Graduate Degree | 0 (0.0%) | 0.0 |
| Total | 0 (0.0%) | 0.0 |
Fertility by Education by Marriage Status in Alpine
| Educational Attainment | Married | Unmarried |
| Less than High School | 0 (0.0%) | 0 (0.0%) |
| High School Diploma | 0 (0.0%) | 0 (0.0%) |
| College or Associate's Degree | 0 (0.0%) | 0 (0.0%) |
| Bachelor's Degree | 0 (0.0%) | 0 (0.0%) |
| Graduate Degree | 0 (0.0%) | 0 (0.0%) |
| Total | 0 (0.0%) | 0 (0.0%) |
Employment Characteristics in Alpine
Employment by Class of Employer in Alpine
Among the 59 employed individuals in Alpine, local government employees (57 | 96.6%), private company employees (1 | 1.7%), and not-for-profit organizations (1 | 1.7%) make up the most common classes of employment.
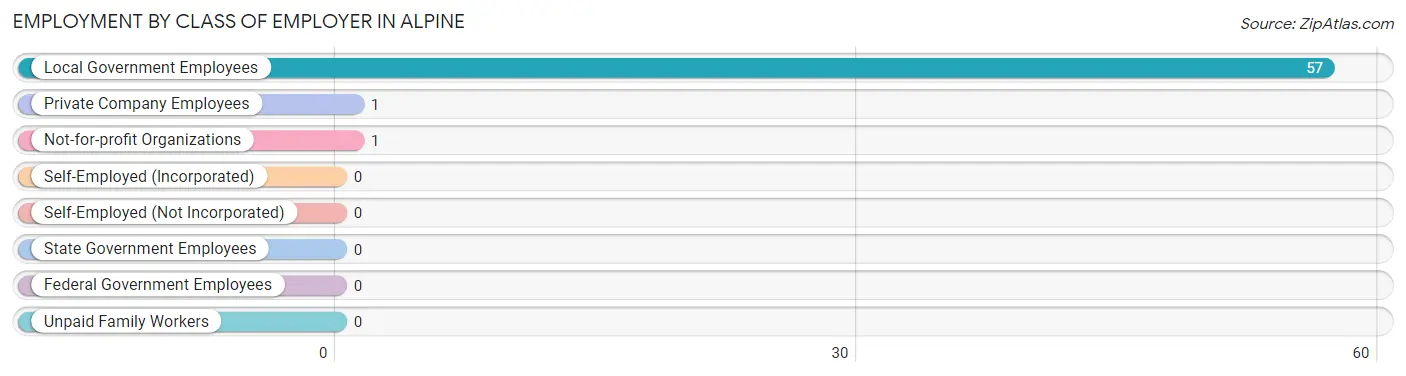
| Employer Class | # Employees | % Employees |
| Private Company Employees | 1 | 1.7% |
| Self-Employed (Incorporated) | 0 | 0.0% |
| Self-Employed (Not Incorporated) | 0 | 0.0% |
| Not-for-profit Organizations | 1 | 1.7% |
| Local Government Employees | 57 | 96.6% |
| State Government Employees | 0 | 0.0% |
| Federal Government Employees | 0 | 0.0% |
| Unpaid Family Workers | 0 | 0.0% |
| Total | 59 | 100.0% |
Employment Status by Age in Alpine
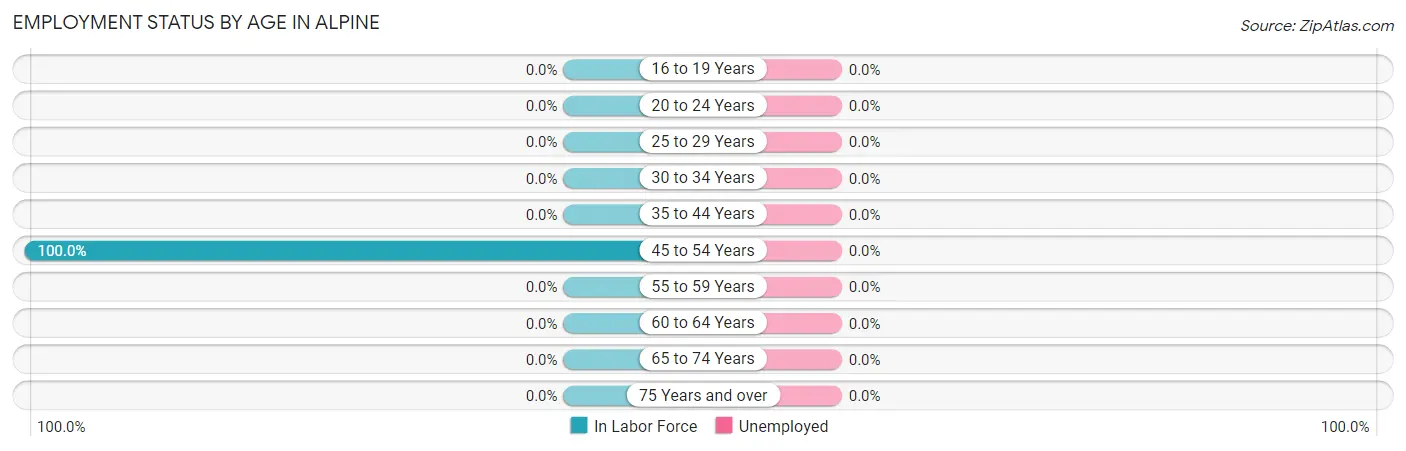
| Age Bracket | In Labor Force | Unemployed |
| 16 to 19 Years | 0 (0.0%) | 0 (0.0%) |
| 20 to 24 Years | 0 (0.0%) | 0 (0.0%) |
| 25 to 29 Years | 0 (0.0%) | 0 (0.0%) |
| 30 to 34 Years | 0 (0.0%) | 0 (0.0%) |
| 35 to 44 Years | 0 (0.0%) | 0 (0.0%) |
| 45 to 54 Years | 59 (100.0%) | 0 (0.0%) |
| 55 to 59 Years | 0 (0.0%) | 0 (0.0%) |
| 60 to 64 Years | 0 (0.0%) | 0 (0.0%) |
| 65 to 74 Years | 0 (0.0%) | 0 (0.0%) |
| 75 Years and over | 0 (0.0%) | 0 (0.0%) |
| Total | 59 (30.3%) | 0 (0.0%) |
Employment Status by Educational Attainment in Alpine
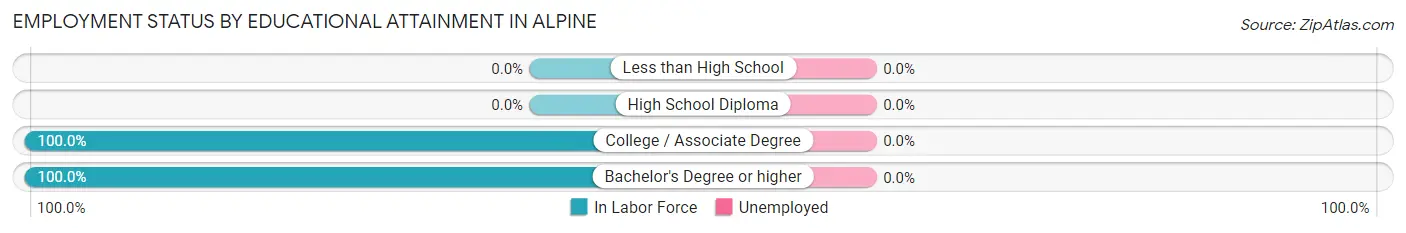
| Educational Attainment | In Labor Force | Unemployed |
| Less than High School | 0 (0.0%) | 0 (0.0%) |
| High School Diploma | 0 (0.0%) | 0 (0.0%) |
| College / Associate Degree | 1 (100.0%) | 0 (0.0%) |
| Bachelor's Degree or higher | 58 (100.0%) | 0 (0.0%) |
| Total | 59 (64.8%) | 0 (0.0%) |
Employment Occupations by Sex in Alpine
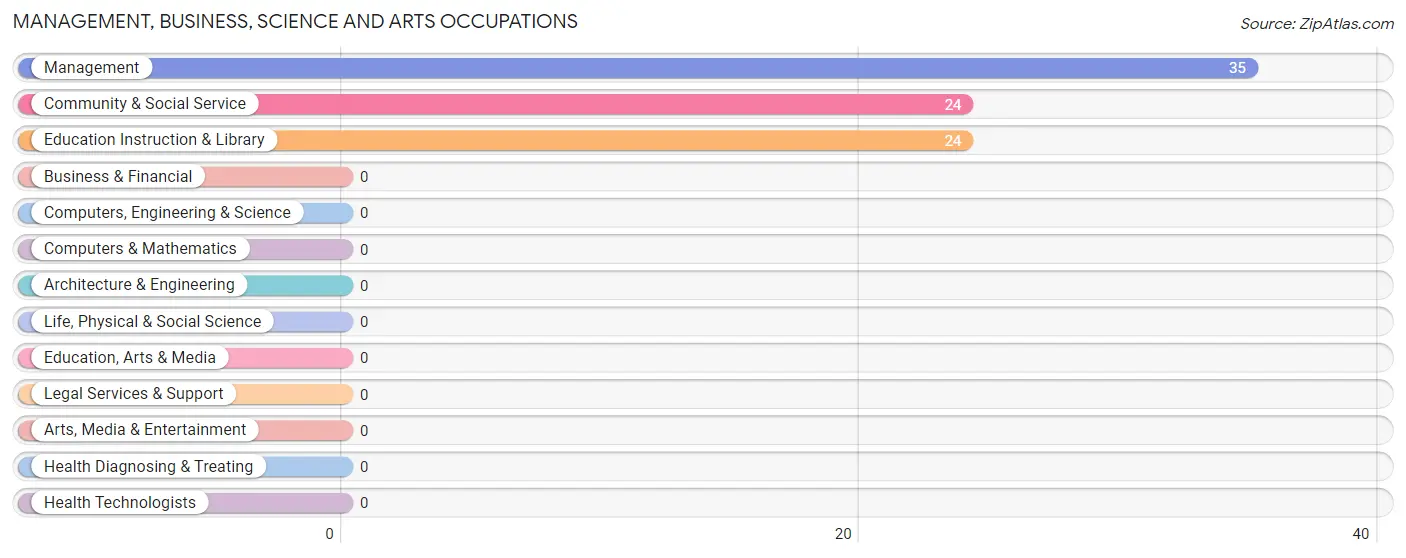
Management, Business, Science and Arts Occupations
The most common Management, Business, Science and Arts occupations in Alpine are Management (35 | 59.3%), Community & Social Service (24 | 40.7%), and Education Instruction & Library (24 | 40.7%).
Management, Business, Science and Arts Occupations by Sex
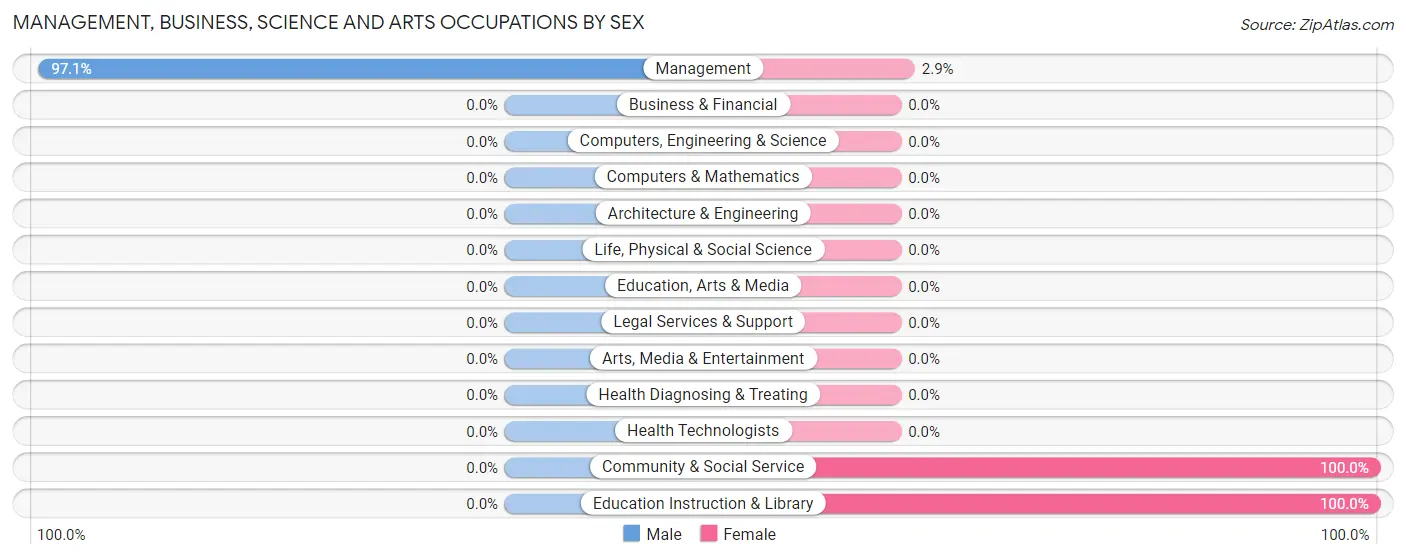
| Occupation | Male | Female |
| Management | 34 (97.1%) | 1 (2.9%) |
| Business & Financial | 0 (0.0%) | 0 (0.0%) |
| Computers, Engineering & Science | 0 (0.0%) | 0 (0.0%) |
| Computers & Mathematics | 0 (0.0%) | 0 (0.0%) |
| Architecture & Engineering | 0 (0.0%) | 0 (0.0%) |
| Life, Physical & Social Science | 0 (0.0%) | 0 (0.0%) |
| Community & Social Service | 0 (0.0%) | 24 (100.0%) |
| Education, Arts & Media | 0 (0.0%) | 0 (0.0%) |
| Legal Services & Support | 0 (0.0%) | 0 (0.0%) |
| Education Instruction & Library | 0 (0.0%) | 24 (100.0%) |
| Arts, Media & Entertainment | 0 (0.0%) | 0 (0.0%) |
| Health Diagnosing & Treating | 0 (0.0%) | 0 (0.0%) |
| Health Technologists | 0 (0.0%) | 0 (0.0%) |
| Total (Category) | 34 (57.6%) | 25 (42.4%) |
| Total (Overall) | 34 (57.6%) | 25 (42.4%) |
Services Occupations
Services Occupations by Sex
| Occupation | Male | Female |
| Healthcare Support | 0 (0.0%) | 0 (0.0%) |
| Security & Protection | 0 (0.0%) | 0 (0.0%) |
| Firefighting & Prevention | 0 (0.0%) | 0 (0.0%) |
| Law Enforcement | 0 (0.0%) | 0 (0.0%) |
| Food Preparation & Serving | 0 (0.0%) | 0 (0.0%) |
| Cleaning & Maintenance | 0 (0.0%) | 0 (0.0%) |
| Personal Care & Service | 0 (0.0%) | 0 (0.0%) |
| Total (Category) | 0 (0.0%) | 0 (0.0%) |
| Total (Overall) | 34 (57.6%) | 25 (42.4%) |
Sales and Office Occupations
Sales and Office Occupations by Sex
| Occupation | Male | Female |
| Sales & Related | 0 (0.0%) | 0 (0.0%) |
| Office & Administration | 0 (0.0%) | 0 (0.0%) |
| Total (Category) | 0 (0.0%) | 0 (0.0%) |
| Total (Overall) | 34 (57.6%) | 25 (42.4%) |
Natural Resources, Construction and Maintenance Occupations
Natural Resources, Construction and Maintenance Occupations by Sex
| Occupation | Male | Female |
| Farming, Fishing & Forestry | 0 (0.0%) | 0 (0.0%) |
| Construction & Extraction | 0 (0.0%) | 0 (0.0%) |
| Installation, Maintenance & Repair | 0 (0.0%) | 0 (0.0%) |
| Total (Category) | 0 (0.0%) | 0 (0.0%) |
| Total (Overall) | 34 (57.6%) | 25 (42.4%) |
Production, Transportation and Moving Occupations
Production, Transportation and Moving Occupations by Sex
| Occupation | Male | Female |
| Production | 0 (0.0%) | 0 (0.0%) |
| Transportation | 0 (0.0%) | 0 (0.0%) |
| Material Moving | 0 (0.0%) | 0 (0.0%) |
| Total (Category) | 0 (0.0%) | 0 (0.0%) |
| Total (Overall) | 34 (57.6%) | 25 (42.4%) |
Employment Industries by Sex in Alpine
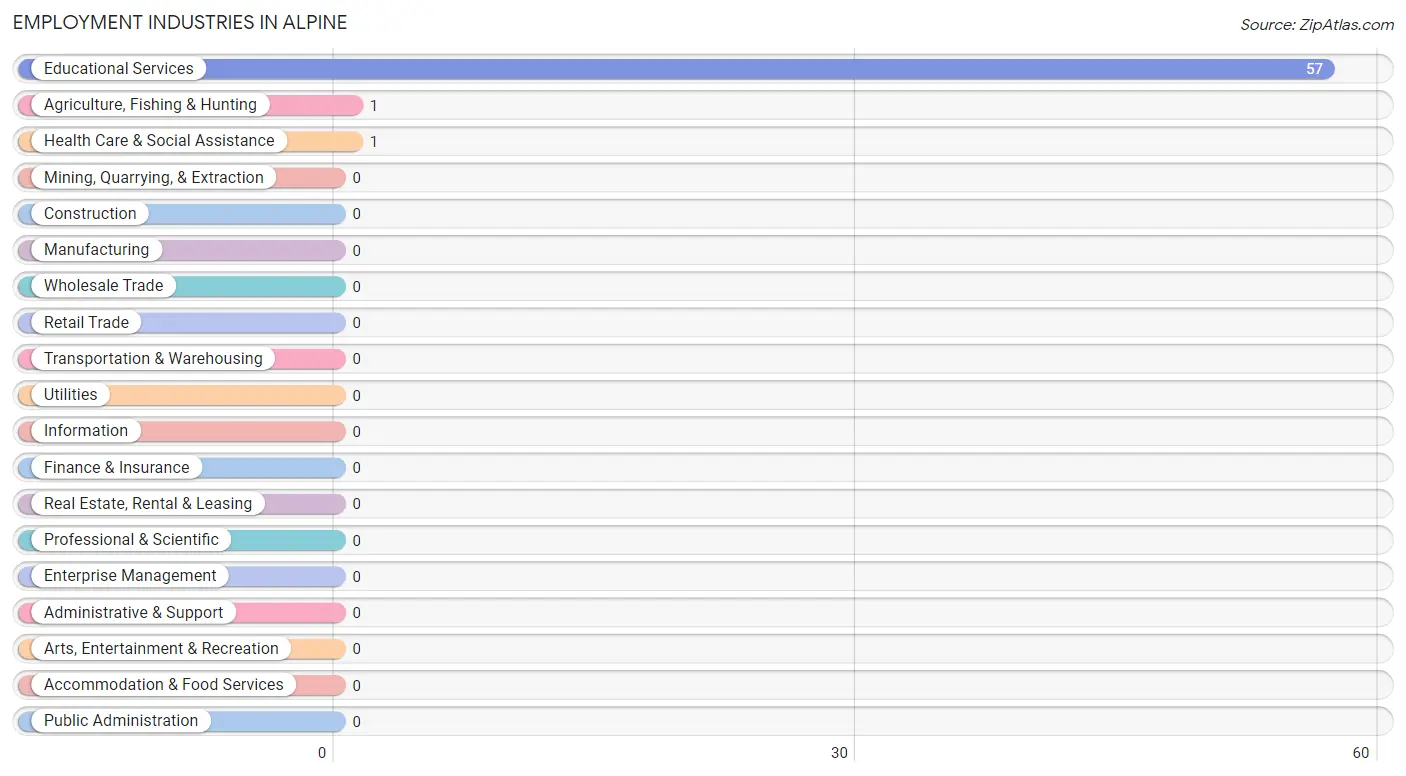
Employment Industries in Alpine
The major employment industries in Alpine include Educational Services (57 | 96.6%), Agriculture, Fishing & Hunting (1 | 1.7%), and Health Care & Social Assistance (1 | 1.7%).
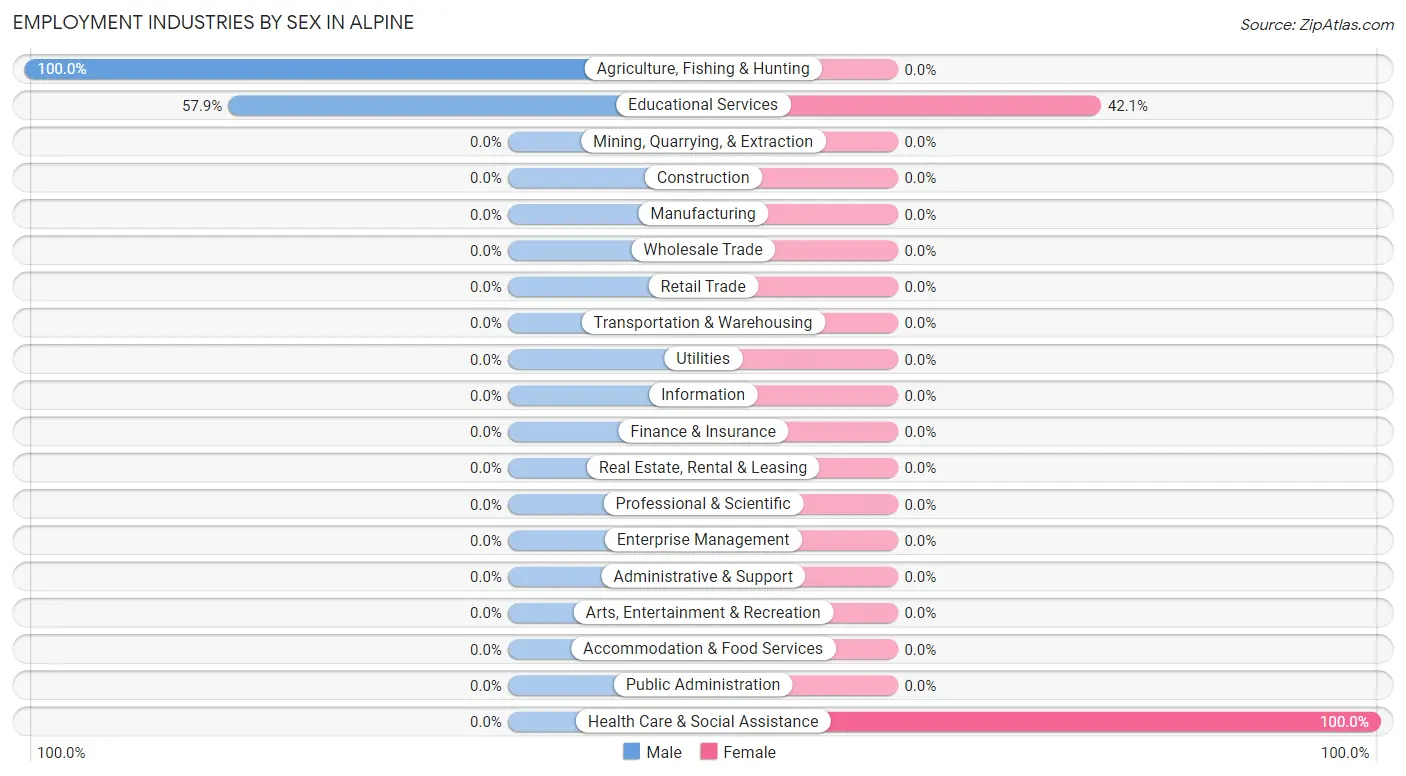
Employment Industries by Sex in Alpine
The Alpine industries that see more men than women are Agriculture, Fishing & Hunting (100.0%), and Educational Services (57.9%), whereas the industries that tend to have a higher number of women are Health Care & Social Assistance (100.0%), and Educational Services (42.1%).
| Industry | Male | Female |
| Agriculture, Fishing & Hunting | 1 (100.0%) | 0 (0.0%) |
| Mining, Quarrying, & Extraction | 0 (0.0%) | 0 (0.0%) |
| Construction | 0 (0.0%) | 0 (0.0%) |
| Manufacturing | 0 (0.0%) | 0 (0.0%) |
| Wholesale Trade | 0 (0.0%) | 0 (0.0%) |
| Retail Trade | 0 (0.0%) | 0 (0.0%) |
| Transportation & Warehousing | 0 (0.0%) | 0 (0.0%) |
| Utilities | 0 (0.0%) | 0 (0.0%) |
| Information | 0 (0.0%) | 0 (0.0%) |
| Finance & Insurance | 0 (0.0%) | 0 (0.0%) |
| Real Estate, Rental & Leasing | 0 (0.0%) | 0 (0.0%) |
| Professional & Scientific | 0 (0.0%) | 0 (0.0%) |
| Enterprise Management | 0 (0.0%) | 0 (0.0%) |
| Administrative & Support | 0 (0.0%) | 0 (0.0%) |
| Educational Services | 33 (57.9%) | 24 (42.1%) |
| Health Care & Social Assistance | 0 (0.0%) | 1 (100.0%) |
| Arts, Entertainment & Recreation | 0 (0.0%) | 0 (0.0%) |
| Accommodation & Food Services | 0 (0.0%) | 0 (0.0%) |
| Public Administration | 0 (0.0%) | 0 (0.0%) |
| Total | 34 (57.6%) | 25 (42.4%) |
Education in Alpine
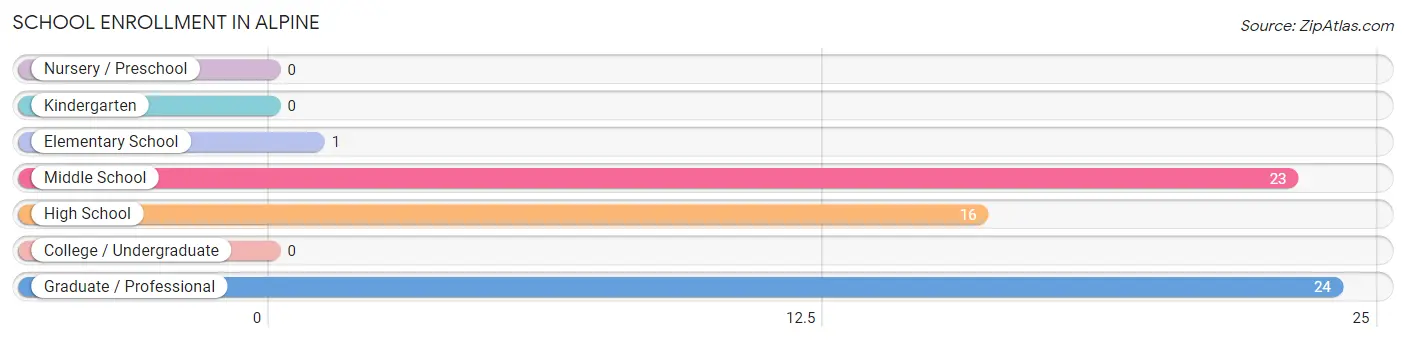
School Enrollment in Alpine
The most common levels of schooling among the 64 students in Alpine are graduate / professional (24 | 37.5%), middle school (23 | 35.9%), and high school (16 | 25.0%).
| School Level | # Students | % Students |
| Nursery / Preschool | 0 | 0.0% |
| Kindergarten | 0 | 0.0% |
| Elementary School | 1 | 1.6% |
| Middle School | 23 | 35.9% |
| High School | 16 | 25.0% |
| College / Undergraduate | 0 | 0.0% |
| Graduate / Professional | 24 | 37.5% |
| Total | 64 | 100.0% |
School Enrollment by Age by Funding Source in Alpine
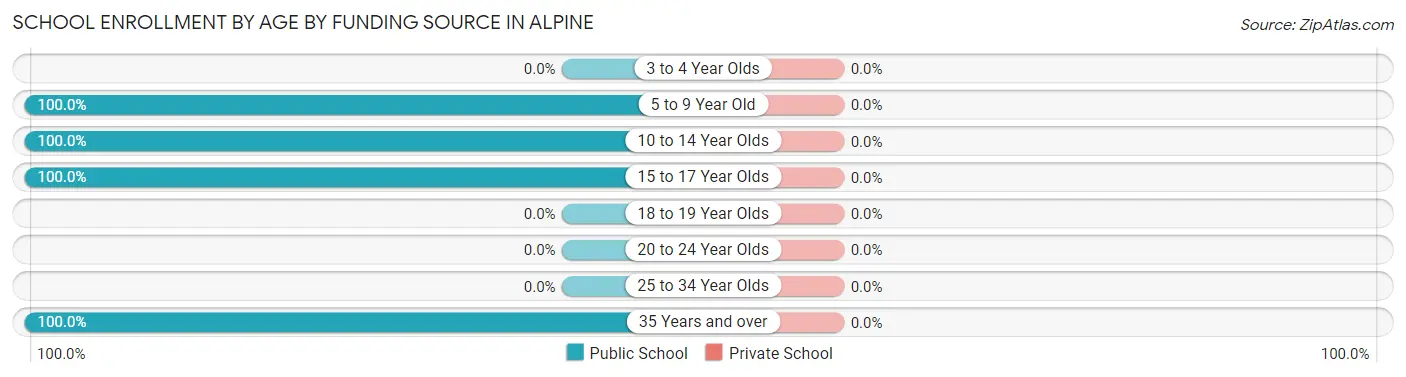
| Age Bracket | Public School | Private School |
| 3 to 4 Year Olds | 0 (0.0%) | 0 (0.0%) |
| 5 to 9 Year Old | 1 (100.0%) | 0 (0.0%) |
| 10 to 14 Year Olds | 23 (100.0%) | 0 (0.0%) |
| 15 to 17 Year Olds | 16 (100.0%) | 0 (0.0%) |
| 18 to 19 Year Olds | 0 (0.0%) | 0 (0.0%) |
| 20 to 24 Year Olds | 0 (0.0%) | 0 (0.0%) |
| 25 to 34 Year Olds | 0 (0.0%) | 0 (0.0%) |
| 35 Years and over | 24 (100.0%) | 0 (0.0%) |
| Total | 64 (100.0%) | 0 (0.0%) |
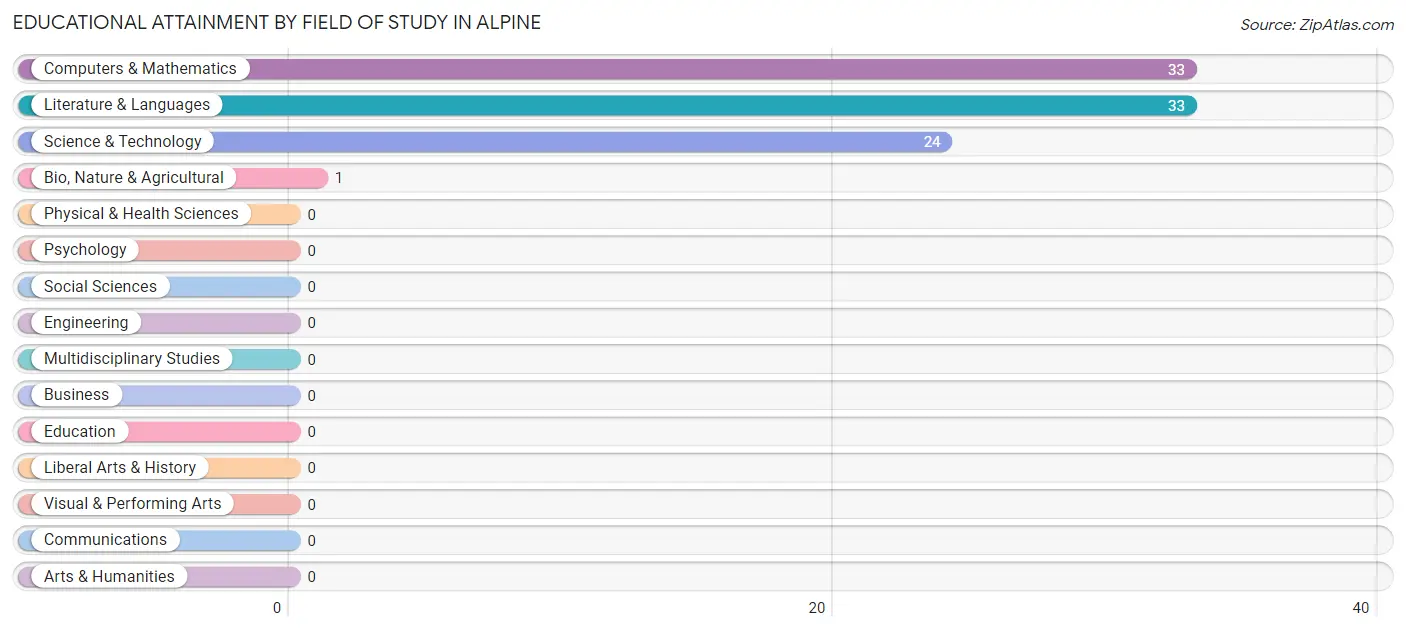
Educational Attainment by Field of Study in Alpine
Computers & mathematics (33 | 36.3%), literature & languages (33 | 36.3%), science & technology (24 | 26.4%), and bio, nature & agricultural (1 | 1.1%) are the most common fields of study among 91 individuals in Alpine who have obtained a bachelor's degree or higher.
| Field of Study | # Graduates | % Graduates |
| Computers & Mathematics | 33 | 36.3% |
| Bio, Nature & Agricultural | 1 | 1.1% |
| Physical & Health Sciences | 0 | 0.0% |
| Psychology | 0 | 0.0% |
| Social Sciences | 0 | 0.0% |
| Engineering | 0 | 0.0% |
| Multidisciplinary Studies | 0 | 0.0% |
| Science & Technology | 24 | 26.4% |
| Business | 0 | 0.0% |
| Education | 0 | 0.0% |
| Literature & Languages | 33 | 36.3% |
| Liberal Arts & History | 0 | 0.0% |
| Visual & Performing Arts | 0 | 0.0% |
| Communications | 0 | 0.0% |
| Arts & Humanities | 0 | 0.0% |
| Total | 91 | 100.0% |
Transportation & Commute in Alpine
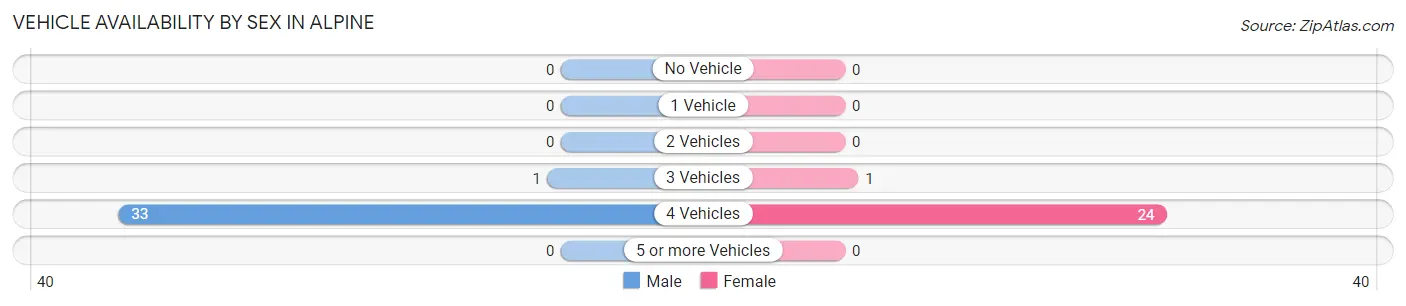
Vehicle Availability by Sex in Alpine
The most prevalent vehicle ownership categories in Alpine are males with 4 vehicles (33, accounting for 97.1%) and females with 4 vehicles (24, making up 132.0%).
| Vehicles Available | Male | Female |
| No Vehicle | 0 (0.0%) | 0 (0.0%) |
| 1 Vehicle | 0 (0.0%) | 0 (0.0%) |
| 2 Vehicles | 0 (0.0%) | 0 (0.0%) |
| 3 Vehicles | 1 (2.9%) | 1 (4.0%) |
| 4 Vehicles | 33 (97.1%) | 24 (96.0%) |
| 5 or more Vehicles | 0 (0.0%) | 0 (0.0%) |
| Total | 34 (100.0%) | 25 (100.0%) |
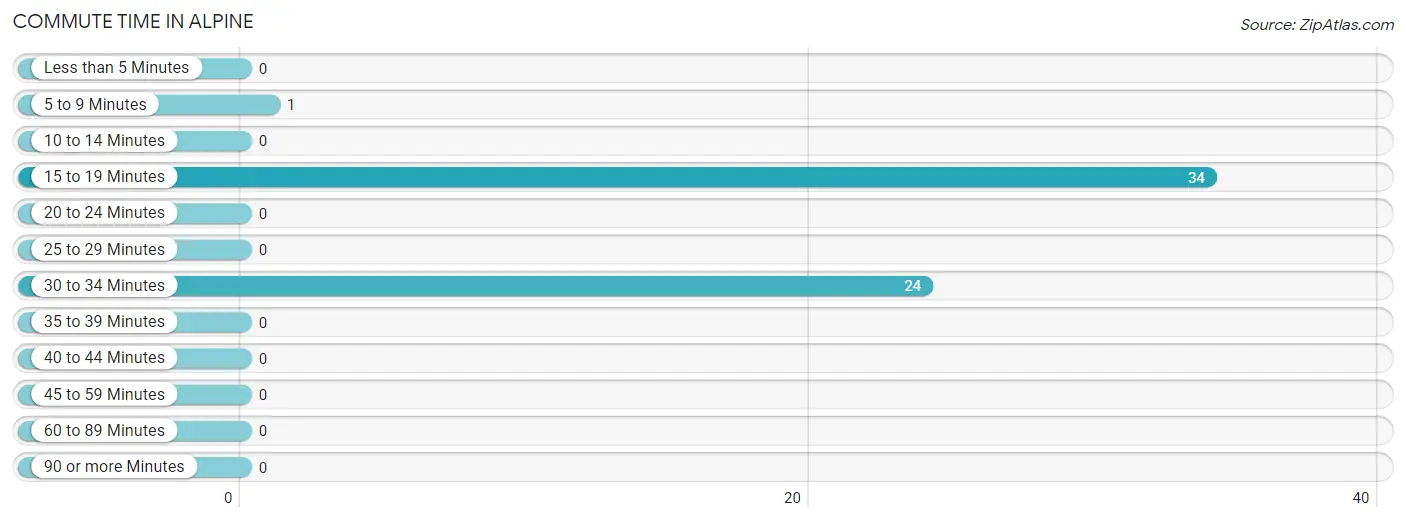
Commute Time in Alpine
The most frequently occuring commute durations in Alpine are 15 to 19 minutes (34 commuters, 57.6%), 30 to 34 minutes (24 commuters, 40.7%), and 5 to 9 minutes (1 commuters, 1.7%).
| Commute Time | # Commuters | % Commuters |
| Less than 5 Minutes | 0 | 0.0% |
| 5 to 9 Minutes | 1 | 1.7% |
| 10 to 14 Minutes | 0 | 0.0% |
| 15 to 19 Minutes | 34 | 57.6% |
| 20 to 24 Minutes | 0 | 0.0% |
| 25 to 29 Minutes | 0 | 0.0% |
| 30 to 34 Minutes | 24 | 40.7% |
| 35 to 39 Minutes | 0 | 0.0% |
| 40 to 44 Minutes | 0 | 0.0% |
| 45 to 59 Minutes | 0 | 0.0% |
| 60 to 89 Minutes | 0 | 0.0% |
| 90 or more Minutes | 0 | 0.0% |
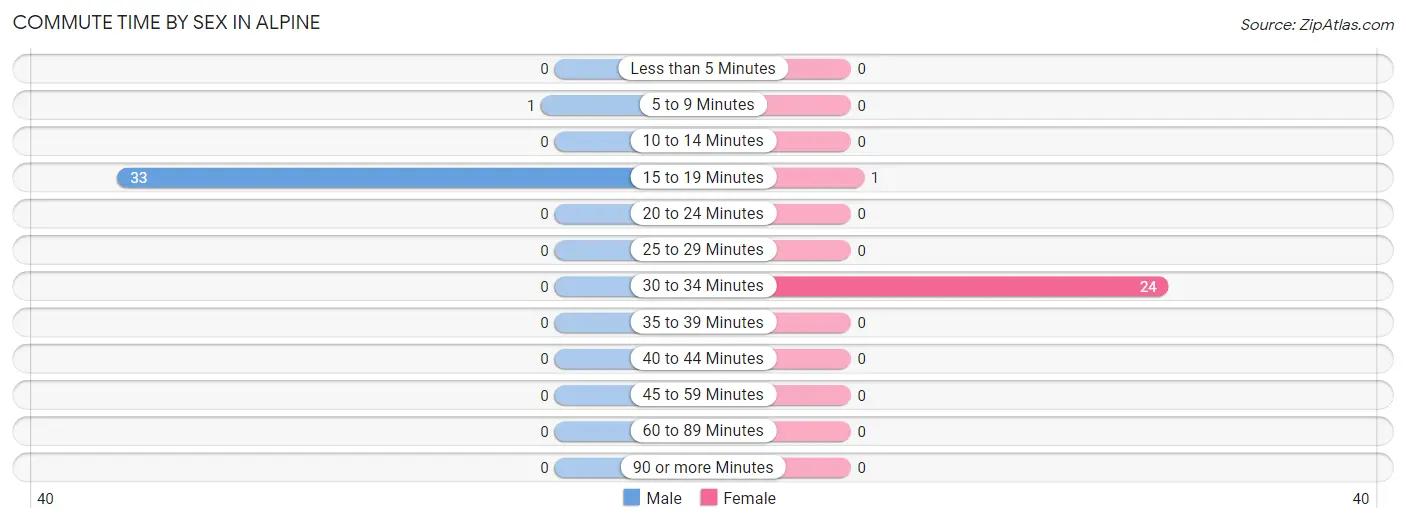
Commute Time by Sex in Alpine
The most common commute times in Alpine are 15 to 19 minutes (33 commuters, 97.1%) for males and 30 to 34 minutes (24 commuters, 96.0%) for females.
| Commute Time | Male | Female |
| Less than 5 Minutes | 0 (0.0%) | 0 (0.0%) |
| 5 to 9 Minutes | 1 (2.9%) | 0 (0.0%) |
| 10 to 14 Minutes | 0 (0.0%) | 0 (0.0%) |
| 15 to 19 Minutes | 33 (97.1%) | 1 (4.0%) |
| 20 to 24 Minutes | 0 (0.0%) | 0 (0.0%) |
| 25 to 29 Minutes | 0 (0.0%) | 0 (0.0%) |
| 30 to 34 Minutes | 0 (0.0%) | 24 (96.0%) |
| 35 to 39 Minutes | 0 (0.0%) | 0 (0.0%) |
| 40 to 44 Minutes | 0 (0.0%) | 0 (0.0%) |
| 45 to 59 Minutes | 0 (0.0%) | 0 (0.0%) |
| 60 to 89 Minutes | 0 (0.0%) | 0 (0.0%) |
| 90 or more Minutes | 0 (0.0%) | 0 (0.0%) |
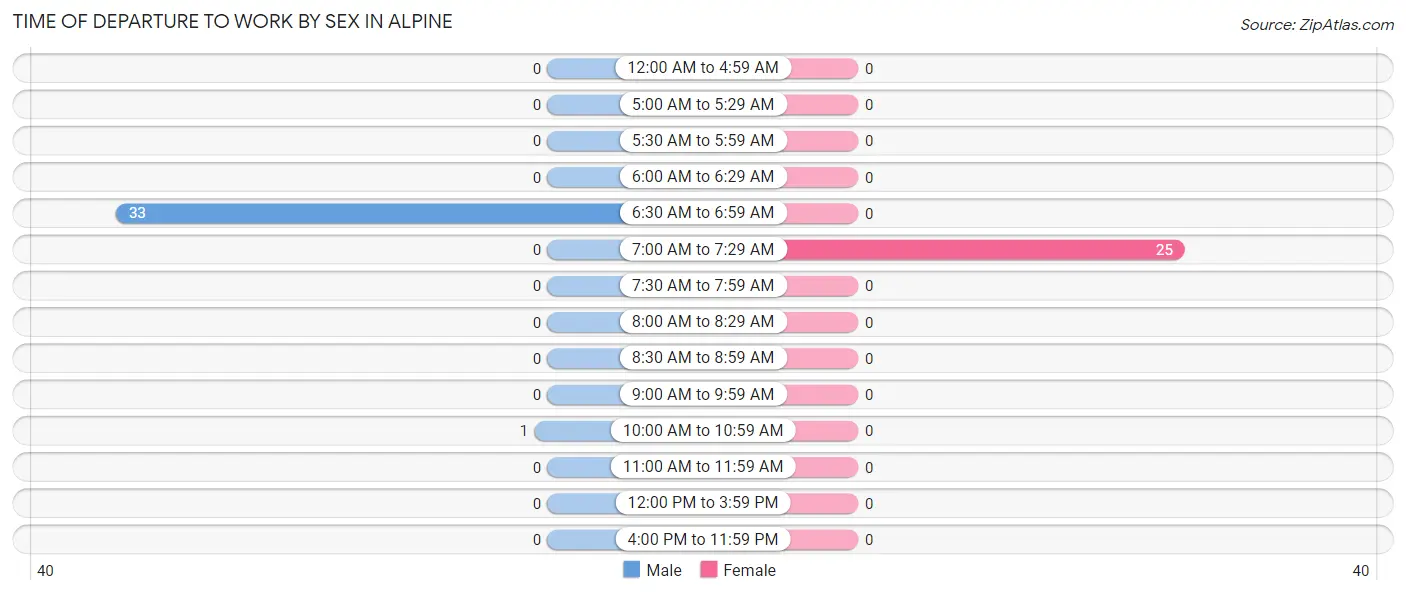
Time of Departure to Work by Sex in Alpine
The most frequent times of departure to work in Alpine are 6:30 AM to 6:59 AM (33, 97.1%) for males and 7:00 AM to 7:29 AM (25, 100.0%) for females.
| Time of Departure | Male | Female |
| 12:00 AM to 4:59 AM | 0 (0.0%) | 0 (0.0%) |
| 5:00 AM to 5:29 AM | 0 (0.0%) | 0 (0.0%) |
| 5:30 AM to 5:59 AM | 0 (0.0%) | 0 (0.0%) |
| 6:00 AM to 6:29 AM | 0 (0.0%) | 0 (0.0%) |
| 6:30 AM to 6:59 AM | 33 (97.1%) | 0 (0.0%) |
| 7:00 AM to 7:29 AM | 0 (0.0%) | 25 (100.0%) |
| 7:30 AM to 7:59 AM | 0 (0.0%) | 0 (0.0%) |
| 8:00 AM to 8:29 AM | 0 (0.0%) | 0 (0.0%) |
| 8:30 AM to 8:59 AM | 0 (0.0%) | 0 (0.0%) |
| 9:00 AM to 9:59 AM | 0 (0.0%) | 0 (0.0%) |
| 10:00 AM to 10:59 AM | 1 (2.9%) | 0 (0.0%) |
| 11:00 AM to 11:59 AM | 0 (0.0%) | 0 (0.0%) |
| 12:00 PM to 3:59 PM | 0 (0.0%) | 0 (0.0%) |
| 4:00 PM to 11:59 PM | 0 (0.0%) | 0 (0.0%) |
| Total | 34 (100.0%) | 25 (100.0%) |
Housing Occupancy in Alpine
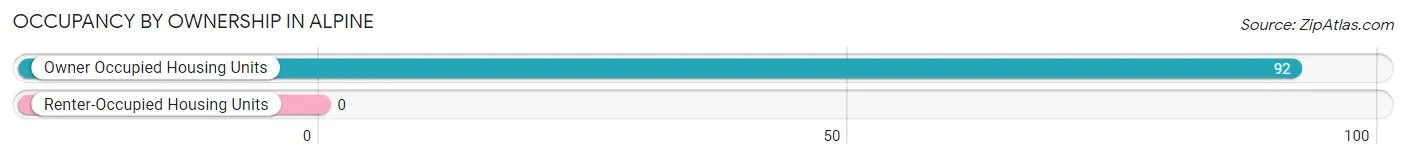
Occupancy by Ownership in Alpine
Of the total 92 dwellings in Alpine, owner-occupied units account for 92 (100.0%), while renter-occupied units make up 0 (0.0%).
| Occupancy | # Housing Units | % Housing Units |
| Owner Occupied Housing Units | 92 | 100.0% |
| Renter-Occupied Housing Units | 0 | 0.0% |
| Total Occupied Housing Units | 92 | 100.0% |
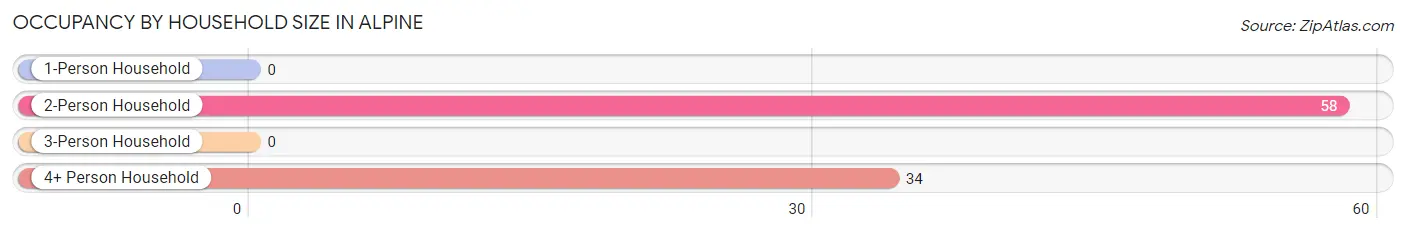
Occupancy by Household Size in Alpine
| Household Size | # Housing Units | % Housing Units |
| 1-Person Household | 0 | 0.0% |
| 2-Person Household | 58 | 63.0% |
| 3-Person Household | 0 | 0.0% |
| 4+ Person Household | 34 | 37.0% |
| Total Housing Units | 92 | 100.0% |
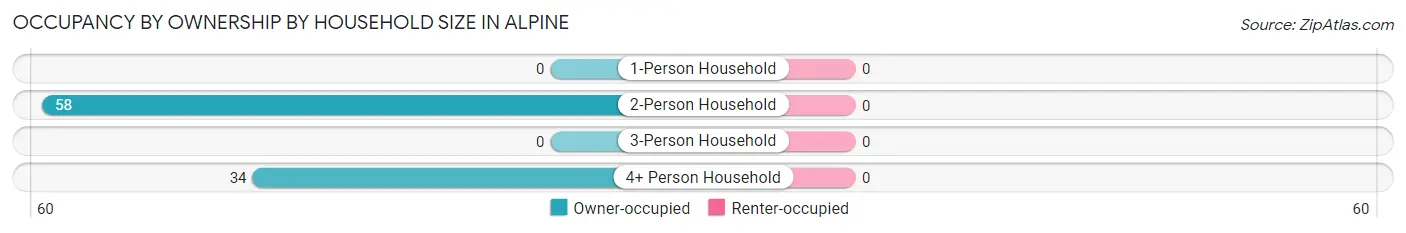
Occupancy by Ownership by Household Size in Alpine
| Household Size | Owner-occupied | Renter-occupied |
| 1-Person Household | 0 (0.0%) | 0 (0.0%) |
| 2-Person Household | 58 (100.0%) | 0 (0.0%) |
| 3-Person Household | 0 (0.0%) | 0 (0.0%) |
| 4+ Person Household | 34 (100.0%) | 0 (0.0%) |
| Total Housing Units | 92 (100.0%) | 0 (0.0%) |
Occupancy by Educational Attainment in Alpine
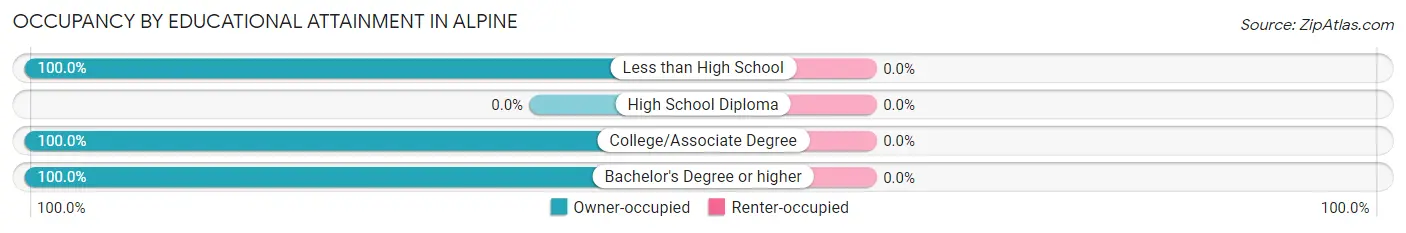
| Household Size | Owner-occupied | Renter-occupied |
| Less than High School | 32 (100.0%) | 0 (0.0%) |
| High School Diploma | 0 (0.0%) | 0 (0.0%) |
| College/Associate Degree | 27 (100.0%) | 0 (0.0%) |
| Bachelor's Degree or higher | 33 (100.0%) | 0 (0.0%) |
Occupancy by Age of Householder in Alpine
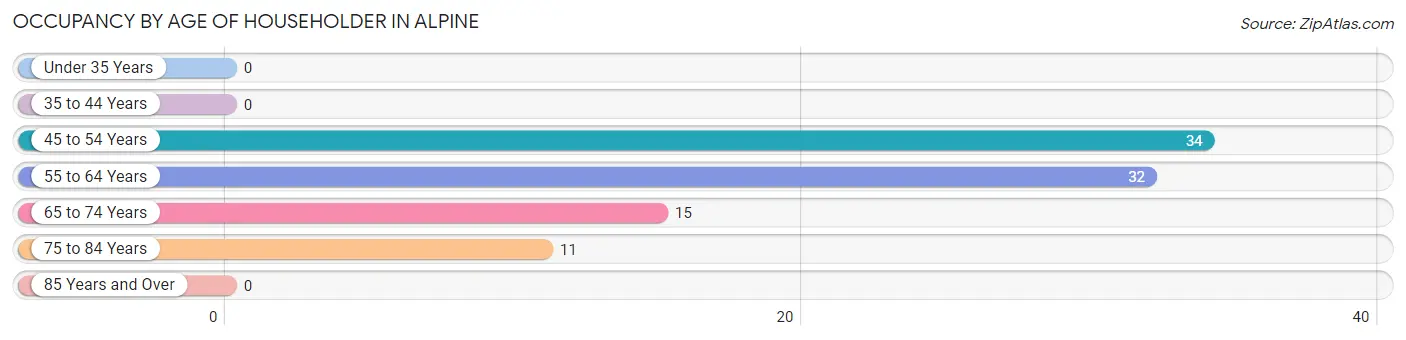
| Age Bracket | # Households | % Households |
| Under 35 Years | 0 | 0.0% |
| 35 to 44 Years | 0 | 0.0% |
| 45 to 54 Years | 34 | 37.0% |
| 55 to 64 Years | 32 | 34.8% |
| 65 to 74 Years | 15 | 16.3% |
| 75 to 84 Years | 11 | 12.0% |
| 85 Years and Over | 0 | 0.0% |
| Total | 92 | 100.0% |
Housing Finances in Alpine
Median Income by Occupancy in Alpine
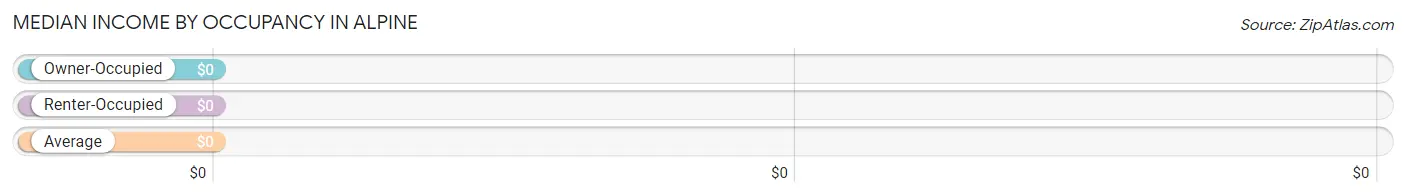
| Occupancy Type | # Households | Median Income |
| Owner-Occupied | 92 (100.0%) | $0 |
| Renter-Occupied | 0 (0.0%) | $0 |
| Average | 92 (100.0%) | $0 |
Occupancy by Householder Income Bracket in Alpine
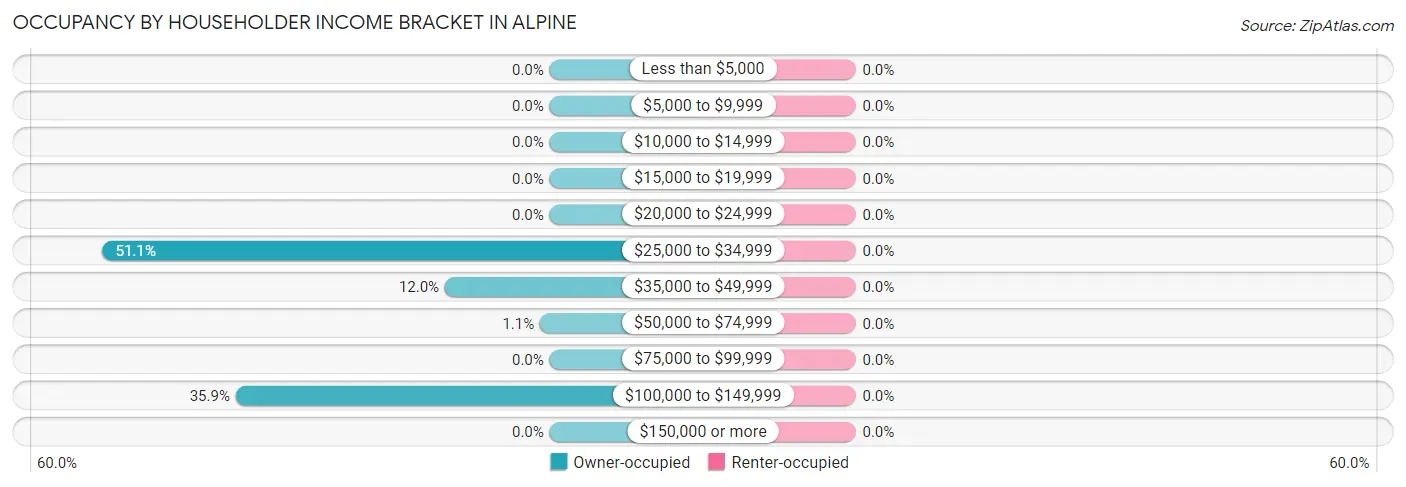
| Income Bracket | Owner-occupied | Renter-occupied |
| Less than $5,000 | 0 (0.0%) | 0 (0.0%) |
| $5,000 to $9,999 | 0 (0.0%) | 0 (0.0%) |
| $10,000 to $14,999 | 0 (0.0%) | 0 (0.0%) |
| $15,000 to $19,999 | 0 (0.0%) | 0 (0.0%) |
| $20,000 to $24,999 | 0 (0.0%) | 0 (0.0%) |
| $25,000 to $34,999 | 47 (51.1%) | 0 (0.0%) |
| $35,000 to $49,999 | 11 (12.0%) | 0 (0.0%) |
| $50,000 to $74,999 | 1 (1.1%) | 0 (0.0%) |
| $75,000 to $99,999 | 0 (0.0%) | 0 (0.0%) |
| $100,000 to $149,999 | 33 (35.9%) | 0 (0.0%) |
| $150,000 or more | 0 (0.0%) | 0 (0.0%) |
| Total | 92 (100.0%) | 0 (0.0%) |
Monthly Housing Cost Tiers in Alpine
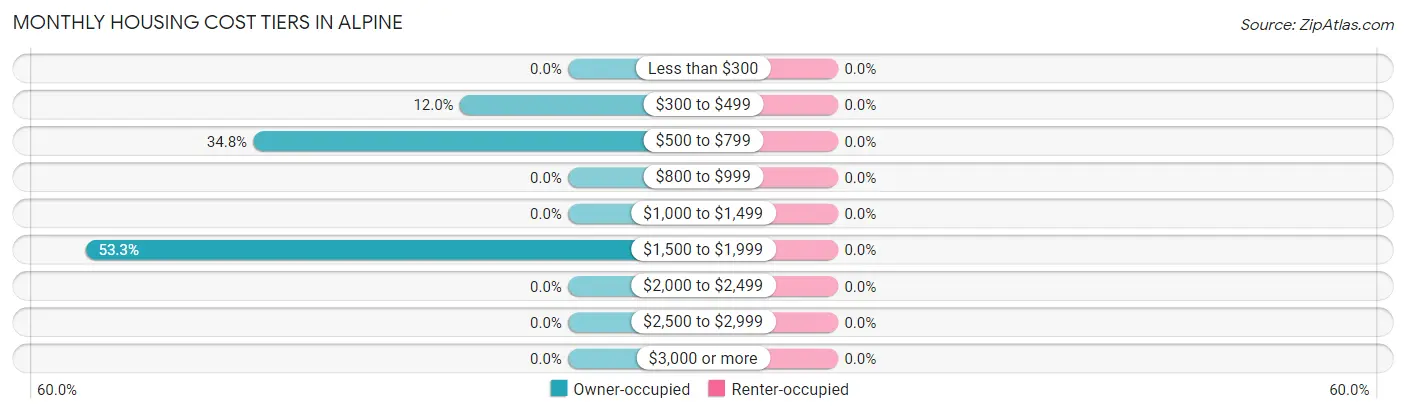
| Monthly Cost | Owner-occupied | Renter-occupied |
| Less than $300 | 0 (0.0%) | 0 (0.0%) |
| $300 to $499 | 11 (12.0%) | 0 (0.0%) |
| $500 to $799 | 32 (34.8%) | 0 (0.0%) |
| $800 to $999 | 0 (0.0%) | 0 (0.0%) |
| $1,000 to $1,499 | 0 (0.0%) | 0 (0.0%) |
| $1,500 to $1,999 | 49 (53.3%) | 0 (0.0%) |
| $2,000 to $2,499 | 0 (0.0%) | 0 (0.0%) |
| $2,500 to $2,999 | 0 (0.0%) | 0 (0.0%) |
| $3,000 or more | 0 (0.0%) | 0 (0.0%) |
| Total | 92 (100.0%) | 0 (0.0%) |
Physical Housing Characteristics in Alpine
Housing Structures in Alpine
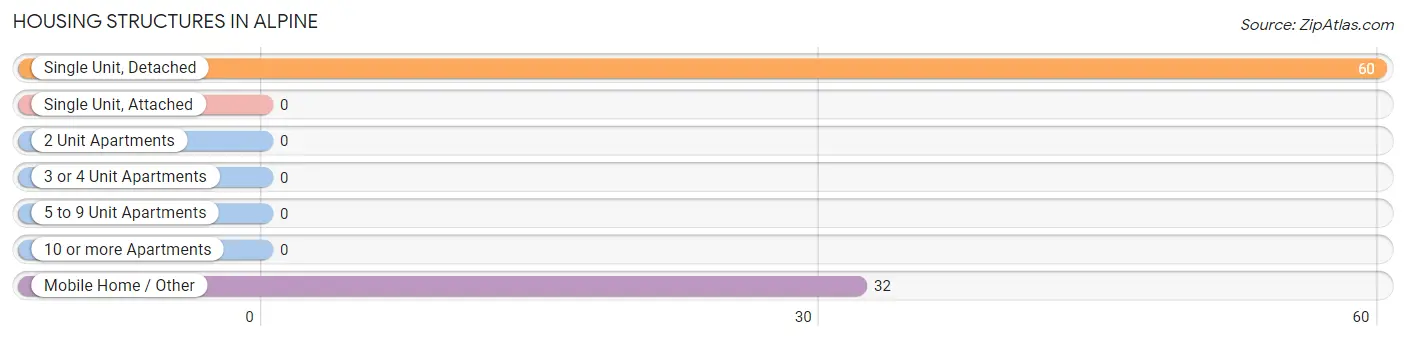
| Structure Type | # Housing Units | % Housing Units |
| Single Unit, Detached | 60 | 65.2% |
| Single Unit, Attached | 0 | 0.0% |
| 2 Unit Apartments | 0 | 0.0% |
| 3 or 4 Unit Apartments | 0 | 0.0% |
| 5 to 9 Unit Apartments | 0 | 0.0% |
| 10 or more Apartments | 0 | 0.0% |
| Mobile Home / Other | 32 | 34.8% |
| Total | 92 | 100.0% |
Housing Structures by Occupancy in Alpine
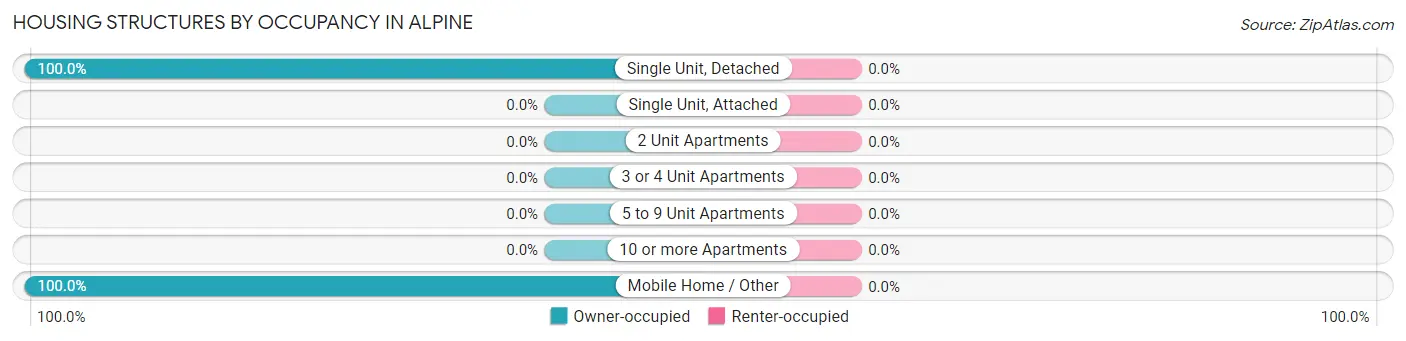
| Structure Type | Owner-occupied | Renter-occupied |
| Single Unit, Detached | 60 (100.0%) | 0 (0.0%) |
| Single Unit, Attached | 0 (0.0%) | 0 (0.0%) |
| 2 Unit Apartments | 0 (0.0%) | 0 (0.0%) |
| 3 or 4 Unit Apartments | 0 (0.0%) | 0 (0.0%) |
| 5 to 9 Unit Apartments | 0 (0.0%) | 0 (0.0%) |
| 10 or more Apartments | 0 (0.0%) | 0 (0.0%) |
| Mobile Home / Other | 32 (100.0%) | 0 (0.0%) |
| Total | 92 (100.0%) | 0 (0.0%) |
Housing Structures by Number of Rooms in Alpine
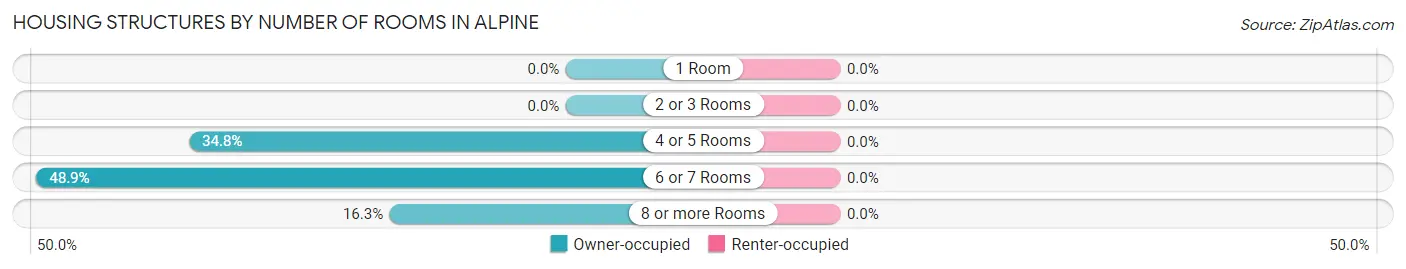
| Number of Rooms | Owner-occupied | Renter-occupied |
| 1 Room | 0 (0.0%) | 0 (0.0%) |
| 2 or 3 Rooms | 0 (0.0%) | 0 (0.0%) |
| 4 or 5 Rooms | 32 (34.8%) | 0 (0.0%) |
| 6 or 7 Rooms | 45 (48.9%) | 0 (0.0%) |
| 8 or more Rooms | 15 (16.3%) | 0 (0.0%) |
| Total | 92 (100.0%) | 0 (0.0%) |
Housing Structure by Heating Type in Alpine
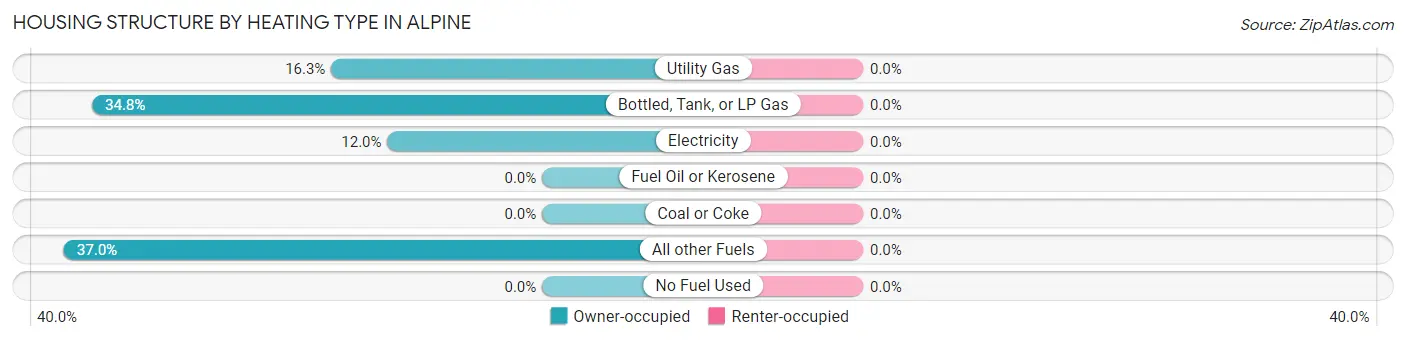
| Heating Type | Owner-occupied | Renter-occupied |
| Utility Gas | 15 (16.3%) | 0 (0.0%) |
| Bottled, Tank, or LP Gas | 32 (34.8%) | 0 (0.0%) |
| Electricity | 11 (12.0%) | 0 (0.0%) |
| Fuel Oil or Kerosene | 0 (0.0%) | 0 (0.0%) |
| Coal or Coke | 0 (0.0%) | 0 (0.0%) |
| All other Fuels | 34 (37.0%) | 0 (0.0%) |
| No Fuel Used | 0 (0.0%) | 0 (0.0%) |
| Total | 92 (100.0%) | 0 (0.0%) |
Household Vehicle Usage in Alpine
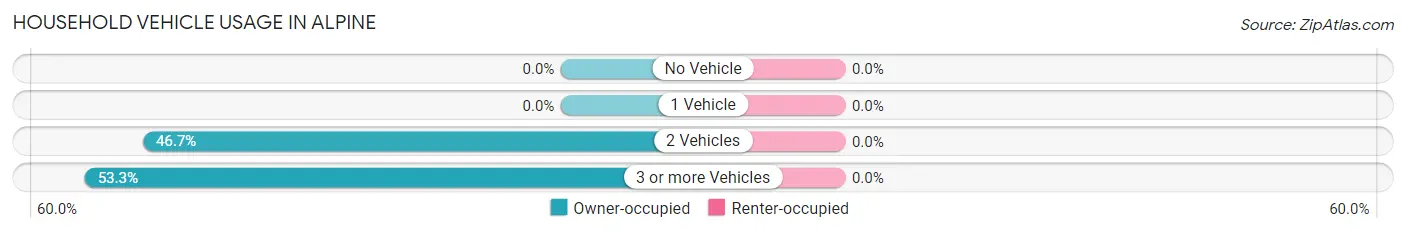
| Vehicles per Household | Owner-occupied | Renter-occupied |
| No Vehicle | 0 (0.0%) | 0 (0.0%) |
| 1 Vehicle | 0 (0.0%) | 0 (0.0%) |
| 2 Vehicles | 43 (46.7%) | 0 (0.0%) |
| 3 or more Vehicles | 49 (53.3%) | 0 (0.0%) |
| Total | 92 (100.0%) | 0 (0.0%) |
Real Estate & Mortgages in Alpine
Real Estate and Mortgage Overview in Alpine
| Characteristic | Without Mortgage | With Mortgage |
| Housing Units | 43 | 49 |
| Median Property Value | - | - |
| Median Household Income | - | - |
| Monthly Housing Costs | - | - |
| Real Estate Taxes | - | - |
Property Value by Mortgage Status in Alpine
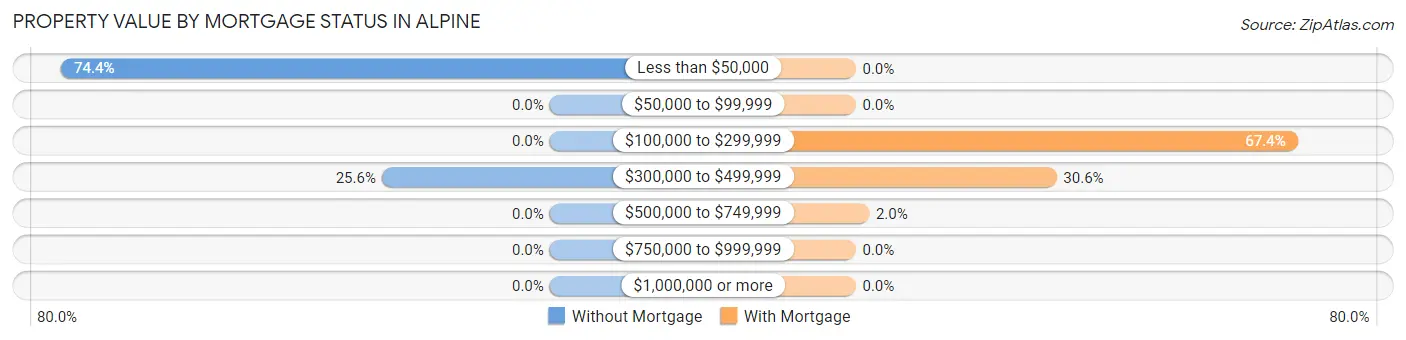
| Property Value | Without Mortgage | With Mortgage |
| Less than $50,000 | 32 (74.4%) | 0 (0.0%) |
| $50,000 to $99,999 | 0 (0.0%) | 0 (0.0%) |
| $100,000 to $299,999 | 0 (0.0%) | 33 (67.3%) |
| $300,000 to $499,999 | 11 (25.6%) | 15 (30.6%) |
| $500,000 to $749,999 | 0 (0.0%) | 1 (2.0%) |
| $750,000 to $999,999 | 0 (0.0%) | 0 (0.0%) |
| $1,000,000 or more | 0 (0.0%) | 0 (0.0%) |
| Total | 43 (100.0%) | 49 (100.0%) |
Household Income by Mortgage Status in Alpine
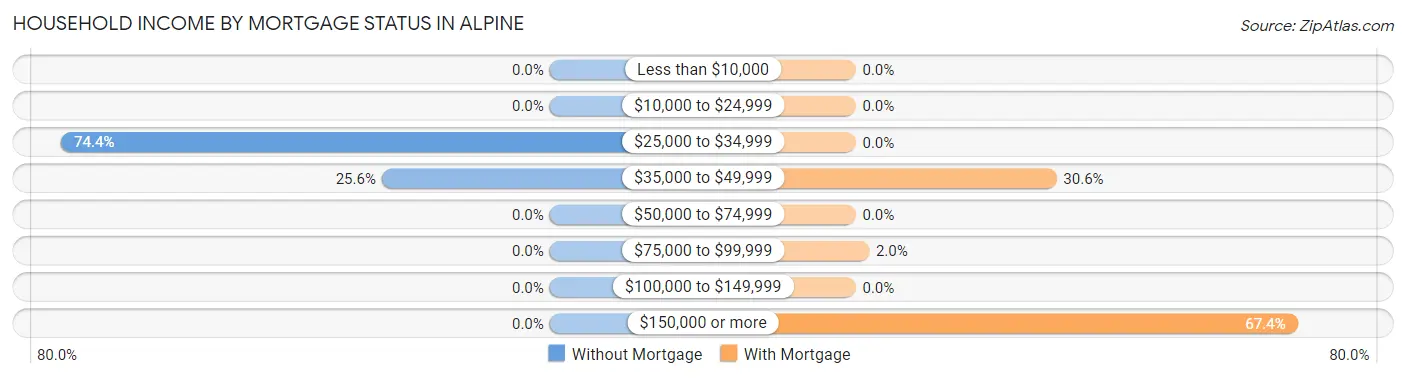
| Household Income | Without Mortgage | With Mortgage |
| Less than $10,000 | 0 (0.0%) | 0 (0.0%) |
| $10,000 to $24,999 | 0 (0.0%) | 0 (0.0%) |
| $25,000 to $34,999 | 32 (74.4%) | 0 (0.0%) |
| $35,000 to $49,999 | 11 (25.6%) | 15 (30.6%) |
| $50,000 to $74,999 | 0 (0.0%) | 0 (0.0%) |
| $75,000 to $99,999 | 0 (0.0%) | 1 (2.0%) |
| $100,000 to $149,999 | 0 (0.0%) | 0 (0.0%) |
| $150,000 or more | 0 (0.0%) | 33 (67.3%) |
| Total | 43 (100.0%) | 49 (100.0%) |
Property Value to Household Income Ratio in Alpine
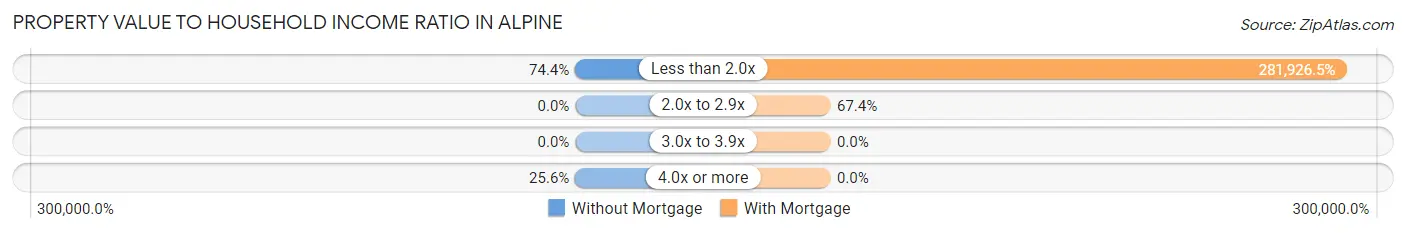
| Value-to-Income Ratio | Without Mortgage | With Mortgage |
| Less than 2.0x | 32 (74.4%) | 138,144 (281,926.5%) |
| 2.0x to 2.9x | 0 (0.0%) | 33 (67.3%) |
| 3.0x to 3.9x | 0 (0.0%) | 0 (0.0%) |
| 4.0x or more | 11 (25.6%) | 0 (0.0%) |
| Total | 43 (100.0%) | 49 (100.0%) |
Real Estate Taxes by Mortgage Status in Alpine
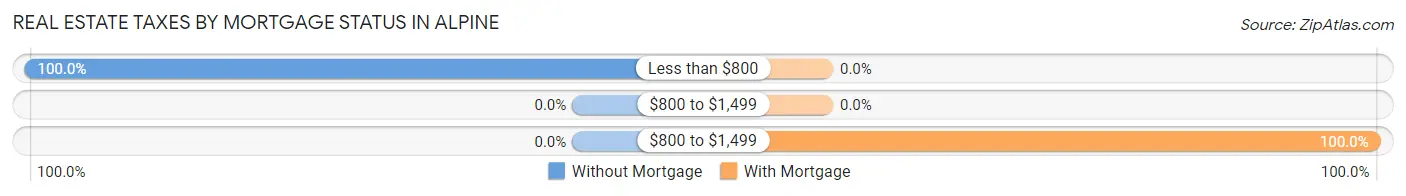
| Property Taxes | Without Mortgage | With Mortgage |
| Less than $800 | 43 (100.0%) | 0 (0.0%) |
| $800 to $1,499 | 0 (0.0%) | 0 (0.0%) |
| $800 to $1,499 | 0 (0.0%) | 49 (100.0%) |
| Total | 43 (100.0%) | 49 (100.0%) |
Health & Disability in Alpine
Health Insurance Coverage by Age in Alpine
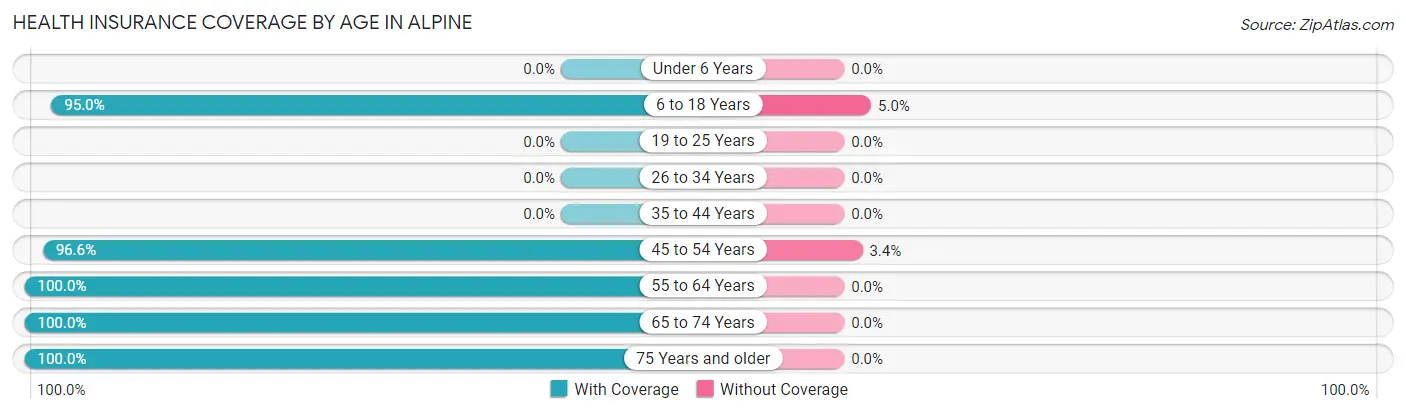
| Age Bracket | With Coverage | Without Coverage |
| Under 6 Years | 0 (0.0%) | 0 (0.0%) |
| 6 to 18 Years | 38 (95.0%) | 2 (5.0%) |
| 19 to 25 Years | 0 (0.0%) | 0 (0.0%) |
| 26 to 34 Years | 0 (0.0%) | 0 (0.0%) |
| 35 to 44 Years | 0 (0.0%) | 0 (0.0%) |
| 45 to 54 Years | 57 (96.6%) | 2 (3.4%) |
| 55 to 64 Years | 32 (100.0%) | 0 (0.0%) |
| 65 to 74 Years | 62 (100.0%) | 0 (0.0%) |
| 75 Years and older | 26 (100.0%) | 0 (0.0%) |
| Total | 215 (98.2%) | 4 (1.8%) |
Health Insurance Coverage by Citizenship Status in Alpine
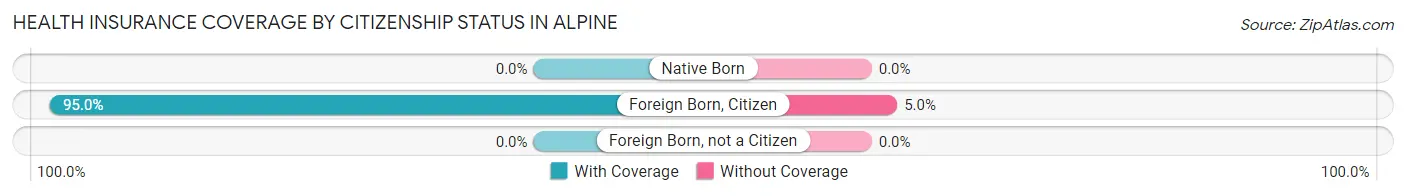
| Citizenship Status | With Coverage | Without Coverage |
| Native Born | 0 (0.0%) | 0 (0.0%) |
| Foreign Born, Citizen | 38 (95.0%) | 2 (5.0%) |
| Foreign Born, not a Citizen | 0 (0.0%) | 0 (0.0%) |
Health Insurance Coverage by Household Income in Alpine
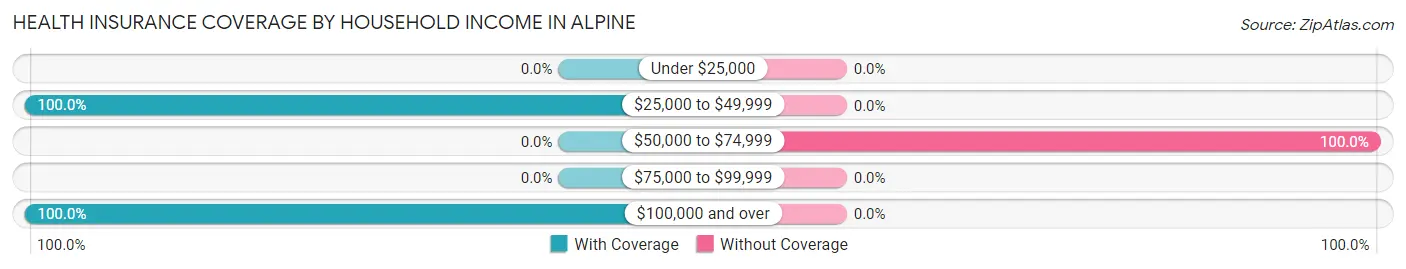
| Household Income | With Coverage | Without Coverage |
| Under $25,000 | 0 (0.0%) | 0 (0.0%) |
| $25,000 to $49,999 | 120 (100.0%) | 0 (0.0%) |
| $50,000 to $74,999 | 0 (0.0%) | 4 (100.0%) |
| $75,000 to $99,999 | 0 (0.0%) | 0 (0.0%) |
| $100,000 and over | 95 (100.0%) | 0 (0.0%) |
Public vs Private Health Insurance Coverage by Age in Alpine
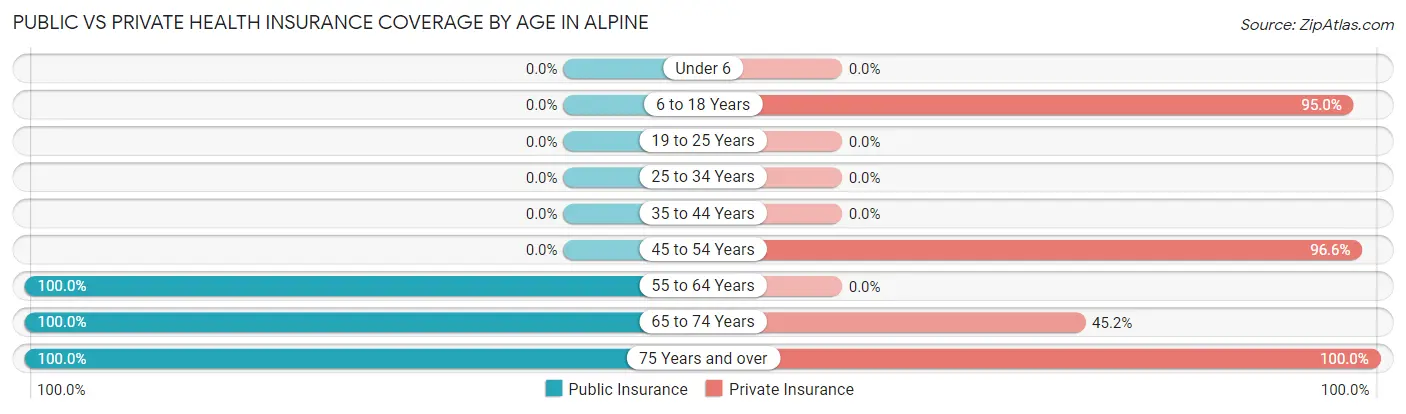
| Age Bracket | Public Insurance | Private Insurance |
| Under 6 | 0 (0.0%) | 0 (0.0%) |
| 6 to 18 Years | 0 (0.0%) | 38 (95.0%) |
| 19 to 25 Years | 0 (0.0%) | 0 (0.0%) |
| 25 to 34 Years | 0 (0.0%) | 0 (0.0%) |
| 35 to 44 Years | 0 (0.0%) | 0 (0.0%) |
| 45 to 54 Years | 0 (0.0%) | 57 (96.6%) |
| 55 to 64 Years | 32 (100.0%) | 0 (0.0%) |
| 65 to 74 Years | 62 (100.0%) | 28 (45.2%) |
| 75 Years and over | 26 (100.0%) | 26 (100.0%) |
| Total | 120 (54.8%) | 149 (68.0%) |
Disability Status by Sex by Age in Alpine
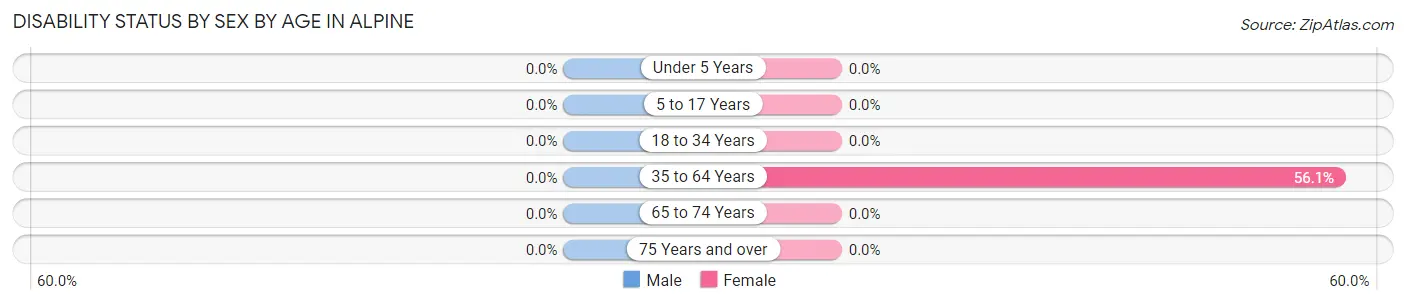
| Age Bracket | Male | Female |
| Under 5 Years | 0 (0.0%) | 0 (0.0%) |
| 5 to 17 Years | 0 (0.0%) | 0 (0.0%) |
| 18 to 34 Years | 0 (0.0%) | 0 (0.0%) |
| 35 to 64 Years | 0 (0.0%) | 32 (56.1%) |
| 65 to 74 Years | 0 (0.0%) | 0 (0.0%) |
| 75 Years and over | 0 (0.0%) | 0 (0.0%) |
Disability Class by Sex by Age in Alpine
Disability Class: Hearing Difficulty
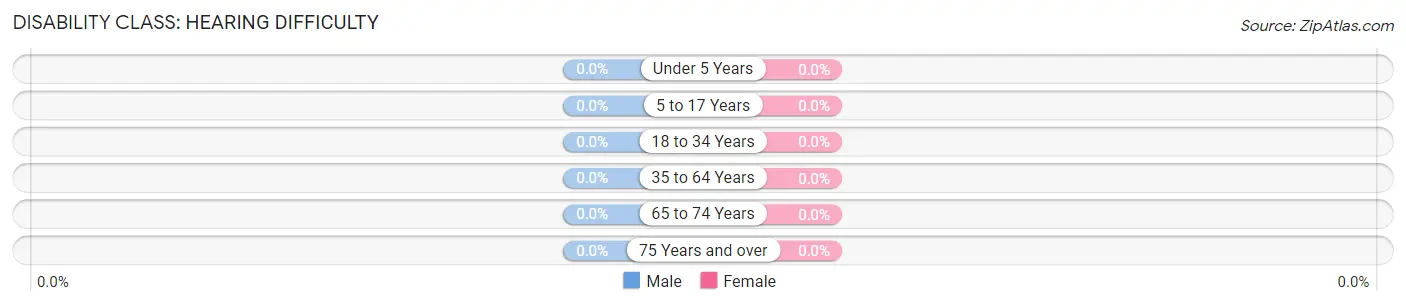
| Age Bracket | Male | Female |
| Under 5 Years | 0 (0.0%) | 0 (0.0%) |
| 5 to 17 Years | 0 (0.0%) | 0 (0.0%) |
| 18 to 34 Years | 0 (0.0%) | 0 (0.0%) |
| 35 to 64 Years | 0 (0.0%) | 0 (0.0%) |
| 65 to 74 Years | 0 (0.0%) | 0 (0.0%) |
| 75 Years and over | 0 (0.0%) | 0 (0.0%) |
Disability Class: Vision Difficulty
| Age Bracket | Male | Female |
| Under 5 Years | 0 (0.0%) | 0 (0.0%) |
| 5 to 17 Years | 0 (0.0%) | 0 (0.0%) |
| 18 to 34 Years | 0 (0.0%) | 0 (0.0%) |
| 35 to 64 Years | 0 (0.0%) | 0 (0.0%) |
| 65 to 74 Years | 0 (0.0%) | 0 (0.0%) |
| 75 Years and over | 0 (0.0%) | 0 (0.0%) |
Disability Class: Cognitive Difficulty
| Age Bracket | Male | Female |
| 5 to 17 Years | 0 (0.0%) | 0 (0.0%) |
| 18 to 34 Years | 0 (0.0%) | 0 (0.0%) |
| 35 to 64 Years | 0 (0.0%) | 0 (0.0%) |
| 65 to 74 Years | 0 (0.0%) | 0 (0.0%) |
| 75 Years and over | 0 (0.0%) | 0 (0.0%) |
Disability Class: Ambulatory Difficulty
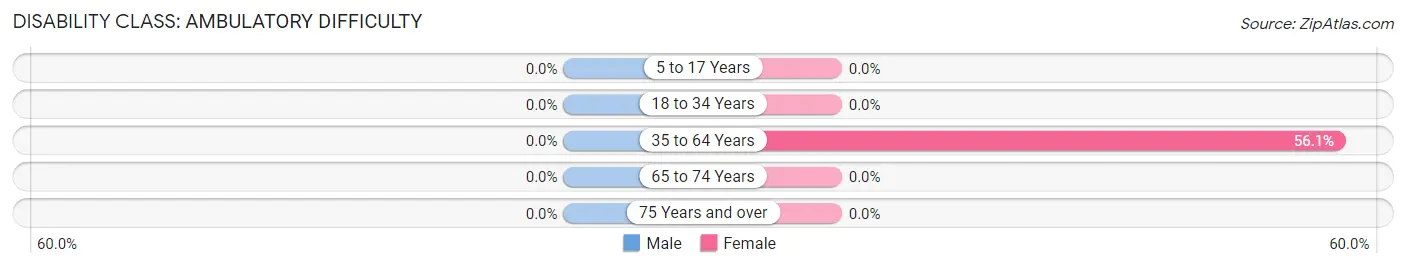
| Age Bracket | Male | Female |
| 5 to 17 Years | 0 (0.0%) | 0 (0.0%) |
| 18 to 34 Years | 0 (0.0%) | 0 (0.0%) |
| 35 to 64 Years | 0 (0.0%) | 32 (56.1%) |
| 65 to 74 Years | 0 (0.0%) | 0 (0.0%) |
| 75 Years and over | 0 (0.0%) | 0 (0.0%) |
Disability Class: Self-Care Difficulty
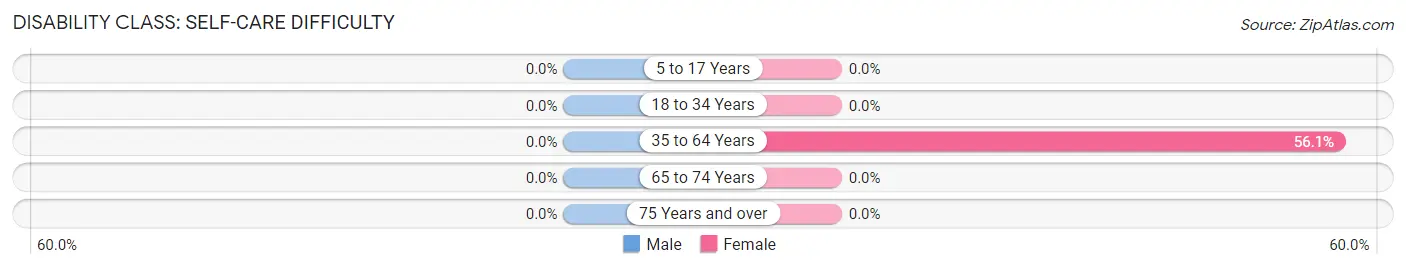
| Age Bracket | Male | Female |
| 5 to 17 Years | 0 (0.0%) | 0 (0.0%) |
| 18 to 34 Years | 0 (0.0%) | 0 (0.0%) |
| 35 to 64 Years | 0 (0.0%) | 32 (56.1%) |
| 65 to 74 Years | 0 (0.0%) | 0 (0.0%) |
| 75 Years and over | 0 (0.0%) | 0 (0.0%) |
Technology Access in Alpine
Computing Device Access in Alpine
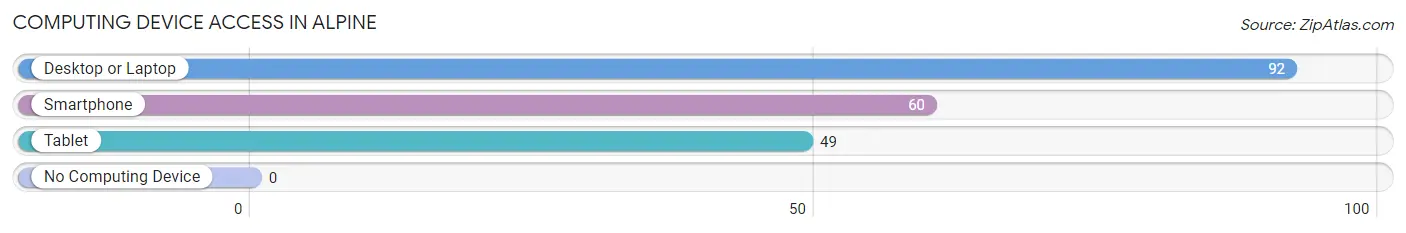
| Device Type | # Households | % Households |
| Desktop or Laptop | 92 | 100.0% |
| Smartphone | 60 | 65.2% |
| Tablet | 49 | 53.3% |
| No Computing Device | 0 | 0.0% |
| Total | 92 | 100.0% |
Internet Access in Alpine
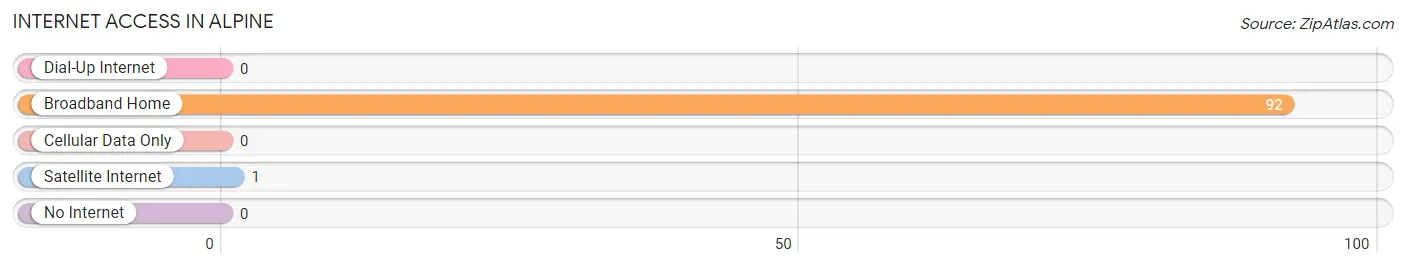
| Internet Type | # Households | % Households |
| Dial-Up Internet | 0 | 0.0% |
| Broadband Home | 92 | 100.0% |
| Cellular Data Only | 0 | 0.0% |
| Satellite Internet | 1 | 1.1% |
| No Internet | 0 | 0.0% |
| Total | 92 | 100.0% |
Alpine Summary
Alpine, Colorado is a small town located in the Rocky Mountains of central Colorado. It is situated in the White River National Forest, and is surrounded by the Sawatch Range and the Mosquito Range. The town is located at an elevation of 8,000 feet, and is home to a population of approximately 1,000 people.
History
Alpine was founded in 1879 by a group of prospectors who were searching for gold in the area. The town was originally named “Alpine City”, but the name was later changed to “Alpine”. The town was incorporated in 1883, and the first post office was established in 1884.
The town grew slowly over the years, and by the early 1900s, it had become a popular tourist destination. The town was known for its beautiful scenery and outdoor activities, such as skiing, fishing, and hunting.
In the 1950s, Alpine began to experience a population boom, as many people moved to the area to take advantage of the outdoor recreation opportunities. The town was also home to a number of ski resorts, which helped to attract more visitors.
Geography
Alpine is located in the Rocky Mountains of central Colorado. It is situated in the White River National Forest, and is surrounded by the Sawatch Range and the Mosquito Range. The town is located at an elevation of 8,000 feet, and is home to a population of approximately 1,000 people.
The town is located in a valley, and is surrounded by mountains on all sides. The town is located near the headwaters of the Colorado River, and is close to several ski resorts, including Arapahoe Basin, Copper Mountain, and Loveland Ski Area.
Economy
The economy of Alpine is largely based on tourism and outdoor recreation. The town is home to several ski resorts, which attract visitors from all over the world. The town is also home to a number of restaurants, bars, and shops, which cater to the needs of tourists and locals alike.
The town is also home to a number of businesses, such as construction companies, real estate agencies, and other service-based businesses. The town is also home to a number of small manufacturing companies, which produce a variety of products, such as furniture, clothing, and sporting goods.
Demographics
As of the 2010 census, the population of Alpine was 1,000 people. The town is predominantly white, with approximately 95% of the population being white. The town is also home to a small Hispanic population, with approximately 4% of the population being Hispanic.
The median household income in Alpine is $50,000, and the median home value is $250,000. The town has a low unemployment rate, and the majority of the population is employed in the tourism and outdoor recreation industries.
Conclusion
Alpine, Colorado is a small town located in the Rocky Mountains of central Colorado. It is situated in the White River National Forest, and is surrounded by the Sawatch Range and the Mosquito Range. The town is located at an elevation of 8,000 feet, and is home to a population of approximately 1,000 people. The town is known for its beautiful scenery and outdoor activities, and is home to a number of ski resorts, restaurants, bars, and shops. The economy of Alpine is largely based on tourism and outdoor recreation, and the town is predominantly white, with a small Hispanic population. The median household income in Alpine is $50,000, and the median home value is $250,000.
Common Questions
What is Per Capita Income in Alpine?
Per Capita income in Alpine is $27,922.
What is Inequality or Gini Index in Alpine?
Inequality or Gini Index in Alpine is 0.36.
What is the Total Population of Alpine?
Total Population of Alpine is 219.
What is the Total Male Population of Alpine?
Total Male Population of Alpine is 127.
What is the Total Female Population of Alpine?
Total Female Population of Alpine is 92.
What is the Ratio of Males per 100 Females in Alpine?
There are 138.04 Males per 100 Females in Alpine.
What is the Ratio of Females per 100 Males in Alpine?
There are 72.44 Females per 100 Males in Alpine.
What is the Median Population Age in Alpine?
Median Population Age in Alpine is 58.3 Years.
What is the Average Family Size in Alpine
Average Family Size in Alpine is 2.4 People.
What is the Average Household Size in Alpine
Average Household Size in Alpine is 2.4 People.
How Large is the Labor Force in Alpine?
There are 59 People in the Labor Forcein in Alpine.
What is the Percentage of People in the Labor Force in Alpine?
30.3% of People are in the Labor Force in Alpine.