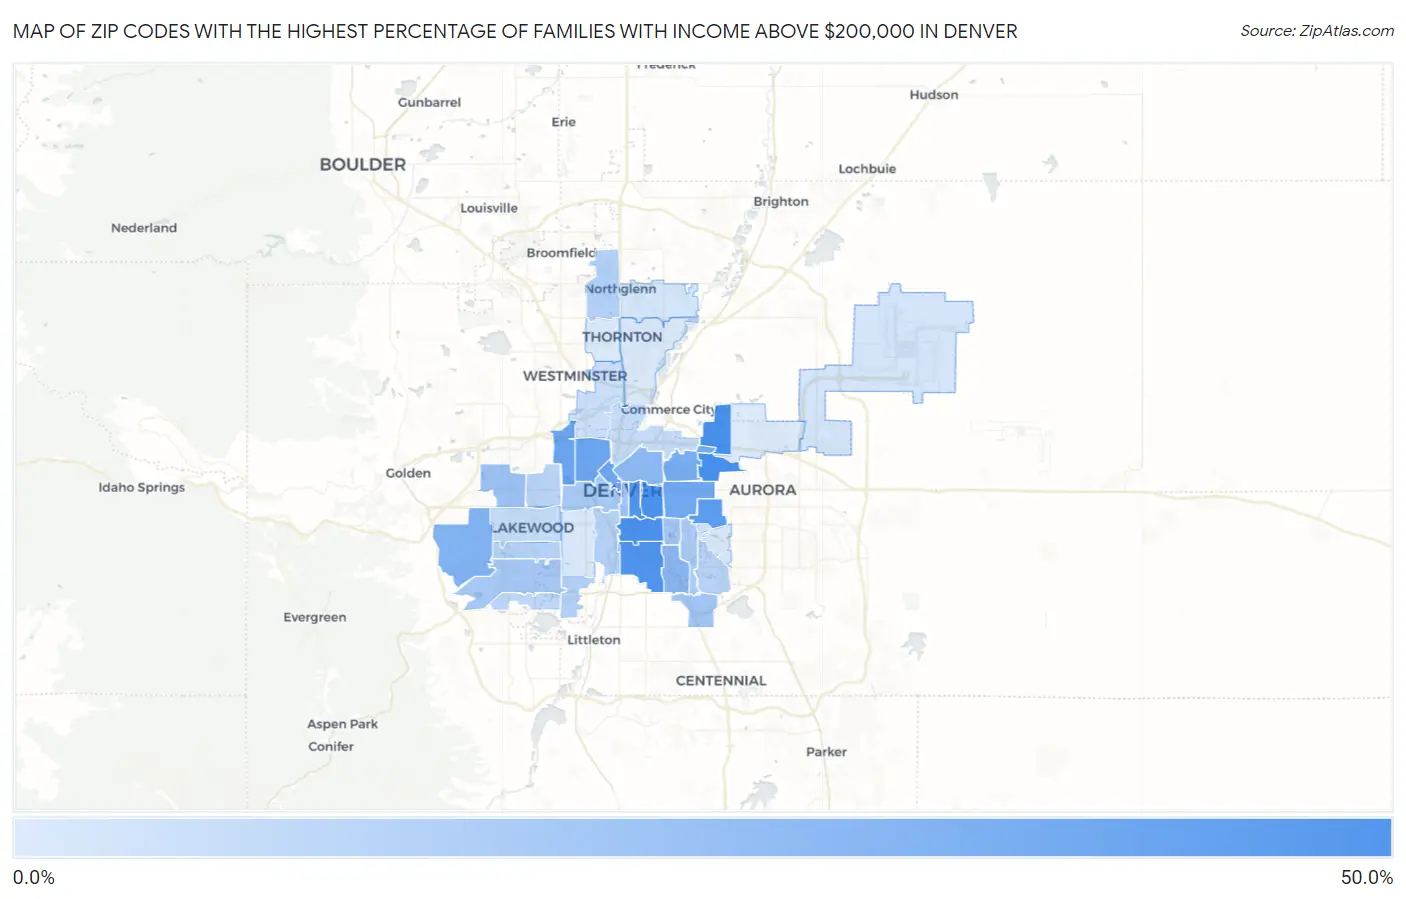
Zip Codes with the Highest Percentage of Families with Income Above $200,000 in Denver, CO
RELATED REPORTS & OPTIONS
Family Income | $200k+
Denver
Compare Zip Codes
Map of Zip Codes with the Highest Percentage of Families with Income Above $200,000 in Denver
3.8%
45.3%
Zip Codes with the Highest Percentage of Families with Income Above $200,000 in Denver, CO
| Zip Code | Families with Income > $200k | vs State | vs National | |
| 1. | 80238 | 45.3% | 18.4%(+26.9)#12 | 14.8%(+30.5)#921 |
| 2. | 80209 | 44.2% | 18.4%(+25.8)#13 | 14.8%(+29.4)#980 |
| 3. | 80206 | 43.7% | 18.4%(+25.3)#17 | 14.8%(+28.9)#1,006 |
| 4. | 80210 | 43.3% | 18.4%(+24.9)#18 | 14.8%(+28.5)#1,034 |
| 5. | 80218 | 43.2% | 18.4%(+24.8)#19 | 14.8%(+28.4)#1,039 |
| 6. | 80230 | 39.3% | 18.4%(+20.9)#29 | 14.8%(+24.5)#1,385 |
| 7. | 80211 | 33.9% | 18.4%(+15.5)#44 | 14.8%(+19.1)#1,971 |
| 8. | 80212 | 33.5% | 18.4%(+15.1)#47 | 14.8%(+18.7)#2,023 |
| 9. | 80202 | 33.1% | 18.4%(+14.7)#52 | 14.8%(+18.3)#2,094 |
| 10. | 80220 | 32.7% | 18.4%(+14.3)#55 | 14.8%(+17.9)#2,137 |
| 11. | 80207 | 30.4% | 18.4%(+12.0)#64 | 14.8%(+15.6)#2,458 |
| 12. | 80228 | 27.4% | 18.4%(+9.00)#75 | 14.8%(+12.6)#2,969 |
| 13. | 80222 | 24.8% | 18.4%(+6.40)#87 | 14.8%(+10.00)#3,522 |
| 14. | 80205 | 24.2% | 18.4%(+5.80)#90 | 14.8%(+9.40)#3,655 |
| 15. | 80215 | 20.2% | 18.4%(+1.80)#108 | 14.8%(+5.40)#4,748 |
| 16. | 80203 | 19.0% | 18.4%(+0.600)#118 | 14.8%(+4.20)#5,146 |
| 17. | 80237 | 18.9% | 18.4%(+0.500)#120 | 14.8%(+4.10)#5,193 |
| 18. | 80246 | 18.4% | 18.4%(=0.000)#126 | 14.8%(+3.60)#5,423 |
| 19. | 80227 | 17.7% | 18.4%(-0.700)#134 | 14.8%(+2.90)#5,674 |
| 20. | 80204 | 17.0% | 18.4%(-1.40)#145 | 14.8%(+2.20)#5,985 |
| 21. | 80224 | 16.4% | 18.4%(-2.00)#150 | 14.8%(+1.60)#6,247 |
| 22. | 80234 | 14.2% | 18.4%(-4.20)#173 | 14.8%(-0.600)#7,430 |
| 23. | 80223 | 14.2% | 18.4%(-4.20)#174 | 14.8%(-0.600)#7,437 |
| 24. | 80236 | 14.0% | 18.4%(-4.40)#176 | 14.8%(-0.800)#7,543 |
| 25. | 80232 | 13.5% | 18.4%(-4.90)#186 | 14.8%(-1.30)#7,866 |
| 26. | 80214 | 12.6% | 18.4%(-5.80)#197 | 14.8%(-2.20)#8,491 |
| 27. | 80231 | 12.5% | 18.4%(-5.90)#199 | 14.8%(-2.30)#8,561 |
| 28. | 80235 | 11.8% | 18.4%(-6.60)#209 | 14.8%(-3.00)#9,132 |
| 29. | 80216 | 9.8% | 18.4%(-8.60)#242 | 14.8%(-5.00)#11,007 |
| 30. | 80226 | 9.2% | 18.4%(-9.20)#252 | 14.8%(-5.60)#11,651 |
| 31. | 80221 | 8.1% | 18.4%(-10.3)#274 | 14.8%(-6.70)#13,037 |
| 32. | 80233 | 6.0% | 18.4%(-12.4)#315 | 14.8%(-8.80)#16,422 |
| 33. | 80249 | 5.8% | 18.4%(-12.6)#326 | 14.8%(-9.00)#16,782 |
| 34. | 80219 | 4.9% | 18.4%(-13.5)#345 | 14.8%(-9.90)#18,591 |
| 35. | 80247 | 4.5% | 18.4%(-13.9)#356 | 14.8%(-10.3)#19,386 |
| 36. | 80229 | 4.3% | 18.4%(-14.1)#359 | 14.8%(-10.5)#19,751 |
| 37. | 80260 | 4.0% | 18.4%(-14.4)#368 | 14.8%(-10.8)#20,391 |
| 38. | 80239 | 3.8% | 18.4%(-14.6)#374 | 14.8%(-11.0)#20,826 |
1
Common Questions
What are the Top 10 Zip Codes with the Highest Percentage of Families with Income Above $200,000 in Denver, CO?
Top 10 Zip Codes with the Highest Percentage of Families with Income Above $200,000 in Denver, CO are:
What zip code has the Highest Percentage of Families with Income Above $200,000 in Denver, CO?
80238 has the Highest Percentage of Families with Income Above $200,000 in Denver, CO with 45.3%.
What is the Percentage of Families with Income Above $200,000 in Denver, CO?
Percentage of Families with Income Above $200,000 in Denver is 22.5%.
What is the Percentage of Families with Income Above $200,000 in Colorado?
Percentage of Families with Income Above $200,000 in Colorado is 18.4%.
What is the Percentage of Families with Income Above $200,000 in the United States?
Percentage of Families with Income Above $200,000 in the United States is 14.8%.