Timnath, CO Map & Demographics
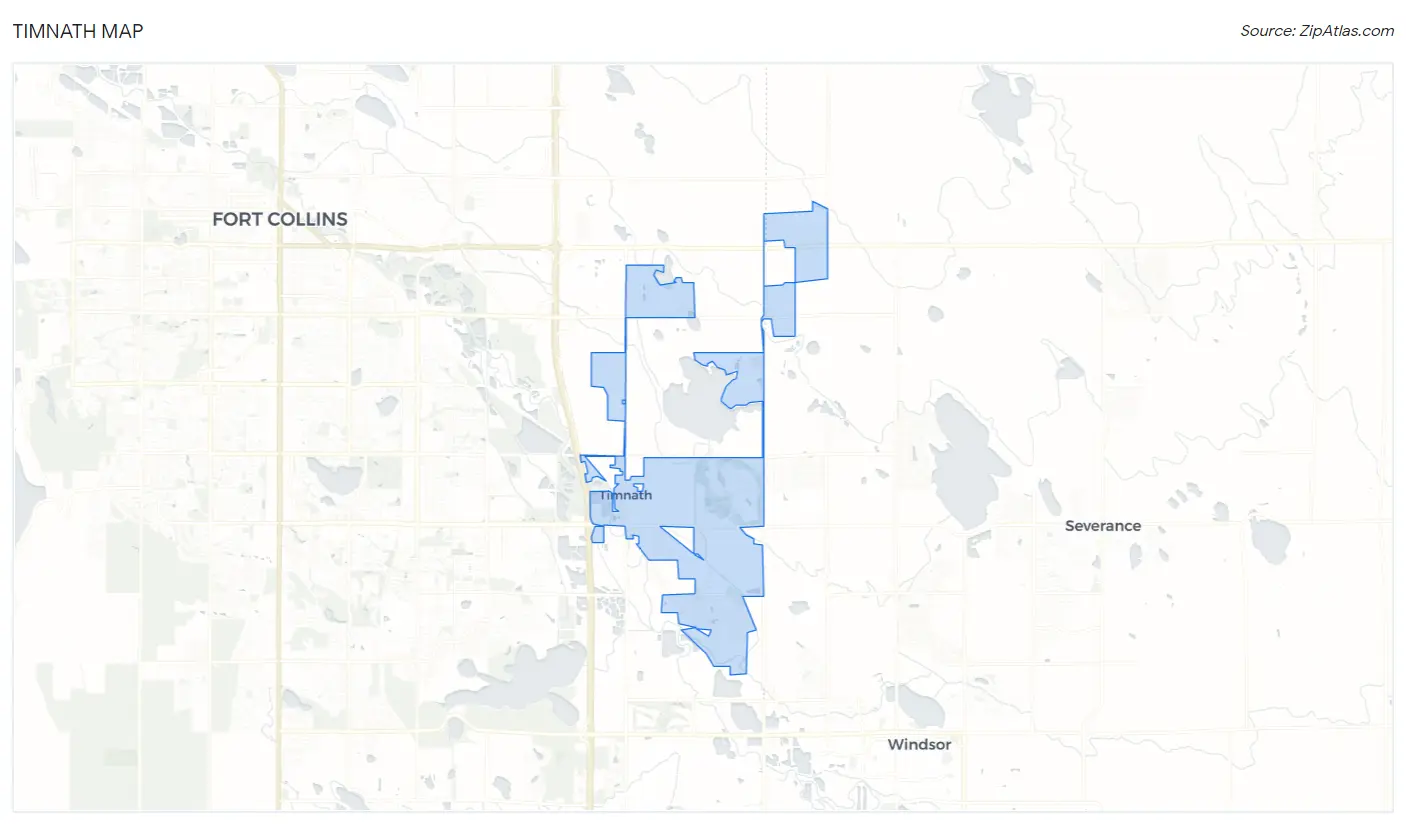
Timnath Map
Timnath Overview
$79,715
PER CAPITA INCOME
$169,082
AVG FAMILY INCOME
$162,976
AVG HOUSEHOLD INCOME
43.5%
WAGE / INCOME GAP [ % ]
56.5¢/ $1
WAGE / INCOME GAP [ $ ]
0.45
INEQUALITY / GINI INDEX
7,122
TOTAL POPULATION
3,352
MALE POPULATION
3,770
FEMALE POPULATION
88.91
MALES / 100 FEMALES
112.47
FEMALES / 100 MALES
36.2
MEDIAN AGE
3.2
AVG FAMILY SIZE
3.0
AVG HOUSEHOLD SIZE
3,420
LABOR FORCE [ PEOPLE ]
68.5%
PERCENT IN LABOR FORCE
0.9%
UNEMPLOYMENT RATE
Timnath Zip Codes
Timnath Area Codes
Income in Timnath
Income Overview in Timnath
Per Capita Income in Timnath is $79,715, while median incomes of families and households are $169,082 and $162,976 respectively.
| Characteristic | Number | Measure |
| Per Capita Income | 7,122 | $79,715 |
| Median Family Income | 2,074 | $169,082 |
| Mean Family Income | 2,074 | $255,400 |
| Median Household Income | 2,393 | $162,976 |
| Mean Household Income | 2,393 | $230,454 |
| Income Deficit | 2,074 | $0 |
| Wage / Income Gap (%) | 7,122 | 43.49% |
| Wage / Income Gap ($) | 7,122 | 56.51¢ per $1 |
| Gini / Inequality Index | 7,122 | 0.45 |
Earnings by Sex in Timnath
Average Earnings in Timnath are $74,645, $100,713 for men and $56,917 for women, a difference of 43.5%.
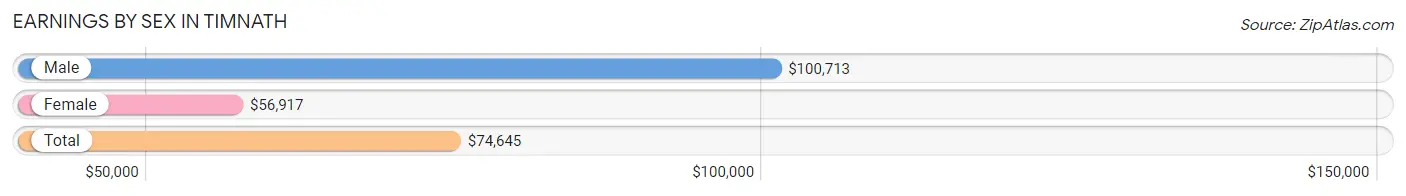
| Sex | Number | Average Earnings |
| Male | 1,977 (54.4%) | $100,713 |
| Female | 1,660 (45.6%) | $56,917 |
| Total | 3,637 (100.0%) | $74,645 |
Earnings by Sex by Income Bracket in Timnath
The most common earnings brackets in Timnath are $100,000+ for men (1,033 | 52.2%) and $100,000+ for women (254 | 15.3%).
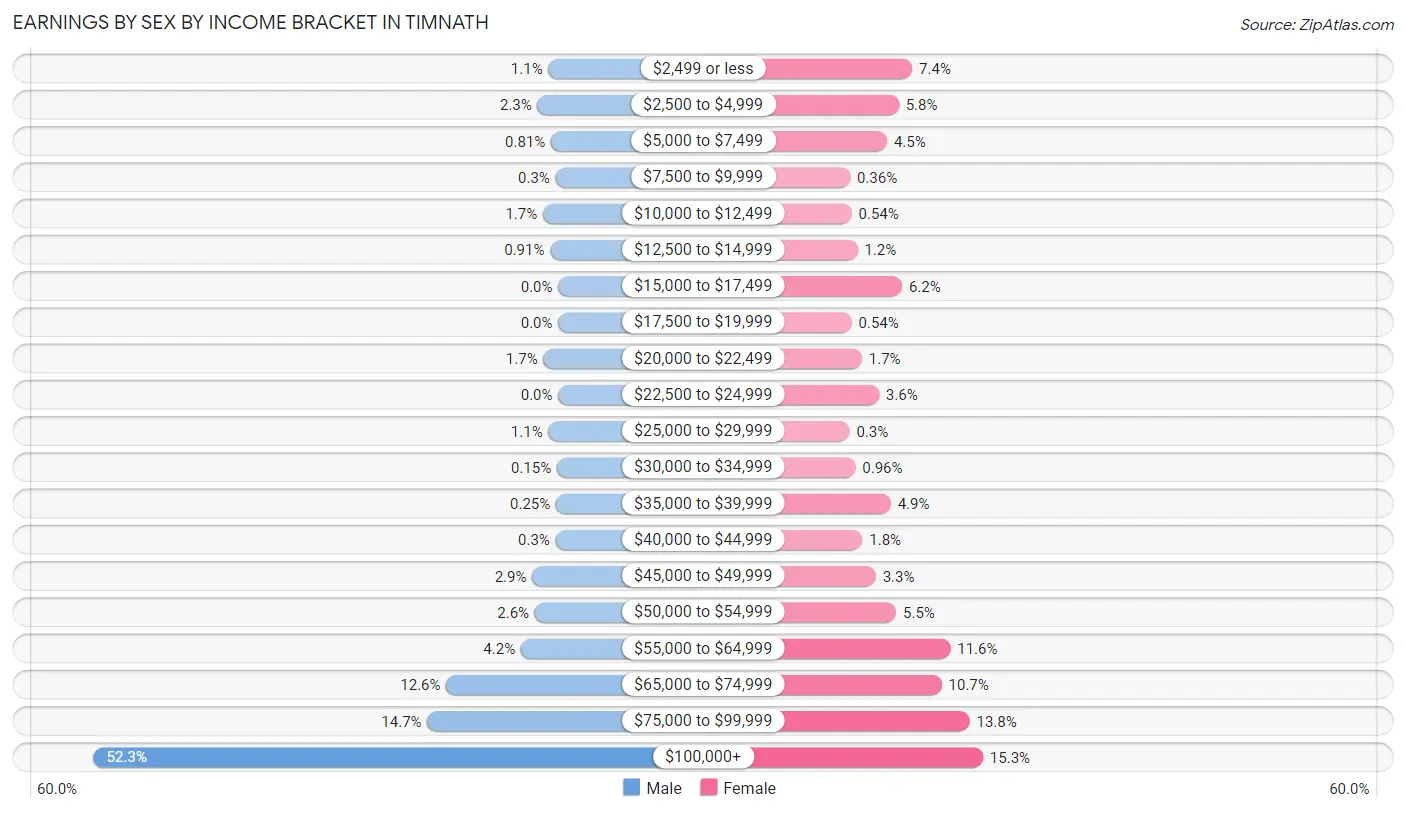
| Income | Male | Female |
| $2,499 or less | 22 (1.1%) | 122 (7.3%) |
| $2,500 to $4,999 | 46 (2.3%) | 97 (5.8%) |
| $5,000 to $7,499 | 16 (0.8%) | 75 (4.5%) |
| $7,500 to $9,999 | 6 (0.3%) | 6 (0.4%) |
| $10,000 to $12,499 | 34 (1.7%) | 9 (0.5%) |
| $12,500 to $14,999 | 18 (0.9%) | 20 (1.2%) |
| $15,000 to $17,499 | 0 (0.0%) | 103 (6.2%) |
| $17,500 to $19,999 | 0 (0.0%) | 9 (0.5%) |
| $20,000 to $22,499 | 33 (1.7%) | 28 (1.7%) |
| $22,500 to $24,999 | 0 (0.0%) | 60 (3.6%) |
| $25,000 to $29,999 | 22 (1.1%) | 5 (0.3%) |
| $30,000 to $34,999 | 3 (0.2%) | 16 (1.0%) |
| $35,000 to $39,999 | 5 (0.3%) | 82 (4.9%) |
| $40,000 to $44,999 | 6 (0.3%) | 29 (1.8%) |
| $45,000 to $49,999 | 58 (2.9%) | 54 (3.3%) |
| $50,000 to $54,999 | 52 (2.6%) | 92 (5.5%) |
| $55,000 to $64,999 | 83 (4.2%) | 193 (11.6%) |
| $65,000 to $74,999 | 249 (12.6%) | 177 (10.7%) |
| $75,000 to $99,999 | 291 (14.7%) | 229 (13.8%) |
| $100,000+ | 1,033 (52.2%) | 254 (15.3%) |
| Total | 1,977 (100.0%) | 1,660 (100.0%) |
Earnings by Sex by Educational Attainment in Timnath
Average earnings in Timnath are $101,739 for men and $59,079 for women, a difference of 41.9%. Men with an educational attainment of graduate degree enjoy the highest average annual earnings of $190,635, while those with high school diploma education earn the least with $62,607. Women with an educational attainment of bachelor's degree earn the most with the average annual earnings of $66,141, while those with college or associate's degree education have the smallest earnings of $37,953.
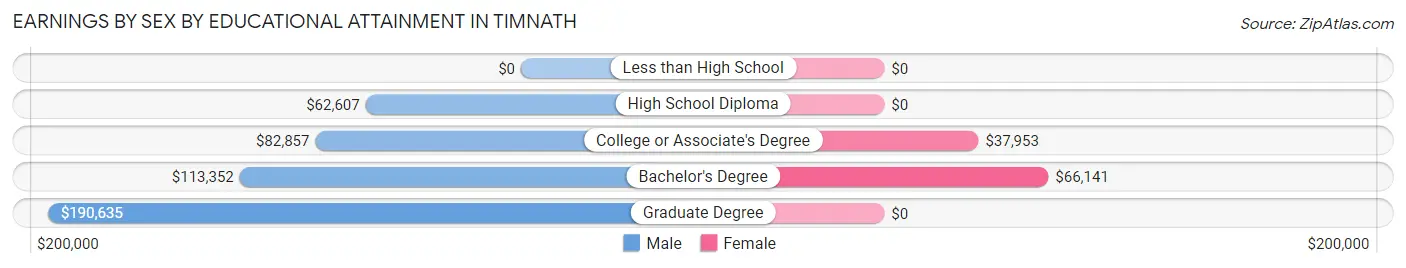
| Educational Attainment | Male Income | Female Income |
| Less than High School | - | - |
| High School Diploma | $62,607 | $0 |
| College or Associate's Degree | $82,857 | $37,953 |
| Bachelor's Degree | $113,352 | $66,141 |
| Graduate Degree | $190,635 | $0 |
| Total | $101,739 | $59,079 |
Family Income in Timnath
Family Income Brackets in Timnath
According to the Timnath family income data, there are 908 families falling into the $200,000+ income range, which is the most common income bracket and makes up 43.8% of all families.
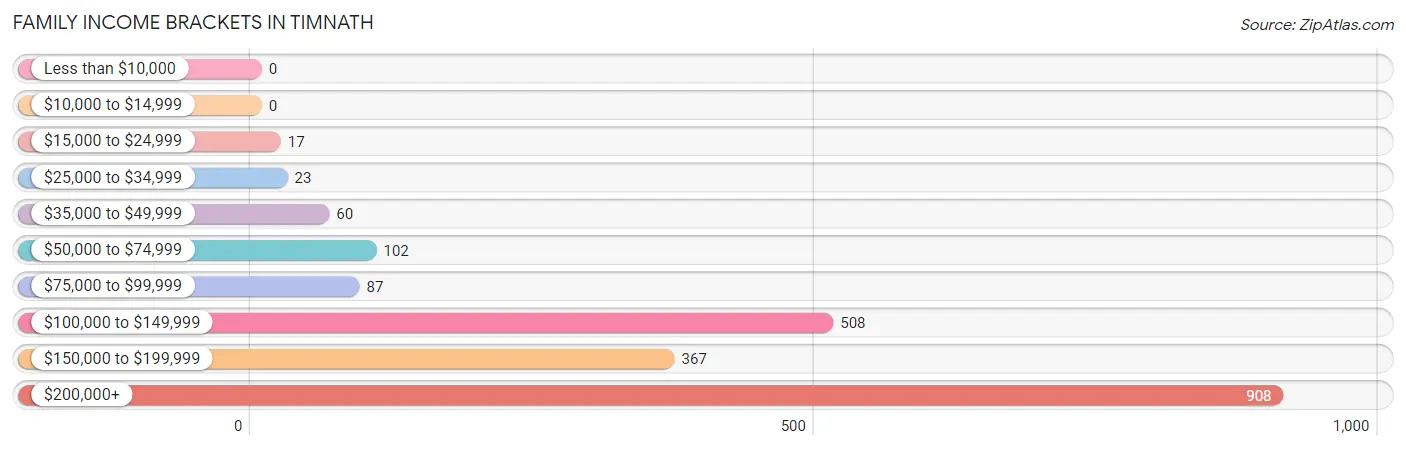
| Income Bracket | # Families | % Families |
| Less than $10,000 | 0 | 0.0% |
| $10,000 to $14,999 | 0 | 0.0% |
| $15,000 to $24,999 | 17 | 0.8% |
| $25,000 to $34,999 | 23 | 1.1% |
| $35,000 to $49,999 | 60 | 2.9% |
| $50,000 to $74,999 | 102 | 4.9% |
| $75,000 to $99,999 | 87 | 4.2% |
| $100,000 to $149,999 | 508 | 24.5% |
| $150,000 to $199,999 | 367 | 17.7% |
| $200,000+ | 908 | 43.8% |
Family Income by Famaliy Size in Timnath
6-person families (118 | 5.7%) account for the highest median family income in Timnath with $250,001 per family, while 2-person families (787 | 38.0%) have the highest median income of $73,362 per family member.
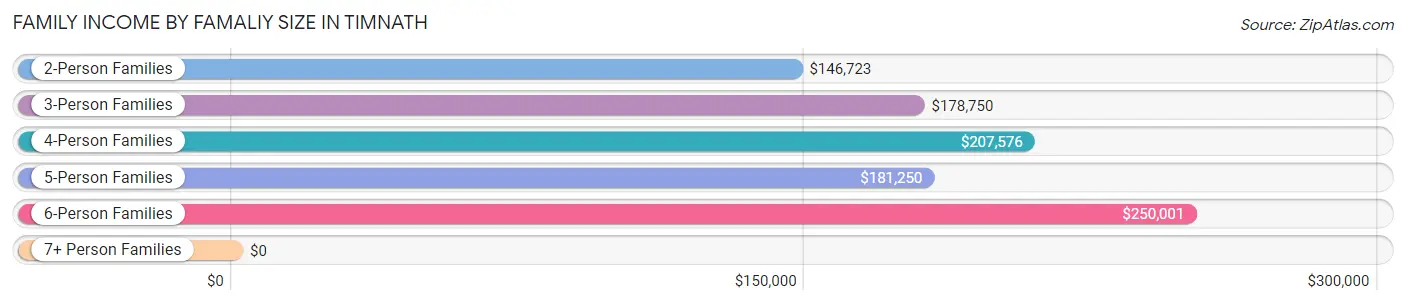
| Income Bracket | # Families | Median Income |
| 2-Person Families | 787 (38.0%) | $146,723 |
| 3-Person Families | 336 (16.2%) | $178,750 |
| 4-Person Families | 606 (29.2%) | $207,576 |
| 5-Person Families | 223 (10.7%) | $181,250 |
| 6-Person Families | 118 (5.7%) | $250,001 |
| 7+ Person Families | 4 (0.2%) | $0 |
| Total | 2,074 (100.0%) | $169,082 |
Family Income by Number of Earners in Timnath
The median family income in Timnath is $169,082, with families comprising 3+ earners (182) having the highest median family income of $241,477, while families with no earners (304) have the lowest median family income of $145,089, accounting for 8.8% and 14.7% of families, respectively.
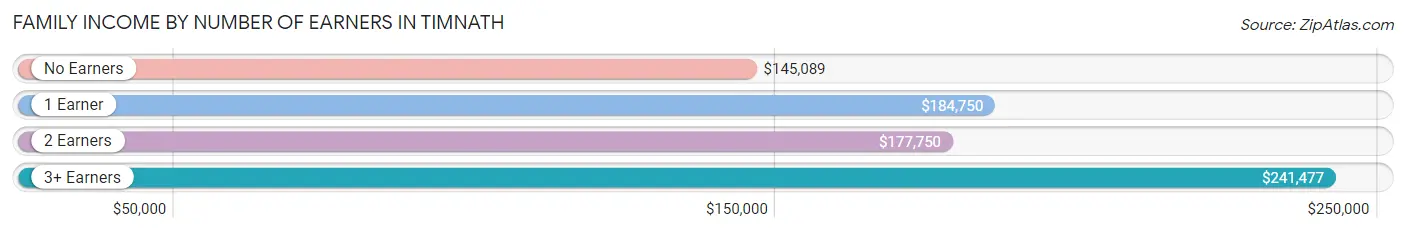
| Number of Earners | # Families | Median Income |
| No Earners | 304 (14.7%) | $145,089 |
| 1 Earner | 450 (21.7%) | $184,750 |
| 2 Earners | 1,138 (54.9%) | $177,750 |
| 3+ Earners | 182 (8.8%) | $241,477 |
| Total | 2,074 (100.0%) | $169,082 |
Household Income in Timnath
Household Income Brackets in Timnath
With 917 households falling in the category, the $200,000+ income range is the most frequent in Timnath, accounting for 38.3% of all households. In contrast, only 22 households (0.9%) fall into the $25,000 to $34,999 income bracket, making it the least populous group.
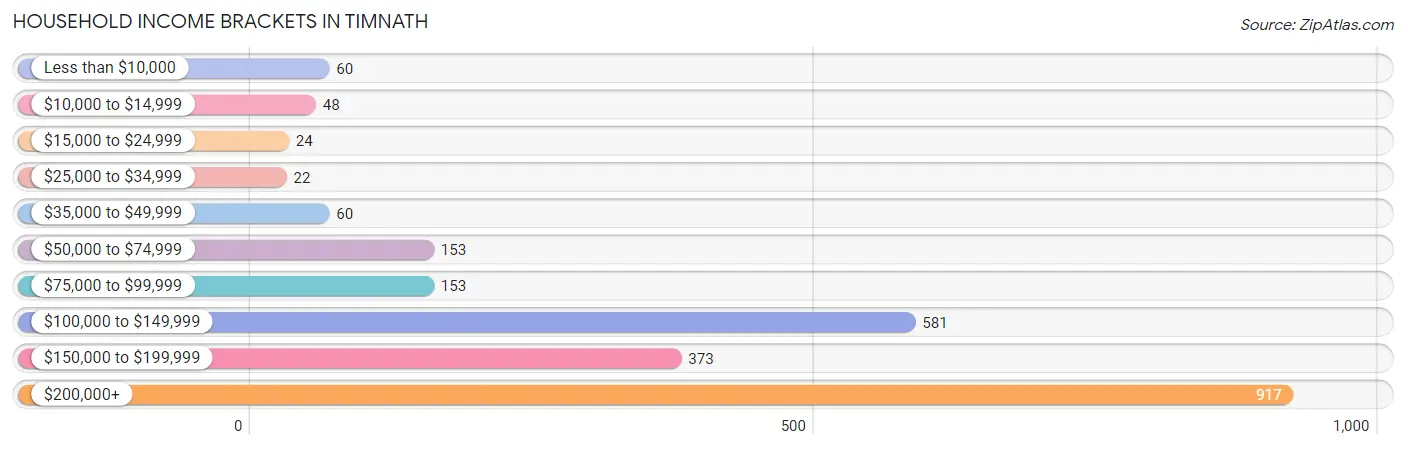
| Income Bracket | # Households | % Households |
| Less than $10,000 | 60 | 2.5% |
| $10,000 to $14,999 | 48 | 2.0% |
| $15,000 to $24,999 | 24 | 1.0% |
| $25,000 to $34,999 | 22 | 0.9% |
| $35,000 to $49,999 | 60 | 2.5% |
| $50,000 to $74,999 | 153 | 6.4% |
| $75,000 to $99,999 | 153 | 6.4% |
| $100,000 to $149,999 | 581 | 24.3% |
| $150,000 to $199,999 | 373 | 15.6% |
| $200,000+ | 917 | 38.3% |
Household Income by Householder Age in Timnath
The median household income in Timnath is $162,976, with the highest median household income of $250,001 found in the 45 to 64 years age bracket for the primary householder. A total of 800 households (33.4%) fall into this category. Meanwhile, the 15 to 24 years age bracket for the primary householder has the lowest median household income of $0, with 10 households (0.4%) in this group.
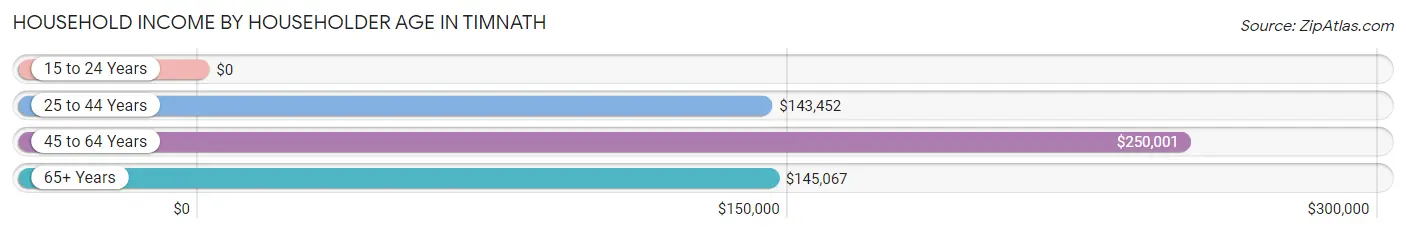
| Income Bracket | # Households | Median Income |
| 15 to 24 Years | 10 (0.4%) | $0 |
| 25 to 44 Years | 1,002 (41.9%) | $143,452 |
| 45 to 64 Years | 800 (33.4%) | $250,001 |
| 65+ Years | 581 (24.3%) | $145,067 |
| Total | 2,393 (100.0%) | $162,976 |
Poverty in Timnath
Income Below Poverty by Sex and Age in Timnath
With 2.7% poverty level for males and 5.1% for females among the residents of Timnath, under 5 year old males and 75 year old and over females are the most vulnerable to poverty, with 40 males (18.3%) and 18 females (38.3%) in their respective age groups living below the poverty level.
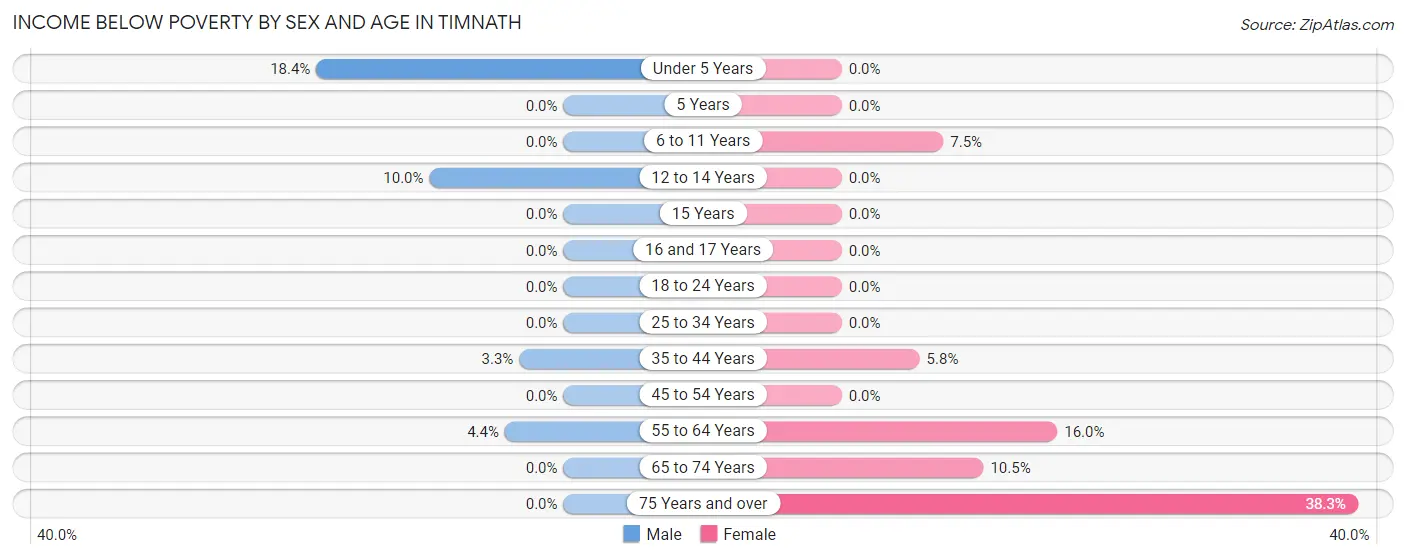
| Age Bracket | Male | Female |
| Under 5 Years | 40 (18.3%) | 0 (0.0%) |
| 5 Years | 0 (0.0%) | 0 (0.0%) |
| 6 to 11 Years | 0 (0.0%) | 43 (7.5%) |
| 12 to 14 Years | 22 (10.0%) | 0 (0.0%) |
| 15 Years | 0 (0.0%) | 0 (0.0%) |
| 16 and 17 Years | 0 (0.0%) | 0 (0.0%) |
| 18 to 24 Years | 0 (0.0%) | 0 (0.0%) |
| 25 to 34 Years | 0 (0.0%) | 0 (0.0%) |
| 35 to 44 Years | 22 (3.3%) | 45 (5.8%) |
| 45 to 54 Years | 0 (0.0%) | 0 (0.0%) |
| 55 to 64 Years | 7 (4.3%) | 36 (16.0%) |
| 65 to 74 Years | 0 (0.0%) | 49 (10.5%) |
| 75 Years and over | 0 (0.0%) | 18 (38.3%) |
| Total | 91 (2.7%) | 191 (5.1%) |
Income Above Poverty by Sex and Age in Timnath
According to the poverty statistics in Timnath, males aged 5 years and females aged under 5 years are the age groups that are most secure financially, with 100.0% of males and 100.0% of females in these age groups living above the poverty line.
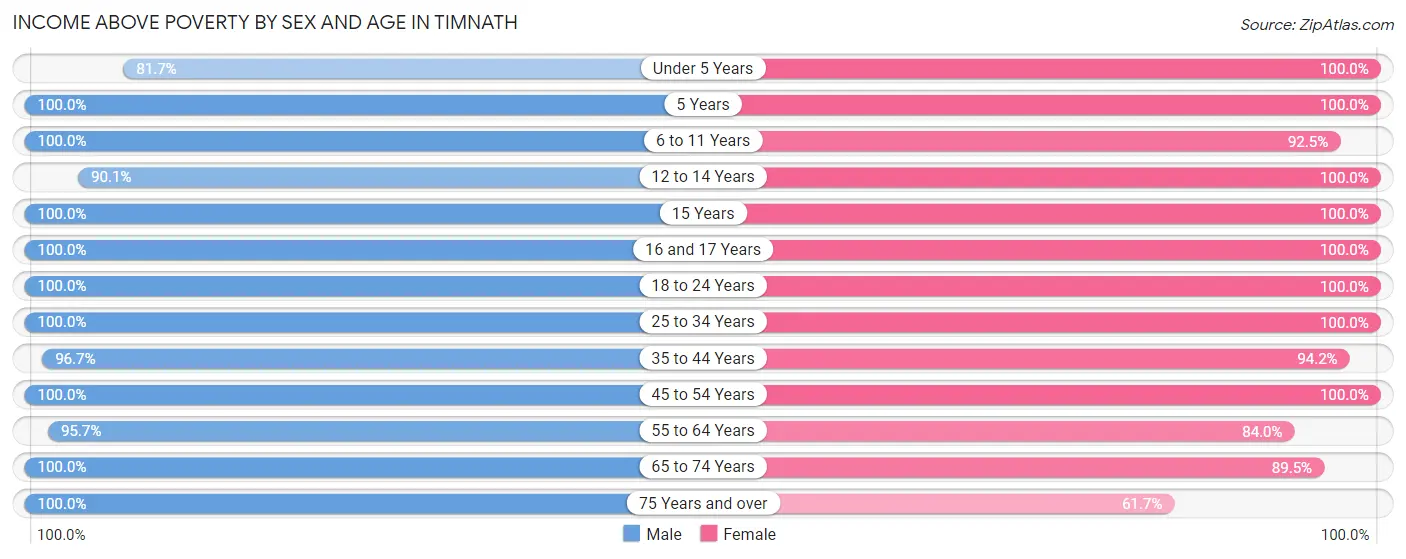
| Age Bracket | Male | Female |
| Under 5 Years | 178 (81.7%) | 268 (100.0%) |
| 5 Years | 43 (100.0%) | 144 (100.0%) |
| 6 to 11 Years | 317 (100.0%) | 527 (92.5%) |
| 12 to 14 Years | 199 (90.0%) | 136 (100.0%) |
| 15 Years | 129 (100.0%) | 83 (100.0%) |
| 16 and 17 Years | 70 (100.0%) | 163 (100.0%) |
| 18 to 24 Years | 113 (100.0%) | 127 (100.0%) |
| 25 to 34 Years | 305 (100.0%) | 362 (100.0%) |
| 35 to 44 Years | 648 (96.7%) | 734 (94.2%) |
| 45 to 54 Years | 588 (100.0%) | 400 (100.0%) |
| 55 to 64 Years | 154 (95.7%) | 189 (84.0%) |
| 65 to 74 Years | 419 (100.0%) | 417 (89.5%) |
| 75 Years and over | 98 (100.0%) | 29 (61.7%) |
| Total | 3,261 (97.3%) | 3,579 (94.9%) |
Income Below Poverty Among Married-Couple Families in Timnath
The poverty statistics for married-couple families in Timnath show that 1.1% or 22 of the total 1,985 families live below the poverty line. Families with 3 or 4 children have the highest poverty rate of 7.5%, comprising of 22 families. On the other hand, families with no children have the lowest poverty rate of 0.0%, which includes 0 families.
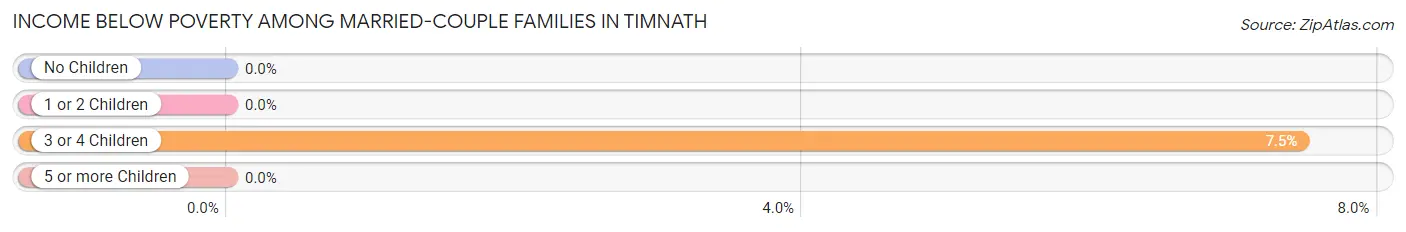
| Children | Above Poverty | Below Poverty |
| No Children | 816 (100.0%) | 0 (0.0%) |
| 1 or 2 Children | 870 (100.0%) | 0 (0.0%) |
| 3 or 4 Children | 273 (92.5%) | 22 (7.5%) |
| 5 or more Children | 4 (100.0%) | 0 (0.0%) |
| Total | 1,963 (98.9%) | 22 (1.1%) |
Income Below Poverty Among Single-Parent Households in Timnath
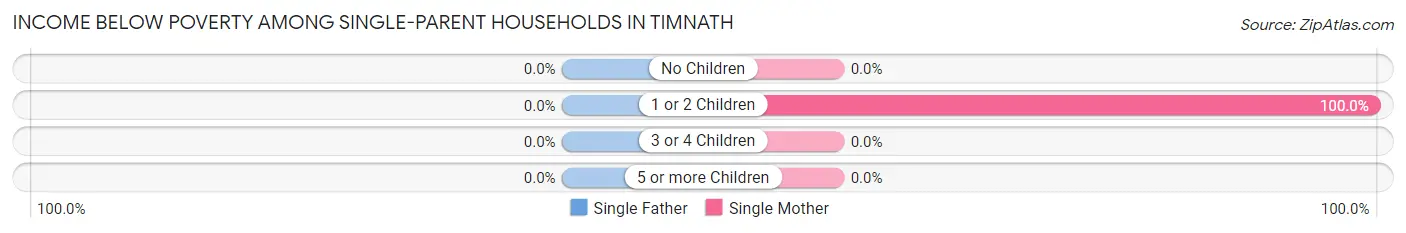
| Children | Single Father | Single Mother |
| No Children | 0 (0.0%) | 0 (0.0%) |
| 1 or 2 Children | 0 (0.0%) | 17 (100.0%) |
| 3 or 4 Children | 0 (0.0%) | 0 (0.0%) |
| 5 or more Children | 0 (0.0%) | 0 (0.0%) |
| Total | 0 (0.0%) | 17 (89.5%) |
Income Below Poverty Among Married-Couple vs Single-Parent Households in Timnath
The poverty data for Timnath shows that 22 of the married-couple family households (1.1%) and 17 of the single-parent households (19.1%) are living below the poverty level. Within the married-couple family households, those with 3 or 4 children have the highest poverty rate, with 22 households (7.5%) falling below the poverty line. Among the single-parent households, those with 1 or 2 children have the highest poverty rate, with 17 household (19.5%) living below poverty.
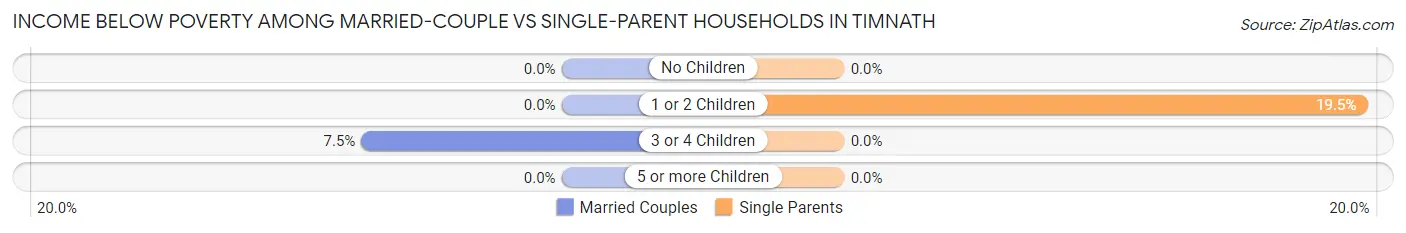
| Children | Married-Couple Families | Single-Parent Households |
| No Children | 0 (0.0%) | 0 (0.0%) |
| 1 or 2 Children | 0 (0.0%) | 17 (19.5%) |
| 3 or 4 Children | 22 (7.5%) | 0 (0.0%) |
| 5 or more Children | 0 (0.0%) | 0 (0.0%) |
| Total | 22 (1.1%) | 17 (19.1%) |
Race in Timnath
The most populous races in Timnath are White / Caucasian (6,584 | 92.4%), Two or more Races (252 | 3.5%), and Some other Race (148 | 2.1%).
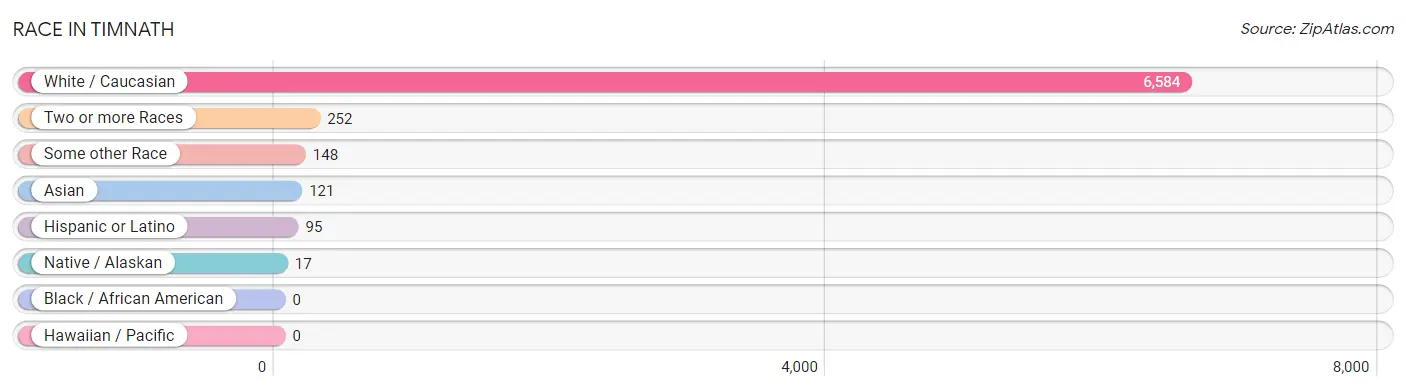
| Race | # Population | % Population |
| Asian | 121 | 1.7% |
| Black / African American | 0 | 0.0% |
| Hawaiian / Pacific | 0 | 0.0% |
| Hispanic or Latino | 95 | 1.3% |
| Native / Alaskan | 17 | 0.2% |
| White / Caucasian | 6,584 | 92.4% |
| Two or more Races | 252 | 3.5% |
| Some other Race | 148 | 2.1% |
| Total | 7,122 | 100.0% |
Ancestry in Timnath
The most populous ancestries reported in Timnath are German (2,396 | 33.6%), English (1,891 | 26.6%), Irish (1,126 | 15.8%), American (525 | 7.4%), and European (275 | 3.9%), together accounting for 87.2% of all Timnath residents.
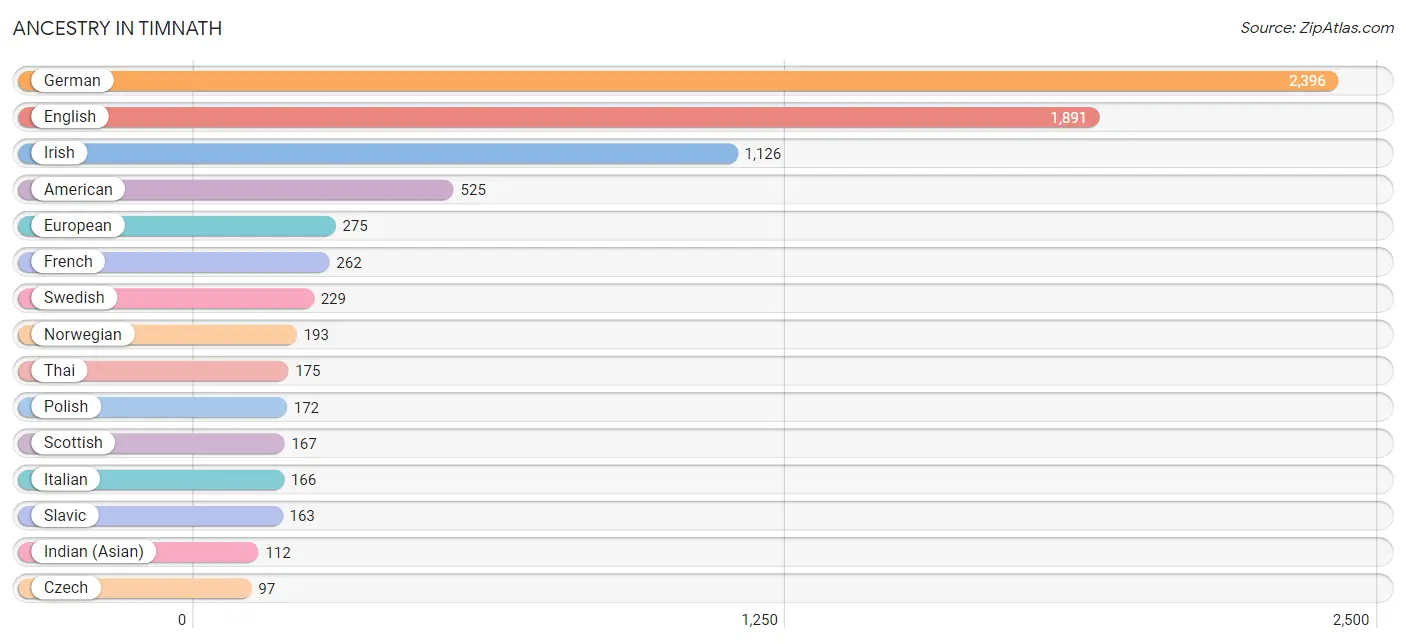
| Ancestry | # Population | % Population |
| African | 26 | 0.4% |
| American | 525 | 7.4% |
| Arab | 44 | 0.6% |
| Austrian | 41 | 0.6% |
| Burmese | 5 | 0.1% |
| Cherokee | 17 | 0.2% |
| Czech | 97 | 1.4% |
| Danish | 26 | 0.4% |
| Dutch | 85 | 1.2% |
| English | 1,891 | 26.6% |
| European | 275 | 3.9% |
| French | 262 | 3.7% |
| French Canadian | 55 | 0.8% |
| German | 2,396 | 33.6% |
| Hungarian | 31 | 0.4% |
| Indian (Asian) | 112 | 1.6% |
| Iraqi | 44 | 0.6% |
| Irish | 1,126 | 15.8% |
| Italian | 166 | 2.3% |
| New Zealander | 19 | 0.3% |
| Northern European | 18 | 0.3% |
| Norwegian | 193 | 2.7% |
| Polish | 172 | 2.4% |
| Romanian | 33 | 0.5% |
| Russian | 60 | 0.8% |
| Scandinavian | 8 | 0.1% |
| Scotch-Irish | 65 | 0.9% |
| Scottish | 167 | 2.3% |
| Serbian | 2 | 0.0% |
| Slavic | 163 | 2.3% |
| South American | 26 | 0.4% |
| Spanish | 69 | 1.0% |
| Sri Lankan | 8 | 0.1% |
| Subsaharan African | 26 | 0.4% |
| Swedish | 229 | 3.2% |
| Swiss | 8 | 0.1% |
| Thai | 175 | 2.5% |
| Ukrainian | 7 | 0.1% |
| Venezuelan | 26 | 0.4% |
| Welsh | 15 | 0.2% |
| West Indian | 10 | 0.1% | View All 41 Rows |
Immigrants in Timnath
The most numerous immigrant groups reported in Timnath came from Europe (120 | 1.7%), Western Europe (89 | 1.3%), Asia (80 | 1.1%), Germany (67 | 0.9%), and Iraq (38 | 0.5%), together accounting for 5.5% of all Timnath residents.
| Immigration Origin | # Population | % Population |
| Asia | 80 | 1.1% |
| Canada | 7 | 0.1% |
| Eastern Asia | 5 | 0.1% |
| England | 19 | 0.3% |
| Europe | 120 | 1.7% |
| Germany | 67 | 0.9% |
| India | 29 | 0.4% |
| Iraq | 38 | 0.5% |
| Korea | 5 | 0.1% |
| Latin America | 26 | 0.4% |
| Netherlands | 22 | 0.3% |
| Northern Europe | 31 | 0.4% |
| South America | 26 | 0.4% |
| South Central Asia | 29 | 0.4% |
| South Eastern Asia | 8 | 0.1% |
| Sweden | 12 | 0.2% |
| Venezuela | 26 | 0.4% |
| Vietnam | 8 | 0.1% |
| Western Asia | 38 | 0.5% |
| Western Europe | 89 | 1.3% | View All 20 Rows |
Sex and Age in Timnath
Sex and Age in Timnath
The most populous age groups in Timnath are 45 to 49 Years (360 | 10.7%) for men and 35 to 39 Years (460 | 12.2%) for women.
| Age Bracket | Male | Female |
| Under 5 Years | 218 (6.5%) | 268 (7.1%) |
| 5 to 9 Years | 314 (9.4%) | 457 (12.1%) |
| 10 to 14 Years | 267 (8.0%) | 393 (10.4%) |
| 15 to 19 Years | 252 (7.5%) | 303 (8.0%) |
| 20 to 24 Years | 60 (1.8%) | 70 (1.9%) |
| 25 to 29 Years | 29 (0.9%) | 45 (1.2%) |
| 30 to 34 Years | 276 (8.2%) | 317 (8.4%) |
| 35 to 39 Years | 349 (10.4%) | 460 (12.2%) |
| 40 to 44 Years | 321 (9.6%) | 319 (8.5%) |
| 45 to 49 Years | 360 (10.7%) | 295 (7.8%) |
| 50 to 54 Years | 228 (6.8%) | 105 (2.8%) |
| 55 to 59 Years | 78 (2.3%) | 128 (3.4%) |
| 60 to 64 Years | 83 (2.5%) | 97 (2.6%) |
| 65 to 69 Years | 171 (5.1%) | 321 (8.5%) |
| 70 to 74 Years | 248 (7.4%) | 145 (3.8%) |
| 75 to 79 Years | 94 (2.8%) | 36 (0.9%) |
| 80 to 84 Years | 4 (0.1%) | 6 (0.2%) |
| 85 Years and over | 0 (0.0%) | 5 (0.1%) |
| Total | 3,352 (100.0%) | 3,770 (100.0%) |
Families and Households in Timnath
Median Family Size in Timnath
The median family size in Timnath is 3.23 persons per family, with married-couple families (1,985 | 95.7%) accounting for the largest median family size of 3.27 persons per family. On the other hand, single male/father families (70 | 3.4%) represent the smallest median family size with 1.99 persons per family.
| Family Type | # Families | Family Size |
| Married-Couple | 1,985 (95.7%) | 3.27 |
| Single Male/Father | 70 (3.4%) | 1.99 |
| Single Female/Mother | 19 (0.9%) | 3.00 |
| Total Families | 2,074 (100.0%) | 3.23 |
Median Household Size in Timnath
The median household size in Timnath is 2.98 persons per household, with married-couple households (1,985 | 83.0%) accounting for the largest median household size of 3.28 persons per household. non-family households (319 | 13.3%) represent the smallest median household size with 1.11 persons per household.
| Household Type | # Households | Household Size |
| Married-Couple | 1,985 (83.0%) | 3.28 |
| Single Male/Father | 70 (2.9%) | 2.96 |
| Single Female/Mother | 19 (0.8%) | 3.05 |
| Non-family | 319 (13.3%) | 1.11 |
| Total Households | 2,393 (100.0%) | 2.98 |
Household Size by Marriage Status in Timnath
Out of a total of 2,393 households in Timnath, 2,074 (86.7%) are family households, while 319 (13.3%) are nonfamily households. The most numerous type of family households are 2-person households, comprising 727, and the most common type of nonfamily households are 1-person households, comprising 276.
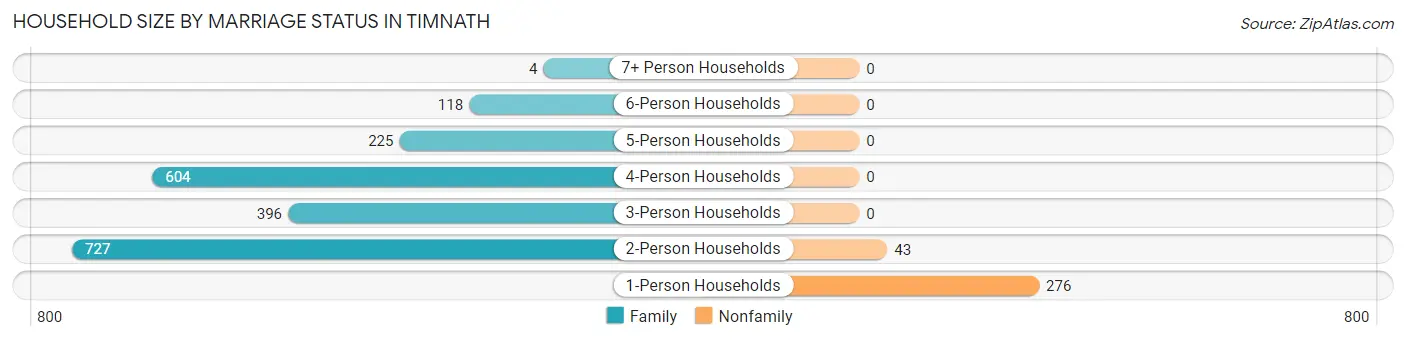
| Household Size | Family Households | Nonfamily Households |
| 1-Person Households | - | 276 (11.5%) |
| 2-Person Households | 727 (30.4%) | 43 (1.8%) |
| 3-Person Households | 396 (16.6%) | 0 (0.0%) |
| 4-Person Households | 604 (25.2%) | 0 (0.0%) |
| 5-Person Households | 225 (9.4%) | 0 (0.0%) |
| 6-Person Households | 118 (4.9%) | 0 (0.0%) |
| 7+ Person Households | 4 (0.2%) | 0 (0.0%) |
| Total | 2,074 (86.7%) | 319 (13.3%) |
Female Fertility in Timnath
Fertility by Age in Timnath
Average fertility rate in Timnath is 76.0 births per 1,000 women. Women in the age bracket of 20 to 34 years have the highest fertility rate with 104.0 births per 1,000 women. Women in the age bracket of 35 to 50 years acount for 68.3% of all women with births.
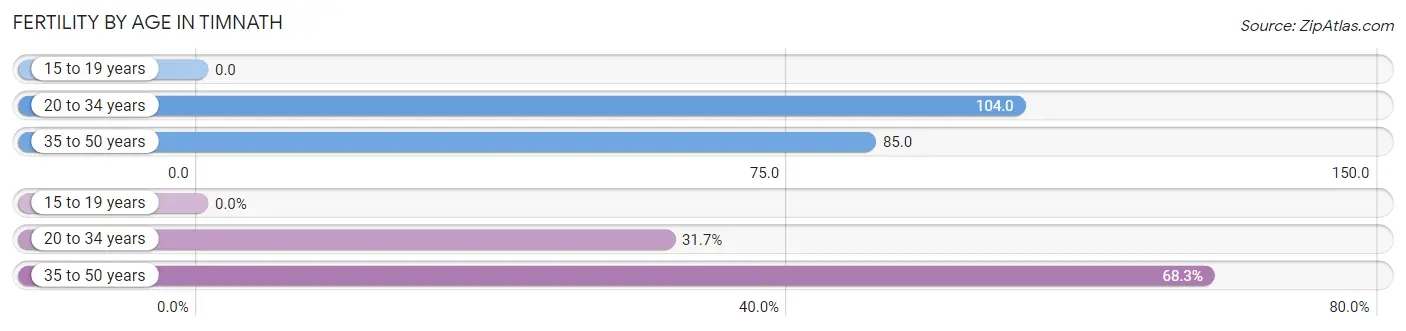
| Age Bracket | Women with Births | Births / 1,000 Women |
| 15 to 19 years | 0 (0.0%) | 0.0 |
| 20 to 34 years | 45 (31.7%) | 104.0 |
| 35 to 50 years | 97 (68.3%) | 85.0 |
| Total | 142 (100.0%) | 76.0 |
Fertility by Age by Marriage Status in Timnath
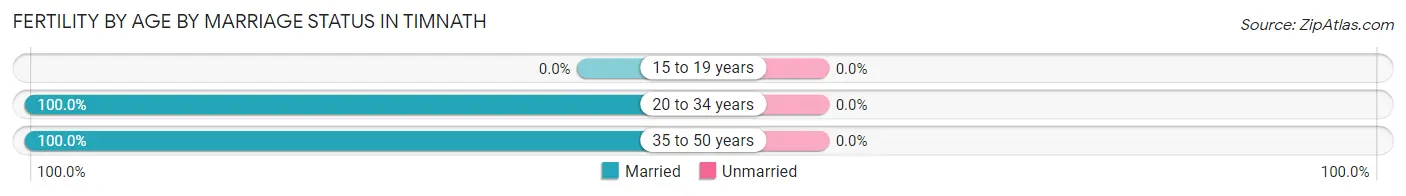
| Age Bracket | Married | Unmarried |
| 15 to 19 years | 0 (0.0%) | 0 (0.0%) |
| 20 to 34 years | 45 (100.0%) | 0 (0.0%) |
| 35 to 50 years | 97 (100.0%) | 0 (0.0%) |
| Total | 142 (100.0%) | 0 (0.0%) |
Fertility by Education in Timnath
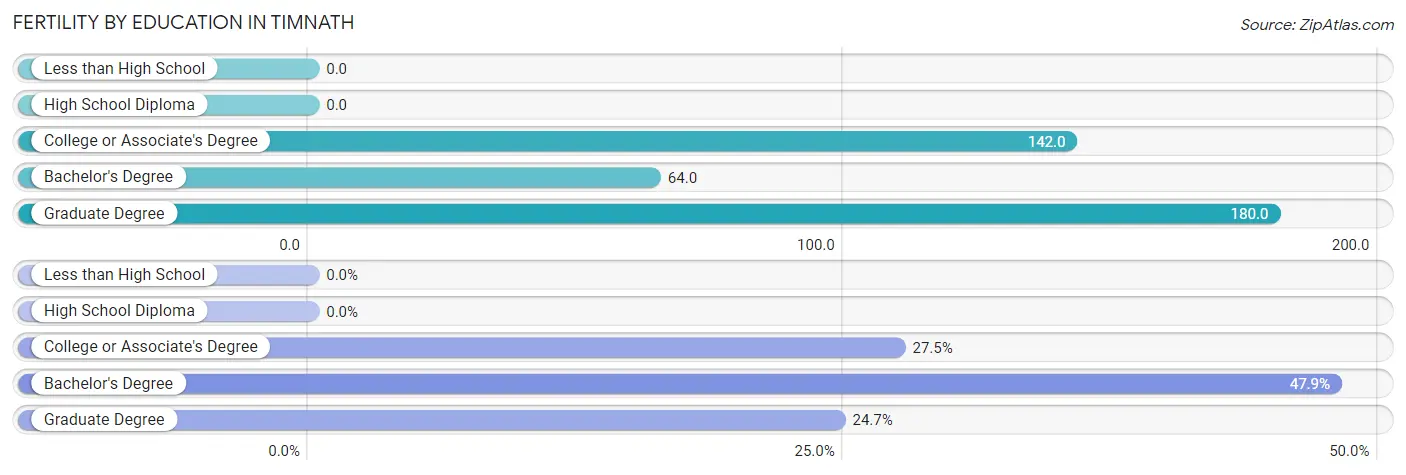
| Educational Attainment | Women with Births | Births / 1,000 Women |
| Less than High School | 0 (0.0%) | 0.0 |
| High School Diploma | 0 (0.0%) | 0.0 |
| College or Associate's Degree | 39 (27.5%) | 142.0 |
| Bachelor's Degree | 68 (47.9%) | 64.0 |
| Graduate Degree | 35 (24.6%) | 180.0 |
| Total | 142 (100.0%) | 76.0 |
Fertility by Education by Marriage Status in Timnath
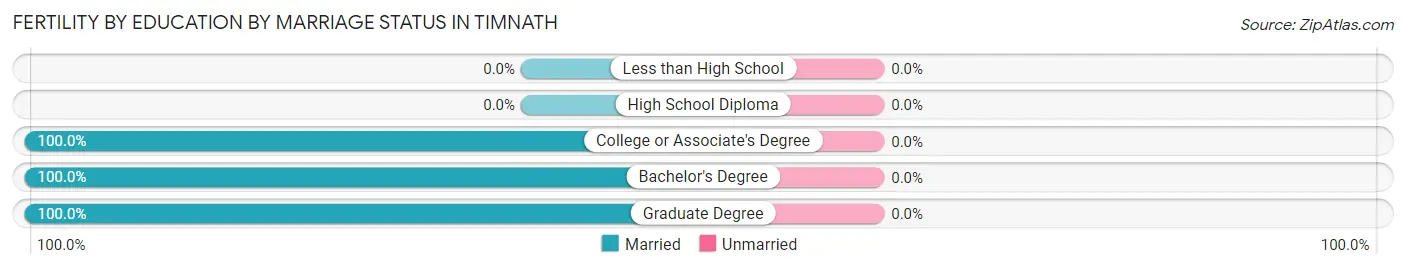
| Educational Attainment | Married | Unmarried |
| Less than High School | 0 (0.0%) | 0 (0.0%) |
| High School Diploma | 0 (0.0%) | 0 (0.0%) |
| College or Associate's Degree | 39 (100.0%) | 0 (0.0%) |
| Bachelor's Degree | 68 (100.0%) | 0 (0.0%) |
| Graduate Degree | 35 (100.0%) | 0 (0.0%) |
| Total | 142 (100.0%) | 0 (0.0%) |
Employment Characteristics in Timnath
Employment by Class of Employer in Timnath
Among the 3,347 employed individuals in Timnath, private company employees (2,214 | 66.1%), self-employed (incorporated) (367 | 11.0%), and local government employees (310 | 9.3%) make up the most common classes of employment.
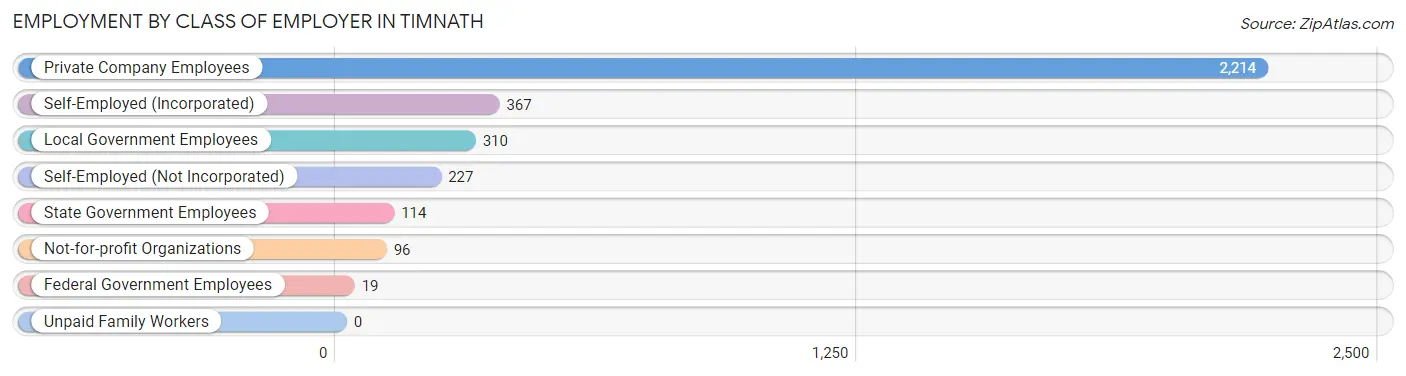
| Employer Class | # Employees | % Employees |
| Private Company Employees | 2,214 | 66.1% |
| Self-Employed (Incorporated) | 367 | 11.0% |
| Self-Employed (Not Incorporated) | 227 | 6.8% |
| Not-for-profit Organizations | 96 | 2.9% |
| Local Government Employees | 310 | 9.3% |
| State Government Employees | 114 | 3.4% |
| Federal Government Employees | 19 | 0.6% |
| Unpaid Family Workers | 0 | 0.0% |
| Total | 3,347 | 100.0% |
Employment Status by Age in Timnath
According to the labor force statistics for Timnath, out of the total population over 16 years of age (4,993), 68.5% or 3,420 individuals are in the labor force, with 0.9% or 31 of them unemployed. The age group with the highest labor force participation rate is 45 to 54 years, with 93.7% or 926 individuals in the labor force. Within the labor force, the 25 to 29 years age range has the highest percentage of unemployed individuals, with 5.0% or 2 of them being unemployed.
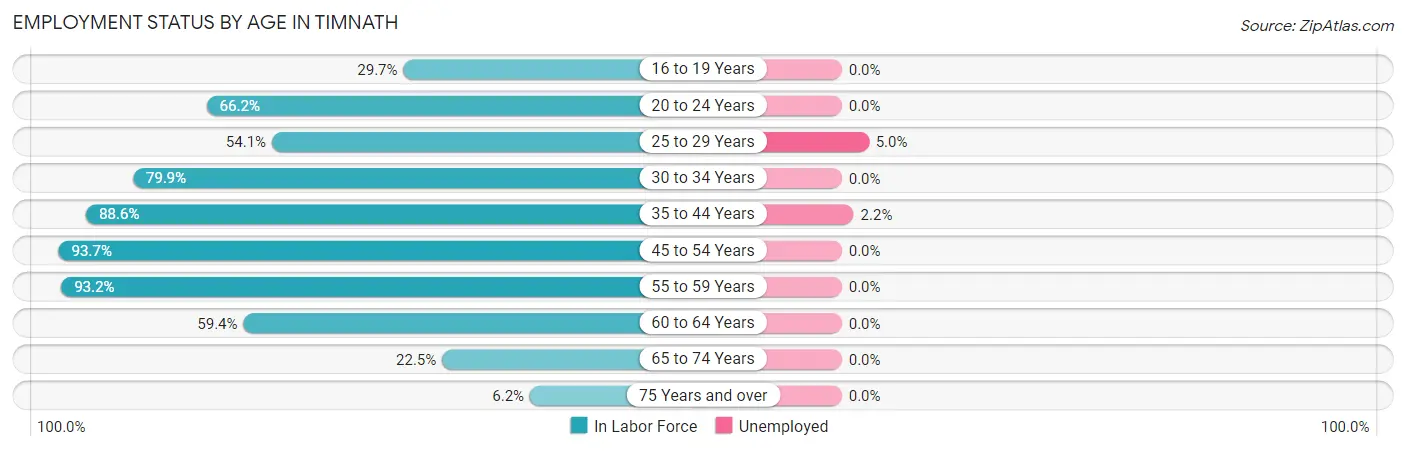
| Age Bracket | In Labor Force | Unemployed |
| 16 to 19 Years | 102 (29.7%) | 0 (0.0%) |
| 20 to 24 Years | 86 (66.2%) | 0 (0.0%) |
| 25 to 29 Years | 40 (54.1%) | 2 (5.0%) |
| 30 to 34 Years | 474 (79.9%) | 0 (0.0%) |
| 35 to 44 Years | 1,284 (88.6%) | 28 (2.2%) |
| 45 to 54 Years | 926 (93.7%) | 0 (0.0%) |
| 55 to 59 Years | 192 (93.2%) | 0 (0.0%) |
| 60 to 64 Years | 107 (59.4%) | 0 (0.0%) |
| 65 to 74 Years | 199 (22.5%) | 0 (0.0%) |
| 75 Years and over | 9 (6.2%) | 0 (0.0%) |
| Total | 3,420 (68.5%) | 31 (0.9%) |
Employment Status by Educational Attainment in Timnath
According to labor force statistics for Timnath, 86.6% of individuals (3,022) out of the total population between 25 and 64 years of age (3,490) are in the labor force, with 1.0% or 30 of them being unemployed. The group with the highest labor force participation rate are those with the educational attainment of less than high school, with 100.0% or 53 individuals in the labor force. Within the labor force, individuals with bachelor's degree or higher education have the highest percentage of unemployment, with 1.4% or 31 of them being unemployed.
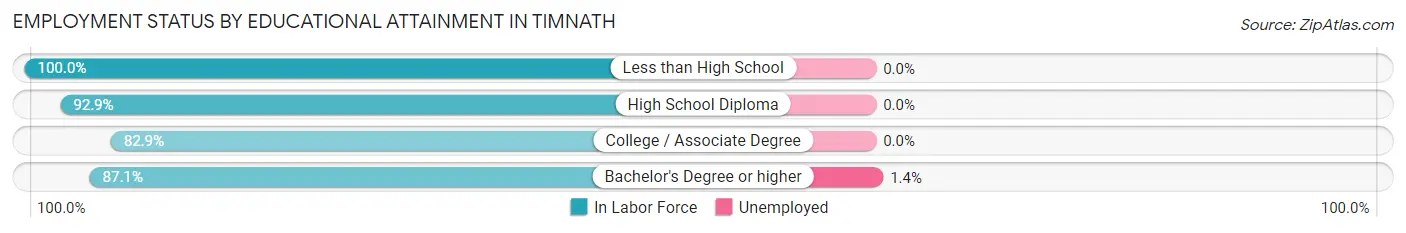
| Educational Attainment | In Labor Force | Unemployed |
| Less than High School | 53 (100.0%) | 0 (0.0%) |
| High School Diploma | 145 (92.9%) | 0 (0.0%) |
| College / Associate Degree | 620 (82.9%) | 0 (0.0%) |
| Bachelor's Degree or higher | 2,206 (87.1%) | 35 (1.4%) |
| Total | 3,022 (86.6%) | 35 (1.0%) |
Employment Occupations by Sex in Timnath
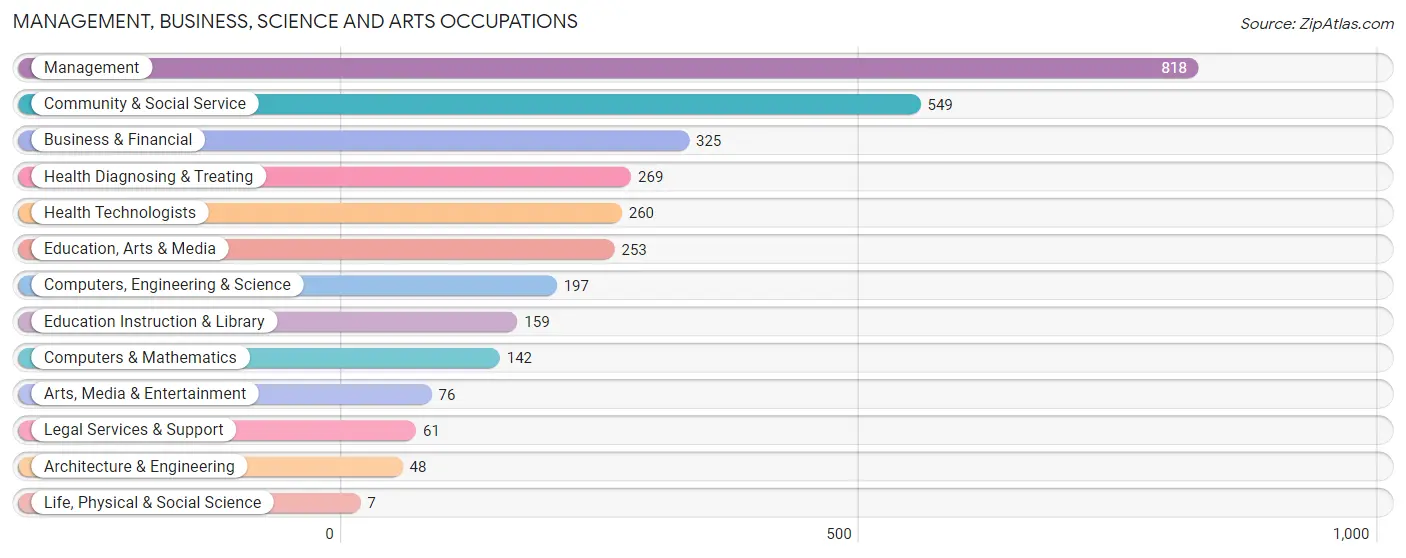
Management, Business, Science and Arts Occupations
The most common Management, Business, Science and Arts occupations in Timnath are Management (818 | 24.1%), Community & Social Service (549 | 16.2%), Business & Financial (325 | 9.6%), Health Diagnosing & Treating (269 | 7.9%), and Health Technologists (260 | 7.7%).
Management, Business, Science and Arts Occupations by Sex
Within the Management, Business, Science and Arts occupations in Timnath, the most male-oriented occupations are Architecture & Engineering (100.0%), Legal Services & Support (100.0%), and Computers & Mathematics (90.1%), while the most female-oriented occupations are Life, Physical & Social Science (100.0%), Education Instruction & Library (76.7%), and Health Technologists (73.5%).
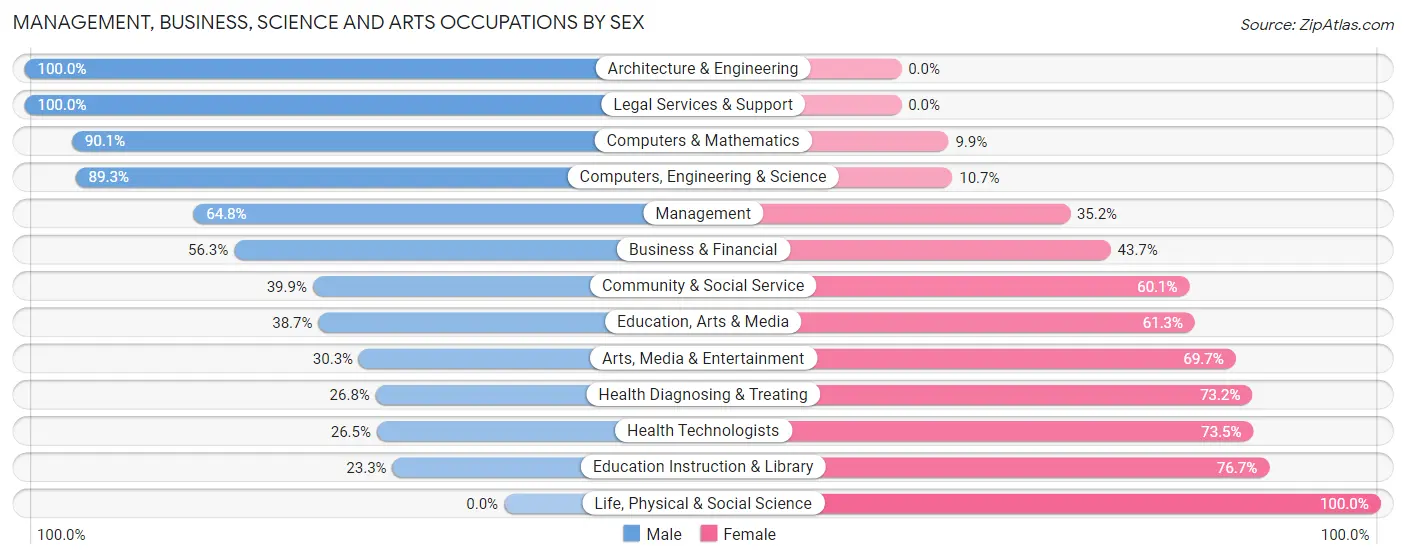
| Occupation | Male | Female |
| Management | 530 (64.8%) | 288 (35.2%) |
| Business & Financial | 183 (56.3%) | 142 (43.7%) |
| Computers, Engineering & Science | 176 (89.3%) | 21 (10.7%) |
| Computers & Mathematics | 128 (90.1%) | 14 (9.9%) |
| Architecture & Engineering | 48 (100.0%) | 0 (0.0%) |
| Life, Physical & Social Science | 0 (0.0%) | 7 (100.0%) |
| Community & Social Service | 219 (39.9%) | 330 (60.1%) |
| Education, Arts & Media | 98 (38.7%) | 155 (61.3%) |
| Legal Services & Support | 61 (100.0%) | 0 (0.0%) |
| Education Instruction & Library | 37 (23.3%) | 122 (76.7%) |
| Arts, Media & Entertainment | 23 (30.3%) | 53 (69.7%) |
| Health Diagnosing & Treating | 72 (26.8%) | 197 (73.2%) |
| Health Technologists | 69 (26.5%) | 191 (73.5%) |
| Total (Category) | 1,180 (54.7%) | 978 (45.3%) |
| Total (Overall) | 1,929 (56.9%) | 1,460 (43.1%) |
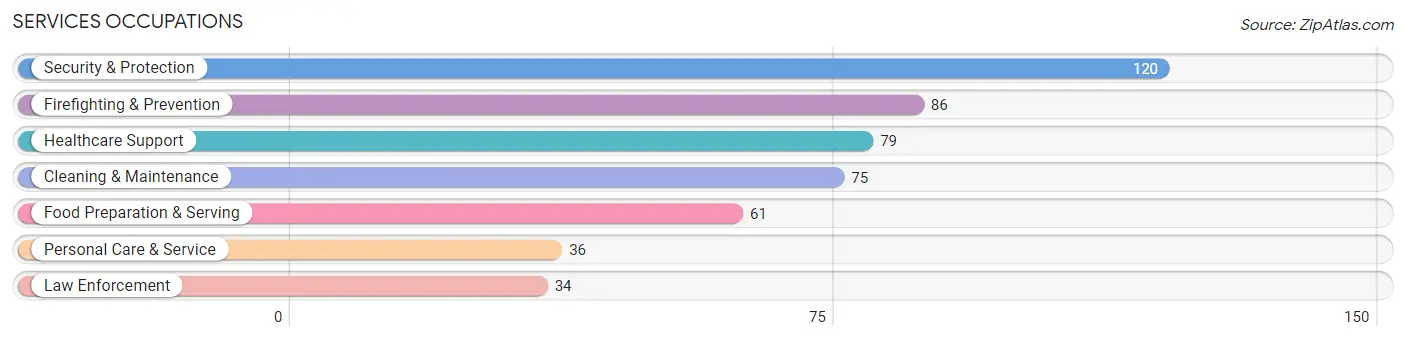
Services Occupations
The most common Services occupations in Timnath are Security & Protection (120 | 3.5%), Firefighting & Prevention (86 | 2.5%), Healthcare Support (79 | 2.3%), Cleaning & Maintenance (75 | 2.2%), and Food Preparation & Serving (61 | 1.8%).
Services Occupations by Sex
Within the Services occupations in Timnath, the most male-oriented occupations are Firefighting & Prevention (86.1%), Security & Protection (81.7%), and Law Enforcement (70.6%), while the most female-oriented occupations are Healthcare Support (84.8%), Personal Care & Service (52.8%), and Cleaning & Maintenance (46.7%).
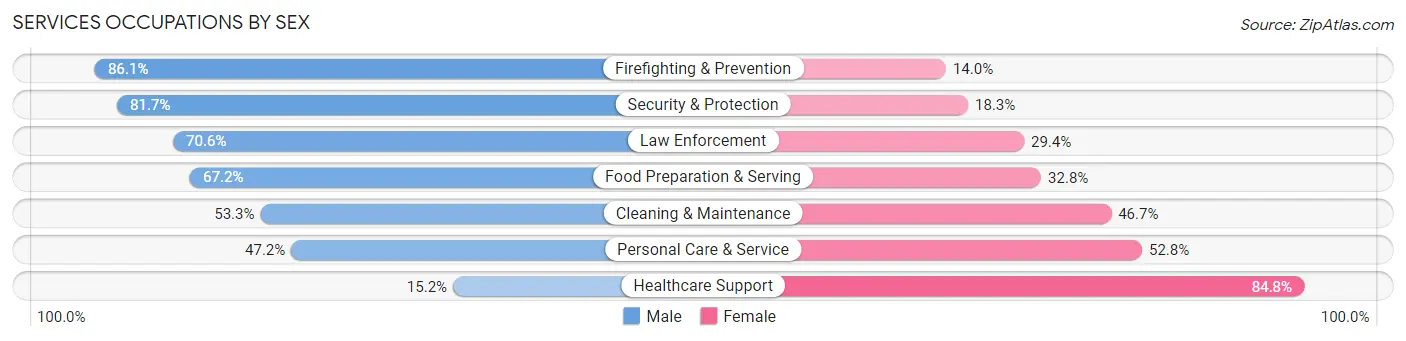
| Occupation | Male | Female |
| Healthcare Support | 12 (15.2%) | 67 (84.8%) |
| Security & Protection | 98 (81.7%) | 22 (18.3%) |
| Firefighting & Prevention | 74 (86.1%) | 12 (14.0%) |
| Law Enforcement | 24 (70.6%) | 10 (29.4%) |
| Food Preparation & Serving | 41 (67.2%) | 20 (32.8%) |
| Cleaning & Maintenance | 40 (53.3%) | 35 (46.7%) |
| Personal Care & Service | 17 (47.2%) | 19 (52.8%) |
| Total (Category) | 208 (56.1%) | 163 (43.9%) |
| Total (Overall) | 1,929 (56.9%) | 1,460 (43.1%) |
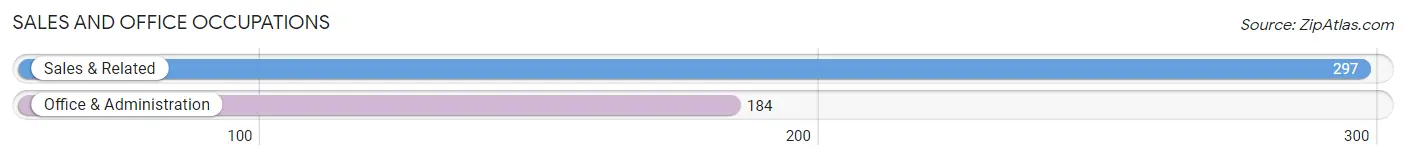
Sales and Office Occupations
The most common Sales and Office occupations in Timnath are Sales & Related (297 | 8.8%), and Office & Administration (184 | 5.4%).
Sales and Office Occupations by Sex

| Occupation | Male | Female |
| Sales & Related | 175 (58.9%) | 122 (41.1%) |
| Office & Administration | 25 (13.6%) | 159 (86.4%) |
| Total (Category) | 200 (41.6%) | 281 (58.4%) |
| Total (Overall) | 1,929 (56.9%) | 1,460 (43.1%) |
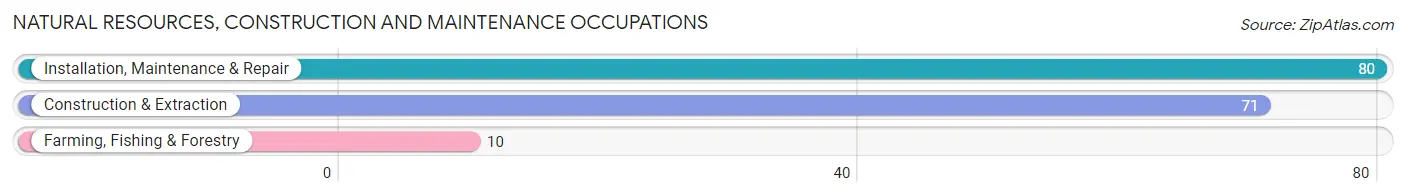
Natural Resources, Construction and Maintenance Occupations
The most common Natural Resources, Construction and Maintenance occupations in Timnath are Installation, Maintenance & Repair (80 | 2.4%), Construction & Extraction (71 | 2.1%), and Farming, Fishing & Forestry (10 | 0.3%).
Natural Resources, Construction and Maintenance Occupations by Sex
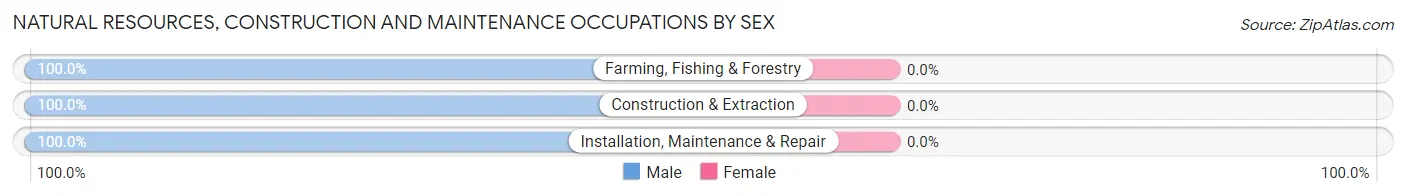
| Occupation | Male | Female |
| Farming, Fishing & Forestry | 10 (100.0%) | 0 (0.0%) |
| Construction & Extraction | 71 (100.0%) | 0 (0.0%) |
| Installation, Maintenance & Repair | 80 (100.0%) | 0 (0.0%) |
| Total (Category) | 161 (100.0%) | 0 (0.0%) |
| Total (Overall) | 1,929 (56.9%) | 1,460 (43.1%) |
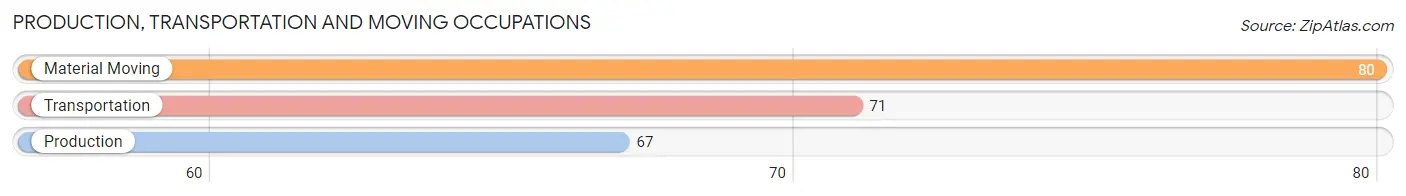
Production, Transportation and Moving Occupations
The most common Production, Transportation and Moving occupations in Timnath are Material Moving (80 | 2.4%), Transportation (71 | 2.1%), and Production (67 | 2.0%).
Production, Transportation and Moving Occupations by Sex
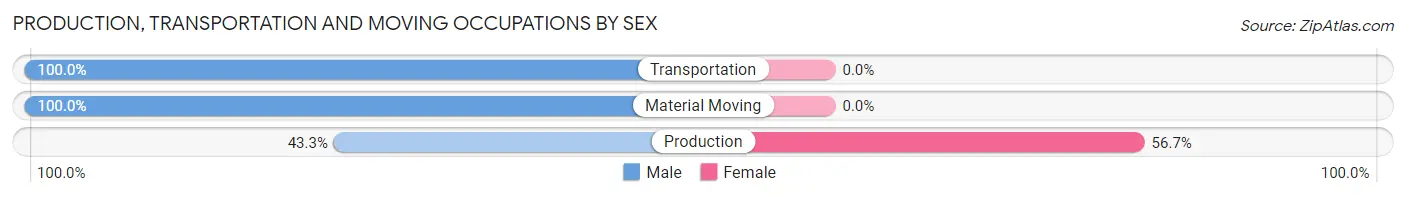
| Occupation | Male | Female |
| Production | 29 (43.3%) | 38 (56.7%) |
| Transportation | 71 (100.0%) | 0 (0.0%) |
| Material Moving | 80 (100.0%) | 0 (0.0%) |
| Total (Category) | 180 (82.6%) | 38 (17.4%) |
| Total (Overall) | 1,929 (56.9%) | 1,460 (43.1%) |
Employment Industries by Sex in Timnath
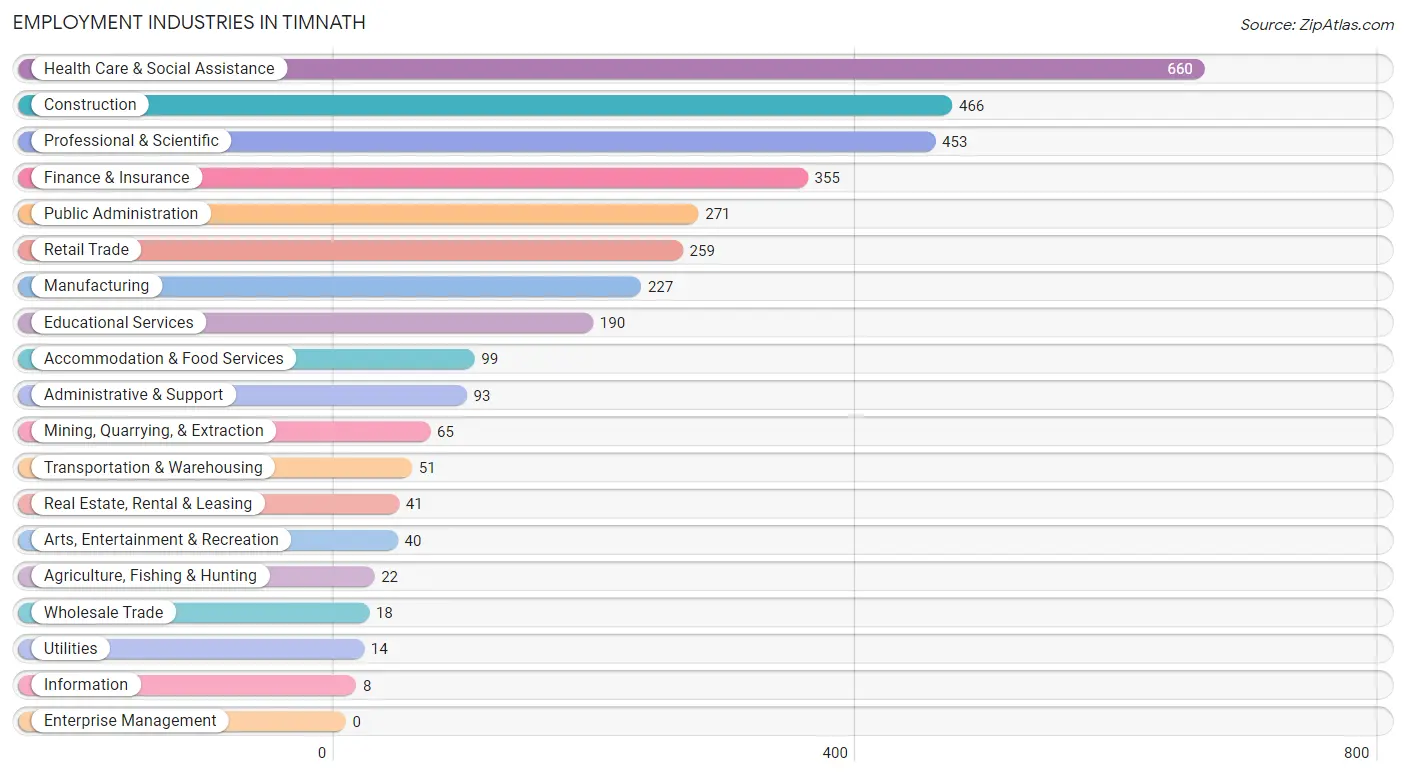
Employment Industries in Timnath
The major employment industries in Timnath include Health Care & Social Assistance (660 | 19.5%), Construction (466 | 13.8%), Professional & Scientific (453 | 13.4%), Finance & Insurance (355 | 10.5%), and Public Administration (271 | 8.0%).
Employment Industries by Sex in Timnath
The Timnath industries that see more men than women are Agriculture, Fishing & Hunting (100.0%), Mining, Quarrying, & Extraction (100.0%), and Information (100.0%), whereas the industries that tend to have a higher number of women are Health Care & Social Assistance (85.5%), Wholesale Trade (77.8%), and Arts, Entertainment & Recreation (72.5%).
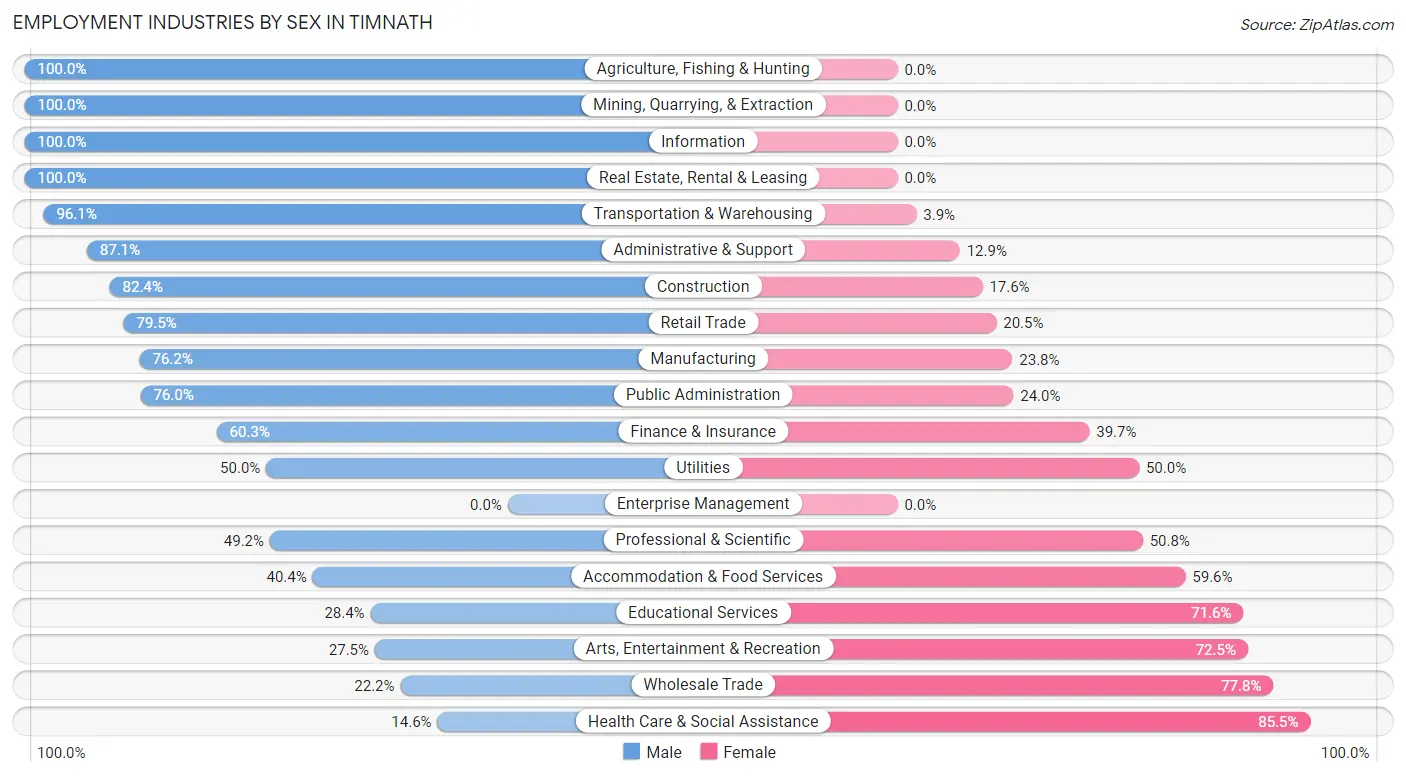
| Industry | Male | Female |
| Agriculture, Fishing & Hunting | 22 (100.0%) | 0 (0.0%) |
| Mining, Quarrying, & Extraction | 65 (100.0%) | 0 (0.0%) |
| Construction | 384 (82.4%) | 82 (17.6%) |
| Manufacturing | 173 (76.2%) | 54 (23.8%) |
| Wholesale Trade | 4 (22.2%) | 14 (77.8%) |
| Retail Trade | 206 (79.5%) | 53 (20.5%) |
| Transportation & Warehousing | 49 (96.1%) | 2 (3.9%) |
| Utilities | 7 (50.0%) | 7 (50.0%) |
| Information | 8 (100.0%) | 0 (0.0%) |
| Finance & Insurance | 214 (60.3%) | 141 (39.7%) |
| Real Estate, Rental & Leasing | 41 (100.0%) | 0 (0.0%) |
| Professional & Scientific | 223 (49.2%) | 230 (50.8%) |
| Enterprise Management | 0 (0.0%) | 0 (0.0%) |
| Administrative & Support | 81 (87.1%) | 12 (12.9%) |
| Educational Services | 54 (28.4%) | 136 (71.6%) |
| Health Care & Social Assistance | 96 (14.5%) | 564 (85.5%) |
| Arts, Entertainment & Recreation | 11 (27.5%) | 29 (72.5%) |
| Accommodation & Food Services | 40 (40.4%) | 59 (59.6%) |
| Public Administration | 206 (76.0%) | 65 (24.0%) |
| Total | 1,929 (56.9%) | 1,460 (43.1%) |
Education in Timnath
School Enrollment in Timnath
The most common levels of schooling among the 2,407 students in Timnath are elementary school (586 | 24.3%), high school (548 | 22.8%), and middle school (520 | 21.6%).
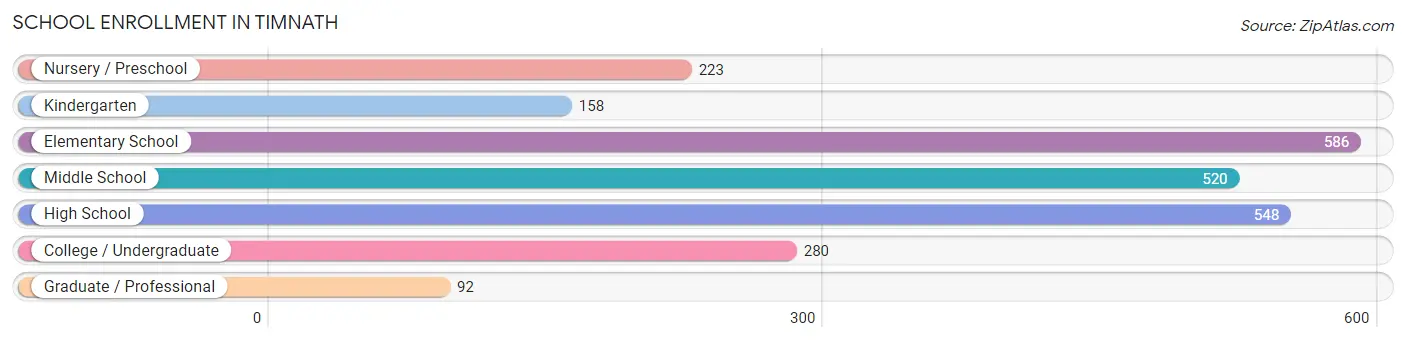
| School Level | # Students | % Students |
| Nursery / Preschool | 223 | 9.3% |
| Kindergarten | 158 | 6.6% |
| Elementary School | 586 | 24.3% |
| Middle School | 520 | 21.6% |
| High School | 548 | 22.8% |
| College / Undergraduate | 280 | 11.6% |
| Graduate / Professional | 92 | 3.8% |
| Total | 2,407 | 100.0% |
School Enrollment by Age by Funding Source in Timnath
Out of a total of 2,407 students who are enrolled in schools in Timnath, 147 (6.1%) attend a private institution, while the remaining 2,260 (93.9%) are enrolled in public schools. The age group of 3 to 4 year olds has the highest likelihood of being enrolled in private schools, with 45 (23.8% in the age bracket) enrolled. Conversely, the age group of 15 to 17 year olds has the lowest likelihood of being enrolled in a private school, with 445 (100.0% in the age bracket) attending a public institution.
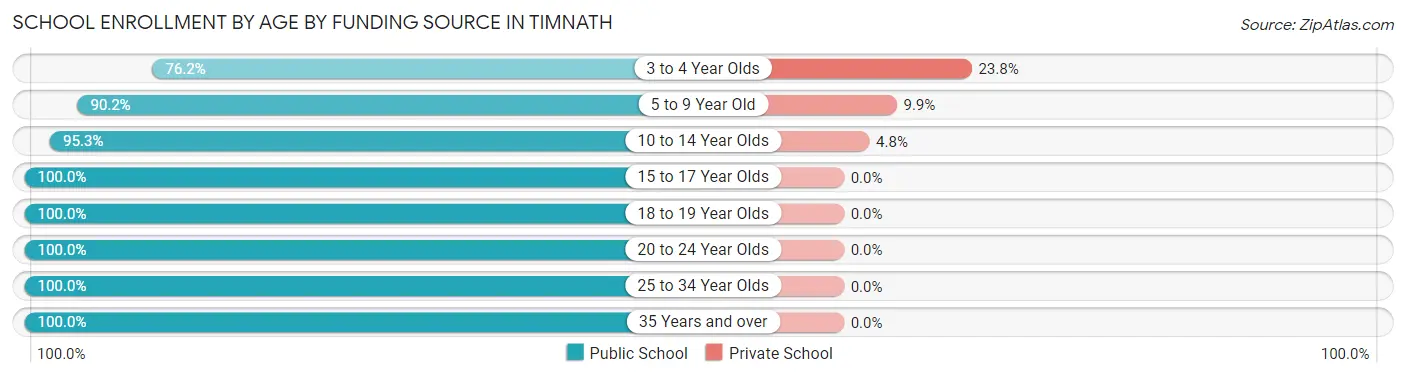
| Age Bracket | Public School | Private School |
| 3 to 4 Year Olds | 144 (76.2%) | 45 (23.8%) |
| 5 to 9 Year Old | 641 (90.1%) | 70 (9.9%) |
| 10 to 14 Year Olds | 622 (95.3%) | 31 (4.8%) |
| 15 to 17 Year Olds | 445 (100.0%) | 0 (0.0%) |
| 18 to 19 Year Olds | 110 (100.0%) | 0 (0.0%) |
| 20 to 24 Year Olds | 76 (100.0%) | 0 (0.0%) |
| 25 to 34 Year Olds | 23 (100.0%) | 0 (0.0%) |
| 35 Years and over | 200 (100.0%) | 0 (0.0%) |
| Total | 2,260 (93.9%) | 147 (6.1%) |
Educational Attainment by Field of Study in Timnath
Business (589 | 16.7%), science & technology (420 | 11.9%), education (410 | 11.6%), engineering (333 | 9.5%), and social sciences (330 | 9.4%) are the most common fields of study among 3,523 individuals in Timnath who have obtained a bachelor's degree or higher.
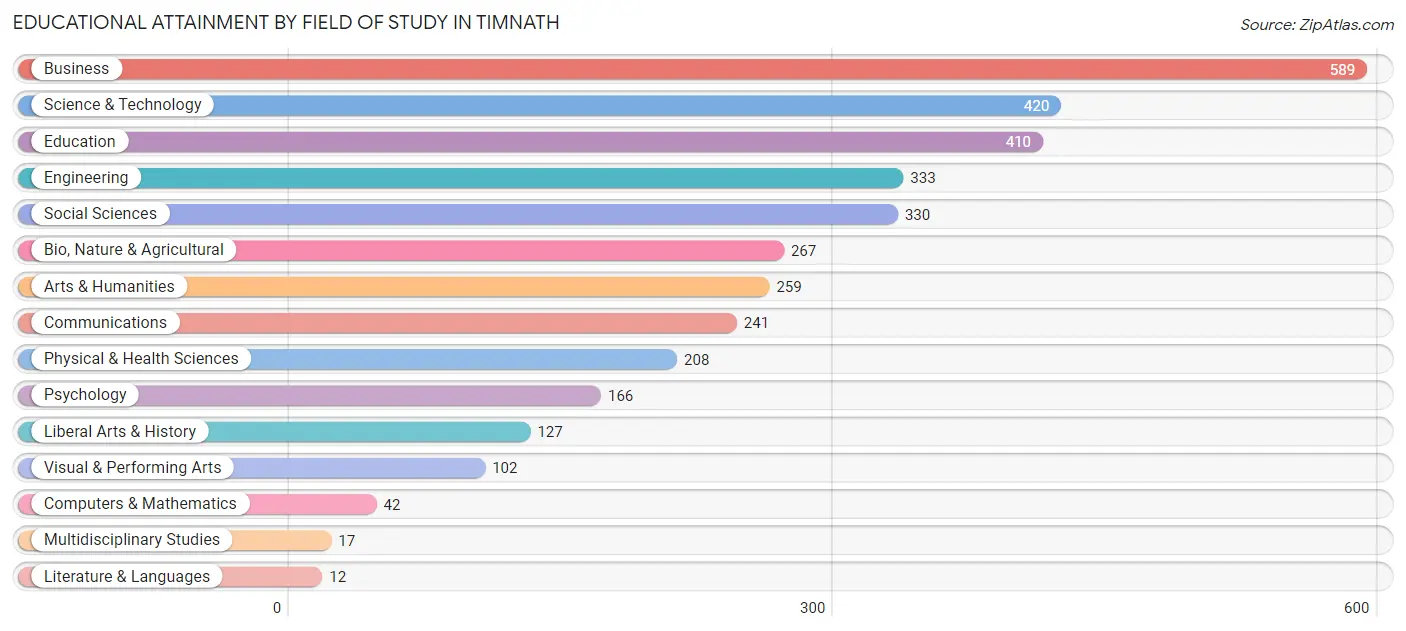
| Field of Study | # Graduates | % Graduates |
| Computers & Mathematics | 42 | 1.2% |
| Bio, Nature & Agricultural | 267 | 7.6% |
| Physical & Health Sciences | 208 | 5.9% |
| Psychology | 166 | 4.7% |
| Social Sciences | 330 | 9.4% |
| Engineering | 333 | 9.5% |
| Multidisciplinary Studies | 17 | 0.5% |
| Science & Technology | 420 | 11.9% |
| Business | 589 | 16.7% |
| Education | 410 | 11.6% |
| Literature & Languages | 12 | 0.3% |
| Liberal Arts & History | 127 | 3.6% |
| Visual & Performing Arts | 102 | 2.9% |
| Communications | 241 | 6.8% |
| Arts & Humanities | 259 | 7.3% |
| Total | 3,523 | 100.0% |
Transportation & Commute in Timnath
Vehicle Availability by Sex in Timnath
The most prevalent vehicle ownership categories in Timnath are males with 2 vehicles (1,162, accounting for 60.4%) and females with 2 vehicles (786, making up 81.7%).
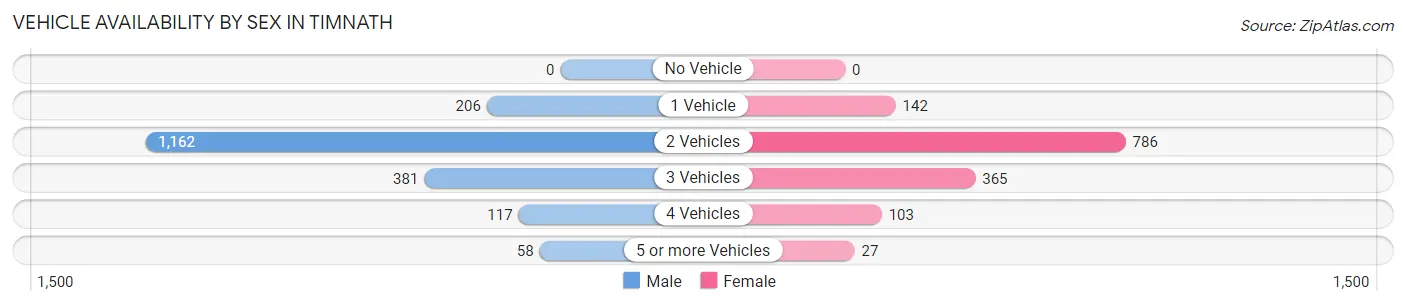
| Vehicles Available | Male | Female |
| No Vehicle | 0 (0.0%) | 0 (0.0%) |
| 1 Vehicle | 206 (10.7%) | 142 (10.0%) |
| 2 Vehicles | 1,162 (60.4%) | 786 (55.2%) |
| 3 Vehicles | 381 (19.8%) | 365 (25.7%) |
| 4 Vehicles | 117 (6.1%) | 103 (7.2%) |
| 5 or more Vehicles | 58 (3.0%) | 27 (1.9%) |
| Total | 1,924 (100.0%) | 1,423 (100.0%) |
Commute Time in Timnath
The most frequently occuring commute durations in Timnath are 20 to 24 minutes (569 commuters, 23.4%), 15 to 19 minutes (528 commuters, 21.8%), and 25 to 29 minutes (281 commuters, 11.6%).
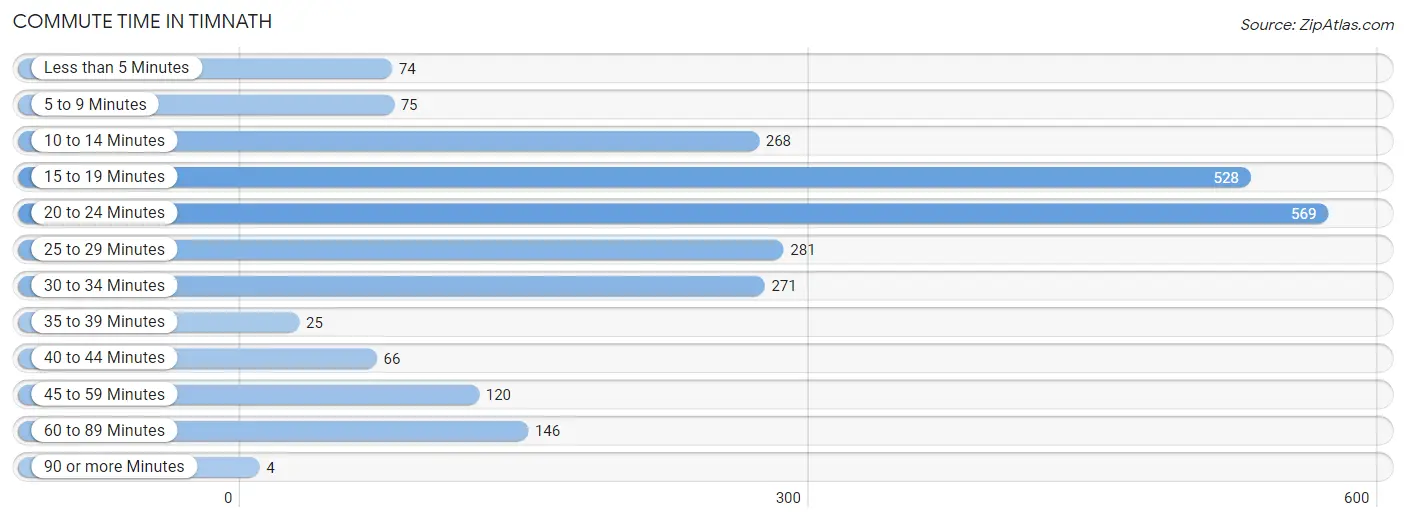
| Commute Time | # Commuters | % Commuters |
| Less than 5 Minutes | 74 | 3.0% |
| 5 to 9 Minutes | 75 | 3.1% |
| 10 to 14 Minutes | 268 | 11.0% |
| 15 to 19 Minutes | 528 | 21.8% |
| 20 to 24 Minutes | 569 | 23.4% |
| 25 to 29 Minutes | 281 | 11.6% |
| 30 to 34 Minutes | 271 | 11.2% |
| 35 to 39 Minutes | 25 | 1.0% |
| 40 to 44 Minutes | 66 | 2.7% |
| 45 to 59 Minutes | 120 | 4.9% |
| 60 to 89 Minutes | 146 | 6.0% |
| 90 or more Minutes | 4 | 0.2% |
Commute Time by Sex in Timnath
The most common commute times in Timnath are 15 to 19 minutes (392 commuters, 26.3%) for males and 20 to 24 minutes (427 commuters, 45.5%) for females.
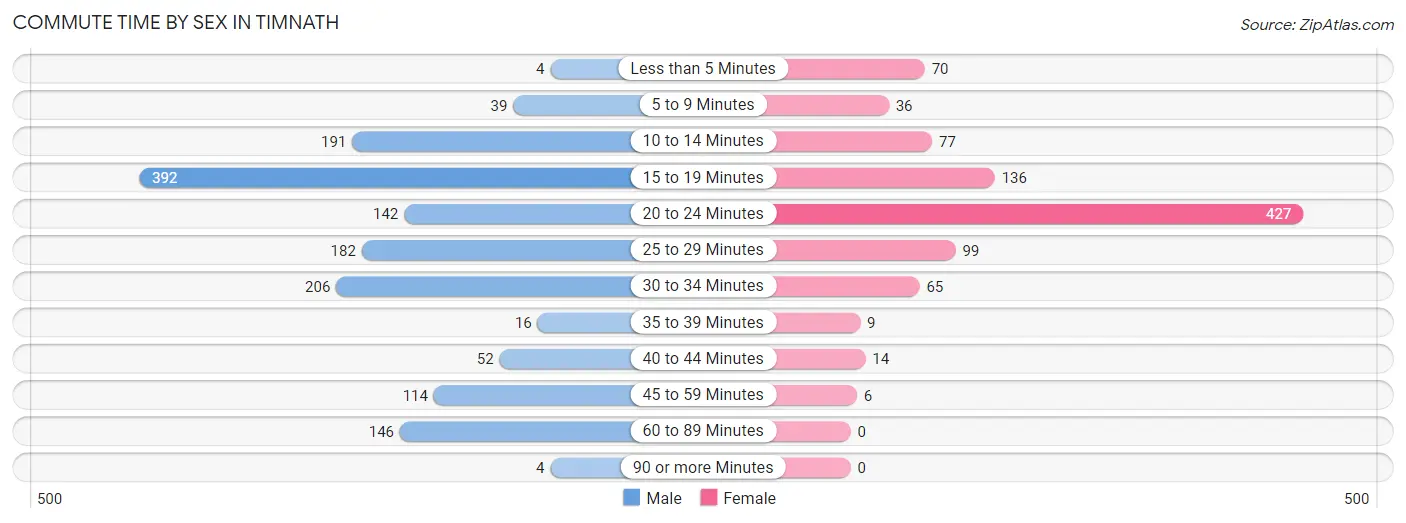
| Commute Time | Male | Female |
| Less than 5 Minutes | 4 (0.3%) | 70 (7.4%) |
| 5 to 9 Minutes | 39 (2.6%) | 36 (3.8%) |
| 10 to 14 Minutes | 191 (12.8%) | 77 (8.2%) |
| 15 to 19 Minutes | 392 (26.3%) | 136 (14.5%) |
| 20 to 24 Minutes | 142 (9.5%) | 427 (45.5%) |
| 25 to 29 Minutes | 182 (12.2%) | 99 (10.5%) |
| 30 to 34 Minutes | 206 (13.8%) | 65 (6.9%) |
| 35 to 39 Minutes | 16 (1.1%) | 9 (1.0%) |
| 40 to 44 Minutes | 52 (3.5%) | 14 (1.5%) |
| 45 to 59 Minutes | 114 (7.7%) | 6 (0.6%) |
| 60 to 89 Minutes | 146 (9.8%) | 0 (0.0%) |
| 90 or more Minutes | 4 (0.3%) | 0 (0.0%) |
Time of Departure to Work by Sex in Timnath
The most frequent times of departure to work in Timnath are 7:00 AM to 7:29 AM (333, 22.4%) for males and 8:00 AM to 8:29 AM (257, 27.4%) for females.
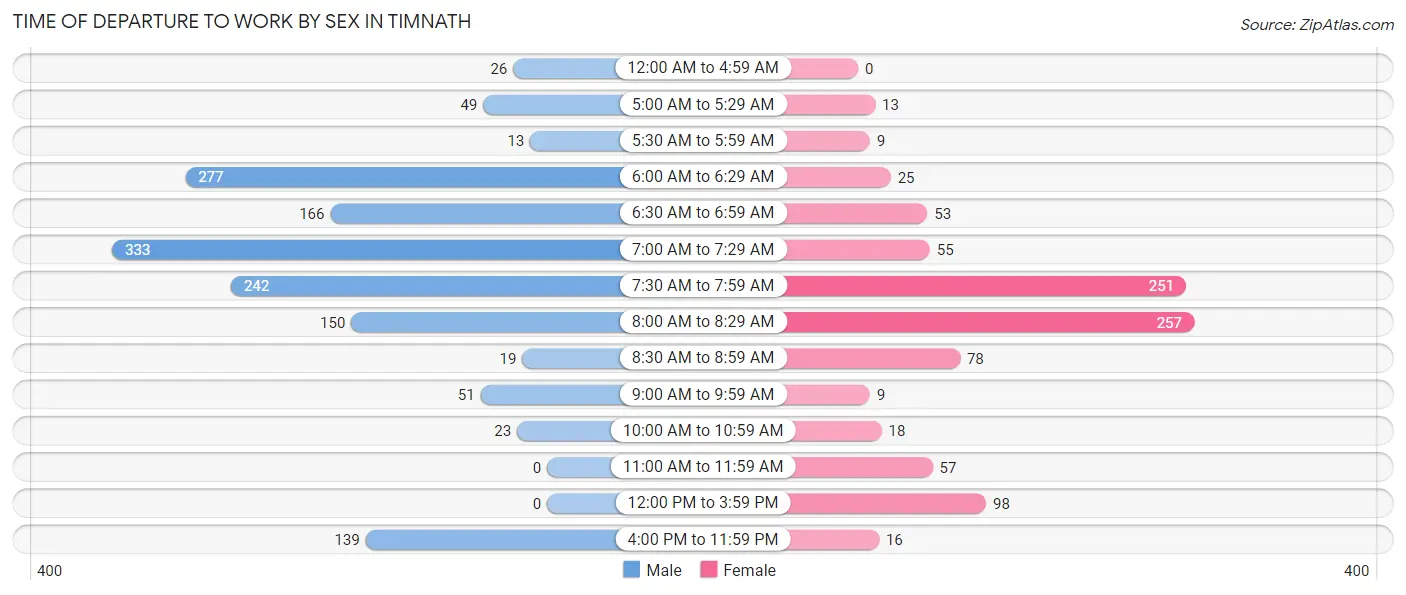
| Time of Departure | Male | Female |
| 12:00 AM to 4:59 AM | 26 (1.8%) | 0 (0.0%) |
| 5:00 AM to 5:29 AM | 49 (3.3%) | 13 (1.4%) |
| 5:30 AM to 5:59 AM | 13 (0.9%) | 9 (1.0%) |
| 6:00 AM to 6:29 AM | 277 (18.6%) | 25 (2.7%) |
| 6:30 AM to 6:59 AM | 166 (11.2%) | 53 (5.6%) |
| 7:00 AM to 7:29 AM | 333 (22.4%) | 55 (5.9%) |
| 7:30 AM to 7:59 AM | 242 (16.3%) | 251 (26.7%) |
| 8:00 AM to 8:29 AM | 150 (10.1%) | 257 (27.4%) |
| 8:30 AM to 8:59 AM | 19 (1.3%) | 78 (8.3%) |
| 9:00 AM to 9:59 AM | 51 (3.4%) | 9 (1.0%) |
| 10:00 AM to 10:59 AM | 23 (1.5%) | 18 (1.9%) |
| 11:00 AM to 11:59 AM | 0 (0.0%) | 57 (6.1%) |
| 12:00 PM to 3:59 PM | 0 (0.0%) | 98 (10.4%) |
| 4:00 PM to 11:59 PM | 139 (9.3%) | 16 (1.7%) |
| Total | 1,488 (100.0%) | 939 (100.0%) |
Housing Occupancy in Timnath
Occupancy by Ownership in Timnath
Of the total 2,393 dwellings in Timnath, owner-occupied units account for 2,218 (92.7%), while renter-occupied units make up 175 (7.3%).
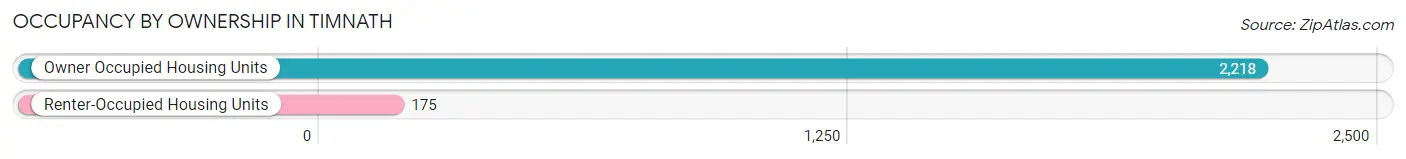
| Occupancy | # Housing Units | % Housing Units |
| Owner Occupied Housing Units | 2,218 | 92.7% |
| Renter-Occupied Housing Units | 175 | 7.3% |
| Total Occupied Housing Units | 2,393 | 100.0% |
Occupancy by Household Size in Timnath
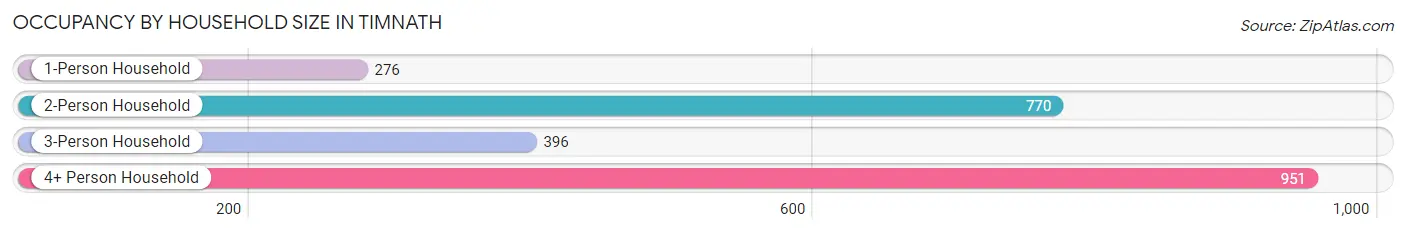
| Household Size | # Housing Units | % Housing Units |
| 1-Person Household | 276 | 11.5% |
| 2-Person Household | 770 | 32.2% |
| 3-Person Household | 396 | 16.6% |
| 4+ Person Household | 951 | 39.7% |
| Total Housing Units | 2,393 | 100.0% |
Occupancy by Ownership by Household Size in Timnath
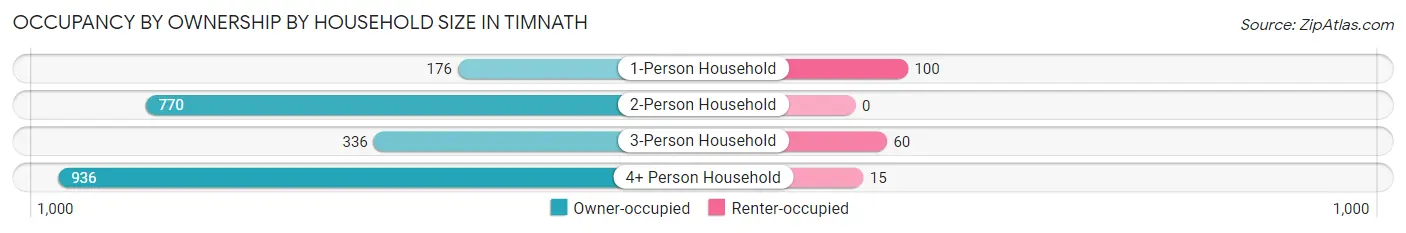
| Household Size | Owner-occupied | Renter-occupied |
| 1-Person Household | 176 (63.8%) | 100 (36.2%) |
| 2-Person Household | 770 (100.0%) | 0 (0.0%) |
| 3-Person Household | 336 (84.9%) | 60 (15.1%) |
| 4+ Person Household | 936 (98.4%) | 15 (1.6%) |
| Total Housing Units | 2,218 (92.7%) | 175 (7.3%) |
Occupancy by Educational Attainment in Timnath
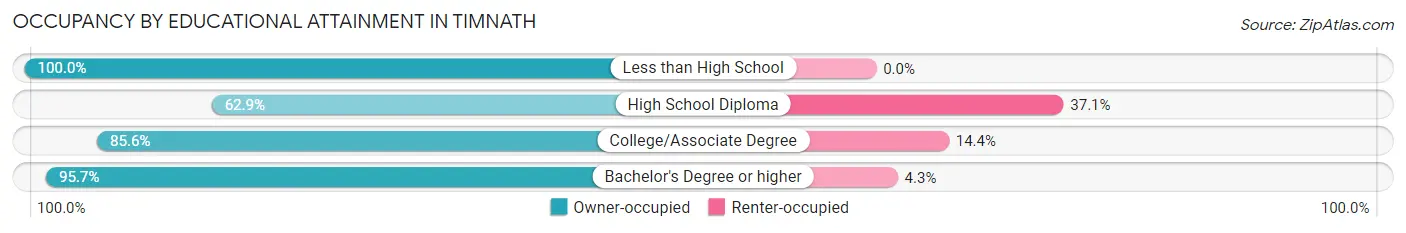
| Household Size | Owner-occupied | Renter-occupied |
| Less than High School | 25 (100.0%) | 0 (0.0%) |
| High School Diploma | 61 (62.9%) | 36 (37.1%) |
| College/Associate Degree | 357 (85.6%) | 60 (14.4%) |
| Bachelor's Degree or higher | 1,775 (95.7%) | 79 (4.3%) |
Occupancy by Age of Householder in Timnath
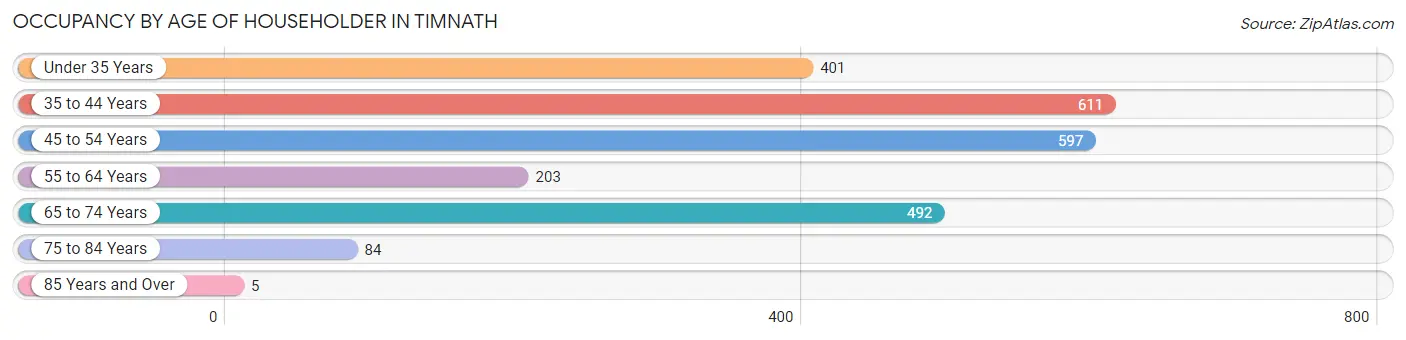
| Age Bracket | # Households | % Households |
| Under 35 Years | 401 | 16.8% |
| 35 to 44 Years | 611 | 25.5% |
| 45 to 54 Years | 597 | 24.9% |
| 55 to 64 Years | 203 | 8.5% |
| 65 to 74 Years | 492 | 20.6% |
| 75 to 84 Years | 84 | 3.5% |
| 85 Years and Over | 5 | 0.2% |
| Total | 2,393 | 100.0% |
Housing Finances in Timnath
Median Income by Occupancy in Timnath
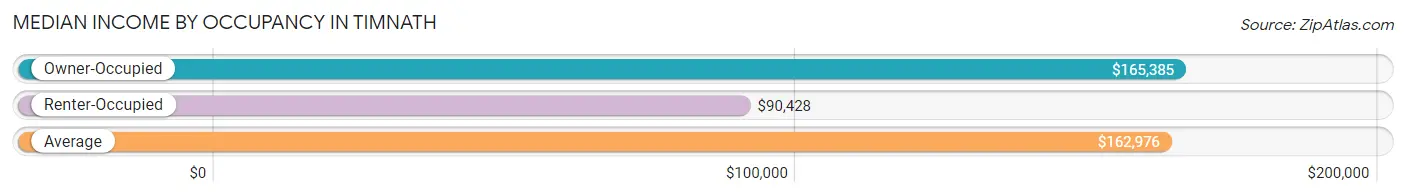
| Occupancy Type | # Households | Median Income |
| Owner-Occupied | 2,218 (92.7%) | $165,385 |
| Renter-Occupied | 175 (7.3%) | $90,428 |
| Average | 2,393 (100.0%) | $162,976 |
Occupancy by Householder Income Bracket in Timnath
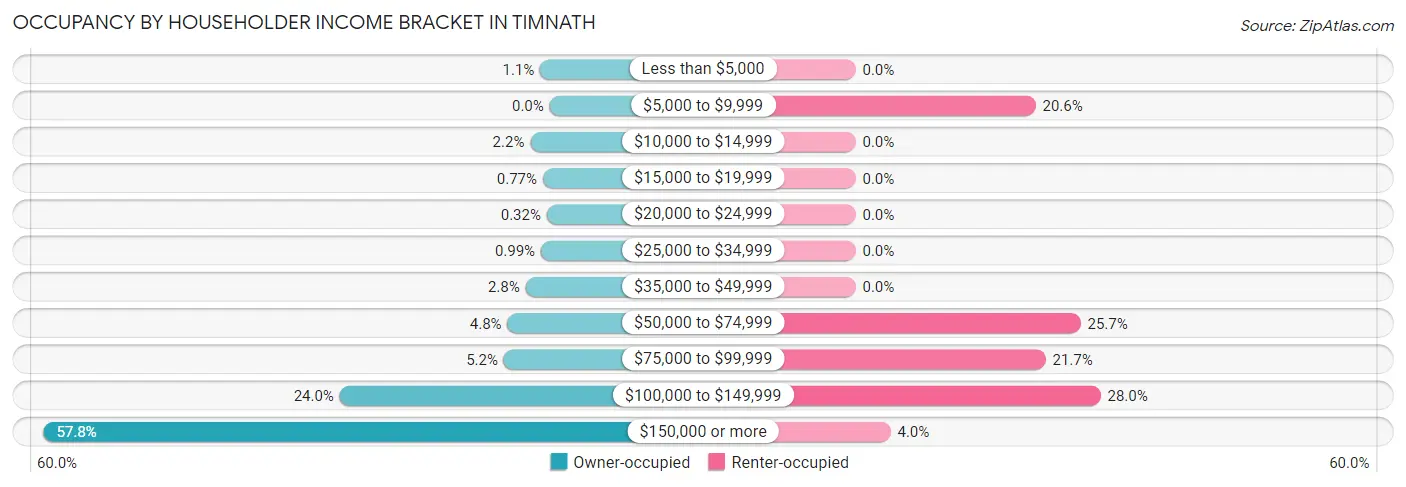
| Income Bracket | Owner-occupied | Renter-occupied |
| Less than $5,000 | 24 (1.1%) | 0 (0.0%) |
| $5,000 to $9,999 | 0 (0.0%) | 36 (20.6%) |
| $10,000 to $14,999 | 49 (2.2%) | 0 (0.0%) |
| $15,000 to $19,999 | 17 (0.8%) | 0 (0.0%) |
| $20,000 to $24,999 | 7 (0.3%) | 0 (0.0%) |
| $25,000 to $34,999 | 22 (1.0%) | 0 (0.0%) |
| $35,000 to $49,999 | 61 (2.8%) | 0 (0.0%) |
| $50,000 to $74,999 | 107 (4.8%) | 45 (25.7%) |
| $75,000 to $99,999 | 116 (5.2%) | 38 (21.7%) |
| $100,000 to $149,999 | 532 (24.0%) | 49 (28.0%) |
| $150,000 or more | 1,283 (57.8%) | 7 (4.0%) |
| Total | 2,218 (100.0%) | 175 (100.0%) |
Monthly Housing Cost Tiers in Timnath
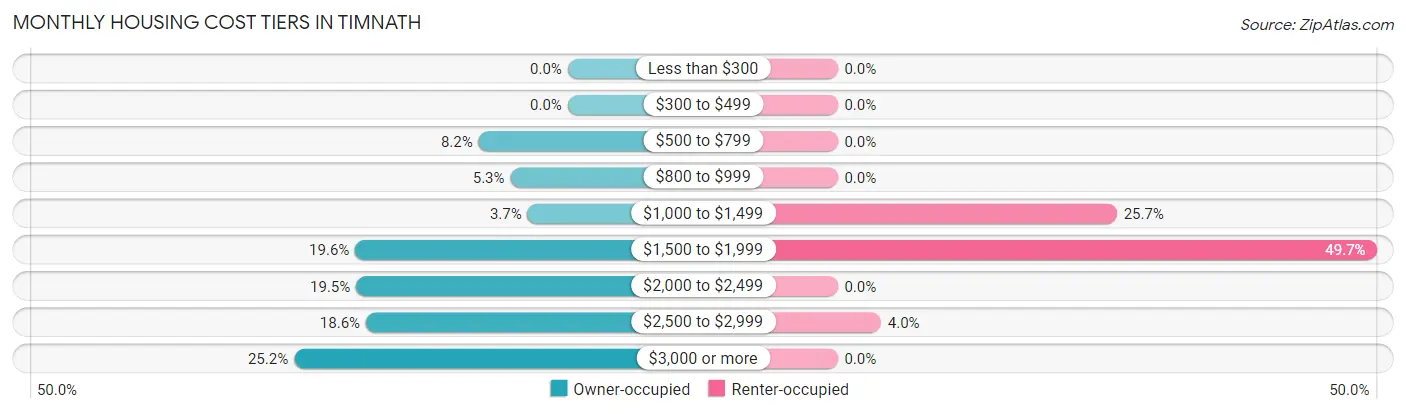
| Monthly Cost | Owner-occupied | Renter-occupied |
| Less than $300 | 0 (0.0%) | 0 (0.0%) |
| $300 to $499 | 0 (0.0%) | 0 (0.0%) |
| $500 to $799 | 182 (8.2%) | 0 (0.0%) |
| $800 to $999 | 117 (5.3%) | 0 (0.0%) |
| $1,000 to $1,499 | 82 (3.7%) | 45 (25.7%) |
| $1,500 to $1,999 | 434 (19.6%) | 87 (49.7%) |
| $2,000 to $2,499 | 432 (19.5%) | 0 (0.0%) |
| $2,500 to $2,999 | 412 (18.6%) | 7 (4.0%) |
| $3,000 or more | 559 (25.2%) | 0 (0.0%) |
| Total | 2,218 (100.0%) | 175 (100.0%) |
Physical Housing Characteristics in Timnath
Housing Structures in Timnath
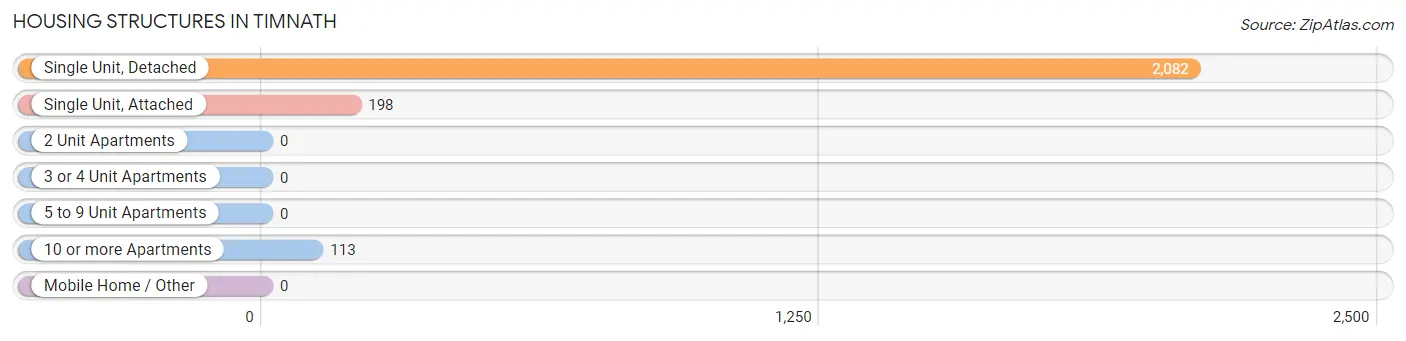
| Structure Type | # Housing Units | % Housing Units |
| Single Unit, Detached | 2,082 | 87.0% |
| Single Unit, Attached | 198 | 8.3% |
| 2 Unit Apartments | 0 | 0.0% |
| 3 or 4 Unit Apartments | 0 | 0.0% |
| 5 to 9 Unit Apartments | 0 | 0.0% |
| 10 or more Apartments | 113 | 4.7% |
| Mobile Home / Other | 0 | 0.0% |
| Total | 2,393 | 100.0% |
Housing Structures by Occupancy in Timnath
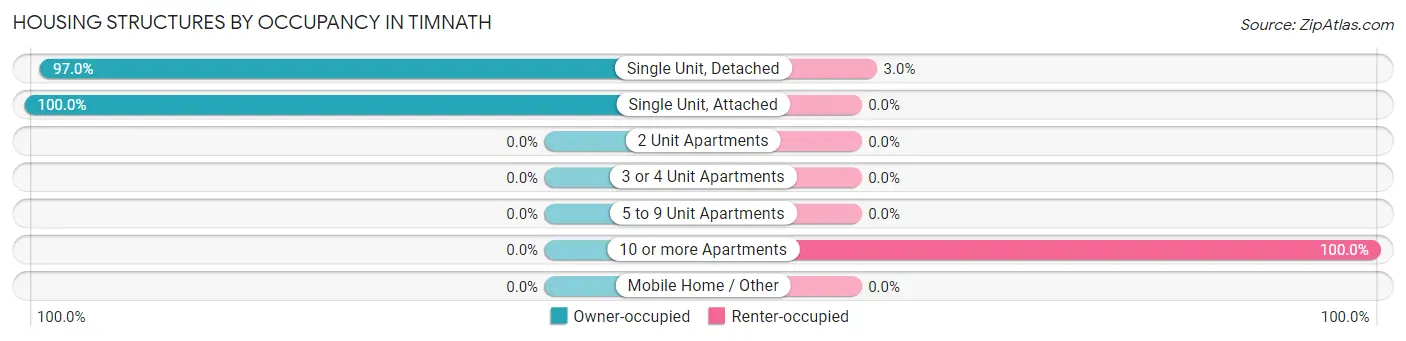
| Structure Type | Owner-occupied | Renter-occupied |
| Single Unit, Detached | 2,020 (97.0%) | 62 (3.0%) |
| Single Unit, Attached | 198 (100.0%) | 0 (0.0%) |
| 2 Unit Apartments | 0 (0.0%) | 0 (0.0%) |
| 3 or 4 Unit Apartments | 0 (0.0%) | 0 (0.0%) |
| 5 to 9 Unit Apartments | 0 (0.0%) | 0 (0.0%) |
| 10 or more Apartments | 0 (0.0%) | 113 (100.0%) |
| Mobile Home / Other | 0 (0.0%) | 0 (0.0%) |
| Total | 2,218 (92.7%) | 175 (7.3%) |
Housing Structures by Number of Rooms in Timnath
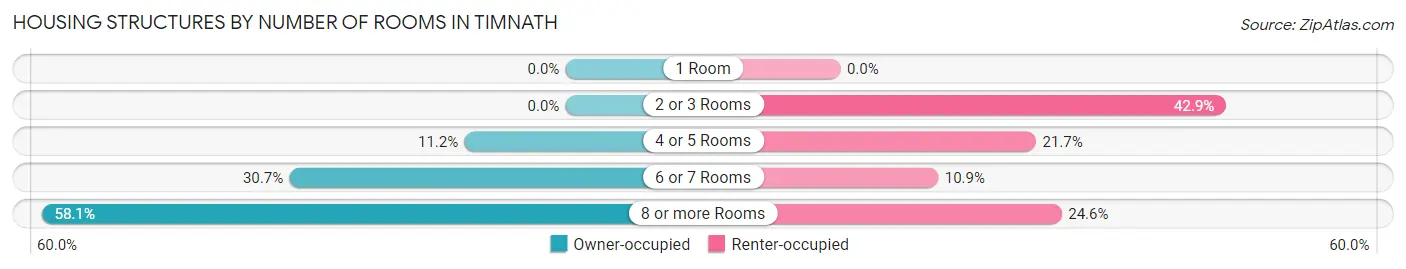
| Number of Rooms | Owner-occupied | Renter-occupied |
| 1 Room | 0 (0.0%) | 0 (0.0%) |
| 2 or 3 Rooms | 0 (0.0%) | 75 (42.9%) |
| 4 or 5 Rooms | 249 (11.2%) | 38 (21.7%) |
| 6 or 7 Rooms | 680 (30.7%) | 19 (10.9%) |
| 8 or more Rooms | 1,289 (58.1%) | 43 (24.6%) |
| Total | 2,218 (100.0%) | 175 (100.0%) |
Housing Structure by Heating Type in Timnath
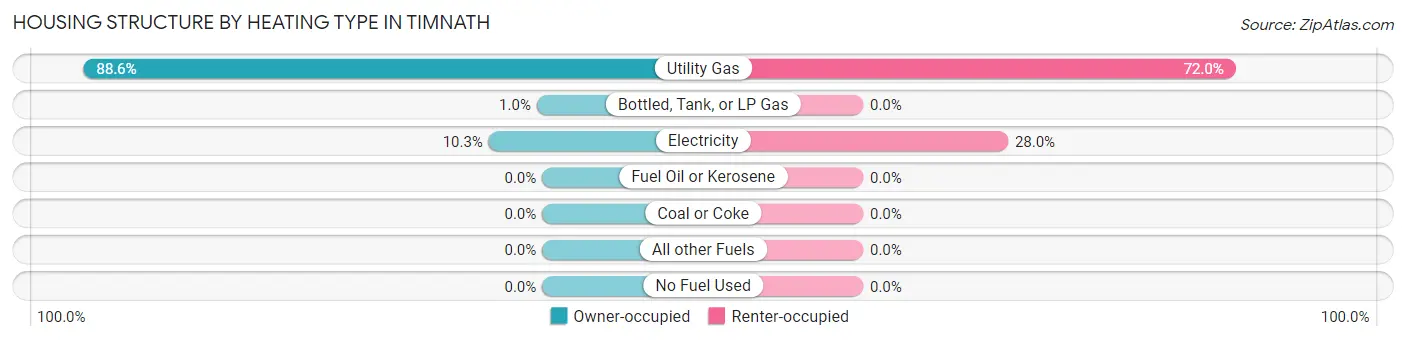
| Heating Type | Owner-occupied | Renter-occupied |
| Utility Gas | 1,966 (88.6%) | 126 (72.0%) |
| Bottled, Tank, or LP Gas | 23 (1.0%) | 0 (0.0%) |
| Electricity | 229 (10.3%) | 49 (28.0%) |
| Fuel Oil or Kerosene | 0 (0.0%) | 0 (0.0%) |
| Coal or Coke | 0 (0.0%) | 0 (0.0%) |
| All other Fuels | 0 (0.0%) | 0 (0.0%) |
| No Fuel Used | 0 (0.0%) | 0 (0.0%) |
| Total | 2,218 (100.0%) | 175 (100.0%) |
Household Vehicle Usage in Timnath
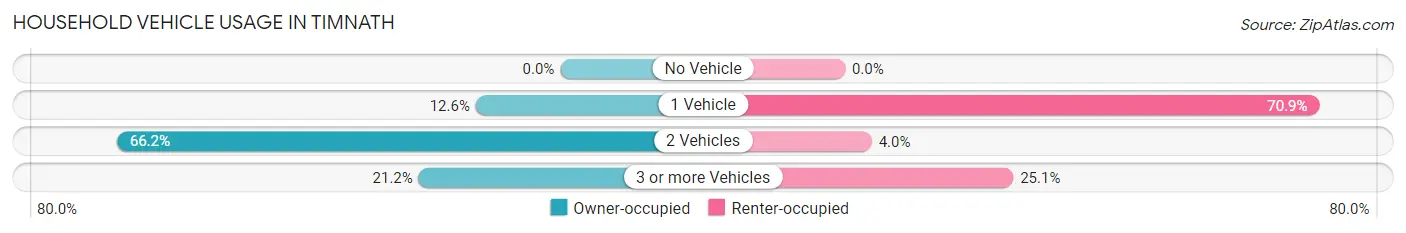
| Vehicles per Household | Owner-occupied | Renter-occupied |
| No Vehicle | 0 (0.0%) | 0 (0.0%) |
| 1 Vehicle | 280 (12.6%) | 124 (70.9%) |
| 2 Vehicles | 1,469 (66.2%) | 7 (4.0%) |
| 3 or more Vehicles | 469 (21.1%) | 44 (25.1%) |
| Total | 2,218 (100.0%) | 175 (100.0%) |
Real Estate & Mortgages in Timnath
Real Estate and Mortgage Overview in Timnath
| Characteristic | Without Mortgage | With Mortgage |
| Housing Units | 352 | 1,866 |
| Median Property Value | $786,700 | $662,400 |
| Median Household Income | $203,581 | $1,075 |
| Monthly Housing Costs | $788 | $559 |
| Real Estate Taxes | $4,712 | $0 |
Property Value by Mortgage Status in Timnath
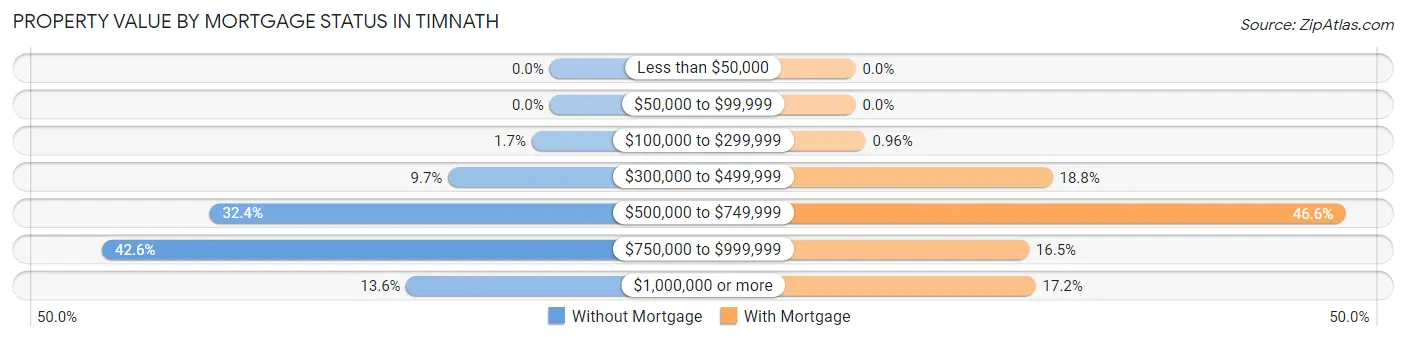
| Property Value | Without Mortgage | With Mortgage |
| Less than $50,000 | 0 (0.0%) | 0 (0.0%) |
| $50,000 to $99,999 | 0 (0.0%) | 0 (0.0%) |
| $100,000 to $299,999 | 6 (1.7%) | 18 (1.0%) |
| $300,000 to $499,999 | 34 (9.7%) | 350 (18.8%) |
| $500,000 to $749,999 | 114 (32.4%) | 870 (46.6%) |
| $750,000 to $999,999 | 150 (42.6%) | 308 (16.5%) |
| $1,000,000 or more | 48 (13.6%) | 320 (17.2%) |
| Total | 352 (100.0%) | 1,866 (100.0%) |
Household Income by Mortgage Status in Timnath
| Household Income | Without Mortgage | With Mortgage |
| Less than $10,000 | 0 (0.0%) | 20 (1.1%) |
| $10,000 to $24,999 | 0 (0.0%) | 24 (1.3%) |
| $25,000 to $34,999 | 0 (0.0%) | 73 (3.9%) |
| $35,000 to $49,999 | 11 (3.1%) | 22 (1.2%) |
| $50,000 to $74,999 | 4 (1.1%) | 50 (2.7%) |
| $75,000 to $99,999 | 48 (13.6%) | 103 (5.5%) |
| $100,000 to $149,999 | 81 (23.0%) | 68 (3.6%) |
| $150,000 or more | 208 (59.1%) | 451 (24.2%) |
| Total | 352 (100.0%) | 1,866 (100.0%) |
Property Value to Household Income Ratio in Timnath
| Value-to-Income Ratio | Without Mortgage | With Mortgage |
| Less than 2.0x | 82 (23.3%) | 164,397 (8,810.1%) |
| 2.0x to 2.9x | 28 (8.0%) | 257 (13.8%) |
| 3.0x to 3.9x | 56 (15.9%) | 489 (26.2%) |
| 4.0x or more | 186 (52.8%) | 390 (20.9%) |
| Total | 352 (100.0%) | 1,866 (100.0%) |
Real Estate Taxes by Mortgage Status in Timnath
| Property Taxes | Without Mortgage | With Mortgage |
| Less than $800 | 0 (0.0%) | 0 (0.0%) |
| $800 to $1,499 | 56 (15.9%) | 0 (0.0%) |
| $800 to $1,499 | 296 (84.1%) | 66 (3.5%) |
| Total | 352 (100.0%) | 1,866 (100.0%) |
Health & Disability in Timnath
Health Insurance Coverage by Age in Timnath
| Age Bracket | With Coverage | Without Coverage |
| Under 6 Years | 663 (98.5%) | 10 (1.5%) |
| 6 to 18 Years | 1,698 (97.1%) | 50 (2.9%) |
| 19 to 25 Years | 203 (100.0%) | 0 (0.0%) |
| 26 to 34 Years | 640 (99.2%) | 5 (0.8%) |
| 35 to 44 Years | 1,429 (98.6%) | 20 (1.4%) |
| 45 to 54 Years | 927 (93.8%) | 61 (6.2%) |
| 55 to 64 Years | 386 (100.0%) | 0 (0.0%) |
| 65 to 74 Years | 885 (100.0%) | 0 (0.0%) |
| 75 Years and older | 145 (100.0%) | 0 (0.0%) |
| Total | 6,976 (98.0%) | 146 (2.1%) |
Health Insurance Coverage by Citizenship Status in Timnath
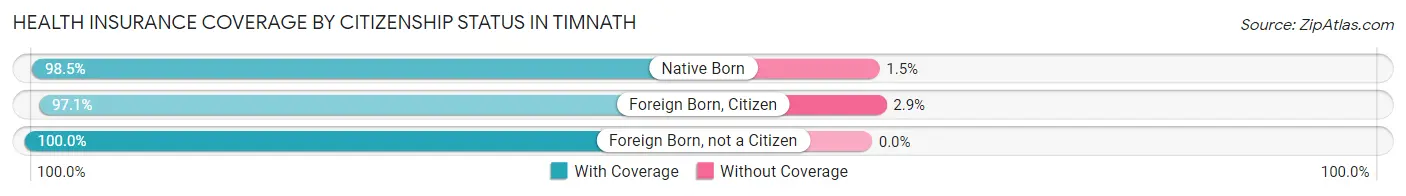
| Citizenship Status | With Coverage | Without Coverage |
| Native Born | 663 (98.5%) | 10 (1.5%) |
| Foreign Born, Citizen | 1,698 (97.1%) | 50 (2.9%) |
| Foreign Born, not a Citizen | 203 (100.0%) | 0 (0.0%) |
Health Insurance Coverage by Household Income in Timnath
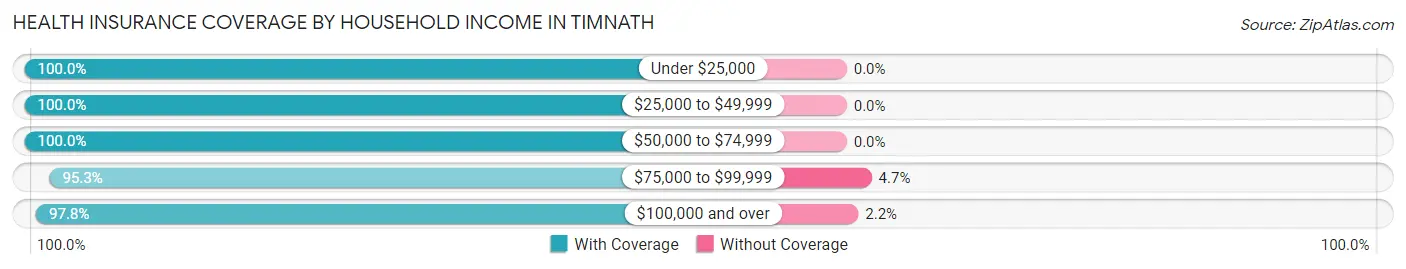
| Household Income | With Coverage | Without Coverage |
| Under $25,000 | 165 (100.0%) | 0 (0.0%) |
| $25,000 to $49,999 | 243 (100.0%) | 0 (0.0%) |
| $50,000 to $74,999 | 319 (100.0%) | 0 (0.0%) |
| $75,000 to $99,999 | 307 (95.3%) | 15 (4.7%) |
| $100,000 and over | 5,942 (97.8%) | 131 (2.2%) |
Public vs Private Health Insurance Coverage by Age in Timnath
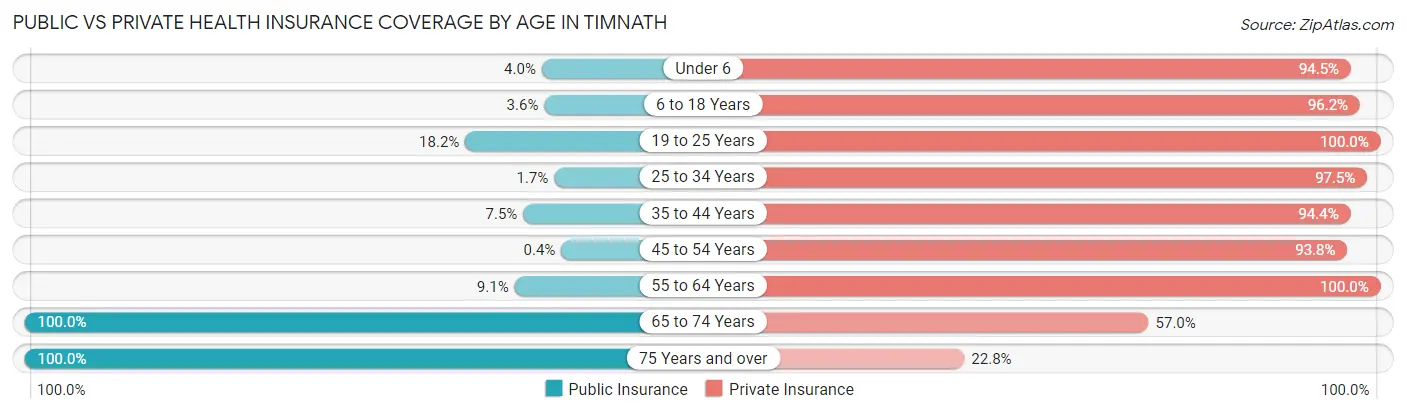
| Age Bracket | Public Insurance | Private Insurance |
| Under 6 | 27 (4.0%) | 636 (94.5%) |
| 6 to 18 Years | 62 (3.5%) | 1,681 (96.2%) |
| 19 to 25 Years | 37 (18.2%) | 203 (100.0%) |
| 25 to 34 Years | 11 (1.7%) | 629 (97.5%) |
| 35 to 44 Years | 108 (7.4%) | 1,368 (94.4%) |
| 45 to 54 Years | 4 (0.4%) | 927 (93.8%) |
| 55 to 64 Years | 35 (9.1%) | 386 (100.0%) |
| 65 to 74 Years | 885 (100.0%) | 504 (57.0%) |
| 75 Years and over | 145 (100.0%) | 33 (22.8%) |
| Total | 1,314 (18.4%) | 6,367 (89.4%) |
Disability Status by Sex by Age in Timnath
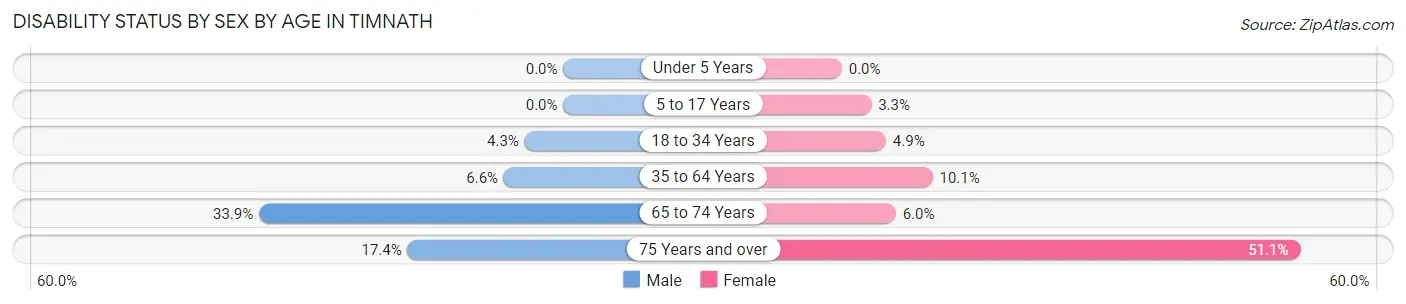
| Age Bracket | Male | Female |
| Under 5 Years | 0 (0.0%) | 0 (0.0%) |
| 5 to 17 Years | 0 (0.0%) | 36 (3.3%) |
| 18 to 34 Years | 18 (4.3%) | 24 (4.9%) |
| 35 to 64 Years | 94 (6.6%) | 142 (10.1%) |
| 65 to 74 Years | 142 (33.9%) | 28 (6.0%) |
| 75 Years and over | 17 (17.3%) | 24 (51.1%) |
Disability Class by Sex by Age in Timnath
Disability Class: Hearing Difficulty
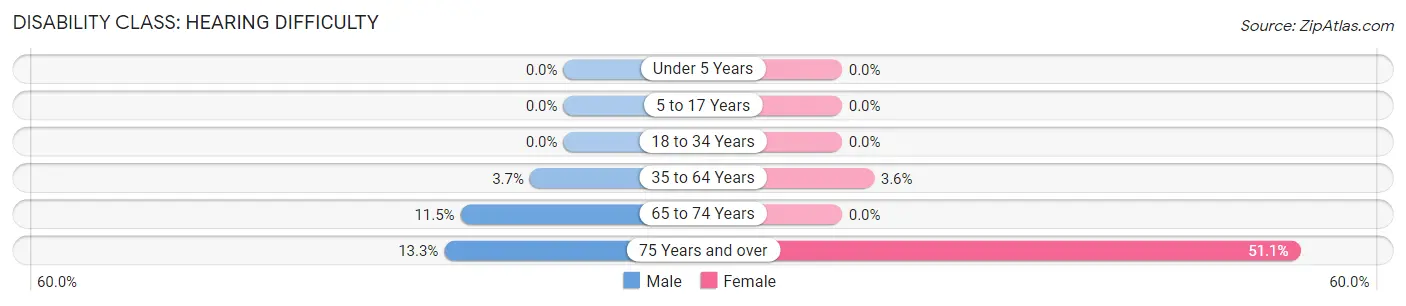
| Age Bracket | Male | Female |
| Under 5 Years | 0 (0.0%) | 0 (0.0%) |
| 5 to 17 Years | 0 (0.0%) | 0 (0.0%) |
| 18 to 34 Years | 0 (0.0%) | 0 (0.0%) |
| 35 to 64 Years | 53 (3.7%) | 50 (3.6%) |
| 65 to 74 Years | 48 (11.5%) | 0 (0.0%) |
| 75 Years and over | 13 (13.3%) | 24 (51.1%) |
Disability Class: Vision Difficulty
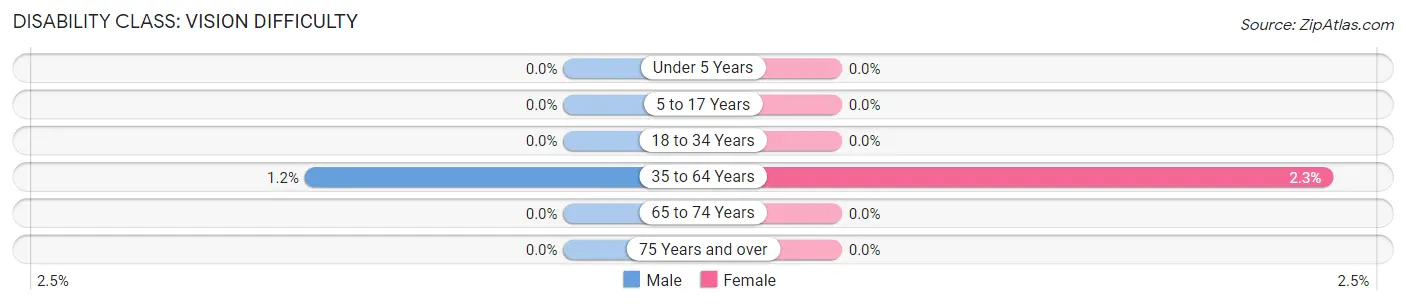
| Age Bracket | Male | Female |
| Under 5 Years | 0 (0.0%) | 0 (0.0%) |
| 5 to 17 Years | 0 (0.0%) | 0 (0.0%) |
| 18 to 34 Years | 0 (0.0%) | 0 (0.0%) |
| 35 to 64 Years | 17 (1.2%) | 32 (2.3%) |
| 65 to 74 Years | 0 (0.0%) | 0 (0.0%) |
| 75 Years and over | 0 (0.0%) | 0 (0.0%) |
Disability Class: Cognitive Difficulty
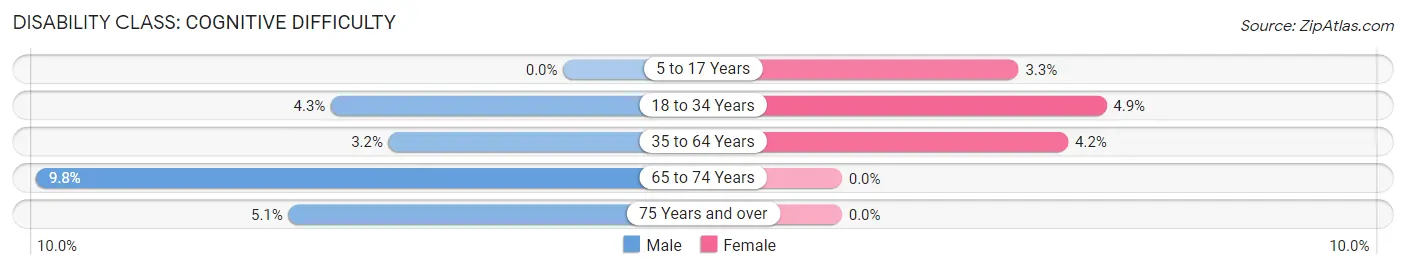
| Age Bracket | Male | Female |
| 5 to 17 Years | 0 (0.0%) | 36 (3.3%) |
| 18 to 34 Years | 18 (4.3%) | 24 (4.9%) |
| 35 to 64 Years | 46 (3.2%) | 59 (4.2%) |
| 65 to 74 Years | 41 (9.8%) | 0 (0.0%) |
| 75 Years and over | 5 (5.1%) | 0 (0.0%) |
Disability Class: Ambulatory Difficulty
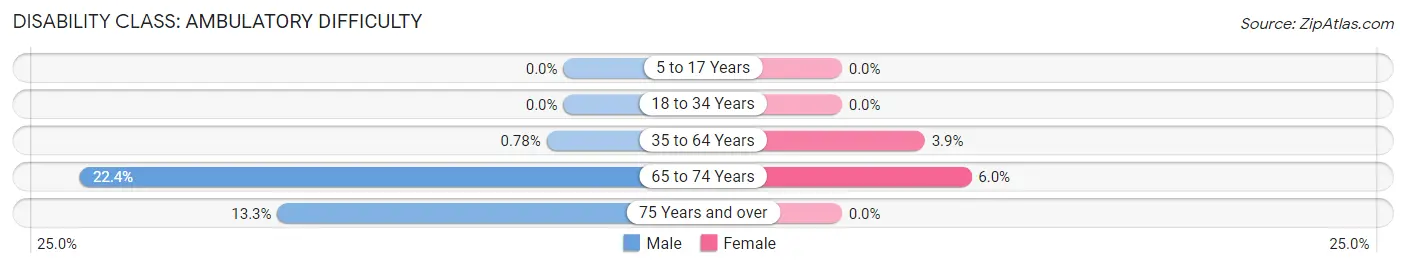
| Age Bracket | Male | Female |
| 5 to 17 Years | 0 (0.0%) | 0 (0.0%) |
| 18 to 34 Years | 0 (0.0%) | 0 (0.0%) |
| 35 to 64 Years | 11 (0.8%) | 54 (3.8%) |
| 65 to 74 Years | 94 (22.4%) | 28 (6.0%) |
| 75 Years and over | 13 (13.3%) | 0 (0.0%) |
Disability Class: Self-Care Difficulty
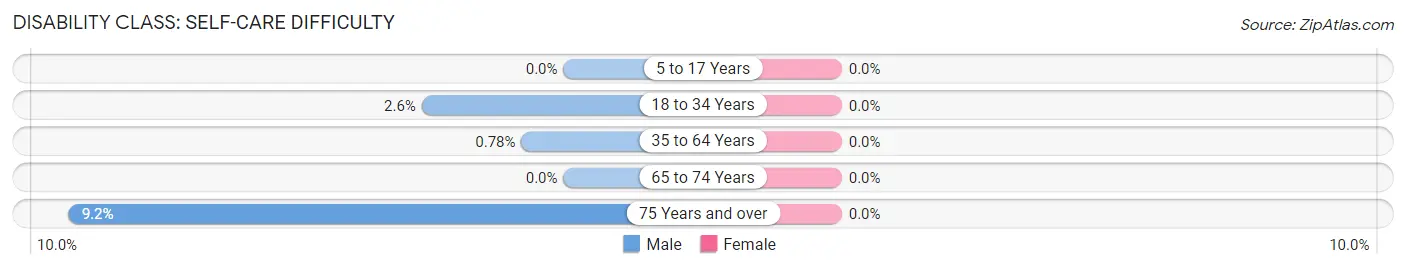
| Age Bracket | Male | Female |
| 5 to 17 Years | 0 (0.0%) | 0 (0.0%) |
| 18 to 34 Years | 11 (2.6%) | 0 (0.0%) |
| 35 to 64 Years | 11 (0.8%) | 0 (0.0%) |
| 65 to 74 Years | 0 (0.0%) | 0 (0.0%) |
| 75 Years and over | 9 (9.2%) | 0 (0.0%) |
Technology Access in Timnath
Computing Device Access in Timnath
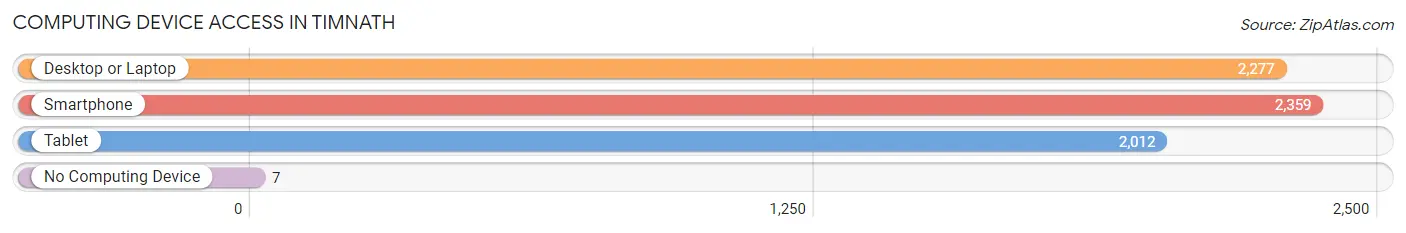
| Device Type | # Households | % Households |
| Desktop or Laptop | 2,277 | 95.2% |
| Smartphone | 2,359 | 98.6% |
| Tablet | 2,012 | 84.1% |
| No Computing Device | 7 | 0.3% |
| Total | 2,393 | 100.0% |
Internet Access in Timnath
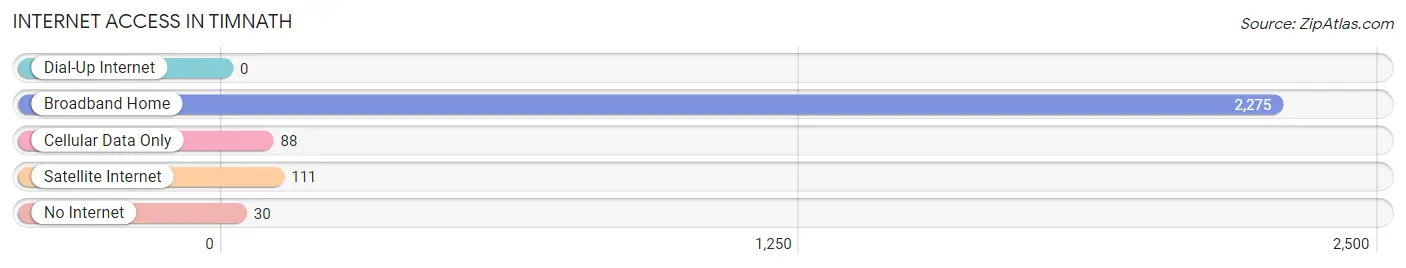
| Internet Type | # Households | % Households |
| Dial-Up Internet | 0 | 0.0% |
| Broadband Home | 2,275 | 95.1% |
| Cellular Data Only | 88 | 3.7% |
| Satellite Internet | 111 | 4.6% |
| No Internet | 30 | 1.3% |
| Total | 2,393 | 100.0% |
Timnath Summary
Timnath, Colorado is a small town located in Larimer County, Colorado. It is situated in the foothills of the Rocky Mountains, just north of Fort Collins. The town was founded in 1882 and has a population of around 4,000 people.
History
Timnath was founded in 1882 by a group of settlers from the nearby town of Laporte. The settlers were looking for a place to settle and farm, and they chose the area around Timnath because of its fertile soil and abundant water supply. The town was named after the biblical city of Timnath, which was located in the area of modern-day Israel.
The town grew slowly over the years, and by the early 1900s, it had become a thriving agricultural community. The town was home to several farms, a general store, a post office, and a school. In the 1920s, the town began to expand, and a number of businesses opened up, including a bank, a hotel, and a movie theater.
In the 1950s, the town began to experience a period of growth and development. The population increased, and new businesses opened up, including a grocery store, a hardware store, and a gas station. The town also saw the construction of a new school and a library.
Geography
Timnath is located in the foothills of the Rocky Mountains, just north of Fort Collins. The town is situated at an elevation of 5,400 feet above sea level. The town is surrounded by rolling hills and open fields, and it is bordered by the Cache la Poudre River to the east.
The climate in Timnath is semi-arid, with hot summers and cold winters. The average annual temperature is around 50 degrees Fahrenheit, and the average annual precipitation is around 16 inches.
Economy
The economy of Timnath is largely based on agriculture. The town is home to several farms, and the surrounding area is known for its production of wheat, corn, and other crops. The town also has a number of businesses, including a grocery store, a hardware store, and a gas station.
In recent years, the town has seen an increase in tourism. The town is home to several parks and recreational areas, and it is a popular destination for outdoor activities such as hiking, camping, and fishing.
Demographics
As of the 2010 census, the population of Timnath was 4,099. The racial makeup of the town was 94.3% White, 0.7% African American, 0.3% Native American, 0.7% Asian, 0.1% Pacific Islander, 1.7% from other races, and 2.0% from two or more races. Hispanic or Latino of any race were 4.3% of the population.
The median household income in Timnath was $63,750, and the median family income was $71,250. The per capita income was $27,945. About 4.3% of families and 5.7% of the population were below the poverty line, including 6.3% of those under age 18 and 4.2% of those age 65 or over.
Common Questions
What is Per Capita Income in Timnath?
Per Capita income in Timnath is $79,715.
What is the Median Family Income in Timnath?
Median Family Income in Timnath is $169,082.
What is the Median Household income in Timnath?
Median Household Income in Timnath is $162,976.
What is Income or Wage Gap in Timnath?
Income or Wage Gap in Timnath is 43.5%.
Women in Timnath earn 56.5 cents for every dollar earned by a man.
What is Inequality or Gini Index in Timnath?
Inequality or Gini Index in Timnath is 0.45.
What is the Total Population of Timnath?
Total Population of Timnath is 7,122.
What is the Total Male Population of Timnath?
Total Male Population of Timnath is 3,352.
What is the Total Female Population of Timnath?
Total Female Population of Timnath is 3,770.
What is the Ratio of Males per 100 Females in Timnath?
There are 88.91 Males per 100 Females in Timnath.
What is the Ratio of Females per 100 Males in Timnath?
There are 112.47 Females per 100 Males in Timnath.
What is the Median Population Age in Timnath?
Median Population Age in Timnath is 36.2 Years.
What is the Average Family Size in Timnath
Average Family Size in Timnath is 3.2 People.
What is the Average Household Size in Timnath
Average Household Size in Timnath is 3.0 People.
How Large is the Labor Force in Timnath?
There are 3,420 People in the Labor Forcein in Timnath.
What is the Percentage of People in the Labor Force in Timnath?
68.5% of People are in the Labor Force in Timnath.
What is the Unemployment Rate in Timnath?
Unemployment Rate in Timnath is 0.9%.