Zip Codes with the Highest Percentage of Families with Income Above $200,000 in Colorado
RELATED REPORTS & OPTIONS
Family Income | $200k+
Colorado
Compare Zip Codes
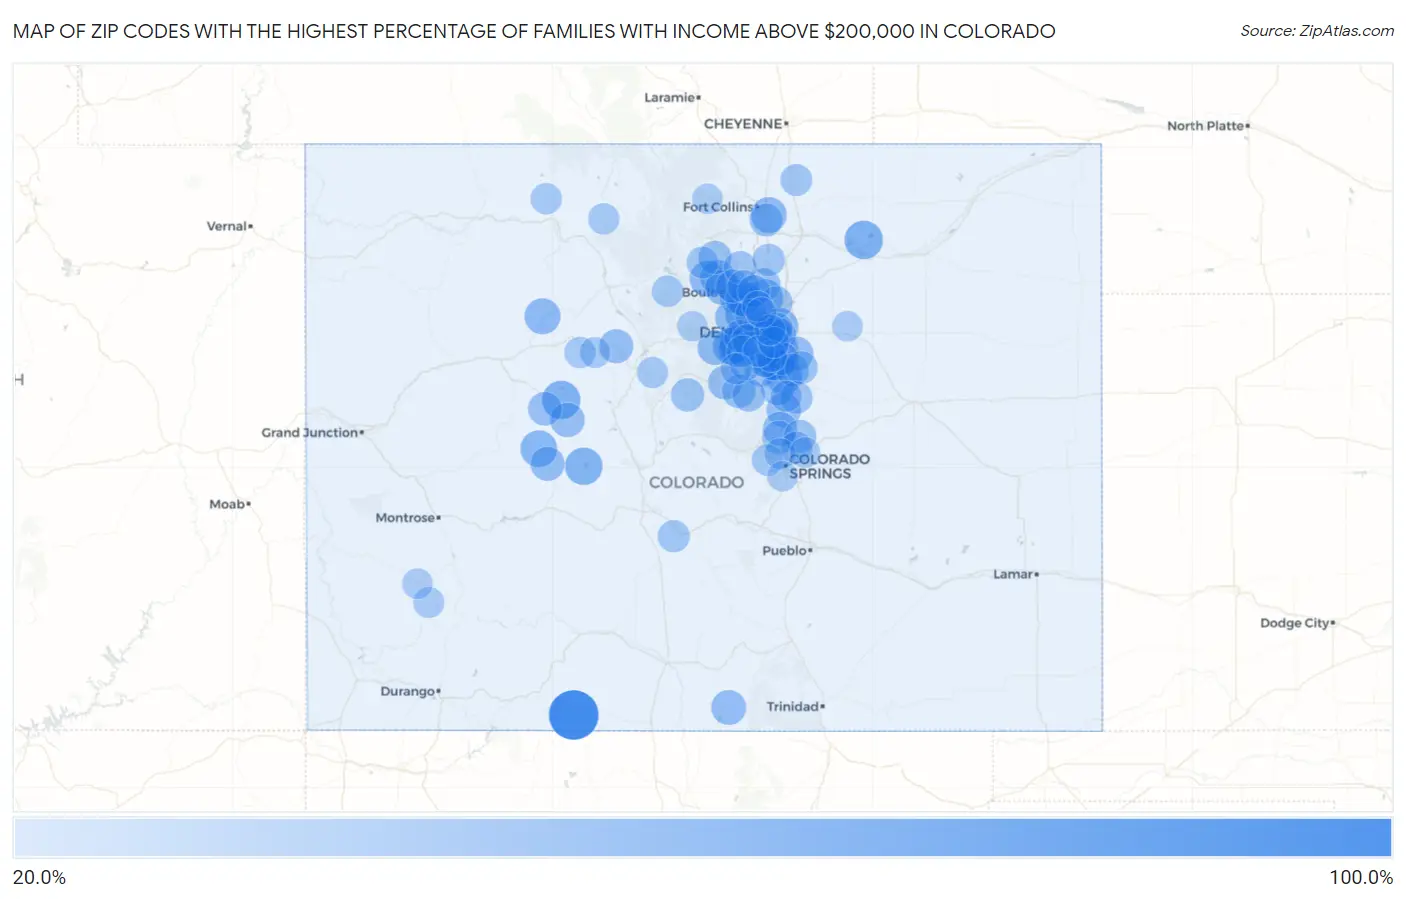
Map of Zip Codes with the Highest Percentage of Families with Income Above $200,000 in Colorado
20.0%
100.0%
Zip Codes with the Highest Percentage of Families with Income Above $200,000 in Colorado
| Zip Code | Families with Income > $200k | vs State | vs National | |
| 1. | 81128 | 100.0% | 18.4%(+81.6)#1 | 14.8%(+85.2)#47 |
| 2. | 80649 | 54.2% | 18.4%(+35.8)#2 | 14.8%(+39.4)#494 |
| 3. | 81656 | 53.6% | 18.4%(+35.2)#3 | 14.8%(+38.8)#516 |
| 4. | 81210 | 50.0% | 18.4%(+31.6)#4 | 14.8%(+35.2)#665 |
| 5. | 80453 | 49.1% | 18.4%(+30.7)#5 | 14.8%(+34.3)#714 |
| 6. | 80454 | 48.2% | 18.4%(+29.8)#6 | 14.8%(+33.4)#752 |
| 7. | 80007 | 47.9% | 18.4%(+29.5)#7 | 14.8%(+33.1)#767 |
| 8. | 81225 | 47.1% | 18.4%(+28.7)#8 | 14.8%(+32.3)#815 |
| 9. | 80457 | 46.7% | 18.4%(+28.3)#9 | 14.8%(+31.9)#832 |
| 10. | 80108 | 45.9% | 18.4%(+27.5)#10 | 14.8%(+31.1)#875 |
| 11. | 80023 | 45.5% | 18.4%(+27.1)#11 | 14.8%(+30.7)#903 |
| 12. | 80238 | 45.3% | 18.4%(+26.9)#12 | 14.8%(+30.5)#921 |
| 13. | 80209 | 44.2% | 18.4%(+25.8)#13 | 14.8%(+29.4)#980 |
| 14. | 80426 | 44.0% | 18.4%(+25.6)#14 | 14.8%(+29.2)#993 |
| 15. | 80111 | 43.9% | 18.4%(+25.5)#15 | 14.8%(+29.1)#996 |
| 16. | 80547 | 43.8% | 18.4%(+25.4)#16 | 14.8%(+29.0)#1,002 |
| 17. | 80206 | 43.7% | 18.4%(+25.3)#17 | 14.8%(+28.9)#1,006 |
| 18. | 80210 | 43.3% | 18.4%(+24.9)#18 | 14.8%(+28.5)#1,034 |
| 19. | 80218 | 43.2% | 18.4%(+24.8)#19 | 14.8%(+28.4)#1,039 |
| 20. | 80481 | 42.9% | 18.4%(+24.5)#20 | 14.8%(+28.1)#1,063 |
| 21. | 80126 | 41.7% | 18.4%(+23.3)#21 | 14.8%(+26.9)#1,165 |
| 22. | 80305 | 41.4% | 18.4%(+23.0)#22 | 14.8%(+26.6)#1,192 |
| 23. | 80027 | 40.6% | 18.4%(+22.2)#23 | 14.8%(+25.8)#1,260 |
| 24. | 80455 | 40.2% | 18.4%(+21.8)#24 | 14.8%(+25.4)#1,294 |
| 25. | 80403 | 40.1% | 18.4%(+21.7)#25 | 14.8%(+25.3)#1,305 |
| 26. | 80439 | 39.8% | 18.4%(+21.4)#26 | 14.8%(+25.0)#1,332 |
| 27. | 80302 | 39.7% | 18.4%(+21.3)#27 | 14.8%(+24.9)#1,336 |
| 28. | 81126 | 39.5% | 18.4%(+21.1)#28 | 14.8%(+24.7)#1,364 |
| 29. | 80230 | 39.3% | 18.4%(+20.9)#29 | 14.8%(+24.5)#1,385 |
| 30. | 80121 | 38.6% | 18.4%(+20.2)#30 | 14.8%(+23.8)#1,449 |
| 31. | 80303 | 38.4% | 18.4%(+20.0)#31 | 14.8%(+23.6)#1,474 |
| 32. | 80118 | 38.1% | 18.4%(+19.7)#32 | 14.8%(+23.3)#1,496 |
| 33. | 80016 | 37.7% | 18.4%(+19.3)#33 | 14.8%(+22.9)#1,522 |
| 34. | 81611 | 37.7% | 18.4%(+19.3)#34 | 14.8%(+22.9)#1,531 |
| 35. | 81224 | 37.0% | 18.4%(+18.6)#35 | 14.8%(+22.2)#1,610 |
| 36. | 81657 | 36.8% | 18.4%(+18.4)#36 | 14.8%(+22.0)#1,630 |
| 37. | 80132 | 36.5% | 18.4%(+18.1)#37 | 14.8%(+21.7)#1,669 |
| 38. | 80470 | 36.0% | 18.4%(+17.6)#38 | 14.8%(+21.2)#1,733 |
| 39. | 80124 | 35.7% | 18.4%(+17.3)#39 | 14.8%(+20.9)#1,757 |
| 40. | 81615 | 35.2% | 18.4%(+16.8)#40 | 14.8%(+20.4)#1,823 |
| 41. | 80516 | 34.4% | 18.4%(+16.0)#41 | 14.8%(+19.6)#1,911 |
| 42. | 80425 | 34.4% | 18.4%(+16.0)#42 | 14.8%(+19.6)#1,920 |
| 43. | 80113 | 34.2% | 18.4%(+15.8)#43 | 14.8%(+19.4)#1,935 |
| 44. | 80211 | 33.9% | 18.4%(+15.5)#44 | 14.8%(+19.1)#1,971 |
| 45. | 80125 | 33.9% | 18.4%(+15.5)#45 | 14.8%(+19.1)#1,975 |
| 46. | 80109 | 33.5% | 18.4%(+15.1)#46 | 14.8%(+18.7)#2,019 |
| 47. | 80212 | 33.5% | 18.4%(+15.1)#47 | 14.8%(+18.7)#2,023 |
| 48. | 80921 | 33.4% | 18.4%(+15.0)#48 | 14.8%(+18.6)#2,035 |
| 49. | 80304 | 33.3% | 18.4%(+14.9)#49 | 14.8%(+18.5)#2,048 |
| 50. | 80540 | 33.3% | 18.4%(+14.9)#50 | 14.8%(+18.5)#2,058 |
| 51. | 80456 | 33.3% | 18.4%(+14.9)#51 | 14.8%(+18.5)#2,066 |
| 52. | 80202 | 33.1% | 18.4%(+14.7)#52 | 14.8%(+18.3)#2,094 |
| 53. | 80130 | 33.0% | 18.4%(+14.6)#53 | 14.8%(+18.2)#2,103 |
| 54. | 80135 | 32.8% | 18.4%(+14.4)#54 | 14.8%(+18.0)#2,131 |
| 55. | 80220 | 32.7% | 18.4%(+14.3)#55 | 14.8%(+17.9)#2,137 |
| 56. | 80127 | 32.6% | 18.4%(+14.2)#56 | 14.8%(+17.8)#2,152 |
| 57. | 80528 | 32.5% | 18.4%(+14.1)#57 | 14.8%(+17.7)#2,168 |
| 58. | 80503 | 31.6% | 18.4%(+13.2)#58 | 14.8%(+16.8)#2,278 |
| 59. | 80112 | 31.6% | 18.4%(+13.2)#59 | 14.8%(+16.8)#2,279 |
| 60. | 80134 | 31.2% | 18.4%(+12.8)#60 | 14.8%(+16.4)#2,335 |
| 61. | 80908 | 31.1% | 18.4%(+12.7)#61 | 14.8%(+16.3)#2,352 |
| 62. | 80138 | 31.0% | 18.4%(+12.6)#62 | 14.8%(+16.2)#2,364 |
| 63. | 80602 | 30.5% | 18.4%(+12.1)#63 | 14.8%(+15.7)#2,436 |
| 64. | 80207 | 30.4% | 18.4%(+12.0)#64 | 14.8%(+15.6)#2,458 |
| 65. | 80116 | 30.4% | 18.4%(+12.0)#65 | 14.8%(+15.6)#2,464 |
| 66. | 80301 | 30.2% | 18.4%(+11.8)#66 | 14.8%(+15.4)#2,493 |
| 67. | 80542 | 30.2% | 18.4%(+11.8)#67 | 14.8%(+15.4)#2,498 |
| 68. | 80026 | 29.8% | 18.4%(+11.4)#68 | 14.8%(+15.0)#2,540 |
| 69. | 80401 | 29.7% | 18.4%(+11.3)#69 | 14.8%(+14.9)#2,551 |
| 70. | 81222 | 28.8% | 18.4%(+10.4)#70 | 14.8%(+14.0)#2,724 |
| 71. | 80005 | 28.6% | 18.4%(+10.2)#71 | 14.8%(+13.8)#2,747 |
| 72. | 80129 | 28.2% | 18.4%(+9.80)#72 | 14.8%(+13.4)#2,829 |
| 73. | 80924 | 28.1% | 18.4%(+9.70)#73 | 14.8%(+13.3)#2,853 |
| 74. | 80510 | 27.5% | 18.4%(+9.10)#74 | 14.8%(+12.7)#2,962 |
| 75. | 80228 | 27.4% | 18.4%(+9.00)#75 | 14.8%(+12.6)#2,969 |
| 76. | 80648 | 27.4% | 18.4%(+9.00)#76 | 14.8%(+12.6)#2,984 |
| 77. | 80465 | 27.0% | 18.4%(+8.60)#77 | 14.8%(+12.2)#3,049 |
| 78. | 80122 | 26.6% | 18.4%(+8.20)#78 | 14.8%(+11.8)#3,126 |
| 79. | 80809 | 26.6% | 18.4%(+8.20)#79 | 14.8%(+11.8)#3,137 |
| 80. | 80123 | 26.3% | 18.4%(+7.90)#80 | 14.8%(+11.5)#3,177 |
| 81. | 80433 | 26.3% | 18.4%(+7.90)#81 | 14.8%(+11.5)#3,185 |
| 82. | 80478 | 26.0% | 18.4%(+7.60)#82 | 14.8%(+11.2)#3,255 |
| 83. | 81632 | 25.5% | 18.4%(+7.10)#83 | 14.8%(+10.7)#3,351 |
| 84. | 80104 | 25.4% | 18.4%(+7.00)#84 | 14.8%(+10.6)#3,362 |
| 85. | 80487 | 25.4% | 18.4%(+7.00)#85 | 14.8%(+10.6)#3,367 |
| 86. | 80430 | 25.0% | 18.4%(+6.60)#86 | 14.8%(+10.2)#3,486 |
| 87. | 80222 | 24.8% | 18.4%(+6.40)#87 | 14.8%(+10.00)#3,522 |
| 88. | 80424 | 24.7% | 18.4%(+6.30)#88 | 14.8%(+9.90)#3,545 |
| 89. | 80919 | 24.5% | 18.4%(+6.10)#89 | 14.8%(+9.70)#3,594 |
| 90. | 80205 | 24.2% | 18.4%(+5.80)#90 | 14.8%(+9.40)#3,655 |
| 91. | 81620 | 23.9% | 18.4%(+5.50)#91 | 14.8%(+9.10)#3,734 |
| 92. | 81435 | 23.5% | 18.4%(+5.10)#92 | 14.8%(+8.70)#3,835 |
| 93. | 80020 | 23.0% | 18.4%(+4.60)#93 | 14.8%(+8.20)#3,934 |
| 94. | 80031 | 22.6% | 18.4%(+4.20)#94 | 14.8%(+7.80)#4,038 |
| 95. | 80906 | 22.5% | 18.4%(+4.10)#95 | 14.8%(+7.70)#4,075 |
| 96. | 80136 | 22.5% | 18.4%(+4.10)#96 | 14.8%(+7.70)#4,087 |
| 97. | 80927 | 22.5% | 18.4%(+4.10)#97 | 14.8%(+7.70)#4,088 |
| 98. | 81430 | 22.4% | 18.4%(+4.00)#98 | 14.8%(+7.60)#4,125 |
| 99. | 80512 | 21.8% | 18.4%(+3.40)#99 | 14.8%(+7.00)#4,280 |
| 100. | 80436 | 21.8% | 18.4%(+3.40)#100 | 14.8%(+7.00)#4,287 |
Common Questions
What are the Top 10 Zip Codes with the Highest Percentage of Families with Income Above $200,000 in Colorado?
Top 10 Zip Codes with the Highest Percentage of Families with Income Above $200,000 in Colorado are:
What zip code has the Highest Percentage of Families with Income Above $200,000 in Colorado?
81128 has the Highest Percentage of Families with Income Above $200,000 in Colorado with 100.0%.
What is the Percentage of Families with Income Above $200,000 in the State of Colorado?
Percentage of Families with Income Above $200,000 in Colorado is 18.4%.
What is the Percentage of Families with Income Above $200,000 in the United States?
Percentage of Families with Income Above $200,000 in the United States is 14.8%.