Genesee, CO Map & Demographics
Genesee Map
Genesee Overview
$88,749
PER CAPITA INCOME
$180,694
AVG FAMILY INCOME
$174,375
AVG HOUSEHOLD INCOME
12.8%
WAGE / INCOME GAP [ % ]
87.2¢/ $1
WAGE / INCOME GAP [ $ ]
0.36
INEQUALITY / GINI INDEX
4,046
TOTAL POPULATION
2,020
MALE POPULATION
2,026
FEMALE POPULATION
99.70
MALES / 100 FEMALES
100.30
FEMALES / 100 MALES
51.8
MEDIAN AGE
2.7
AVG FAMILY SIZE
2.5
AVG HOUSEHOLD SIZE
1,923
LABOR FORCE [ PEOPLE ]
58.7%
PERCENT IN LABOR FORCE
2.3%
UNEMPLOYMENT RATE
Income in Genesee
Income Overview in Genesee
Per Capita Income in Genesee is $88,749, while median incomes of families and households are $180,694 and $174,375 respectively.
| Characteristic | Number | Measure |
| Per Capita Income | 4,046 | $88,749 |
| Median Family Income | 1,335 | $180,694 |
| Mean Family Income | 1,335 | $232,690 |
| Median Household Income | 1,615 | $174,375 |
| Mean Household Income | 1,615 | $217,939 |
| Income Deficit | 1,335 | $0 |
| Wage / Income Gap (%) | 4,046 | 12.75% |
| Wage / Income Gap ($) | 4,046 | 87.25¢ per $1 |
| Gini / Inequality Index | 4,046 | 0.36 |
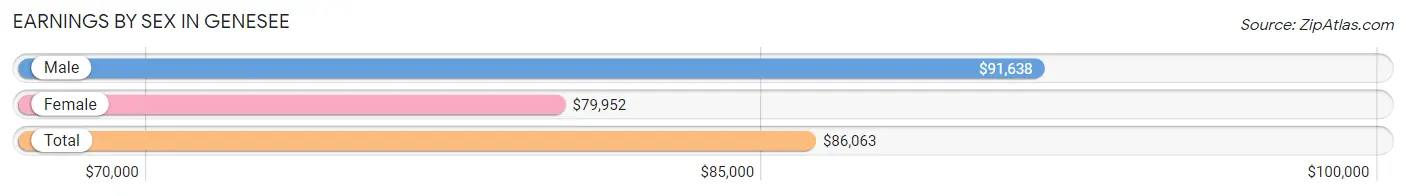
Earnings by Sex in Genesee
Average Earnings in Genesee are $86,063, $91,638 for men and $79,952 for women, a difference of 12.8%.
| Sex | Number | Average Earnings |
| Male | 1,212 (58.6%) | $91,638 |
| Female | 855 (41.4%) | $79,952 |
| Total | 2,067 (100.0%) | $86,063 |
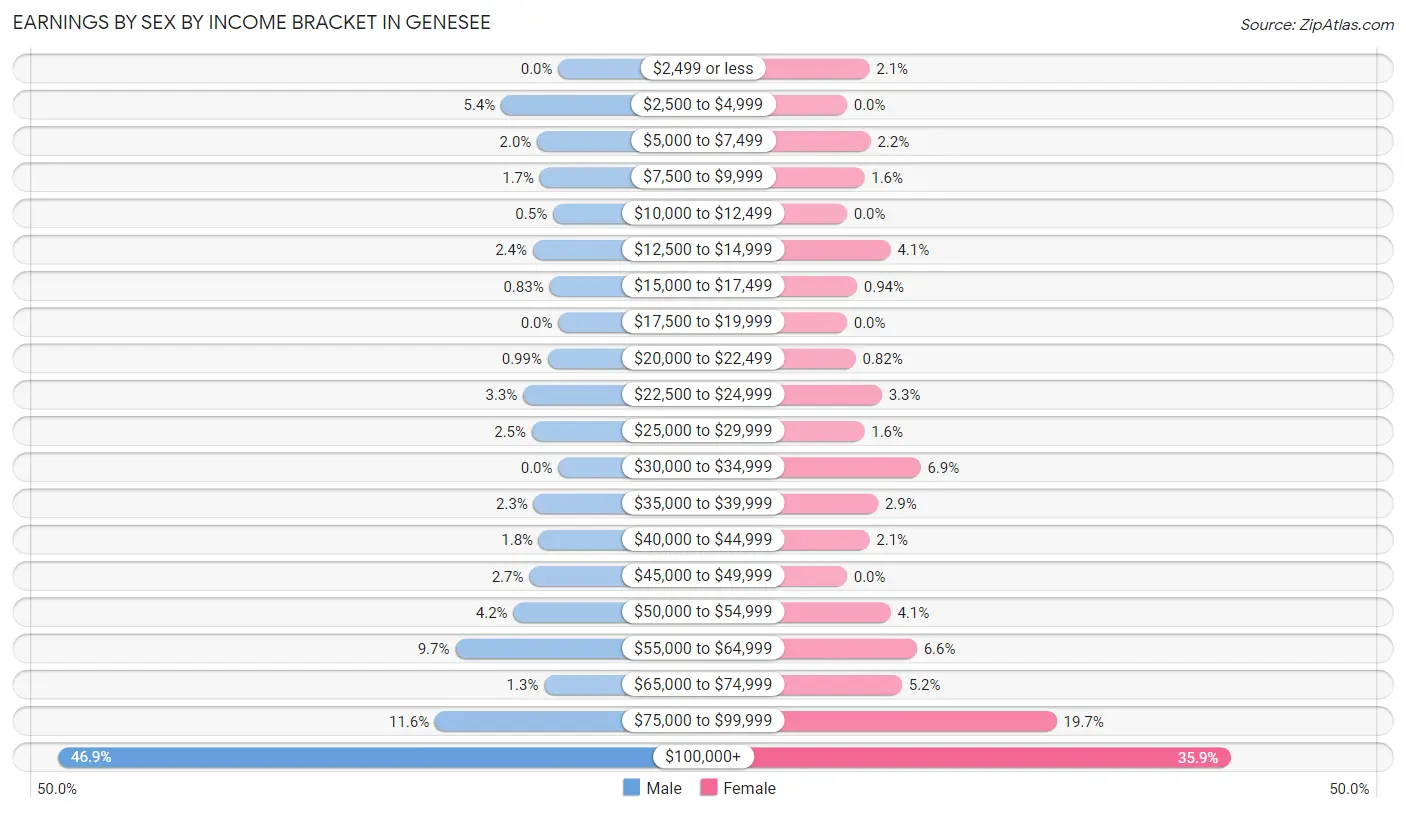
Earnings by Sex by Income Bracket in Genesee
The most common earnings brackets in Genesee are $100,000+ for men (568 | 46.9%) and $100,000+ for women (307 | 35.9%).
| Income | Male | Female |
| $2,499 or less | 0 (0.0%) | 18 (2.1%) |
| $2,500 to $4,999 | 65 (5.4%) | 0 (0.0%) |
| $5,000 to $7,499 | 24 (2.0%) | 19 (2.2%) |
| $7,500 to $9,999 | 21 (1.7%) | 14 (1.6%) |
| $10,000 to $12,499 | 6 (0.5%) | 0 (0.0%) |
| $12,500 to $14,999 | 29 (2.4%) | 35 (4.1%) |
| $15,000 to $17,499 | 10 (0.8%) | 8 (0.9%) |
| $17,500 to $19,999 | 0 (0.0%) | 0 (0.0%) |
| $20,000 to $22,499 | 12 (1.0%) | 7 (0.8%) |
| $22,500 to $24,999 | 40 (3.3%) | 28 (3.3%) |
| $25,000 to $29,999 | 30 (2.5%) | 14 (1.6%) |
| $30,000 to $34,999 | 0 (0.0%) | 59 (6.9%) |
| $35,000 to $39,999 | 28 (2.3%) | 25 (2.9%) |
| $40,000 to $44,999 | 22 (1.8%) | 18 (2.1%) |
| $45,000 to $49,999 | 33 (2.7%) | 0 (0.0%) |
| $50,000 to $54,999 | 51 (4.2%) | 35 (4.1%) |
| $55,000 to $64,999 | 117 (9.7%) | 56 (6.6%) |
| $65,000 to $74,999 | 16 (1.3%) | 44 (5.1%) |
| $75,000 to $99,999 | 140 (11.6%) | 168 (19.7%) |
| $100,000+ | 568 (46.9%) | 307 (35.9%) |
| Total | 1,212 (100.0%) | 855 (100.0%) |
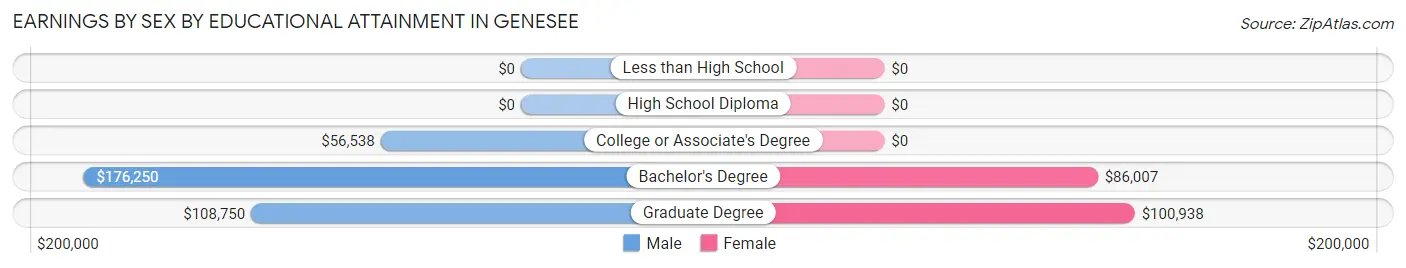
Earnings by Sex by Educational Attainment in Genesee
Average earnings in Genesee are $114,038 for men and $84,375 for women, a difference of 26.0%. Men with an educational attainment of bachelor's degree enjoy the highest average annual earnings of $176,250, while those with college or associate's degree education earn the least with $56,538. Women with an educational attainment of graduate degree earn the most with the average annual earnings of $100,938, while those with bachelor's degree education have the smallest earnings of $86,007.
| Educational Attainment | Male Income | Female Income |
| Less than High School | - | - |
| High School Diploma | - | - |
| College or Associate's Degree | $56,538 | $0 |
| Bachelor's Degree | $176,250 | $86,007 |
| Graduate Degree | $108,750 | $100,938 |
| Total | $114,038 | $84,375 |
Family Income in Genesee
Family Income Brackets in Genesee
According to the Genesee family income data, there are 619 families falling into the $200,000+ income range, which is the most common income bracket and makes up 46.4% of all families.
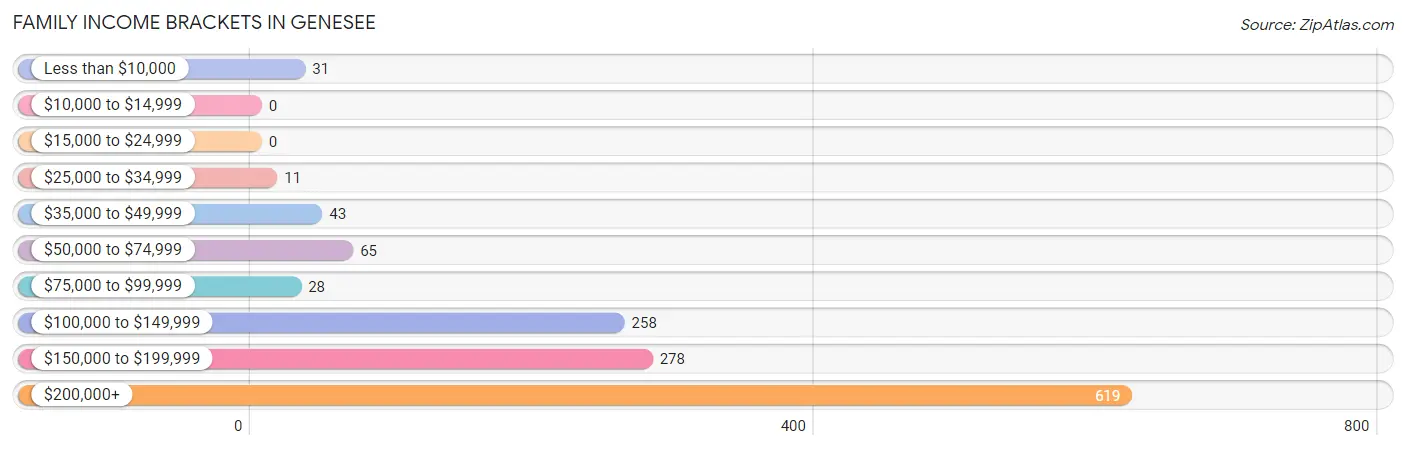
| Income Bracket | # Families | % Families |
| Less than $10,000 | 31 | 2.3% |
| $10,000 to $14,999 | 0 | 0.0% |
| $15,000 to $24,999 | 0 | 0.0% |
| $25,000 to $34,999 | 11 | 0.8% |
| $35,000 to $49,999 | 43 | 3.2% |
| $50,000 to $74,999 | 65 | 4.9% |
| $75,000 to $99,999 | 28 | 2.1% |
| $100,000 to $149,999 | 258 | 19.3% |
| $150,000 to $199,999 | 278 | 20.8% |
| $200,000+ | 619 | 46.4% |
Family Income by Famaliy Size in Genesee
3-person families (150 | 11.2%) account for the highest median family income in Genesee with $250,001 per family, while 2-person families (839 | 62.8%) have the highest median income of $86,508 per family member.
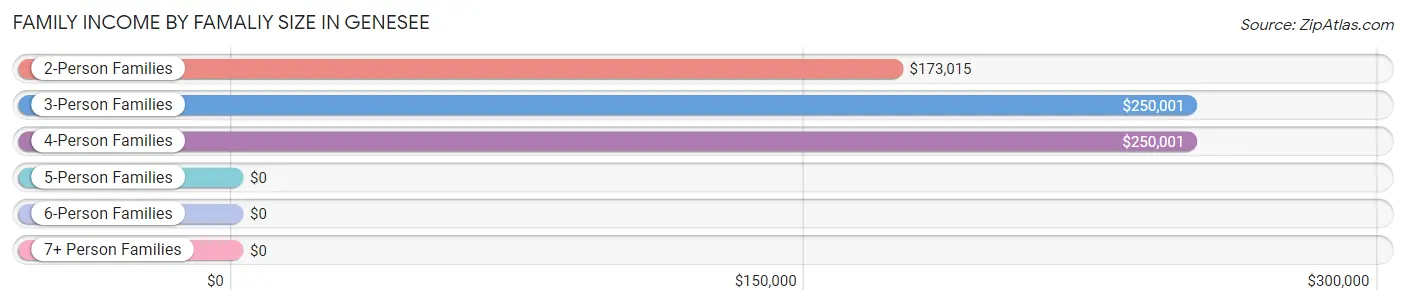
| Income Bracket | # Families | Median Income |
| 2-Person Families | 839 (62.8%) | $173,015 |
| 3-Person Families | 150 (11.2%) | $250,001 |
| 4-Person Families | 315 (23.6%) | $250,001 |
| 5-Person Families | 11 (0.8%) | $0 |
| 6-Person Families | 20 (1.5%) | $0 |
| 7+ Person Families | 0 (0.0%) | $0 |
| Total | 1,335 (100.0%) | $180,694 |
Family Income by Number of Earners in Genesee
The median family income in Genesee is $180,694, with families comprising 3+ earners (63) having the highest median family income of $250,001, while families with no earners (283) have the lowest median family income of $157,656, accounting for 4.7% and 21.2% of families, respectively.
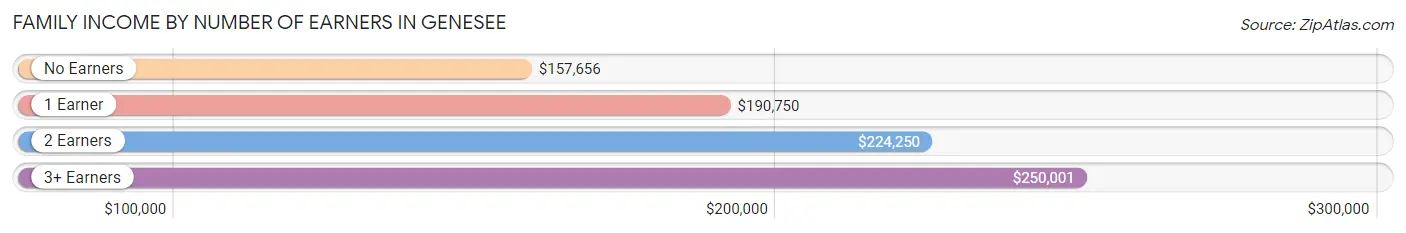
| Number of Earners | # Families | Median Income |
| No Earners | 283 (21.2%) | $157,656 |
| 1 Earner | 424 (31.8%) | $190,750 |
| 2 Earners | 565 (42.3%) | $224,250 |
| 3+ Earners | 63 (4.7%) | $250,001 |
| Total | 1,335 (100.0%) | $180,694 |
Household Income in Genesee
Household Income Brackets in Genesee
With 685 households falling in the category, the $200,000+ income range is the most frequent in Genesee, accounting for 42.4% of all households.
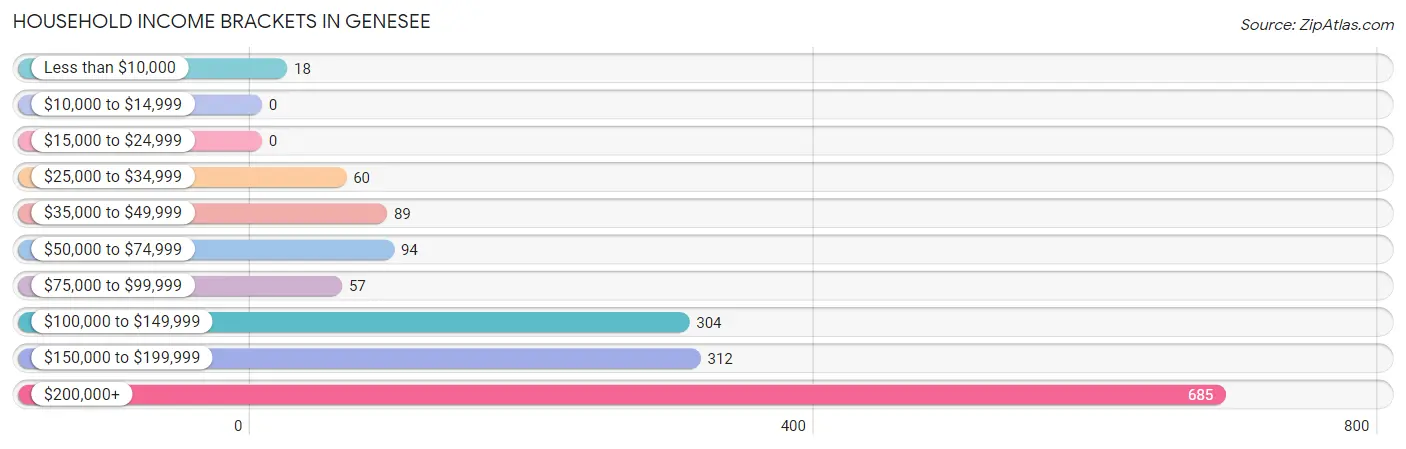
| Income Bracket | # Households | % Households |
| Less than $10,000 | 18 | 1.1% |
| $10,000 to $14,999 | 0 | 0.0% |
| $15,000 to $24,999 | 0 | 0.0% |
| $25,000 to $34,999 | 60 | 3.7% |
| $35,000 to $49,999 | 89 | 5.5% |
| $50,000 to $74,999 | 94 | 5.8% |
| $75,000 to $99,999 | 57 | 3.5% |
| $100,000 to $149,999 | 304 | 18.8% |
| $150,000 to $199,999 | 312 | 19.3% |
| $200,000+ | 685 | 42.4% |
Household Income by Householder Age in Genesee
The median household income in Genesee is $174,375, with the highest median household income of $235,625 found in the 45 to 64 years age bracket for the primary householder. A total of 658 households (40.7%) fall into this category. Meanwhile, the 15 to 24 years age bracket for the primary householder has the lowest median household income of $0, with 6 households (0.4%) in this group.
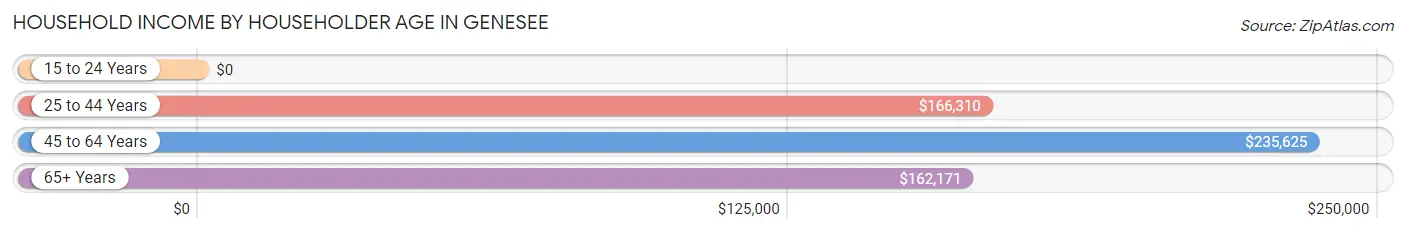
| Income Bracket | # Households | Median Income |
| 15 to 24 Years | 6 (0.4%) | $0 |
| 25 to 44 Years | 284 (17.6%) | $166,310 |
| 45 to 64 Years | 658 (40.7%) | $235,625 |
| 65+ Years | 667 (41.3%) | $162,171 |
| Total | 1,615 (100.0%) | $174,375 |
Poverty in Genesee
Income Below Poverty by Sex and Age in Genesee
With 1.9% poverty level for males and 3.0% for females among the residents of Genesee, 25 to 34 year old males and 25 to 34 year old females are the most vulnerable to poverty, with 13 males (15.3%) and 21 females (36.2%) in their respective age groups living below the poverty level.
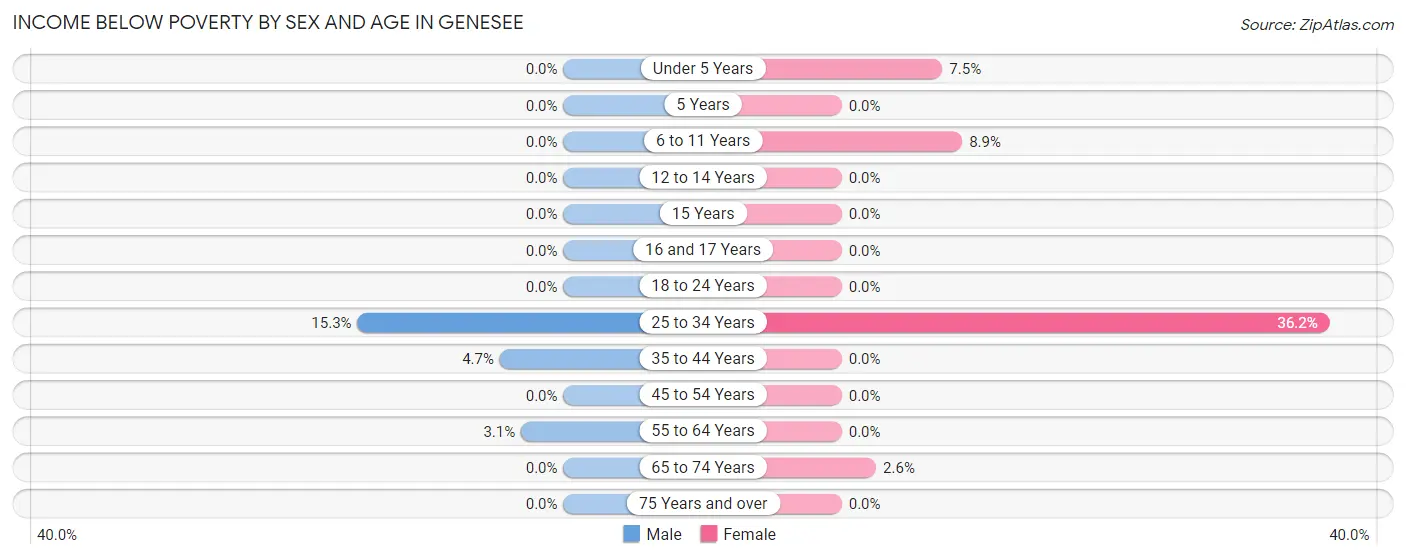
| Age Bracket | Male | Female |
| Under 5 Years | 0 (0.0%) | 13 (7.5%) |
| 5 Years | 0 (0.0%) | 0 (0.0%) |
| 6 to 11 Years | 0 (0.0%) | 16 (8.9%) |
| 12 to 14 Years | 0 (0.0%) | 0 (0.0%) |
| 15 Years | 0 (0.0%) | 0 (0.0%) |
| 16 and 17 Years | 0 (0.0%) | 0 (0.0%) |
| 18 to 24 Years | 0 (0.0%) | 0 (0.0%) |
| 25 to 34 Years | 13 (15.3%) | 21 (36.2%) |
| 35 to 44 Years | 15 (4.7%) | 0 (0.0%) |
| 45 to 54 Years | 0 (0.0%) | 0 (0.0%) |
| 55 to 64 Years | 10 (3.1%) | 0 (0.0%) |
| 65 to 74 Years | 0 (0.0%) | 10 (2.5%) |
| 75 Years and over | 0 (0.0%) | 0 (0.0%) |
| Total | 38 (1.9%) | 60 (3.0%) |
Income Above Poverty by Sex and Age in Genesee
According to the poverty statistics in Genesee, males aged under 5 years and females aged 5 years are the age groups that are most secure financially, with 100.0% of males and 100.0% of females in these age groups living above the poverty line.
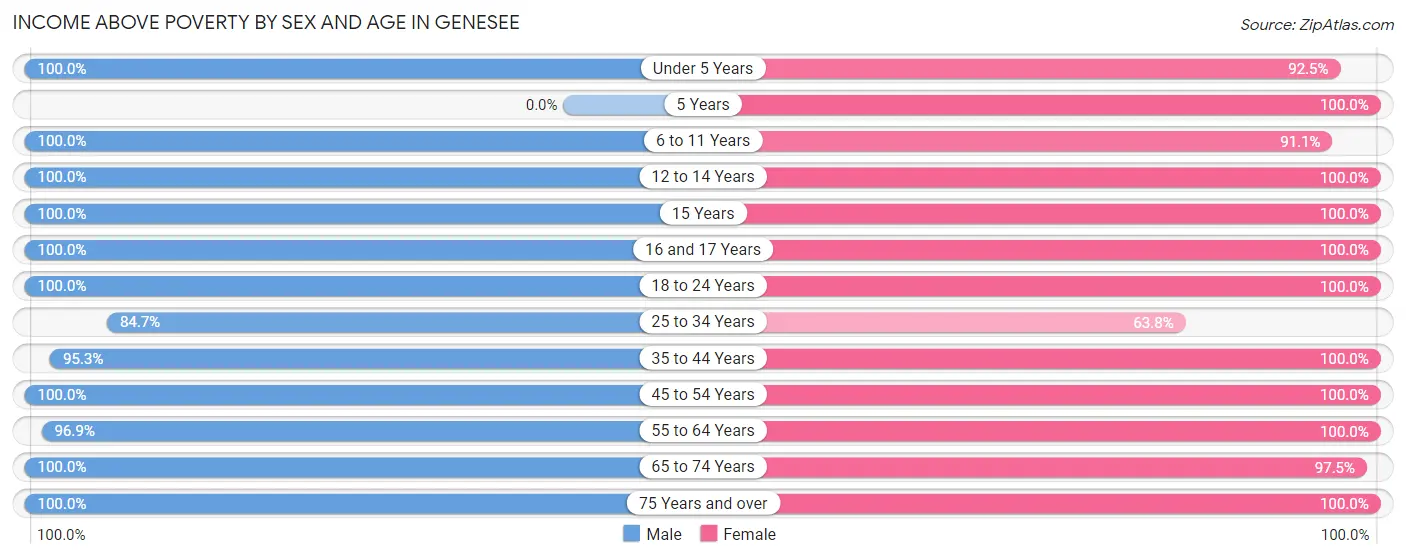
| Age Bracket | Male | Female |
| Under 5 Years | 32 (100.0%) | 161 (92.5%) |
| 5 Years | 0 (0.0%) | 10 (100.0%) |
| 6 to 11 Years | 104 (100.0%) | 163 (91.1%) |
| 12 to 14 Years | 90 (100.0%) | 95 (100.0%) |
| 15 Years | 74 (100.0%) | 12 (100.0%) |
| 16 and 17 Years | 68 (100.0%) | 29 (100.0%) |
| 18 to 24 Years | 82 (100.0%) | 13 (100.0%) |
| 25 to 34 Years | 72 (84.7%) | 37 (63.8%) |
| 35 to 44 Years | 303 (95.3%) | 274 (100.0%) |
| 45 to 54 Years | 261 (100.0%) | 269 (100.0%) |
| 55 to 64 Years | 308 (96.9%) | 380 (100.0%) |
| 65 to 74 Years | 368 (100.0%) | 382 (97.5%) |
| 75 Years and over | 220 (100.0%) | 141 (100.0%) |
| Total | 1,982 (98.1%) | 1,966 (97.0%) |
Income Below Poverty Among Married-Couple Families in Genesee
The poverty statistics for married-couple families in Genesee show that 0.8% or 10 of the total 1,228 families live below the poverty line. Families with no children have the highest poverty rate of 1.2%, comprising of 10 families. On the other hand, families with 1 or 2 children have the lowest poverty rate of 0.0%, which includes 0 families.
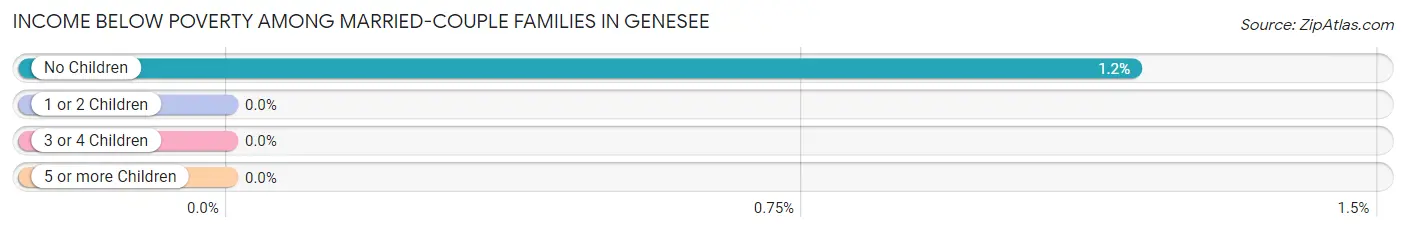
| Children | Above Poverty | Below Poverty |
| No Children | 838 (98.8%) | 10 (1.2%) |
| 1 or 2 Children | 355 (100.0%) | 0 (0.0%) |
| 3 or 4 Children | 25 (100.0%) | 0 (0.0%) |
| 5 or more Children | 0 (0.0%) | 0 (0.0%) |
| Total | 1,218 (99.2%) | 10 (0.8%) |
Income Below Poverty Among Single-Parent Households in Genesee
According to the poverty data in Genesee, 28.3% or 13 single-father households and 13.1% or 8 single-mother households are living below the poverty line. Among single-father households, those with 1 or 2 children have the highest poverty rate, with 13 households (28.3%) experiencing poverty. Likewise, among single-mother households, those with 1 or 2 children have the highest poverty rate, with 8 households (34.8%) falling below the poverty line.
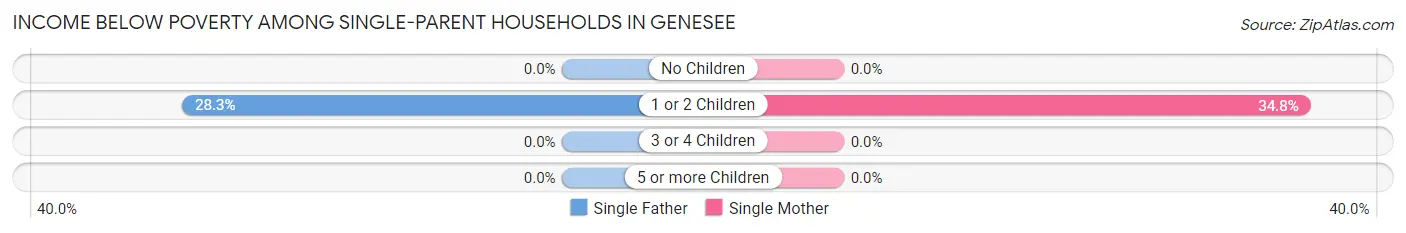
| Children | Single Father | Single Mother |
| No Children | 0 (0.0%) | 0 (0.0%) |
| 1 or 2 Children | 13 (28.3%) | 8 (34.8%) |
| 3 or 4 Children | 0 (0.0%) | 0 (0.0%) |
| 5 or more Children | 0 (0.0%) | 0 (0.0%) |
| Total | 13 (28.3%) | 8 (13.1%) |
Income Below Poverty Among Married-Couple vs Single-Parent Households in Genesee
The poverty data for Genesee shows that 10 of the married-couple family households (0.8%) and 21 of the single-parent households (19.6%) are living below the poverty level. Within the married-couple family households, those with no children have the highest poverty rate, with 10 households (1.2%) falling below the poverty line. Among the single-parent households, those with 1 or 2 children have the highest poverty rate, with 21 household (30.4%) living below poverty.
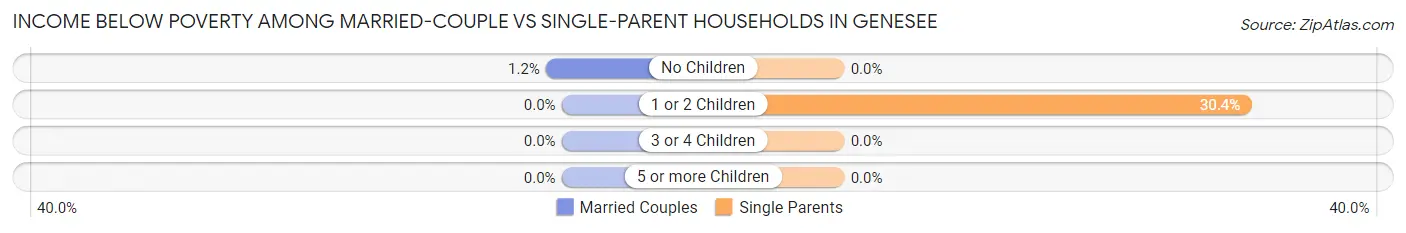
| Children | Married-Couple Families | Single-Parent Households |
| No Children | 10 (1.2%) | 0 (0.0%) |
| 1 or 2 Children | 0 (0.0%) | 21 (30.4%) |
| 3 or 4 Children | 0 (0.0%) | 0 (0.0%) |
| 5 or more Children | 0 (0.0%) | 0 (0.0%) |
| Total | 10 (0.8%) | 21 (19.6%) |
Race in Genesee
The most populous races in Genesee are White / Caucasian (3,591 | 88.7%), Two or more Races (382 | 9.4%), and Hispanic or Latino (171 | 4.2%).
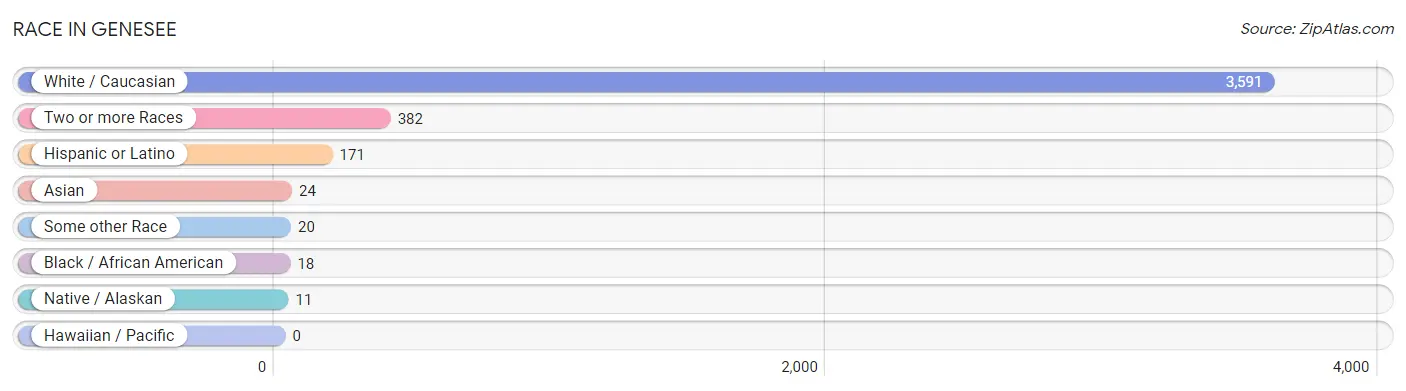
| Race | # Population | % Population |
| Asian | 24 | 0.6% |
| Black / African American | 18 | 0.4% |
| Hawaiian / Pacific | 0 | 0.0% |
| Hispanic or Latino | 171 | 4.2% |
| Native / Alaskan | 11 | 0.3% |
| White / Caucasian | 3,591 | 88.7% |
| Two or more Races | 382 | 9.4% |
| Some other Race | 20 | 0.5% |
| Total | 4,046 | 100.0% |
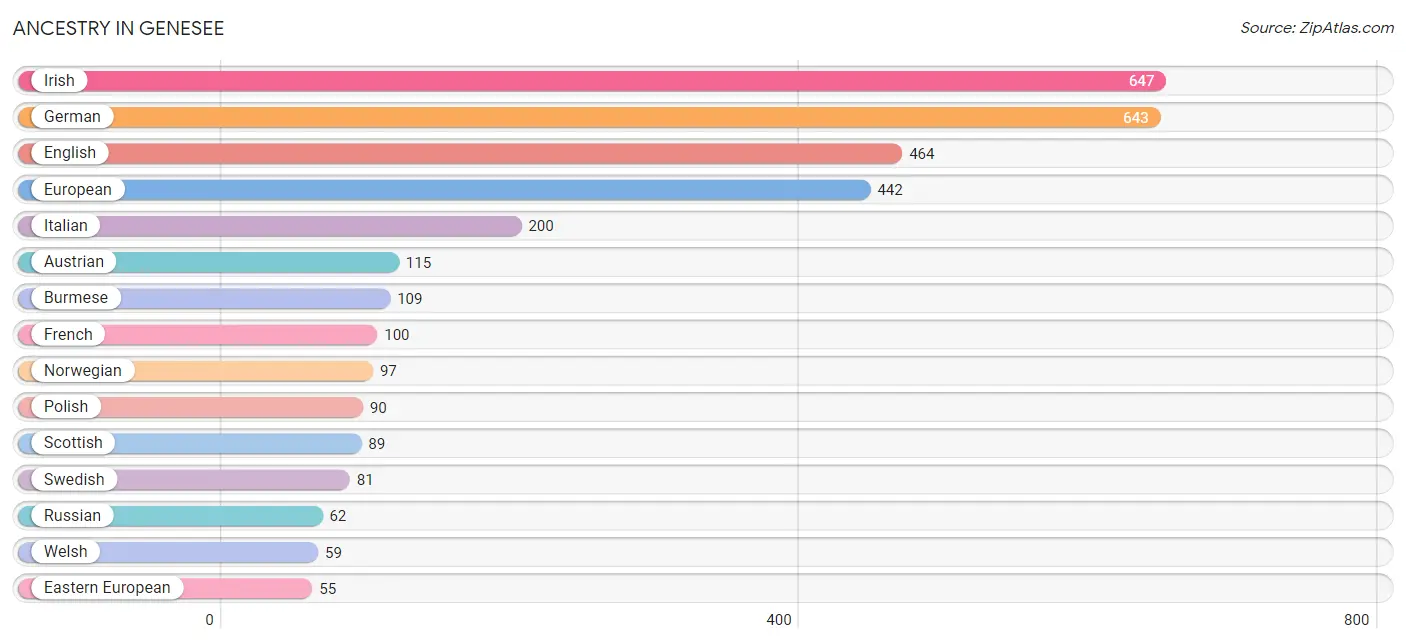
Ancestry in Genesee
The most populous ancestries reported in Genesee are Irish (647 | 16.0%), German (643 | 15.9%), English (464 | 11.5%), European (442 | 10.9%), and Italian (200 | 4.9%), together accounting for 59.2% of all Genesee residents.
| Ancestry | # Population | % Population |
| African | 18 | 0.4% |
| Alaskan Athabascan | 11 | 0.3% |
| American | 45 | 1.1% |
| Armenian | 30 | 0.7% |
| Austrian | 115 | 2.8% |
| Bhutanese | 7 | 0.2% |
| Brazilian | 5 | 0.1% |
| British | 25 | 0.6% |
| Burmese | 109 | 2.7% |
| Canadian | 14 | 0.4% |
| Colombian | 12 | 0.3% |
| Croatian | 14 | 0.4% |
| Cuban | 53 | 1.3% |
| Czech | 6 | 0.2% |
| Danish | 33 | 0.8% |
| Dutch | 46 | 1.1% |
| Eastern European | 55 | 1.4% |
| English | 464 | 11.5% |
| European | 442 | 10.9% |
| Finnish | 17 | 0.4% |
| French | 100 | 2.5% |
| French Canadian | 10 | 0.3% |
| German | 643 | 15.9% |
| German Russian | 10 | 0.3% |
| Greek | 38 | 0.9% |
| Hungarian | 23 | 0.6% |
| Indian (Asian) | 31 | 0.8% |
| Iranian | 15 | 0.4% |
| Irish | 647 | 16.0% |
| Italian | 200 | 4.9% |
| Japanese | 29 | 0.7% |
| Latvian | 16 | 0.4% |
| Luxembourger | 10 | 0.3% |
| Mexican | 24 | 0.6% |
| New Zealander | 5 | 0.1% |
| Norwegian | 97 | 2.4% |
| Polish | 90 | 2.2% |
| Portuguese | 8 | 0.2% |
| Russian | 62 | 1.5% |
| Scotch-Irish | 19 | 0.5% |
| Scottish | 89 | 2.2% |
| South American | 32 | 0.8% |
| Spaniard | 26 | 0.6% |
| Spanish | 36 | 0.9% |
| Subsaharan African | 18 | 0.4% |
| Swedish | 81 | 2.0% |
| Swiss | 9 | 0.2% |
| Ukrainian | 8 | 0.2% |
| Venezuelan | 20 | 0.5% |
| Welsh | 59 | 1.5% |
| Yugoslavian | 9 | 0.2% | View All 51 Rows |
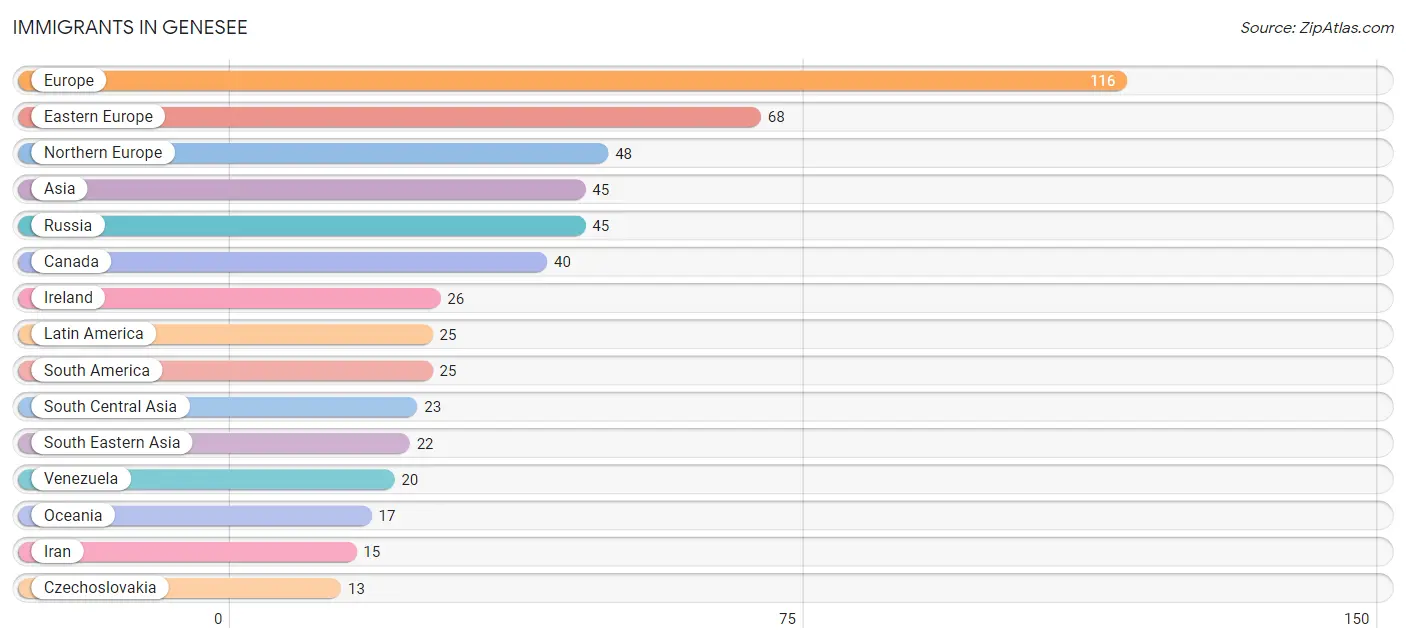
Immigrants in Genesee
The most numerous immigrant groups reported in Genesee came from Europe (116 | 2.9%), Eastern Europe (68 | 1.7%), Northern Europe (48 | 1.2%), Asia (45 | 1.1%), and Russia (45 | 1.1%), together accounting for 8.0% of all Genesee residents.
| Immigration Origin | # Population | % Population |
| Africa | 7 | 0.2% |
| Asia | 45 | 1.1% |
| Brazil | 5 | 0.1% |
| Cambodia | 12 | 0.3% |
| Canada | 40 | 1.0% |
| Czechoslovakia | 13 | 0.3% |
| Eastern Africa | 7 | 0.2% |
| Eastern Europe | 68 | 1.7% |
| England | 10 | 0.3% |
| Europe | 116 | 2.9% |
| Hungary | 10 | 0.3% |
| Iran | 15 | 0.4% |
| Ireland | 26 | 0.6% |
| Kenya | 7 | 0.2% |
| Latin America | 25 | 0.6% |
| Malaysia | 10 | 0.3% |
| Northern Europe | 48 | 1.2% |
| Oceania | 17 | 0.4% |
| Russia | 45 | 1.1% |
| South America | 25 | 0.6% |
| South Central Asia | 23 | 0.6% |
| South Eastern Asia | 22 | 0.5% |
| Venezuela | 20 | 0.5% | View All 23 Rows |
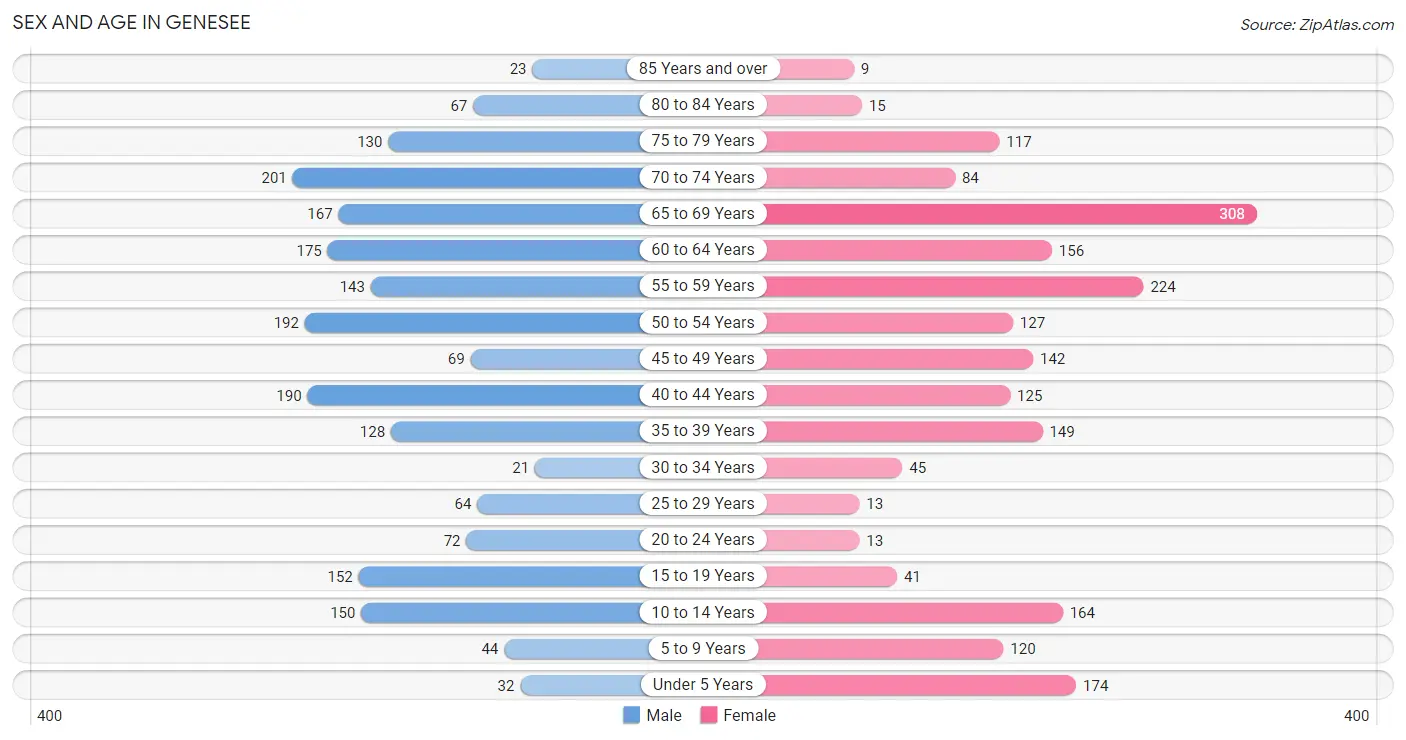
Sex and Age in Genesee
Sex and Age in Genesee
The most populous age groups in Genesee are 70 to 74 Years (201 | 10.0%) for men and 65 to 69 Years (308 | 15.2%) for women.
| Age Bracket | Male | Female |
| Under 5 Years | 32 (1.6%) | 174 (8.6%) |
| 5 to 9 Years | 44 (2.2%) | 120 (5.9%) |
| 10 to 14 Years | 150 (7.4%) | 164 (8.1%) |
| 15 to 19 Years | 152 (7.5%) | 41 (2.0%) |
| 20 to 24 Years | 72 (3.6%) | 13 (0.6%) |
| 25 to 29 Years | 64 (3.2%) | 13 (0.6%) |
| 30 to 34 Years | 21 (1.0%) | 45 (2.2%) |
| 35 to 39 Years | 128 (6.3%) | 149 (7.3%) |
| 40 to 44 Years | 190 (9.4%) | 125 (6.2%) |
| 45 to 49 Years | 69 (3.4%) | 142 (7.0%) |
| 50 to 54 Years | 192 (9.5%) | 127 (6.3%) |
| 55 to 59 Years | 143 (7.1%) | 224 (11.1%) |
| 60 to 64 Years | 175 (8.7%) | 156 (7.7%) |
| 65 to 69 Years | 167 (8.3%) | 308 (15.2%) |
| 70 to 74 Years | 201 (10.0%) | 84 (4.2%) |
| 75 to 79 Years | 130 (6.4%) | 117 (5.8%) |
| 80 to 84 Years | 67 (3.3%) | 15 (0.7%) |
| 85 Years and over | 23 (1.1%) | 9 (0.4%) |
| Total | 2,020 (100.0%) | 2,026 (100.0%) |
Families and Households in Genesee
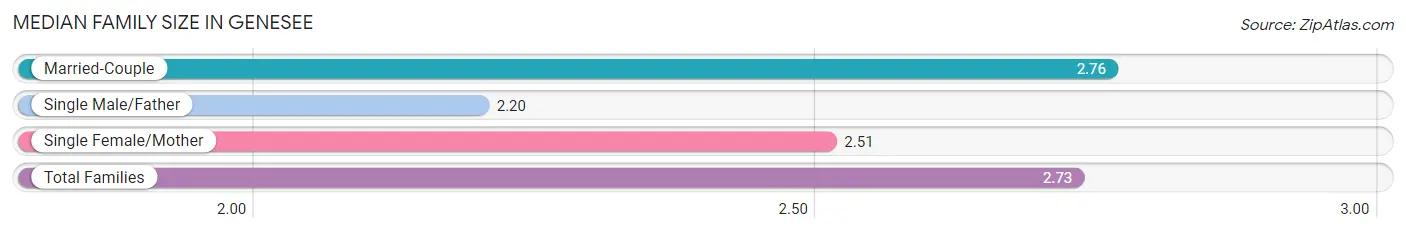
Median Family Size in Genesee
The median family size in Genesee is 2.73 persons per family, with married-couple families (1,228 | 92.0%) accounting for the largest median family size of 2.76 persons per family. On the other hand, single male/father families (46 | 3.5%) represent the smallest median family size with 2.20 persons per family.
| Family Type | # Families | Family Size |
| Married-Couple | 1,228 (92.0%) | 2.76 |
| Single Male/Father | 46 (3.5%) | 2.20 |
| Single Female/Mother | 61 (4.6%) | 2.51 |
| Total Families | 1,335 (100.0%) | 2.73 |
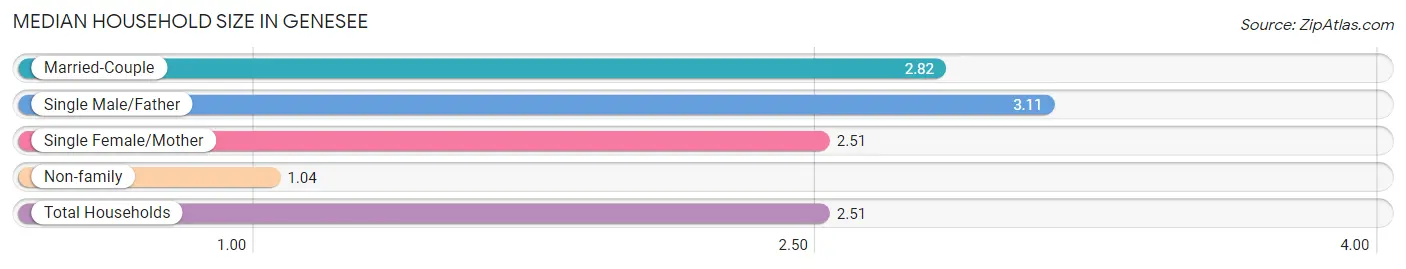
Median Household Size in Genesee
The median household size in Genesee is 2.51 persons per household, with single male/father households (46 | 2.9%) accounting for the largest median household size of 3.11 persons per household. non-family households (280 | 17.3%) represent the smallest median household size with 1.04 persons per household.
| Household Type | # Households | Household Size |
| Married-Couple | 1,228 (76.0%) | 2.82 |
| Single Male/Father | 46 (2.9%) | 3.11 |
| Single Female/Mother | 61 (3.8%) | 2.51 |
| Non-family | 280 (17.3%) | 1.04 |
| Total Households | 1,615 (100.0%) | 2.51 |
Household Size by Marriage Status in Genesee
Out of a total of 1,615 households in Genesee, 1,335 (82.7%) are family households, while 280 (17.3%) are nonfamily households. The most numerous type of family households are 2-person households, comprising 808, and the most common type of nonfamily households are 1-person households, comprising 269.
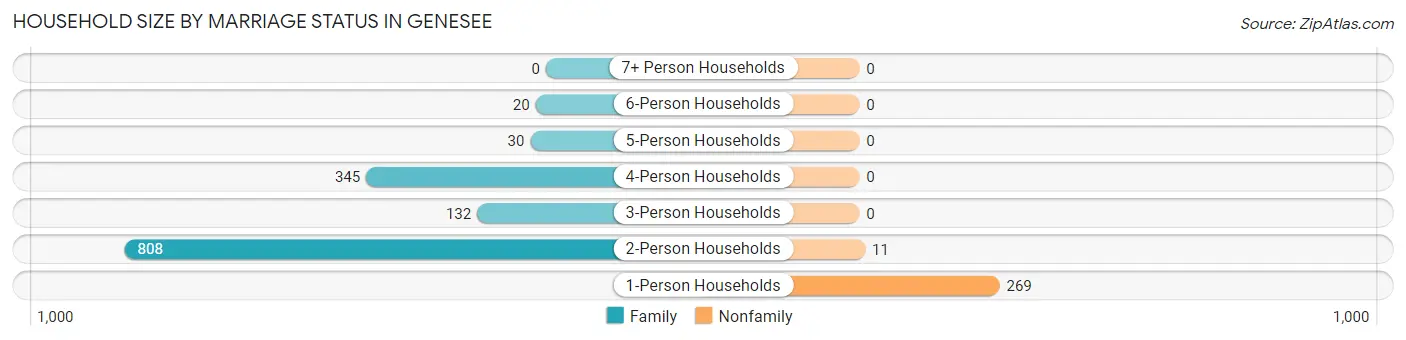
| Household Size | Family Households | Nonfamily Households |
| 1-Person Households | - | 269 (16.7%) |
| 2-Person Households | 808 (50.0%) | 11 (0.7%) |
| 3-Person Households | 132 (8.2%) | 0 (0.0%) |
| 4-Person Households | 345 (21.4%) | 0 (0.0%) |
| 5-Person Households | 30 (1.9%) | 0 (0.0%) |
| 6-Person Households | 20 (1.2%) | 0 (0.0%) |
| 7+ Person Households | 0 (0.0%) | 0 (0.0%) |
| Total | 1,335 (82.7%) | 280 (17.3%) |
Female Fertility in Genesee
Fertility by Age in Genesee
Average fertility rate in Genesee is 97.0 births per 1,000 women. Women in the age bracket of 20 to 34 years have the highest fertility rate with 183.0 births per 1,000 women. Women in the age bracket of 35 to 50 years acount for 74.5% of all women with births.
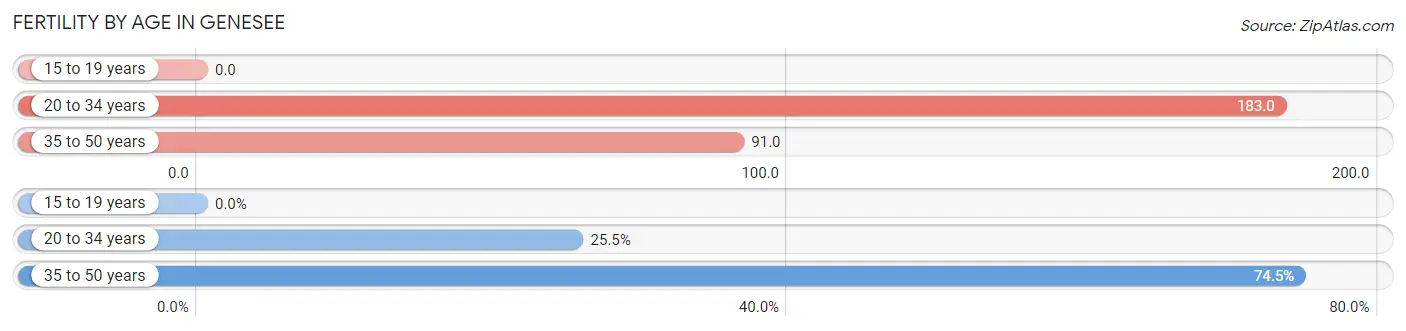
| Age Bracket | Women with Births | Births / 1,000 Women |
| 15 to 19 years | 0 (0.0%) | 0.0 |
| 20 to 34 years | 13 (25.5%) | 183.0 |
| 35 to 50 years | 38 (74.5%) | 91.0 |
| Total | 51 (100.0%) | 97.0 |
Fertility by Age by Marriage Status in Genesee
74.5% of women with births (51) in Genesee are married. The highest percentage of unmarried women with births falls into 20 to 34 years age bracket with 100.0% of them unmarried at the time of birth, while the lowest percentage of unmarried women with births belong to 35 to 50 years age bracket with 0.0% of them unmarried.
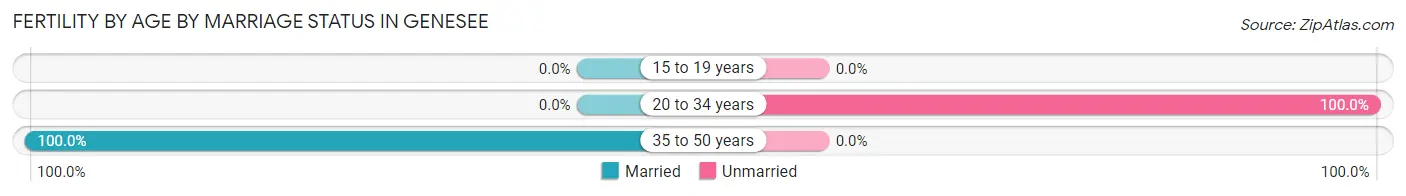
| Age Bracket | Married | Unmarried |
| 15 to 19 years | 0 (0.0%) | 0 (0.0%) |
| 20 to 34 years | 0 (0.0%) | 13 (100.0%) |
| 35 to 50 years | 38 (100.0%) | 0 (0.0%) |
| Total | 38 (74.5%) | 13 (25.5%) |
Fertility by Education in Genesee
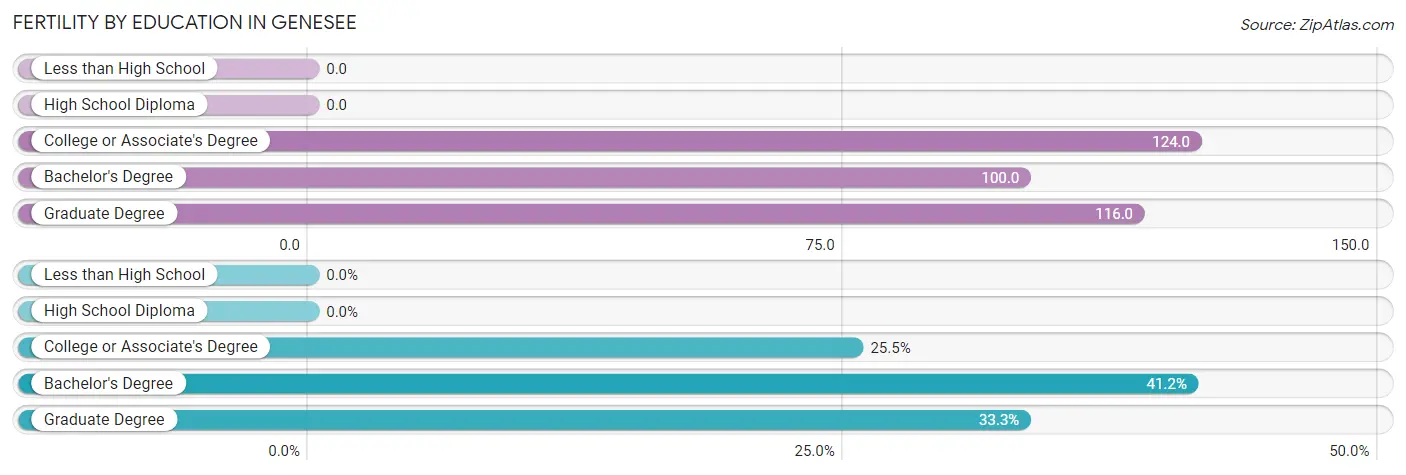
| Educational Attainment | Women with Births | Births / 1,000 Women |
| Less than High School | 0 (0.0%) | 0.0 |
| High School Diploma | 0 (0.0%) | 0.0 |
| College or Associate's Degree | 13 (25.5%) | 124.0 |
| Bachelor's Degree | 21 (41.2%) | 100.0 |
| Graduate Degree | 17 (33.3%) | 116.0 |
| Total | 51 (100.0%) | 97.0 |
Fertility by Education by Marriage Status in Genesee
25.5% of women with births in Genesee are unmarried. Women with the educational attainment of bachelor's degree are most likely to be married with 100.0% of them married at childbirth, while women with the educational attainment of college or associate's degree are least likely to be married with 100.0% of them unmarried at childbirth.
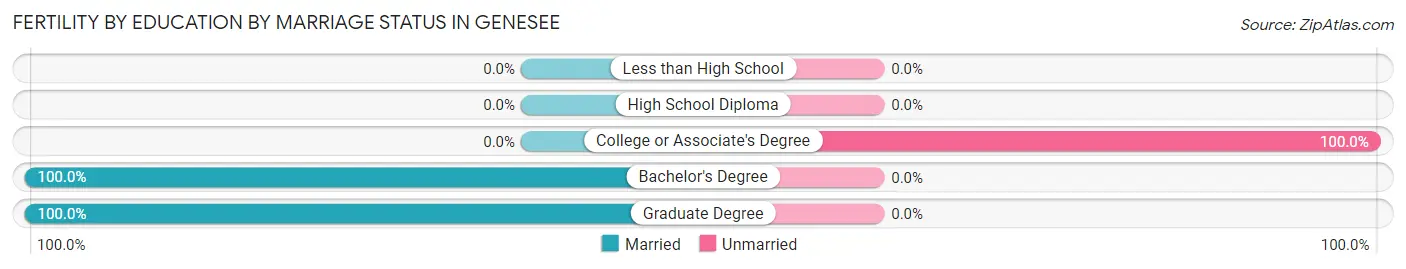
| Educational Attainment | Married | Unmarried |
| Less than High School | 0 (0.0%) | 0 (0.0%) |
| High School Diploma | 0 (0.0%) | 0 (0.0%) |
| College or Associate's Degree | 0 (0.0%) | 13 (100.0%) |
| Bachelor's Degree | 21 (100.0%) | 0 (0.0%) |
| Graduate Degree | 17 (100.0%) | 0 (0.0%) |
| Total | 38 (74.5%) | 13 (25.5%) |
Employment Characteristics in Genesee
Employment by Class of Employer in Genesee
Among the 1,819 employed individuals in Genesee, private company employees (1,049 | 57.7%), self-employed (incorporated) (247 | 13.6%), and not-for-profit organizations (240 | 13.2%) make up the most common classes of employment.
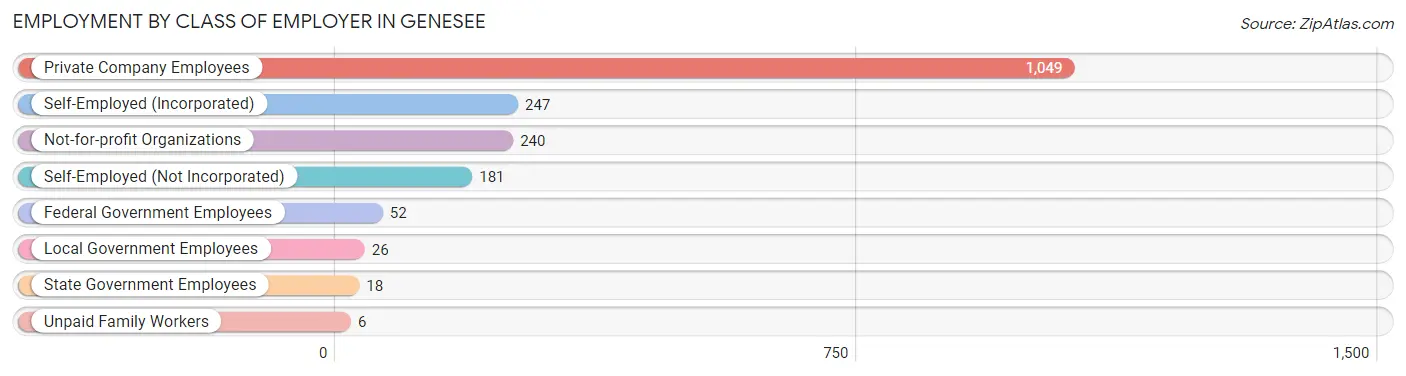
| Employer Class | # Employees | % Employees |
| Private Company Employees | 1,049 | 57.7% |
| Self-Employed (Incorporated) | 247 | 13.6% |
| Self-Employed (Not Incorporated) | 181 | 10.0% |
| Not-for-profit Organizations | 240 | 13.2% |
| Local Government Employees | 26 | 1.4% |
| State Government Employees | 18 | 1.0% |
| Federal Government Employees | 52 | 2.9% |
| Unpaid Family Workers | 6 | 0.3% |
| Total | 1,819 | 100.0% |
Employment Status by Age in Genesee
According to the labor force statistics for Genesee, out of the total population over 16 years of age (3,276), 58.7% or 1,923 individuals are in the labor force, with 2.3% or 44 of them unemployed. The age group with the highest labor force participation rate is 20 to 24 years, with 100.0% or 85 individuals in the labor force. Within the labor force, the 30 to 34 years age range has the highest percentage of unemployed individuals, with 12.5% or 6 of them being unemployed.
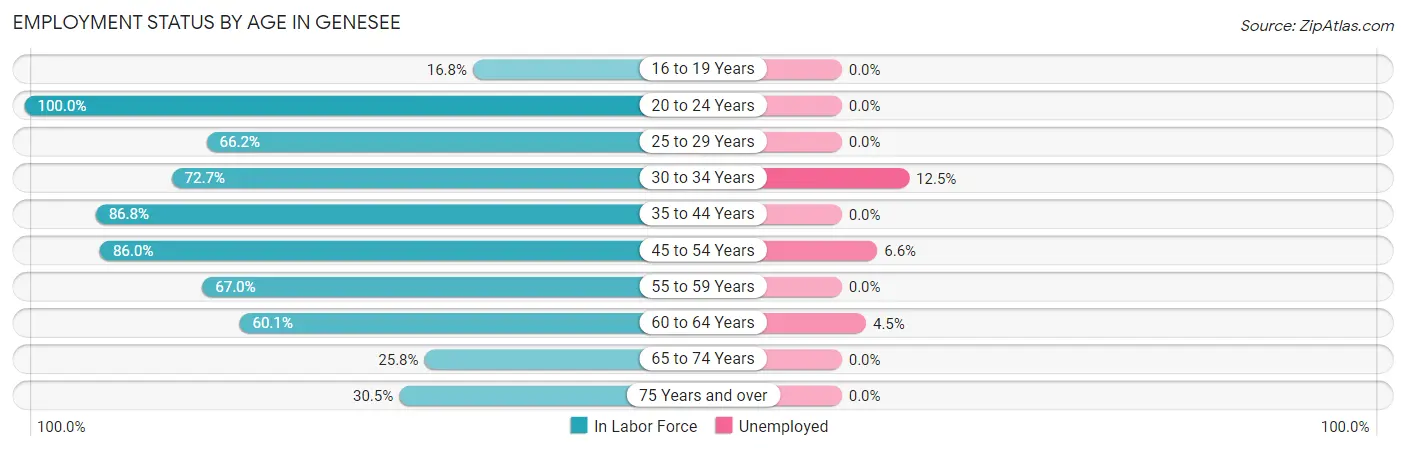
| Age Bracket | In Labor Force | Unemployed |
| 16 to 19 Years | 18 (16.8%) | 0 (0.0%) |
| 20 to 24 Years | 85 (100.0%) | 0 (0.0%) |
| 25 to 29 Years | 51 (66.2%) | 0 (0.0%) |
| 30 to 34 Years | 48 (72.7%) | 6 (12.5%) |
| 35 to 44 Years | 514 (86.8%) | 0 (0.0%) |
| 45 to 54 Years | 456 (86.0%) | 30 (6.6%) |
| 55 to 59 Years | 246 (67.0%) | 0 (0.0%) |
| 60 to 64 Years | 199 (60.1%) | 9 (4.5%) |
| 65 to 74 Years | 196 (25.8%) | 0 (0.0%) |
| 75 Years and over | 110 (30.5%) | 0 (0.0%) |
| Total | 1,923 (58.7%) | 44 (2.3%) |
Employment Status by Educational Attainment in Genesee
According to labor force statistics for Genesee, 77.1% of individuals (1,513) out of the total population between 25 and 64 years of age (1,963) are in the labor force, with 3.0% or 45 of them being unemployed. The group with the highest labor force participation rate are those with the educational attainment of bachelor's degree or higher, with 78.6% or 1,079 individuals in the labor force. Within the labor force, individuals with bachelor's degree or higher education have the highest percentage of unemployment, with 3.3% or 36 of them being unemployed.
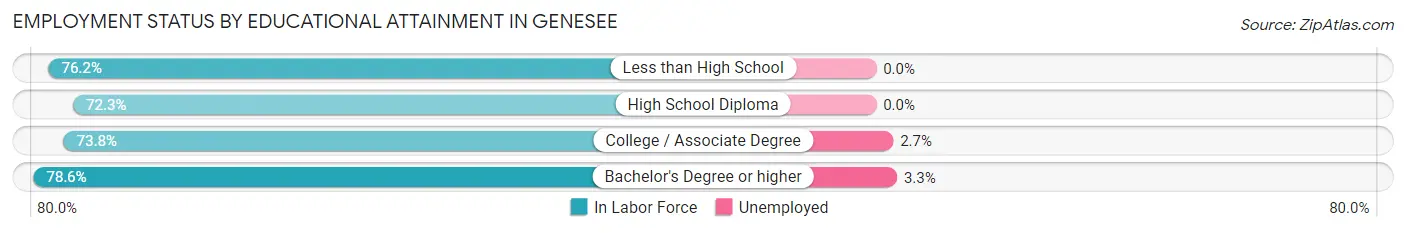
| Educational Attainment | In Labor Force | Unemployed |
| Less than High School | 32 (76.2%) | 0 (0.0%) |
| High School Diploma | 73 (72.3%) | 0 (0.0%) |
| College / Associate Degree | 330 (73.8%) | 12 (2.7%) |
| Bachelor's Degree or higher | 1,079 (78.6%) | 45 (3.3%) |
| Total | 1,513 (77.1%) | 59 (3.0%) |
Employment Occupations by Sex in Genesee
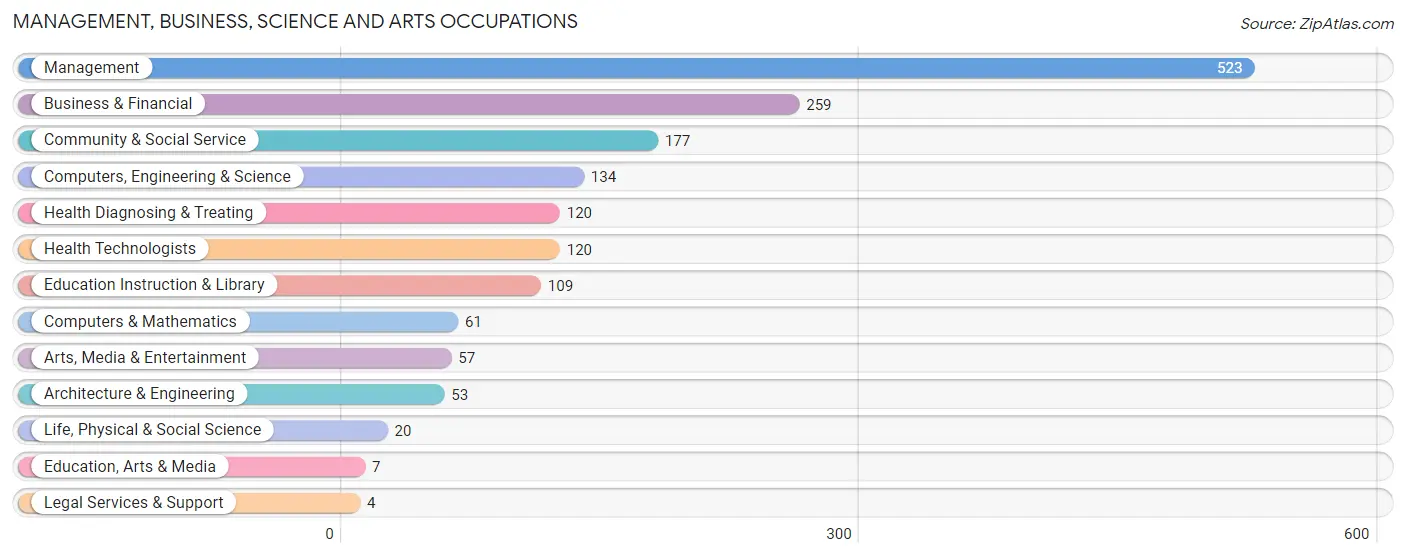
Management, Business, Science and Arts Occupations
The most common Management, Business, Science and Arts occupations in Genesee are Management (523 | 27.9%), Business & Financial (259 | 13.8%), Community & Social Service (177 | 9.4%), Computers, Engineering & Science (134 | 7.1%), and Health Diagnosing & Treating (120 | 6.4%).
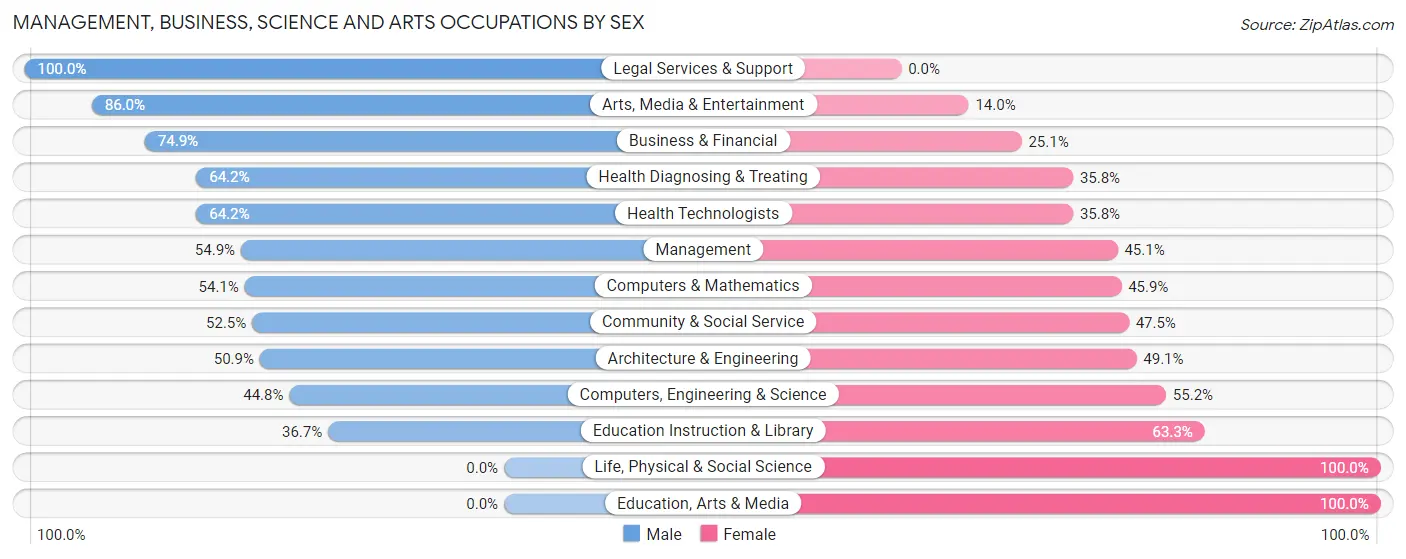
Management, Business, Science and Arts Occupations by Sex
Within the Management, Business, Science and Arts occupations in Genesee, the most male-oriented occupations are Legal Services & Support (100.0%), Arts, Media & Entertainment (86.0%), and Business & Financial (74.9%), while the most female-oriented occupations are Life, Physical & Social Science (100.0%), Education, Arts & Media (100.0%), and Education Instruction & Library (63.3%).
| Occupation | Male | Female |
| Management | 287 (54.9%) | 236 (45.1%) |
| Business & Financial | 194 (74.9%) | 65 (25.1%) |
| Computers, Engineering & Science | 60 (44.8%) | 74 (55.2%) |
| Computers & Mathematics | 33 (54.1%) | 28 (45.9%) |
| Architecture & Engineering | 27 (50.9%) | 26 (49.1%) |
| Life, Physical & Social Science | 0 (0.0%) | 20 (100.0%) |
| Community & Social Service | 93 (52.5%) | 84 (47.5%) |
| Education, Arts & Media | 0 (0.0%) | 7 (100.0%) |
| Legal Services & Support | 4 (100.0%) | 0 (0.0%) |
| Education Instruction & Library | 40 (36.7%) | 69 (63.3%) |
| Arts, Media & Entertainment | 49 (86.0%) | 8 (14.0%) |
| Health Diagnosing & Treating | 77 (64.2%) | 43 (35.8%) |
| Health Technologists | 77 (64.2%) | 43 (35.8%) |
| Total (Category) | 711 (58.6%) | 502 (41.4%) |
| Total (Overall) | 1,132 (60.3%) | 746 (39.7%) |
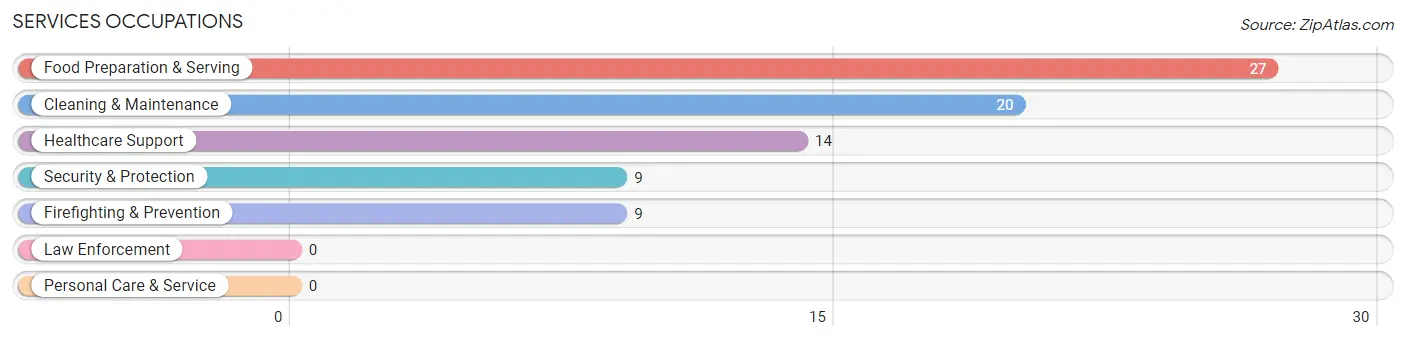
Services Occupations
The most common Services occupations in Genesee are Food Preparation & Serving (27 | 1.4%), Cleaning & Maintenance (20 | 1.1%), Healthcare Support (14 | 0.7%), Security & Protection (9 | 0.5%), and Firefighting & Prevention (9 | 0.5%).
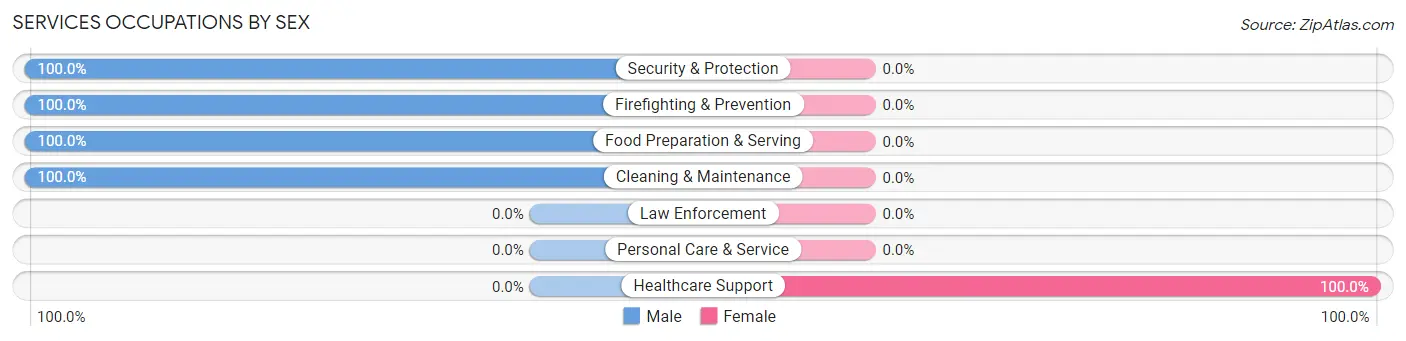
Services Occupations by Sex
| Occupation | Male | Female |
| Healthcare Support | 0 (0.0%) | 14 (100.0%) |
| Security & Protection | 9 (100.0%) | 0 (0.0%) |
| Firefighting & Prevention | 9 (100.0%) | 0 (0.0%) |
| Law Enforcement | 0 (0.0%) | 0 (0.0%) |
| Food Preparation & Serving | 27 (100.0%) | 0 (0.0%) |
| Cleaning & Maintenance | 20 (100.0%) | 0 (0.0%) |
| Personal Care & Service | 0 (0.0%) | 0 (0.0%) |
| Total (Category) | 56 (80.0%) | 14 (20.0%) |
| Total (Overall) | 1,132 (60.3%) | 746 (39.7%) |
Sales and Office Occupations
The most common Sales and Office occupations in Genesee are Sales & Related (350 | 18.6%), and Office & Administration (108 | 5.8%).

Sales and Office Occupations by Sex

| Occupation | Male | Female |
| Sales & Related | 230 (65.7%) | 120 (34.3%) |
| Office & Administration | 21 (19.4%) | 87 (80.6%) |
| Total (Category) | 251 (54.8%) | 207 (45.2%) |
| Total (Overall) | 1,132 (60.3%) | 746 (39.7%) |
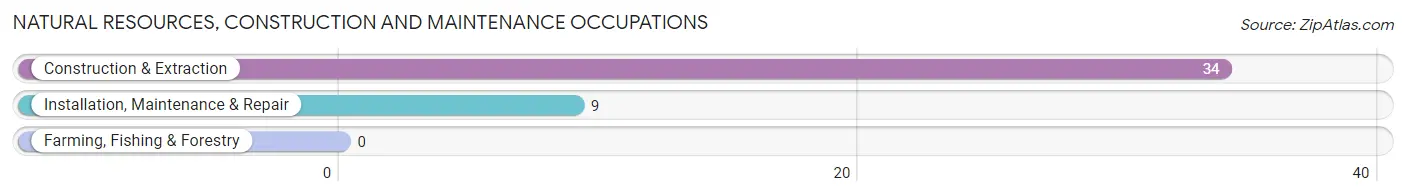
Natural Resources, Construction and Maintenance Occupations
The most common Natural Resources, Construction and Maintenance occupations in Genesee are Construction & Extraction (34 | 1.8%), and Installation, Maintenance & Repair (9 | 0.5%).
Natural Resources, Construction and Maintenance Occupations by Sex
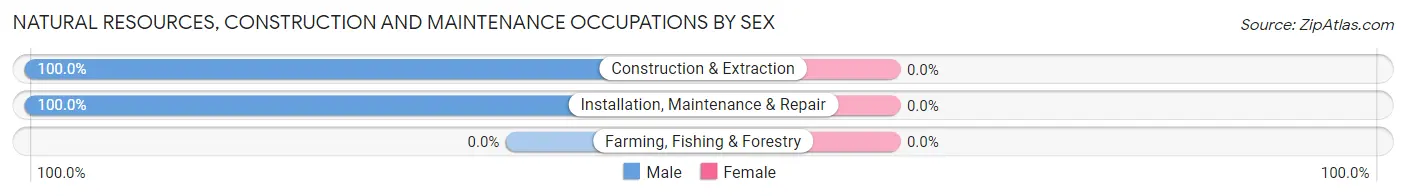
| Occupation | Male | Female |
| Farming, Fishing & Forestry | 0 (0.0%) | 0 (0.0%) |
| Construction & Extraction | 34 (100.0%) | 0 (0.0%) |
| Installation, Maintenance & Repair | 9 (100.0%) | 0 (0.0%) |
| Total (Category) | 43 (100.0%) | 0 (0.0%) |
| Total (Overall) | 1,132 (60.3%) | 746 (39.7%) |
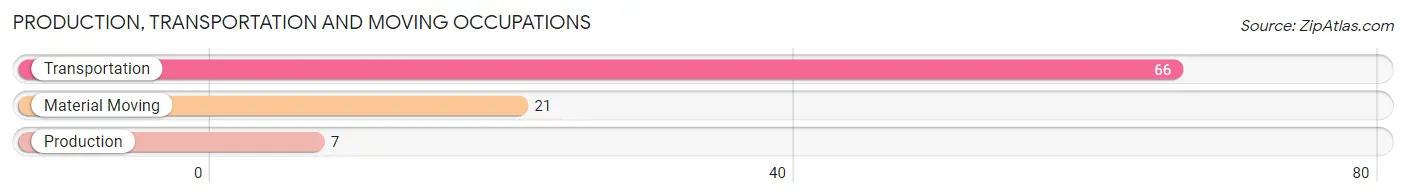
Production, Transportation and Moving Occupations
The most common Production, Transportation and Moving occupations in Genesee are Transportation (66 | 3.5%), Material Moving (21 | 1.1%), and Production (7 | 0.4%).
Production, Transportation and Moving Occupations by Sex
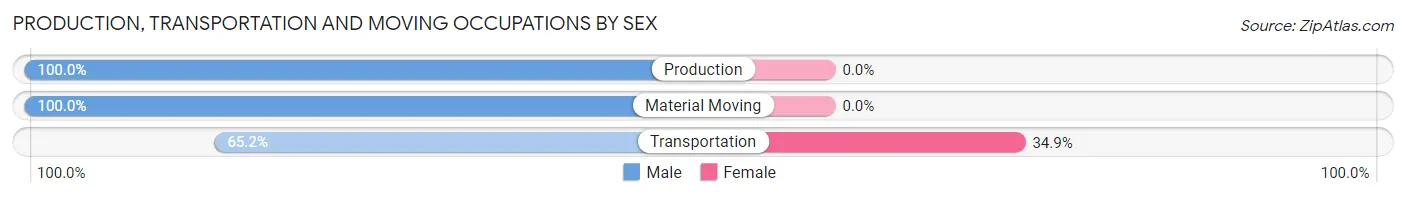
| Occupation | Male | Female |
| Production | 7 (100.0%) | 0 (0.0%) |
| Transportation | 43 (65.1%) | 23 (34.8%) |
| Material Moving | 21 (100.0%) | 0 (0.0%) |
| Total (Category) | 71 (75.5%) | 23 (24.5%) |
| Total (Overall) | 1,132 (60.3%) | 746 (39.7%) |
Employment Industries by Sex in Genesee
Employment Industries in Genesee
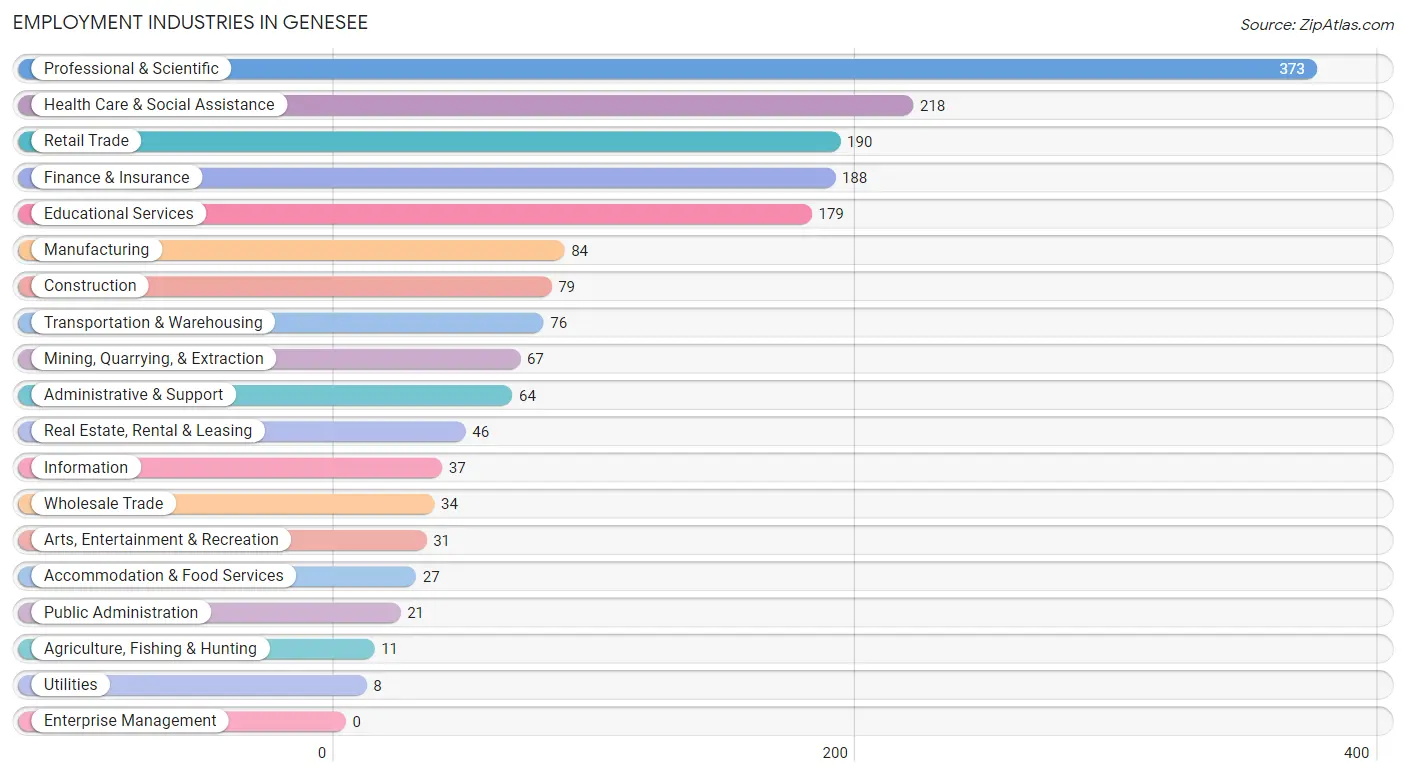
The major employment industries in Genesee include Professional & Scientific (373 | 19.9%), Health Care & Social Assistance (218 | 11.6%), Retail Trade (190 | 10.1%), Finance & Insurance (188 | 10.0%), and Educational Services (179 | 9.5%).
Employment Industries by Sex in Genesee
The Genesee industries that see more men than women are Agriculture, Fishing & Hunting (100.0%), Mining, Quarrying, & Extraction (100.0%), and Information (100.0%), whereas the industries that tend to have a higher number of women are Utilities (100.0%), Public Administration (100.0%), and Real Estate, Rental & Leasing (78.3%).
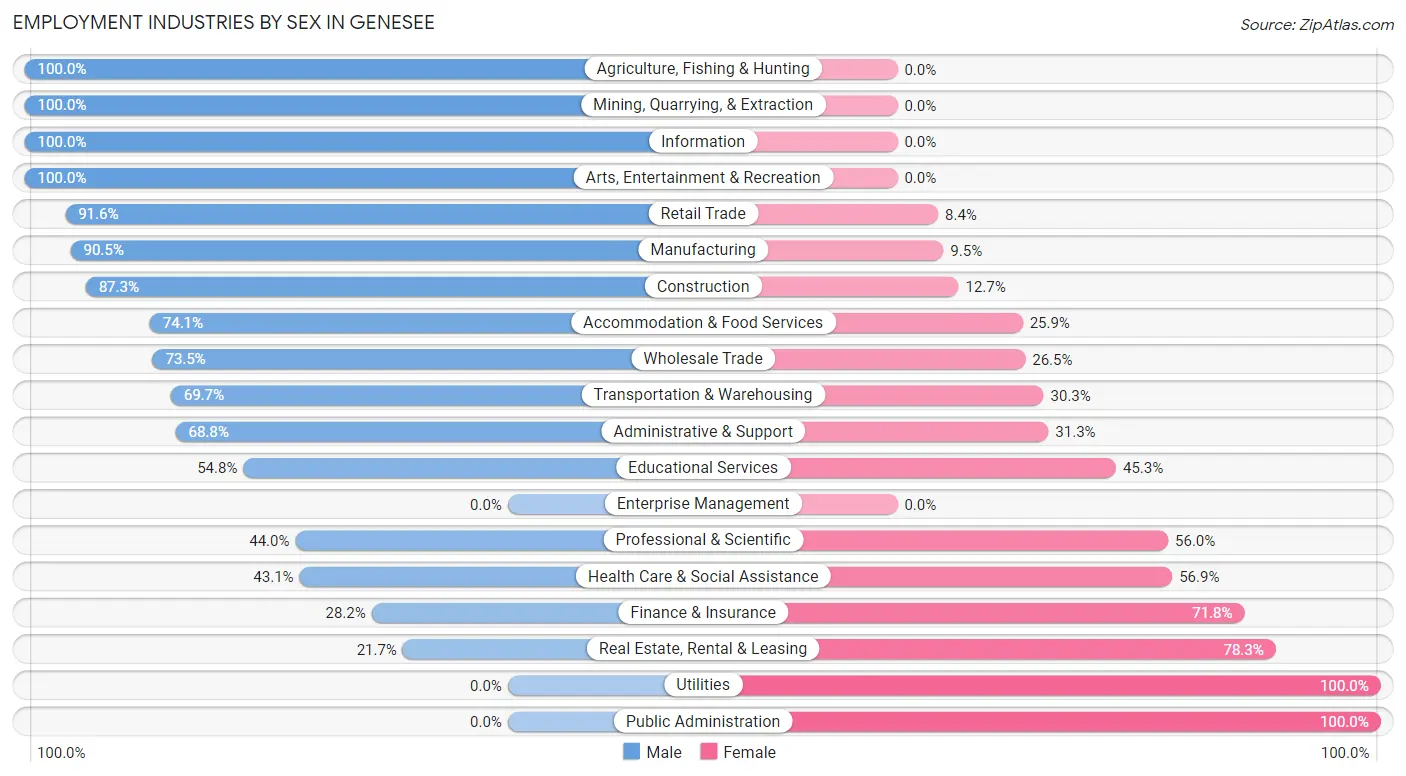
| Industry | Male | Female |
| Agriculture, Fishing & Hunting | 11 (100.0%) | 0 (0.0%) |
| Mining, Quarrying, & Extraction | 67 (100.0%) | 0 (0.0%) |
| Construction | 69 (87.3%) | 10 (12.7%) |
| Manufacturing | 76 (90.5%) | 8 (9.5%) |
| Wholesale Trade | 25 (73.5%) | 9 (26.5%) |
| Retail Trade | 174 (91.6%) | 16 (8.4%) |
| Transportation & Warehousing | 53 (69.7%) | 23 (30.3%) |
| Utilities | 0 (0.0%) | 8 (100.0%) |
| Information | 37 (100.0%) | 0 (0.0%) |
| Finance & Insurance | 53 (28.2%) | 135 (71.8%) |
| Real Estate, Rental & Leasing | 10 (21.7%) | 36 (78.3%) |
| Professional & Scientific | 164 (44.0%) | 209 (56.0%) |
| Enterprise Management | 0 (0.0%) | 0 (0.0%) |
| Administrative & Support | 44 (68.8%) | 20 (31.2%) |
| Educational Services | 98 (54.7%) | 81 (45.3%) |
| Health Care & Social Assistance | 94 (43.1%) | 124 (56.9%) |
| Arts, Entertainment & Recreation | 31 (100.0%) | 0 (0.0%) |
| Accommodation & Food Services | 20 (74.1%) | 7 (25.9%) |
| Public Administration | 0 (0.0%) | 21 (100.0%) |
| Total | 1,132 (60.3%) | 746 (39.7%) |
Education in Genesee
School Enrollment in Genesee
The most common levels of schooling among the 850 students in Genesee are middle school (304 | 35.8%), high school (187 | 22.0%), and elementary school (164 | 19.3%).
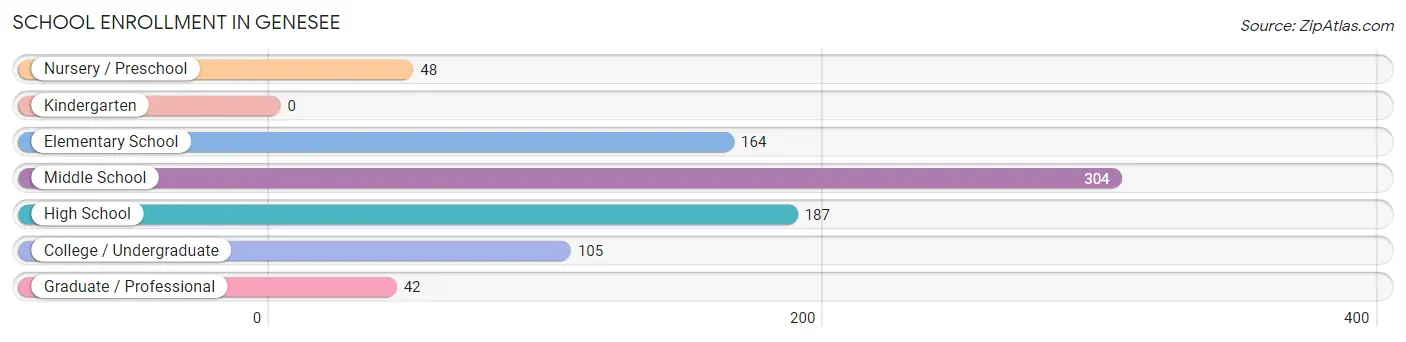
| School Level | # Students | % Students |
| Nursery / Preschool | 48 | 5.7% |
| Kindergarten | 0 | 0.0% |
| Elementary School | 164 | 19.3% |
| Middle School | 304 | 35.8% |
| High School | 187 | 22.0% |
| College / Undergraduate | 105 | 12.3% |
| Graduate / Professional | 42 | 4.9% |
| Total | 850 | 100.0% |
School Enrollment by Age by Funding Source in Genesee
Out of a total of 850 students who are enrolled in schools in Genesee, 169 (19.9%) attend a private institution, while the remaining 681 (80.1%) are enrolled in public schools. The age group of 35 years and over has the highest likelihood of being enrolled in private schools, with 44 (71.0% in the age bracket) enrolled. Conversely, the age group of 15 to 17 year olds has the lowest likelihood of being enrolled in a private school, with 177 (100.0% in the age bracket) attending a public institution.
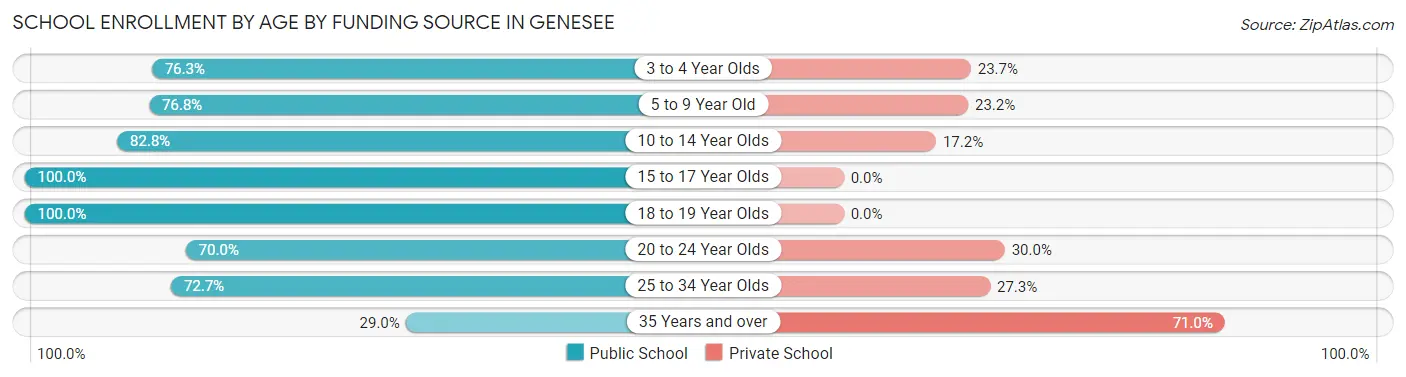
| Age Bracket | Public School | Private School |
| 3 to 4 Year Olds | 29 (76.3%) | 9 (23.7%) |
| 5 to 9 Year Old | 126 (76.8%) | 38 (23.2%) |
| 10 to 14 Year Olds | 260 (82.8%) | 54 (17.2%) |
| 15 to 17 Year Olds | 177 (100.0%) | 0 (0.0%) |
| 18 to 19 Year Olds | 10 (100.0%) | 0 (0.0%) |
| 20 to 24 Year Olds | 21 (70.0%) | 9 (30.0%) |
| 25 to 34 Year Olds | 40 (72.7%) | 15 (27.3%) |
| 35 Years and over | 18 (29.0%) | 44 (71.0%) |
| Total | 681 (80.1%) | 169 (19.9%) |
Educational Attainment by Field of Study in Genesee
Business (698 | 27.2%), science & technology (288 | 11.2%), education (238 | 9.3%), engineering (233 | 9.1%), and social sciences (219 | 8.5%) are the most common fields of study among 2,569 individuals in Genesee who have obtained a bachelor's degree or higher.
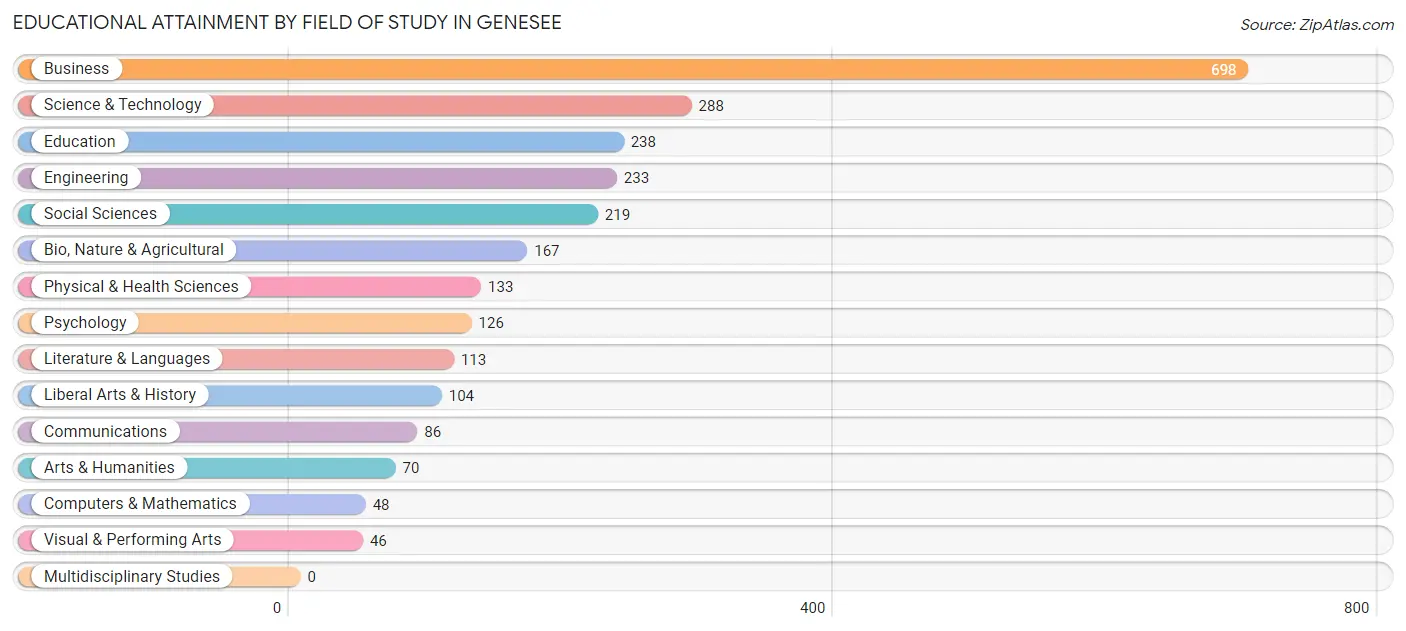
| Field of Study | # Graduates | % Graduates |
| Computers & Mathematics | 48 | 1.9% |
| Bio, Nature & Agricultural | 167 | 6.5% |
| Physical & Health Sciences | 133 | 5.2% |
| Psychology | 126 | 4.9% |
| Social Sciences | 219 | 8.5% |
| Engineering | 233 | 9.1% |
| Multidisciplinary Studies | 0 | 0.0% |
| Science & Technology | 288 | 11.2% |
| Business | 698 | 27.2% |
| Education | 238 | 9.3% |
| Literature & Languages | 113 | 4.4% |
| Liberal Arts & History | 104 | 4.1% |
| Visual & Performing Arts | 46 | 1.8% |
| Communications | 86 | 3.4% |
| Arts & Humanities | 70 | 2.7% |
| Total | 2,569 | 100.0% |
Transportation & Commute in Genesee
Vehicle Availability by Sex in Genesee
The most prevalent vehicle ownership categories in Genesee are males with 2 vehicles (609, accounting for 56.3%) and females with 2 vehicles (396, making up 82.5%).
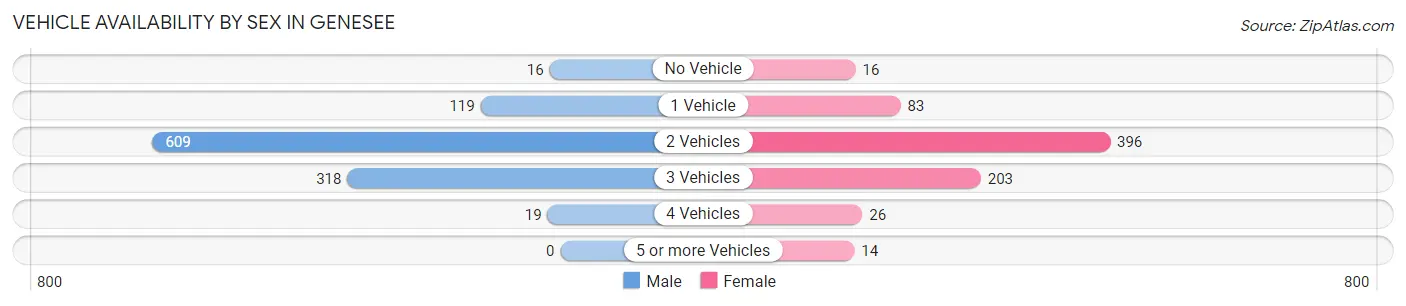
| Vehicles Available | Male | Female |
| No Vehicle | 16 (1.5%) | 16 (2.2%) |
| 1 Vehicle | 119 (11.0%) | 83 (11.3%) |
| 2 Vehicles | 609 (56.3%) | 396 (53.7%) |
| 3 Vehicles | 318 (29.4%) | 203 (27.5%) |
| 4 Vehicles | 19 (1.8%) | 26 (3.5%) |
| 5 or more Vehicles | 0 (0.0%) | 14 (1.9%) |
| Total | 1,081 (100.0%) | 738 (100.0%) |
Commute Time in Genesee
The most frequently occuring commute durations in Genesee are 15 to 19 minutes (216 commuters, 16.8%), 30 to 34 minutes (215 commuters, 16.7%), and 25 to 29 minutes (162 commuters, 12.6%).
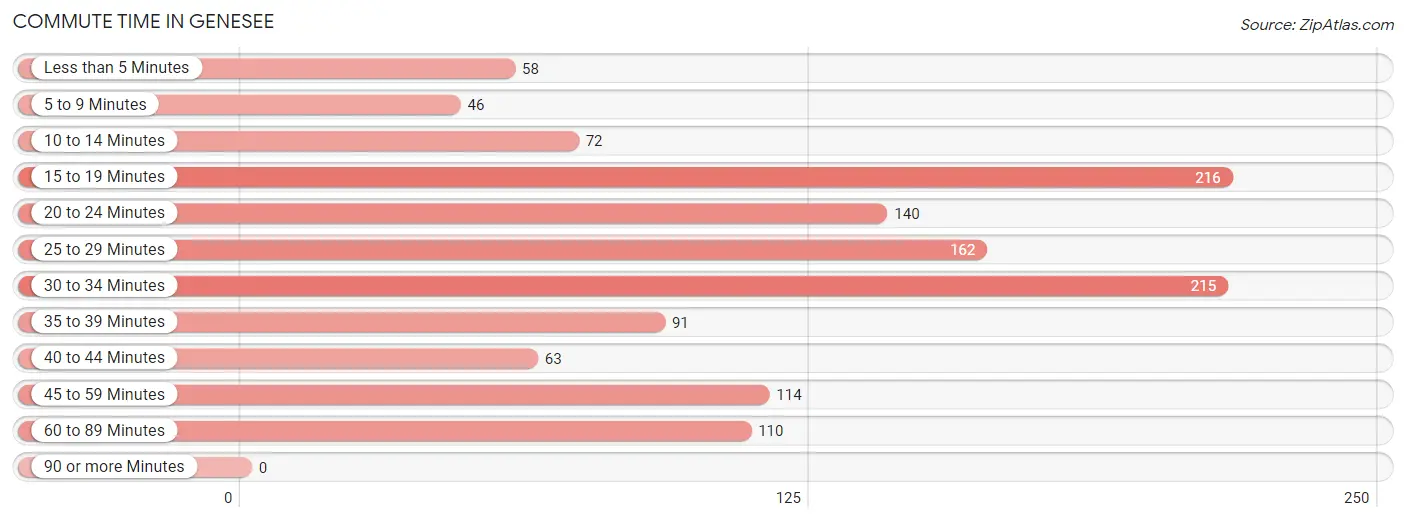
| Commute Time | # Commuters | % Commuters |
| Less than 5 Minutes | 58 | 4.5% |
| 5 to 9 Minutes | 46 | 3.6% |
| 10 to 14 Minutes | 72 | 5.6% |
| 15 to 19 Minutes | 216 | 16.8% |
| 20 to 24 Minutes | 140 | 10.9% |
| 25 to 29 Minutes | 162 | 12.6% |
| 30 to 34 Minutes | 215 | 16.7% |
| 35 to 39 Minutes | 91 | 7.1% |
| 40 to 44 Minutes | 63 | 4.9% |
| 45 to 59 Minutes | 114 | 8.9% |
| 60 to 89 Minutes | 110 | 8.6% |
| 90 or more Minutes | 0 | 0.0% |
Commute Time by Sex in Genesee
The most common commute times in Genesee are 15 to 19 minutes (139 commuters, 17.2%) for males and 30 to 34 minutes (86 commuters, 18.0%) for females.
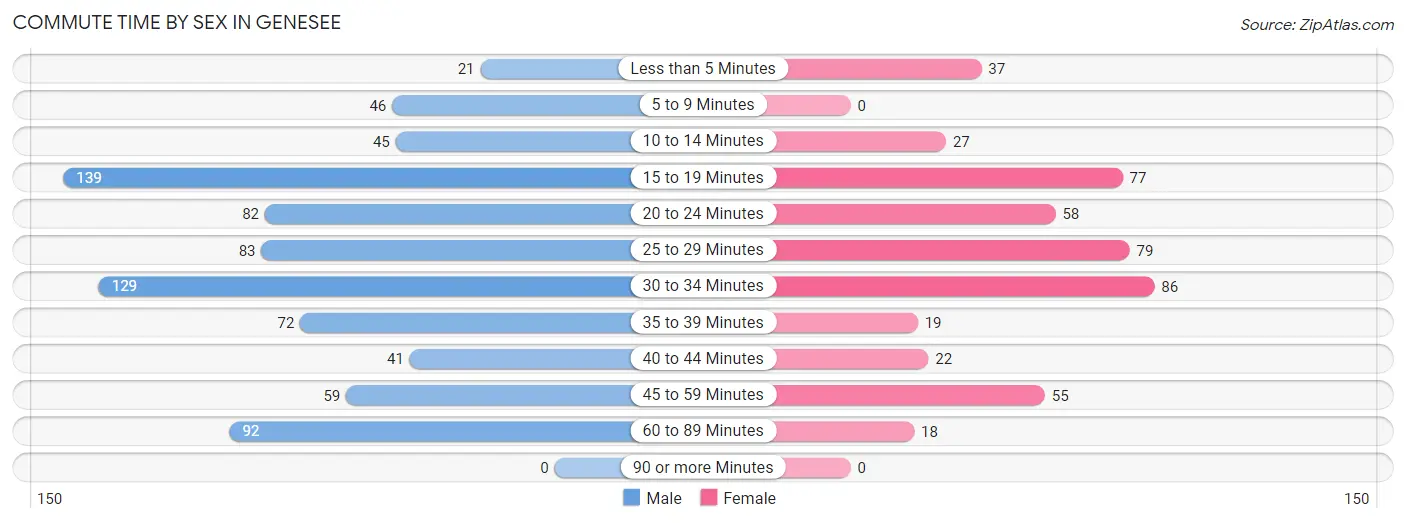
| Commute Time | Male | Female |
| Less than 5 Minutes | 21 (2.6%) | 37 (7.7%) |
| 5 to 9 Minutes | 46 (5.7%) | 0 (0.0%) |
| 10 to 14 Minutes | 45 (5.6%) | 27 (5.7%) |
| 15 to 19 Minutes | 139 (17.2%) | 77 (16.1%) |
| 20 to 24 Minutes | 82 (10.1%) | 58 (12.1%) |
| 25 to 29 Minutes | 83 (10.3%) | 79 (16.5%) |
| 30 to 34 Minutes | 129 (16.0%) | 86 (18.0%) |
| 35 to 39 Minutes | 72 (8.9%) | 19 (4.0%) |
| 40 to 44 Minutes | 41 (5.1%) | 22 (4.6%) |
| 45 to 59 Minutes | 59 (7.3%) | 55 (11.5%) |
| 60 to 89 Minutes | 92 (11.4%) | 18 (3.8%) |
| 90 or more Minutes | 0 (0.0%) | 0 (0.0%) |
Time of Departure to Work by Sex in Genesee
The most frequent times of departure to work in Genesee are 7:00 AM to 7:29 AM (222, 27.4%) for males and 7:30 AM to 7:59 AM (109, 22.8%) for females.
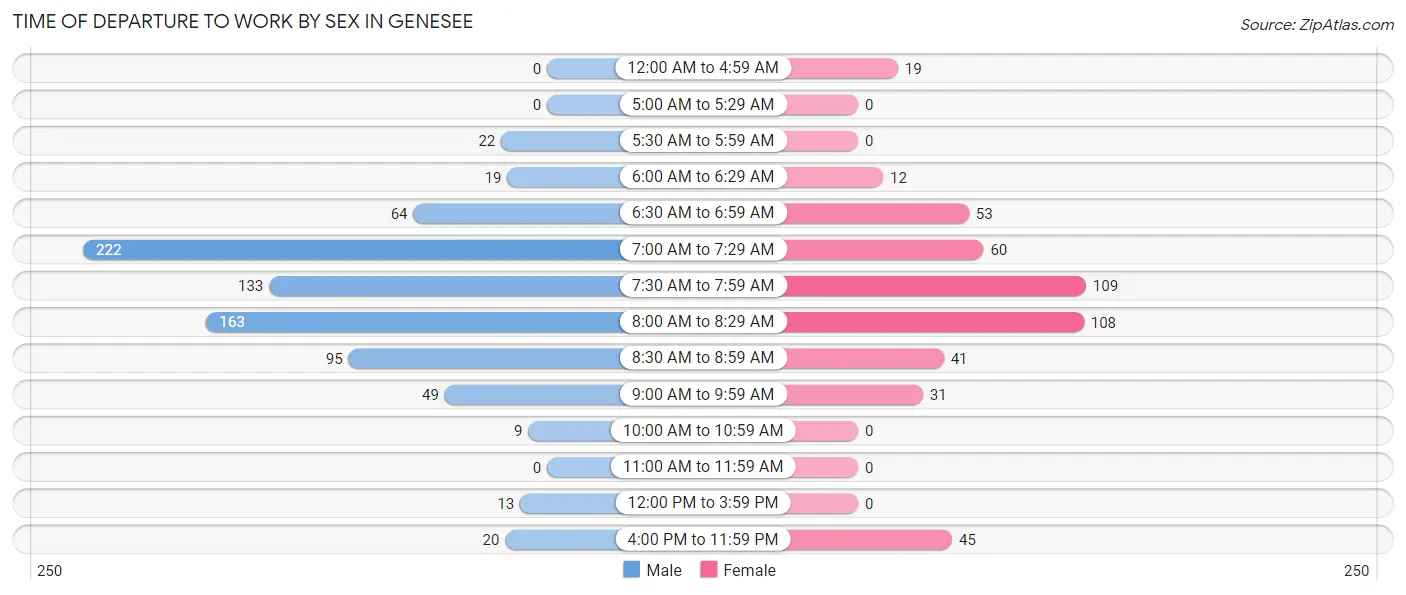
| Time of Departure | Male | Female |
| 12:00 AM to 4:59 AM | 0 (0.0%) | 19 (4.0%) |
| 5:00 AM to 5:29 AM | 0 (0.0%) | 0 (0.0%) |
| 5:30 AM to 5:59 AM | 22 (2.7%) | 0 (0.0%) |
| 6:00 AM to 6:29 AM | 19 (2.4%) | 12 (2.5%) |
| 6:30 AM to 6:59 AM | 64 (7.9%) | 53 (11.1%) |
| 7:00 AM to 7:29 AM | 222 (27.4%) | 60 (12.6%) |
| 7:30 AM to 7:59 AM | 133 (16.4%) | 109 (22.8%) |
| 8:00 AM to 8:29 AM | 163 (20.2%) | 108 (22.6%) |
| 8:30 AM to 8:59 AM | 95 (11.7%) | 41 (8.6%) |
| 9:00 AM to 9:59 AM | 49 (6.1%) | 31 (6.5%) |
| 10:00 AM to 10:59 AM | 9 (1.1%) | 0 (0.0%) |
| 11:00 AM to 11:59 AM | 0 (0.0%) | 0 (0.0%) |
| 12:00 PM to 3:59 PM | 13 (1.6%) | 0 (0.0%) |
| 4:00 PM to 11:59 PM | 20 (2.5%) | 45 (9.4%) |
| Total | 809 (100.0%) | 478 (100.0%) |
Housing Occupancy in Genesee
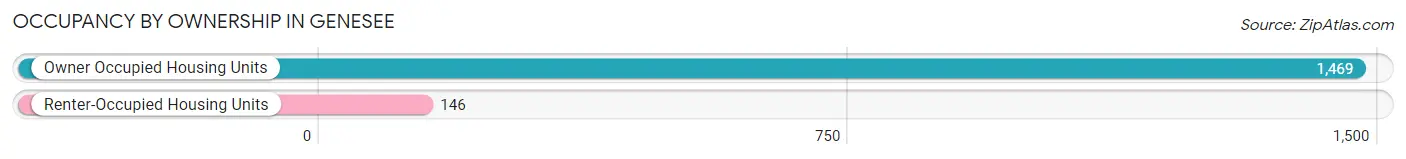
Occupancy by Ownership in Genesee
Of the total 1,615 dwellings in Genesee, owner-occupied units account for 1,469 (91.0%), while renter-occupied units make up 146 (9.0%).
| Occupancy | # Housing Units | % Housing Units |
| Owner Occupied Housing Units | 1,469 | 91.0% |
| Renter-Occupied Housing Units | 146 | 9.0% |
| Total Occupied Housing Units | 1,615 | 100.0% |
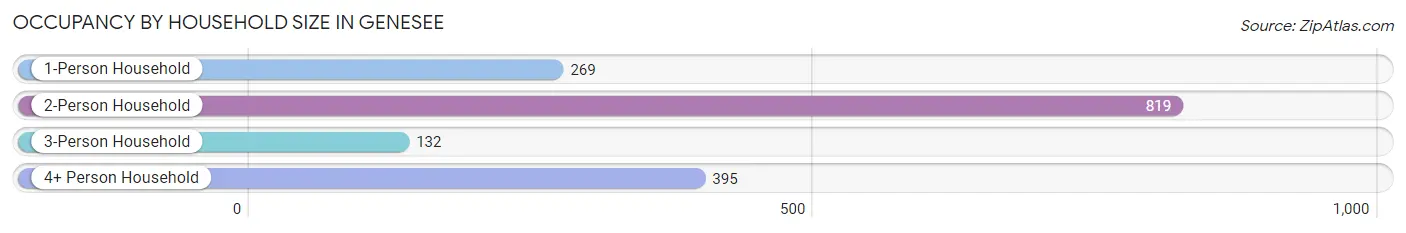
Occupancy by Household Size in Genesee
| Household Size | # Housing Units | % Housing Units |
| 1-Person Household | 269 | 16.7% |
| 2-Person Household | 819 | 50.7% |
| 3-Person Household | 132 | 8.2% |
| 4+ Person Household | 395 | 24.5% |
| Total Housing Units | 1,615 | 100.0% |
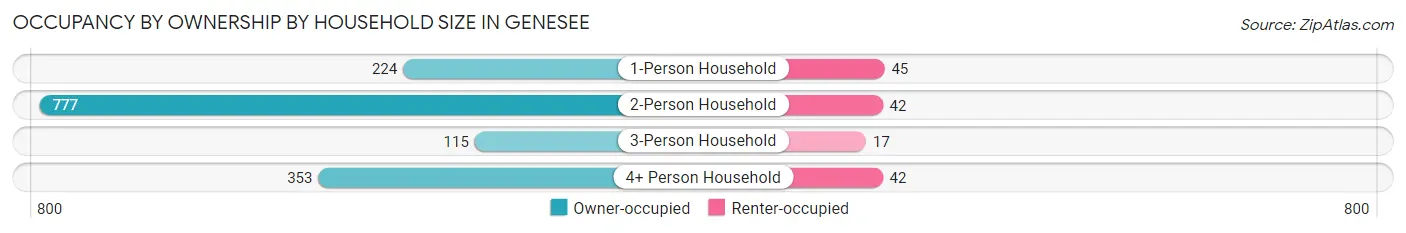
Occupancy by Ownership by Household Size in Genesee
| Household Size | Owner-occupied | Renter-occupied |
| 1-Person Household | 224 (83.3%) | 45 (16.7%) |
| 2-Person Household | 777 (94.9%) | 42 (5.1%) |
| 3-Person Household | 115 (87.1%) | 17 (12.9%) |
| 4+ Person Household | 353 (89.4%) | 42 (10.6%) |
| Total Housing Units | 1,469 (91.0%) | 146 (9.0%) |
Occupancy by Educational Attainment in Genesee
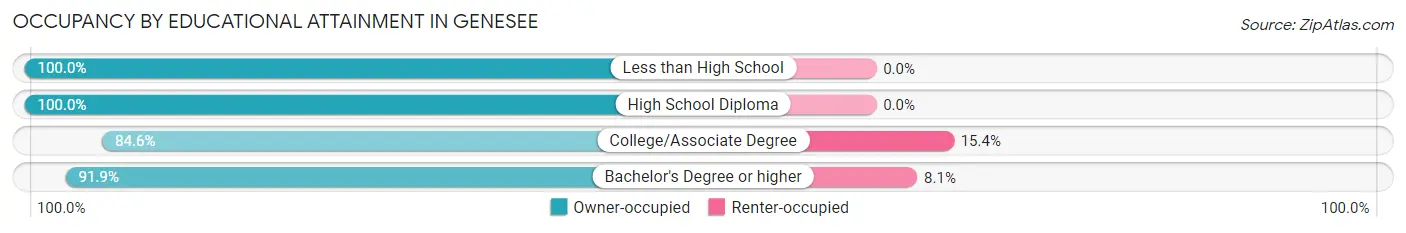
| Household Size | Owner-occupied | Renter-occupied |
| Less than High School | 22 (100.0%) | 0 (0.0%) |
| High School Diploma | 18 (100.0%) | 0 (0.0%) |
| College/Associate Degree | 209 (84.6%) | 38 (15.4%) |
| Bachelor's Degree or higher | 1,220 (91.9%) | 108 (8.1%) |
Occupancy by Age of Householder in Genesee
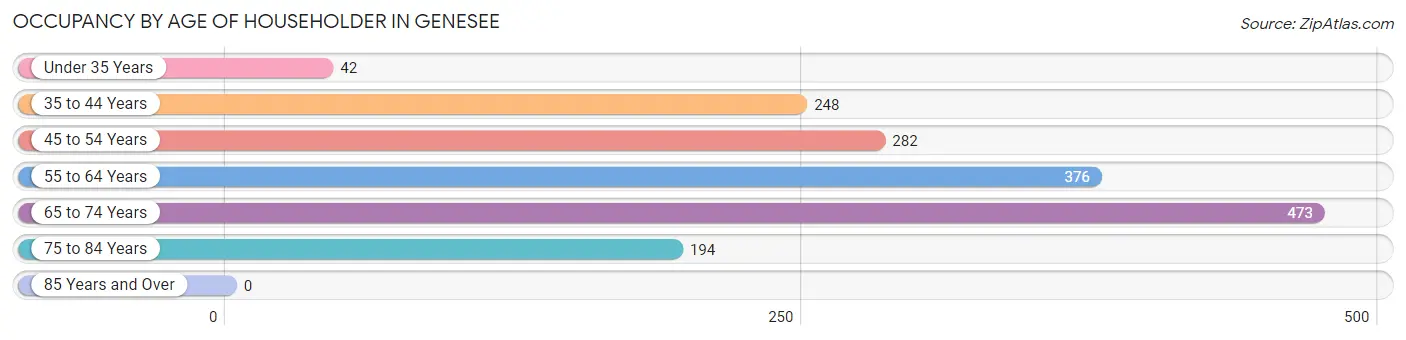
| Age Bracket | # Households | % Households |
| Under 35 Years | 42 | 2.6% |
| 35 to 44 Years | 248 | 15.4% |
| 45 to 54 Years | 282 | 17.5% |
| 55 to 64 Years | 376 | 23.3% |
| 65 to 74 Years | 473 | 29.3% |
| 75 to 84 Years | 194 | 12.0% |
| 85 Years and Over | 0 | 0.0% |
| Total | 1,615 | 100.0% |
Housing Finances in Genesee
Median Income by Occupancy in Genesee
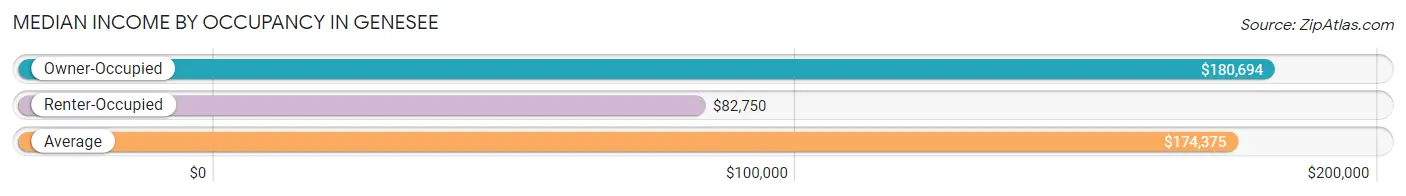
| Occupancy Type | # Households | Median Income |
| Owner-Occupied | 1,469 (91.0%) | $180,694 |
| Renter-Occupied | 146 (9.0%) | $82,750 |
| Average | 1,615 (100.0%) | $174,375 |
Occupancy by Householder Income Bracket in Genesee
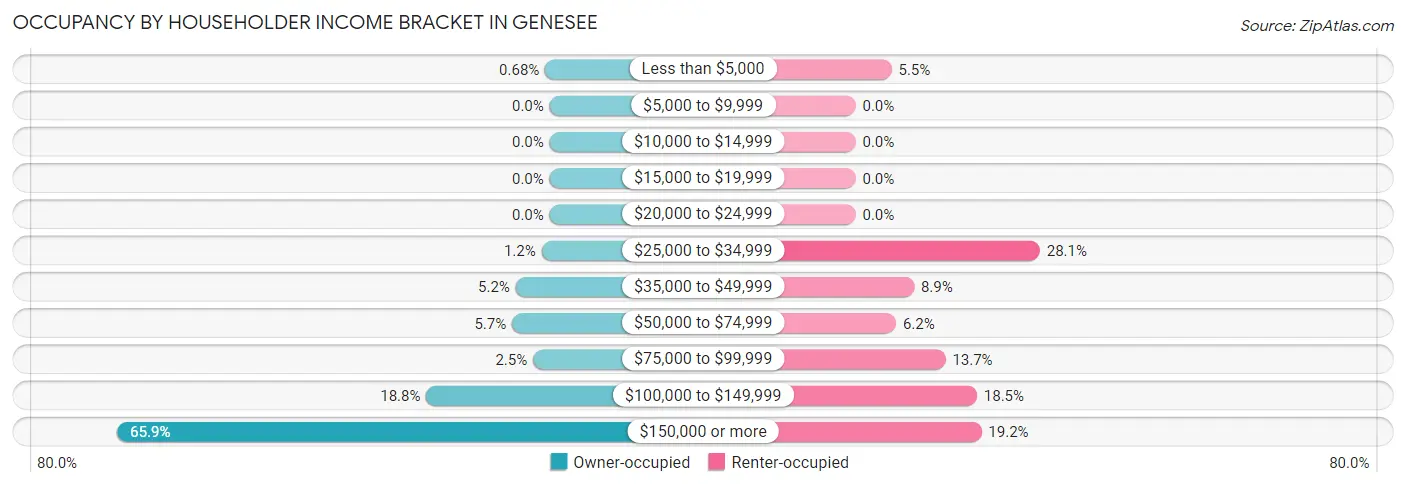
| Income Bracket | Owner-occupied | Renter-occupied |
| Less than $5,000 | 10 (0.7%) | 8 (5.5%) |
| $5,000 to $9,999 | 0 (0.0%) | 0 (0.0%) |
| $10,000 to $14,999 | 0 (0.0%) | 0 (0.0%) |
| $15,000 to $19,999 | 0 (0.0%) | 0 (0.0%) |
| $20,000 to $24,999 | 0 (0.0%) | 0 (0.0%) |
| $25,000 to $34,999 | 18 (1.2%) | 41 (28.1%) |
| $35,000 to $49,999 | 76 (5.2%) | 13 (8.9%) |
| $50,000 to $74,999 | 84 (5.7%) | 9 (6.2%) |
| $75,000 to $99,999 | 37 (2.5%) | 20 (13.7%) |
| $100,000 to $149,999 | 276 (18.8%) | 27 (18.5%) |
| $150,000 or more | 968 (65.9%) | 28 (19.2%) |
| Total | 1,469 (100.0%) | 146 (100.0%) |
Monthly Housing Cost Tiers in Genesee
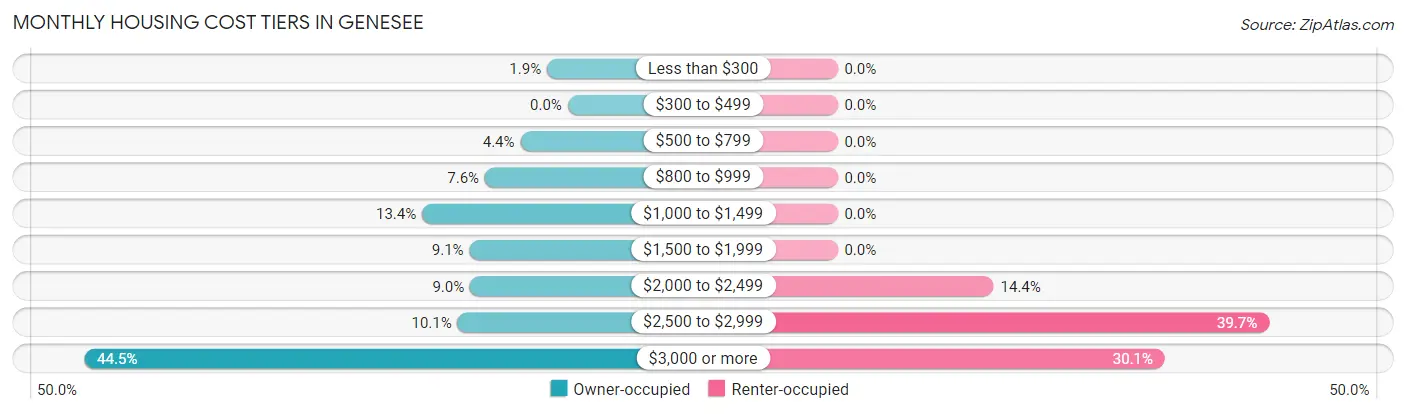
| Monthly Cost | Owner-occupied | Renter-occupied |
| Less than $300 | 28 (1.9%) | 0 (0.0%) |
| $300 to $499 | 0 (0.0%) | 0 (0.0%) |
| $500 to $799 | 64 (4.4%) | 0 (0.0%) |
| $800 to $999 | 112 (7.6%) | 0 (0.0%) |
| $1,000 to $1,499 | 197 (13.4%) | 0 (0.0%) |
| $1,500 to $1,999 | 133 (9.0%) | 0 (0.0%) |
| $2,000 to $2,499 | 132 (9.0%) | 21 (14.4%) |
| $2,500 to $2,999 | 149 (10.1%) | 58 (39.7%) |
| $3,000 or more | 654 (44.5%) | 44 (30.1%) |
| Total | 1,469 (100.0%) | 146 (100.0%) |
Physical Housing Characteristics in Genesee
Housing Structures in Genesee
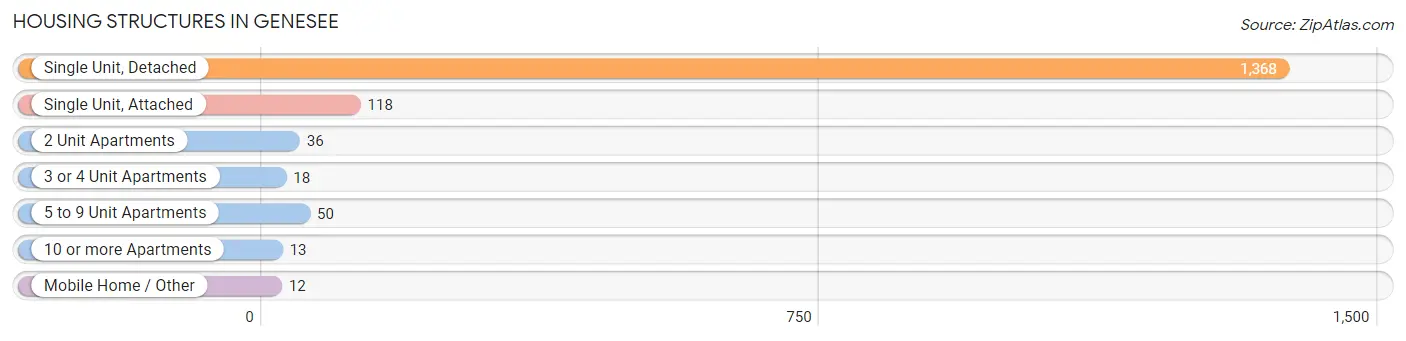
| Structure Type | # Housing Units | % Housing Units |
| Single Unit, Detached | 1,368 | 84.7% |
| Single Unit, Attached | 118 | 7.3% |
| 2 Unit Apartments | 36 | 2.2% |
| 3 or 4 Unit Apartments | 18 | 1.1% |
| 5 to 9 Unit Apartments | 50 | 3.1% |
| 10 or more Apartments | 13 | 0.8% |
| Mobile Home / Other | 12 | 0.7% |
| Total | 1,615 | 100.0% |
Housing Structures by Occupancy in Genesee
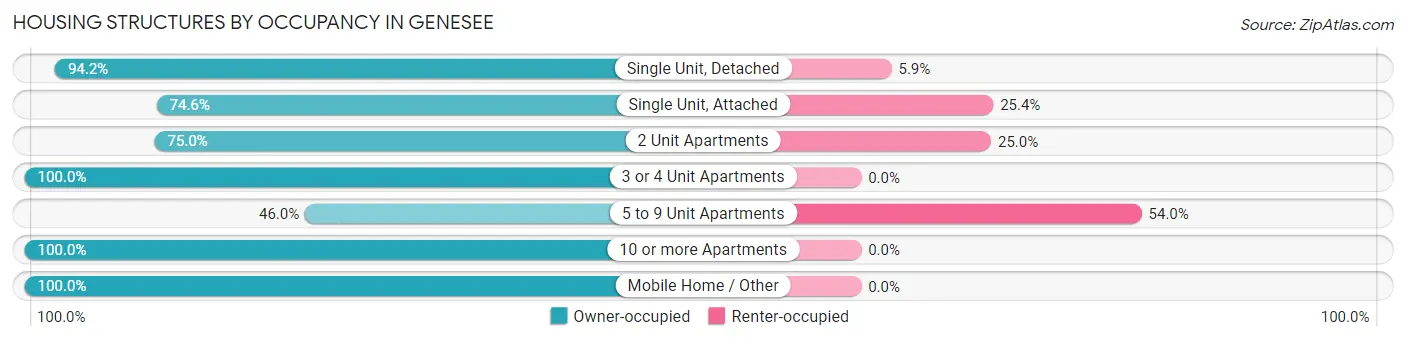
| Structure Type | Owner-occupied | Renter-occupied |
| Single Unit, Detached | 1,288 (94.2%) | 80 (5.9%) |
| Single Unit, Attached | 88 (74.6%) | 30 (25.4%) |
| 2 Unit Apartments | 27 (75.0%) | 9 (25.0%) |
| 3 or 4 Unit Apartments | 18 (100.0%) | 0 (0.0%) |
| 5 to 9 Unit Apartments | 23 (46.0%) | 27 (54.0%) |
| 10 or more Apartments | 13 (100.0%) | 0 (0.0%) |
| Mobile Home / Other | 12 (100.0%) | 0 (0.0%) |
| Total | 1,469 (91.0%) | 146 (9.0%) |
Housing Structures by Number of Rooms in Genesee
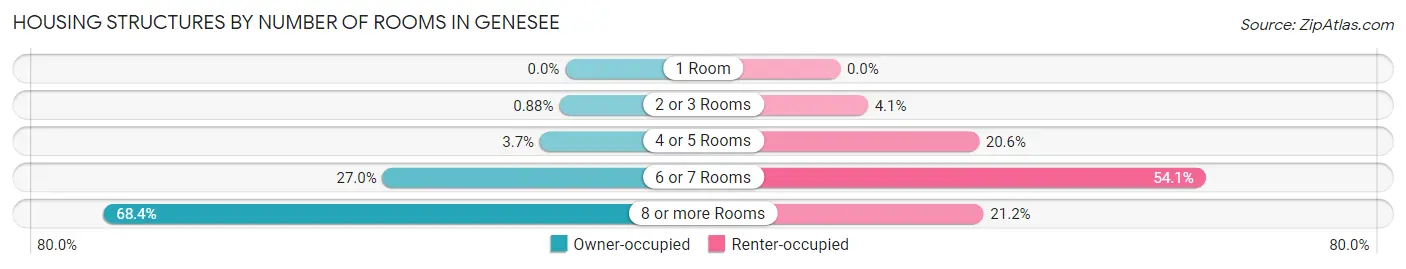
| Number of Rooms | Owner-occupied | Renter-occupied |
| 1 Room | 0 (0.0%) | 0 (0.0%) |
| 2 or 3 Rooms | 13 (0.9%) | 6 (4.1%) |
| 4 or 5 Rooms | 55 (3.7%) | 30 (20.5%) |
| 6 or 7 Rooms | 397 (27.0%) | 79 (54.1%) |
| 8 or more Rooms | 1,004 (68.3%) | 31 (21.2%) |
| Total | 1,469 (100.0%) | 146 (100.0%) |
Housing Structure by Heating Type in Genesee
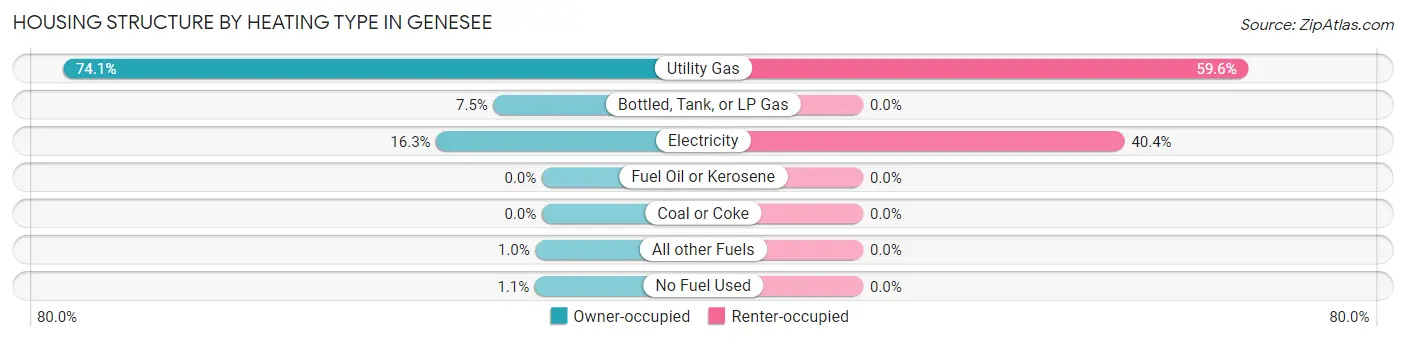
| Heating Type | Owner-occupied | Renter-occupied |
| Utility Gas | 1,088 (74.1%) | 87 (59.6%) |
| Bottled, Tank, or LP Gas | 110 (7.5%) | 0 (0.0%) |
| Electricity | 240 (16.3%) | 59 (40.4%) |
| Fuel Oil or Kerosene | 0 (0.0%) | 0 (0.0%) |
| Coal or Coke | 0 (0.0%) | 0 (0.0%) |
| All other Fuels | 15 (1.0%) | 0 (0.0%) |
| No Fuel Used | 16 (1.1%) | 0 (0.0%) |
| Total | 1,469 (100.0%) | 146 (100.0%) |
Household Vehicle Usage in Genesee
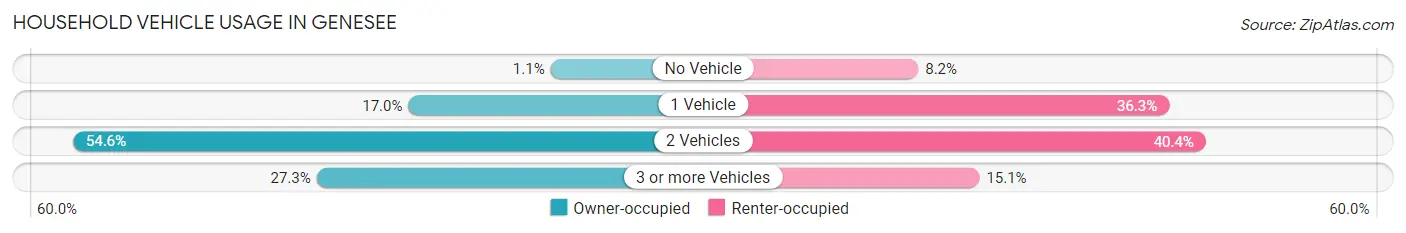
| Vehicles per Household | Owner-occupied | Renter-occupied |
| No Vehicle | 16 (1.1%) | 12 (8.2%) |
| 1 Vehicle | 250 (17.0%) | 53 (36.3%) |
| 2 Vehicles | 802 (54.6%) | 59 (40.4%) |
| 3 or more Vehicles | 401 (27.3%) | 22 (15.1%) |
| Total | 1,469 (100.0%) | 146 (100.0%) |
Real Estate & Mortgages in Genesee
Real Estate and Mortgage Overview in Genesee
| Characteristic | Without Mortgage | With Mortgage |
| Housing Units | 461 | 1,008 |
| Median Property Value | $1,043,100 | $944,900 |
| Median Household Income | $190,078 | $668 |
| Monthly Housing Costs | $1,189 | $654 |
| Real Estate Taxes | $5,562 | $17 |
Property Value by Mortgage Status in Genesee
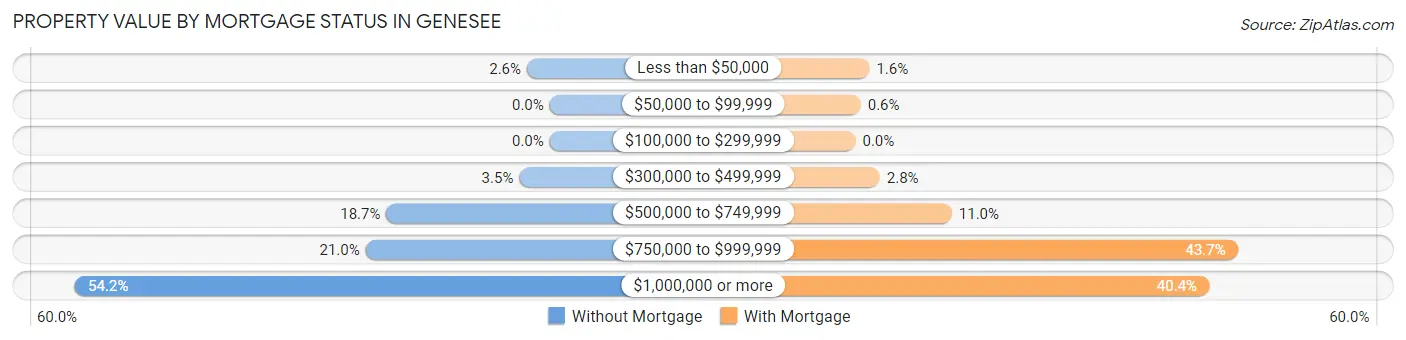
| Property Value | Without Mortgage | With Mortgage |
| Less than $50,000 | 12 (2.6%) | 16 (1.6%) |
| $50,000 to $99,999 | 0 (0.0%) | 6 (0.6%) |
| $100,000 to $299,999 | 0 (0.0%) | 0 (0.0%) |
| $300,000 to $499,999 | 16 (3.5%) | 28 (2.8%) |
| $500,000 to $749,999 | 86 (18.7%) | 111 (11.0%) |
| $750,000 to $999,999 | 97 (21.0%) | 440 (43.6%) |
| $1,000,000 or more | 250 (54.2%) | 407 (40.4%) |
| Total | 461 (100.0%) | 1,008 (100.0%) |
Household Income by Mortgage Status in Genesee
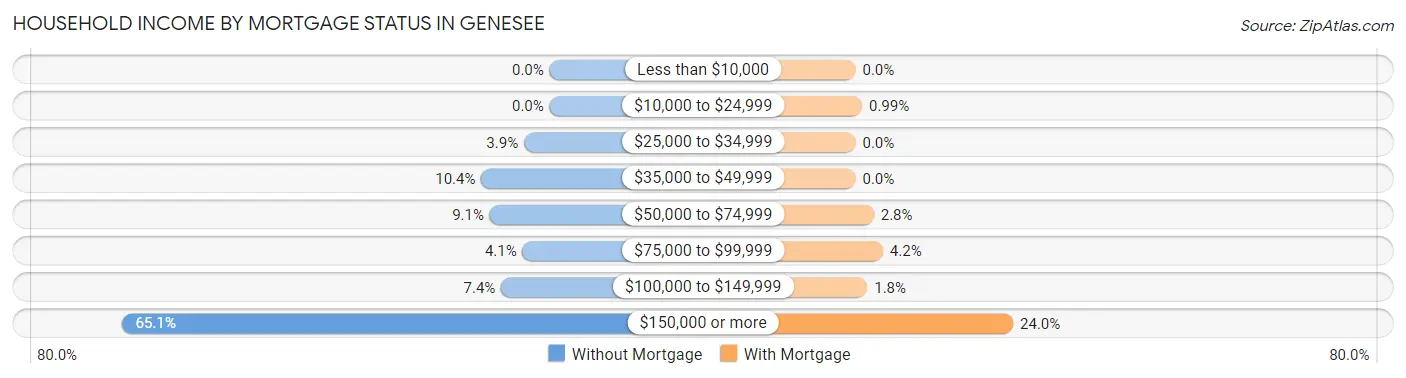
| Household Income | Without Mortgage | With Mortgage |
| Less than $10,000 | 0 (0.0%) | 0 (0.0%) |
| $10,000 to $24,999 | 0 (0.0%) | 10 (1.0%) |
| $25,000 to $34,999 | 18 (3.9%) | 0 (0.0%) |
| $35,000 to $49,999 | 48 (10.4%) | 0 (0.0%) |
| $50,000 to $74,999 | 42 (9.1%) | 28 (2.8%) |
| $75,000 to $99,999 | 19 (4.1%) | 42 (4.2%) |
| $100,000 to $149,999 | 34 (7.4%) | 18 (1.8%) |
| $150,000 or more | 300 (65.1%) | 242 (24.0%) |
| Total | 461 (100.0%) | 1,008 (100.0%) |
Property Value to Household Income Ratio in Genesee
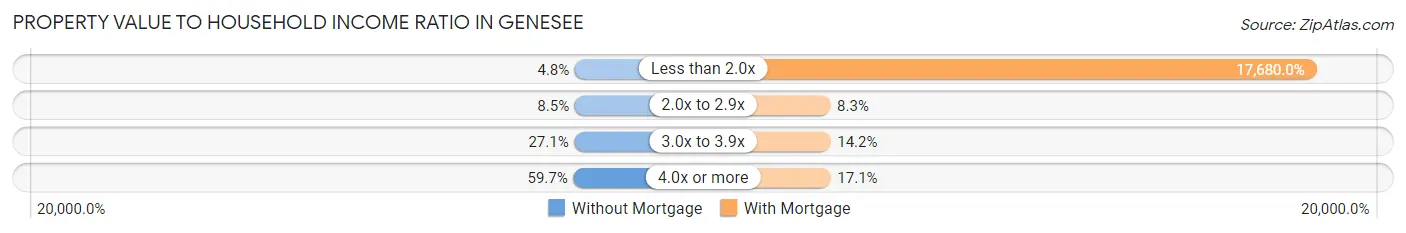
| Value-to-Income Ratio | Without Mortgage | With Mortgage |
| Less than 2.0x | 22 (4.8%) | 178,214 (17,680.0%) |
| 2.0x to 2.9x | 39 (8.5%) | 84 (8.3%) |
| 3.0x to 3.9x | 125 (27.1%) | 143 (14.2%) |
| 4.0x or more | 275 (59.7%) | 172 (17.1%) |
| Total | 461 (100.0%) | 1,008 (100.0%) |
Real Estate Taxes by Mortgage Status in Genesee
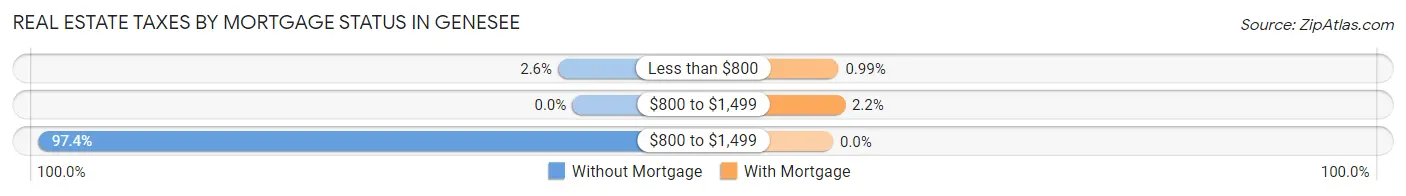
| Property Taxes | Without Mortgage | With Mortgage |
| Less than $800 | 12 (2.6%) | 10 (1.0%) |
| $800 to $1,499 | 0 (0.0%) | 22 (2.2%) |
| $800 to $1,499 | 449 (97.4%) | 0 (0.0%) |
| Total | 461 (100.0%) | 1,008 (100.0%) |
Health & Disability in Genesee
Health Insurance Coverage by Age in Genesee
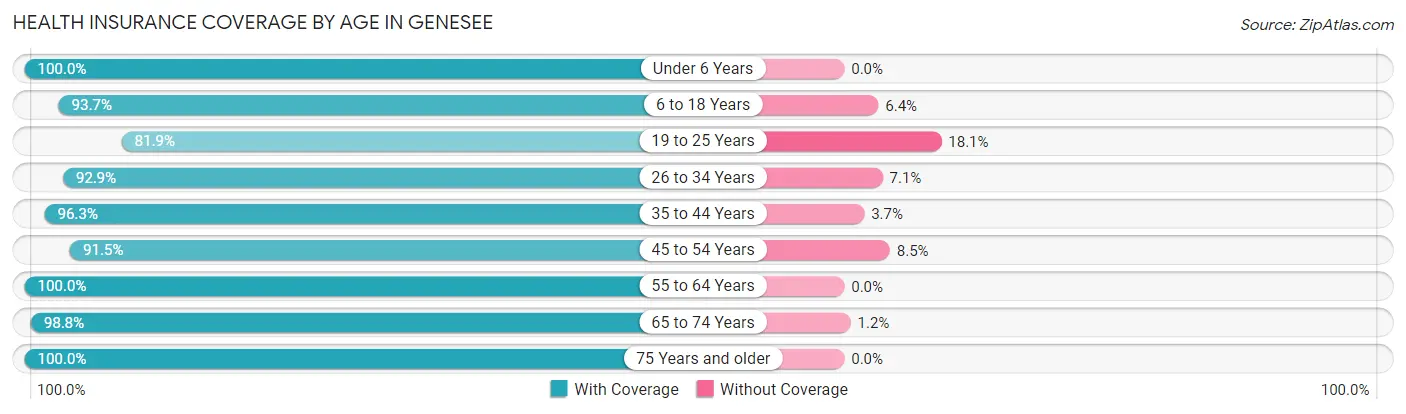
| Age Bracket | With Coverage | Without Coverage |
| Under 6 Years | 216 (100.0%) | 0 (0.0%) |
| 6 to 18 Years | 619 (93.6%) | 42 (6.4%) |
| 19 to 25 Years | 95 (81.9%) | 21 (18.1%) |
| 26 to 34 Years | 104 (92.9%) | 8 (7.1%) |
| 35 to 44 Years | 570 (96.3%) | 22 (3.7%) |
| 45 to 54 Years | 485 (91.5%) | 45 (8.5%) |
| 55 to 64 Years | 698 (100.0%) | 0 (0.0%) |
| 65 to 74 Years | 751 (98.8%) | 9 (1.2%) |
| 75 Years and older | 361 (100.0%) | 0 (0.0%) |
| Total | 3,899 (96.4%) | 147 (3.6%) |
Health Insurance Coverage by Citizenship Status in Genesee
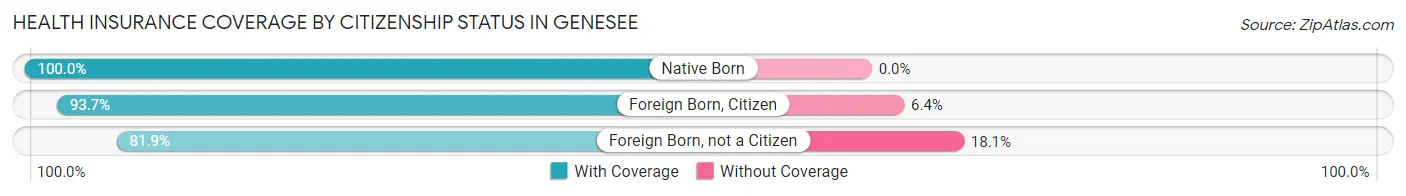
| Citizenship Status | With Coverage | Without Coverage |
| Native Born | 216 (100.0%) | 0 (0.0%) |
| Foreign Born, Citizen | 619 (93.6%) | 42 (6.4%) |
| Foreign Born, not a Citizen | 95 (81.9%) | 21 (18.1%) |
Health Insurance Coverage by Household Income in Genesee
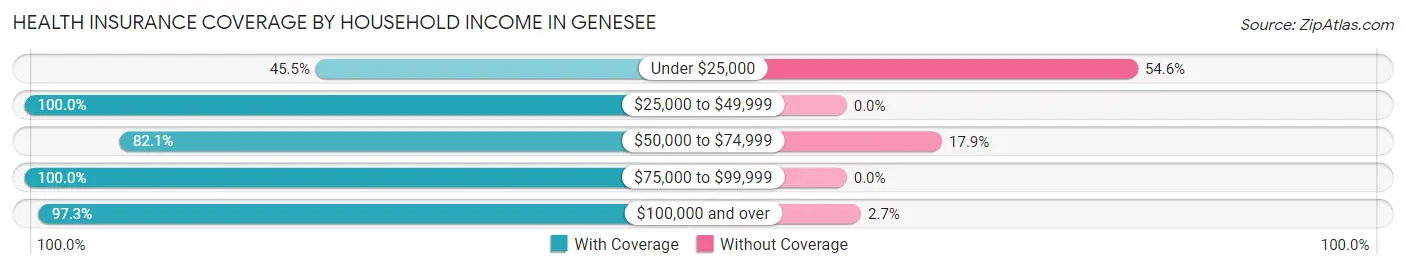
| Household Income | With Coverage | Without Coverage |
| Under $25,000 | 20 (45.5%) | 24 (54.5%) |
| $25,000 to $49,999 | 256 (100.0%) | 0 (0.0%) |
| $50,000 to $74,999 | 138 (82.1%) | 30 (17.9%) |
| $75,000 to $99,999 | 108 (100.0%) | 0 (0.0%) |
| $100,000 and over | 3,377 (97.3%) | 93 (2.7%) |
Public vs Private Health Insurance Coverage by Age in Genesee
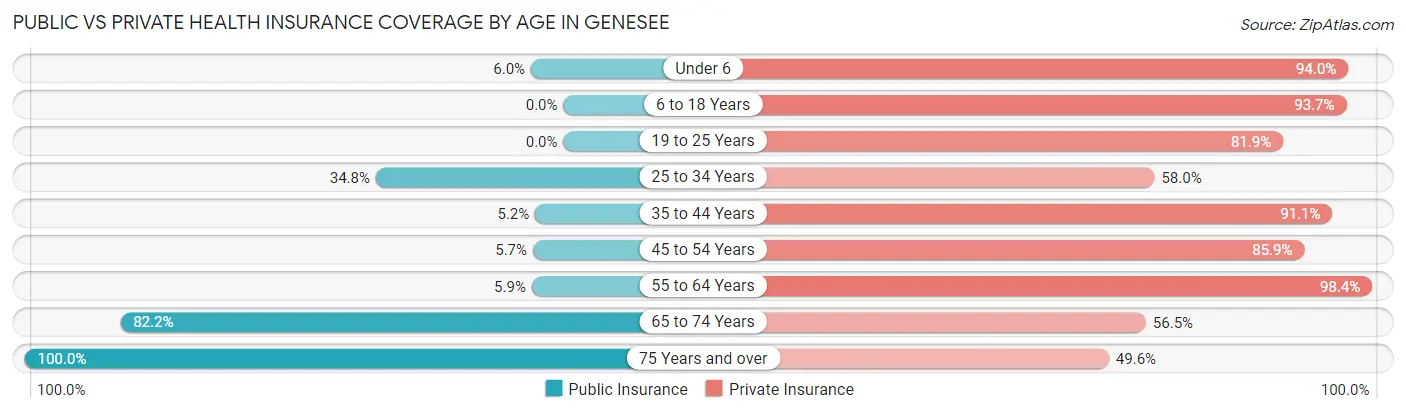
| Age Bracket | Public Insurance | Private Insurance |
| Under 6 | 13 (6.0%) | 203 (94.0%) |
| 6 to 18 Years | 0 (0.0%) | 619 (93.6%) |
| 19 to 25 Years | 0 (0.0%) | 95 (81.9%) |
| 25 to 34 Years | 39 (34.8%) | 65 (58.0%) |
| 35 to 44 Years | 31 (5.2%) | 539 (91.0%) |
| 45 to 54 Years | 30 (5.7%) | 455 (85.9%) |
| 55 to 64 Years | 41 (5.9%) | 687 (98.4%) |
| 65 to 74 Years | 625 (82.2%) | 429 (56.5%) |
| 75 Years and over | 361 (100.0%) | 179 (49.6%) |
| Total | 1,140 (28.2%) | 3,271 (80.8%) |
Disability Status by Sex by Age in Genesee
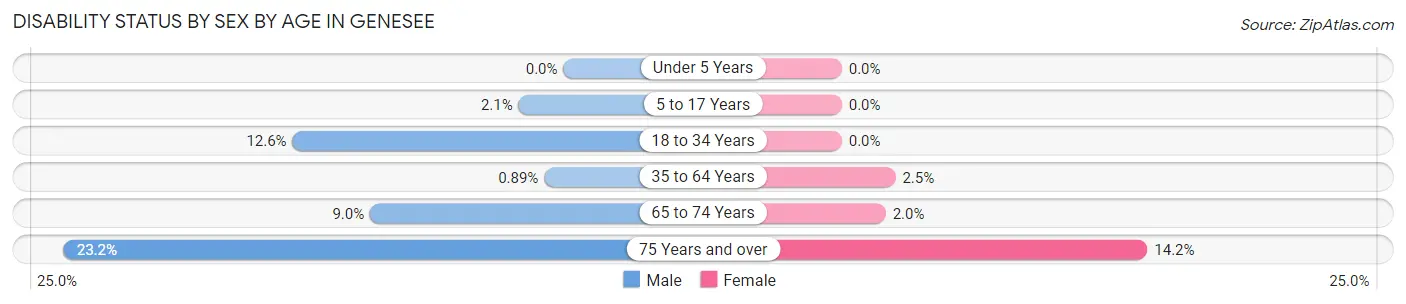
| Age Bracket | Male | Female |
| Under 5 Years | 0 (0.0%) | 0 (0.0%) |
| 5 to 17 Years | 7 (2.1%) | 0 (0.0%) |
| 18 to 34 Years | 21 (12.6%) | 0 (0.0%) |
| 35 to 64 Years | 8 (0.9%) | 23 (2.5%) |
| 65 to 74 Years | 33 (9.0%) | 8 (2.0%) |
| 75 Years and over | 51 (23.2%) | 20 (14.2%) |
Disability Class by Sex by Age in Genesee
Disability Class: Hearing Difficulty
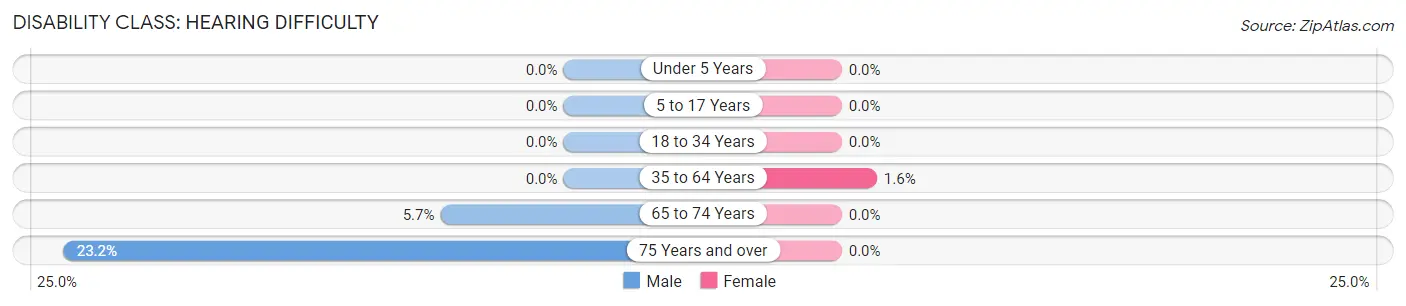
| Age Bracket | Male | Female |
| Under 5 Years | 0 (0.0%) | 0 (0.0%) |
| 5 to 17 Years | 0 (0.0%) | 0 (0.0%) |
| 18 to 34 Years | 0 (0.0%) | 0 (0.0%) |
| 35 to 64 Years | 0 (0.0%) | 15 (1.6%) |
| 65 to 74 Years | 21 (5.7%) | 0 (0.0%) |
| 75 Years and over | 51 (23.2%) | 0 (0.0%) |
Disability Class: Vision Difficulty
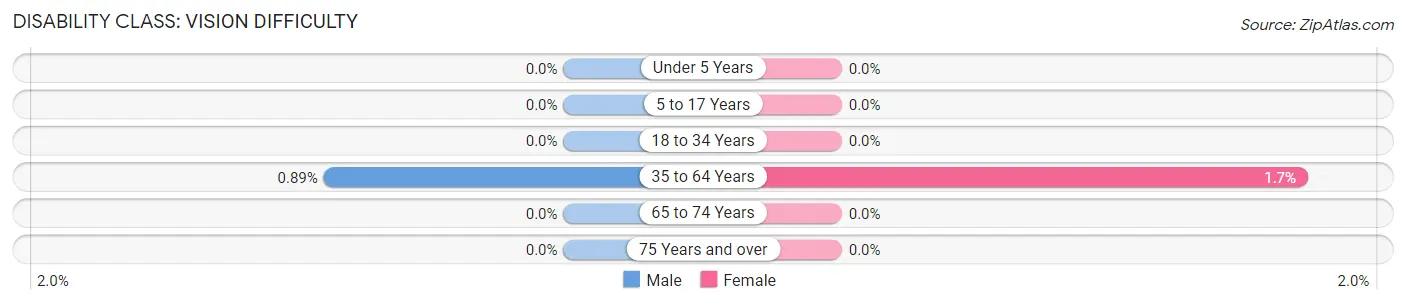
| Age Bracket | Male | Female |
| Under 5 Years | 0 (0.0%) | 0 (0.0%) |
| 5 to 17 Years | 0 (0.0%) | 0 (0.0%) |
| 18 to 34 Years | 0 (0.0%) | 0 (0.0%) |
| 35 to 64 Years | 8 (0.9%) | 16 (1.7%) |
| 65 to 74 Years | 0 (0.0%) | 0 (0.0%) |
| 75 Years and over | 0 (0.0%) | 0 (0.0%) |
Disability Class: Cognitive Difficulty
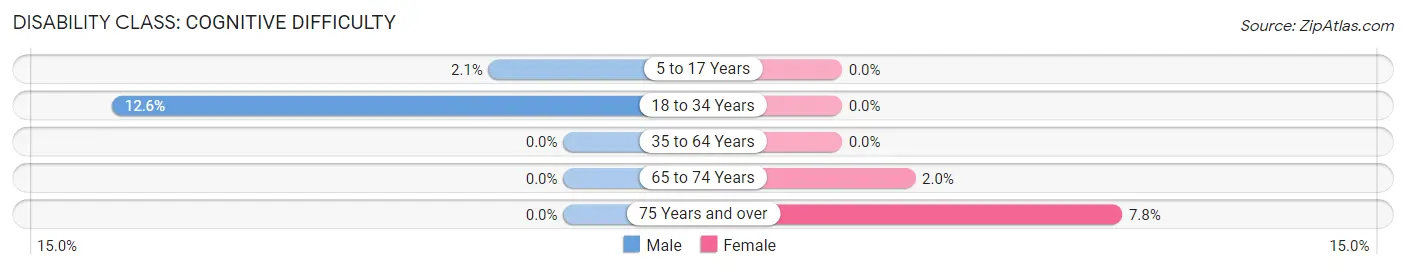
| Age Bracket | Male | Female |
| 5 to 17 Years | 7 (2.1%) | 0 (0.0%) |
| 18 to 34 Years | 21 (12.6%) | 0 (0.0%) |
| 35 to 64 Years | 0 (0.0%) | 0 (0.0%) |
| 65 to 74 Years | 0 (0.0%) | 8 (2.0%) |
| 75 Years and over | 0 (0.0%) | 11 (7.8%) |
Disability Class: Ambulatory Difficulty
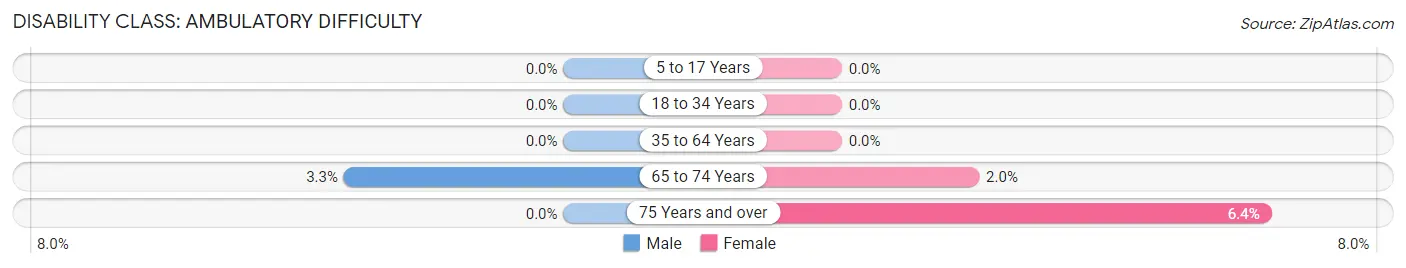
| Age Bracket | Male | Female |
| 5 to 17 Years | 0 (0.0%) | 0 (0.0%) |
| 18 to 34 Years | 0 (0.0%) | 0 (0.0%) |
| 35 to 64 Years | 0 (0.0%) | 0 (0.0%) |
| 65 to 74 Years | 12 (3.3%) | 8 (2.0%) |
| 75 Years and over | 0 (0.0%) | 9 (6.4%) |
Disability Class: Self-Care Difficulty
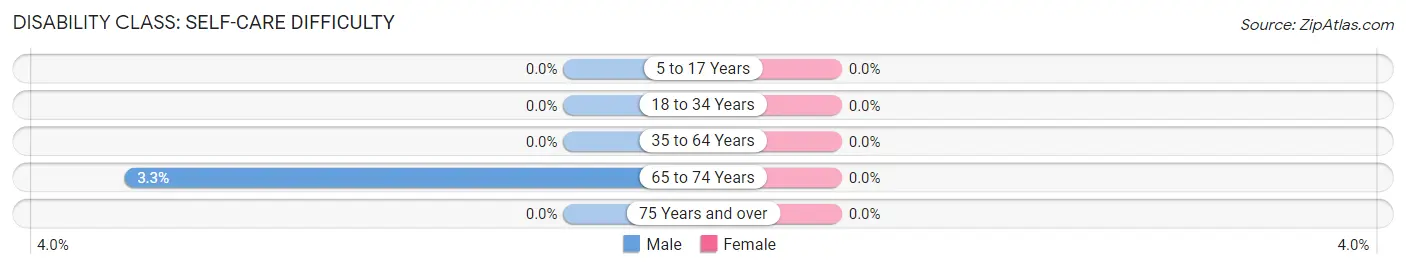
| Age Bracket | Male | Female |
| 5 to 17 Years | 0 (0.0%) | 0 (0.0%) |
| 18 to 34 Years | 0 (0.0%) | 0 (0.0%) |
| 35 to 64 Years | 0 (0.0%) | 0 (0.0%) |
| 65 to 74 Years | 12 (3.3%) | 0 (0.0%) |
| 75 Years and over | 0 (0.0%) | 0 (0.0%) |
Technology Access in Genesee
Computing Device Access in Genesee
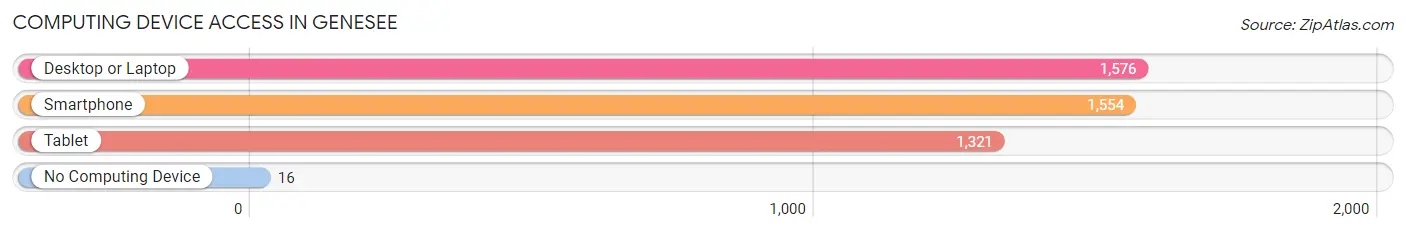
| Device Type | # Households | % Households |
| Desktop or Laptop | 1,576 | 97.6% |
| Smartphone | 1,554 | 96.2% |
| Tablet | 1,321 | 81.8% |
| No Computing Device | 16 | 1.0% |
| Total | 1,615 | 100.0% |
Internet Access in Genesee
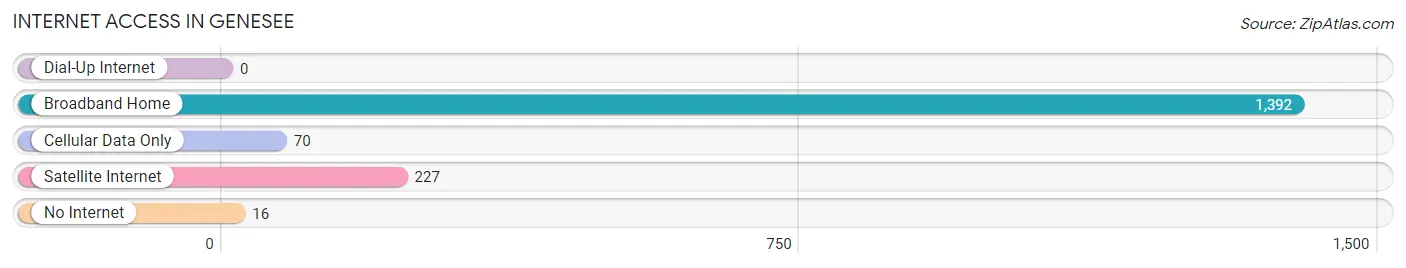
| Internet Type | # Households | % Households |
| Dial-Up Internet | 0 | 0.0% |
| Broadband Home | 1,392 | 86.2% |
| Cellular Data Only | 70 | 4.3% |
| Satellite Internet | 227 | 14.1% |
| No Internet | 16 | 1.0% |
| Total | 1,615 | 100.0% |
Genesee Summary
Genesee, Colorado is a small unincorporated community located in Jefferson County, Colorado. It is situated in the foothills of the Rocky Mountains, approximately 15 miles west of Denver. The community is located in the foothills of the Front Range of the Rocky Mountains, and is surrounded by the communities of Golden, Arvada, and Wheat Ridge.
History
Genesee was founded in 1859 by a group of settlers from the Midwest. The settlers were attracted to the area by the abundance of natural resources, including timber, water, and minerals. The settlers named the community after Genesee County, New York, where many of them had previously lived.
The first settlers in Genesee were primarily farmers and ranchers, and the community quickly grew to include a post office, a school, a church, and a general store. In the late 1800s, the community also became home to a number of coal mines, which provided employment for many of the residents.
In the early 1900s, the community began to experience a period of growth and prosperity. The population increased, and the town began to develop a more urban character. In the 1920s, the town was incorporated as a municipality, and the first mayor was elected.
Geography
Genesee is located in the foothills of the Rocky Mountains, approximately 15 miles west of Denver. The community is situated at an elevation of 5,890 feet, and is surrounded by the communities of Golden, Arvada, and Wheat Ridge.
The area is characterized by rolling hills, with the highest point in the area being Mount Evans, which rises to an elevation of 14,265 feet. The area is also home to a number of creeks and streams, including Clear Creek, which flows through the town.
Economy
The economy of Genesee is largely based on tourism and recreation. The area is home to a number of ski resorts, including Echo Mountain and Loveland Ski Area, which attract visitors from all over the world. The area is also home to a number of hiking trails, camping sites, and other outdoor recreational activities.
In addition to tourism and recreation, the economy of Genesee is also supported by a number of small businesses, including restaurants, retail stores, and service providers. The town is also home to a number of small manufacturing companies, which produce a variety of products, including furniture, clothing, and electronics.
Demographics
As of the 2010 census, the population of Genesee was 1,845. The racial makeup of the town was 94.3% White, 0.7% African American, 0.3% Native American, 0.7% Asian, 0.1% Pacific Islander, 1.2% from other races, and 2.1% from two or more races. Hispanic or Latino of any race were 4.2% of the population.
The median household income in Genesee was $63,750, and the median family income was $71,250. The per capita income for the town was $30,945. About 5.3% of families and 7.2% of the population were below the poverty line, including 8.3% of those under age 18 and 4.2% of those age 65 or over.
Common Questions
What is Per Capita Income in Genesee?
Per Capita income in Genesee is $88,749.
What is the Median Family Income in Genesee?
Median Family Income in Genesee is $180,694.
What is the Median Household income in Genesee?
Median Household Income in Genesee is $174,375.
What is Income or Wage Gap in Genesee?
Income or Wage Gap in Genesee is 12.8%.
Women in Genesee earn 87.2 cents for every dollar earned by a man.
What is Inequality or Gini Index in Genesee?
Inequality or Gini Index in Genesee is 0.36.
What is the Total Population of Genesee?
Total Population of Genesee is 4,046.
What is the Total Male Population of Genesee?
Total Male Population of Genesee is 2,020.
What is the Total Female Population of Genesee?
Total Female Population of Genesee is 2,026.
What is the Ratio of Males per 100 Females in Genesee?
There are 99.70 Males per 100 Females in Genesee.
What is the Ratio of Females per 100 Males in Genesee?
There are 100.30 Females per 100 Males in Genesee.
What is the Median Population Age in Genesee?
Median Population Age in Genesee is 51.8 Years.
What is the Average Family Size in Genesee
Average Family Size in Genesee is 2.7 People.
What is the Average Household Size in Genesee
Average Household Size in Genesee is 2.5 People.
How Large is the Labor Force in Genesee?
There are 1,923 People in the Labor Forcein in Genesee.
What is the Percentage of People in the Labor Force in Genesee?
58.7% of People are in the Labor Force in Genesee.
What is the Unemployment Rate in Genesee?
Unemployment Rate in Genesee is 2.3%.