Zip Codes with the Highest Percentage of Population Employed in Public Administration in Summerville, SC
RELATED REPORTS & OPTIONS
Public Administration
Summerville
Compare Zip Codes
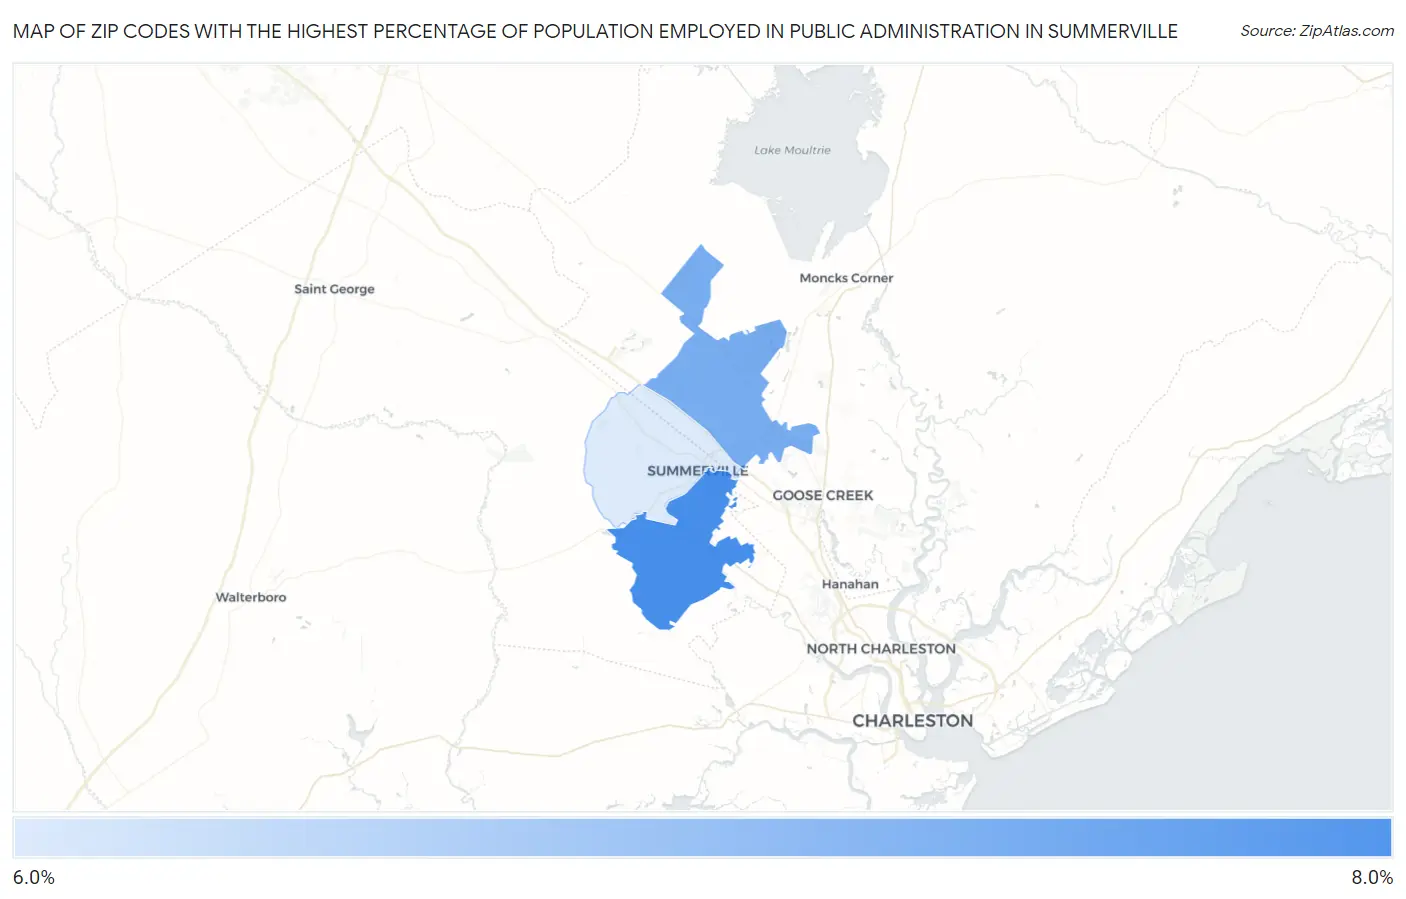
Map of Zip Codes with the Highest Percentage of Population Employed in Public Administration in Summerville
6.3%
7.7%
Zip Codes with the Highest Percentage of Population Employed in Public Administration in Summerville, SC
| Zip Code | % Employed | vs State | vs National | |
| 1. | 29485 | 7.7% | 4.5%(+3.27)#68 | 4.7%(+3.05)#6,133 |
| 2. | 29486 | 7.3% | 4.5%(+2.80)#78 | 4.7%(+2.59)#6,856 |
| 3. | 29483 | 6.3% | 4.5%(+1.83)#99 | 4.7%(+1.61)#8,592 |
1
Common Questions
What are the Top Zip Codes with the Highest Percentage of Population Employed in Public Administration in Summerville, SC?
Top Zip Codes with the Highest Percentage of Population Employed in Public Administration in Summerville, SC are:
What zip code has the Highest Percentage of Population Employed in Public Administration in Summerville, SC?
29485 has the Highest Percentage of Population Employed in Public Administration in Summerville, SC with 7.7%.
What is the Percentage of Population Employed in Public Administration in Summerville, SC?
Percentage of Population Employed in Public Administration in Summerville is 6.4%.
What is the Percentage of Population Employed in Public Administration in South Carolina?
Percentage of Population Employed in Public Administration in South Carolina is 4.5%.
What is the Percentage of Population Employed in Public Administration in the United States?
Percentage of Population Employed in Public Administration in the United States is 4.7%.