Zip Codes with the Highest Percentage of Population Employed in Production in Greenville, SC
RELATED REPORTS & OPTIONS
Production
Greenville
Compare Zip Codes
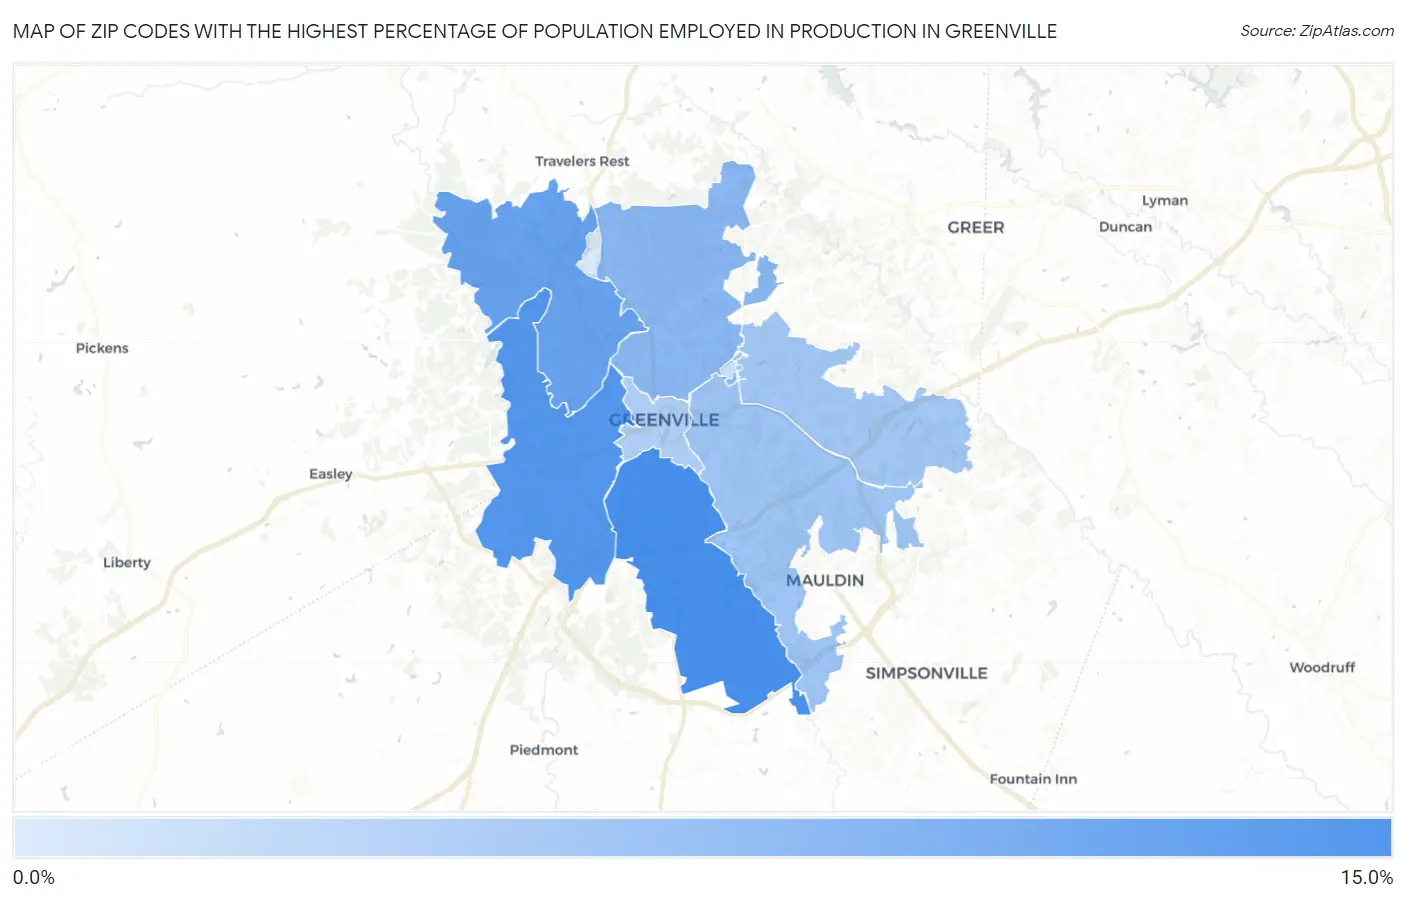
Map of Zip Codes with the Highest Percentage of Population Employed in Production in Greenville
1.1%
11.1%
Zip Codes with the Highest Percentage of Population Employed in Production in Greenville, SC
| Zip Code | % Employed | vs State | vs National | |
| 1. | 29605 | 11.1% | 7.7%(+3.43)#157 | 5.5%(+5.65)#6,403 |
| 2. | 29611 | 10.1% | 7.7%(+2.43)#179 | 5.5%(+4.66)#7,652 |
| 3. | 29617 | 8.9% | 7.7%(+1.25)#204 | 5.5%(+3.47)#9,448 |
| 4. | 29609 | 6.5% | 7.7%(-1.20)#267 | 5.5%(+1.03)#14,096 |
| 5. | 29607 | 5.2% | 7.7%(-2.54)#301 | 5.5%(-0.314)#17,250 |
| 6. | 29615 | 4.8% | 7.7%(-2.86)#315 | 5.5%(-0.637)#18,062 |
| 7. | 29601 | 4.0% | 7.7%(-3.70)#329 | 5.5%(-1.48)#20,393 |
| 8. | 29614 | 2.3% | 7.7%(-5.41)#366 | 5.5%(-3.19)#25,066 |
| 9. | 29613 | 1.1% | 7.7%(-6.56)#378 | 5.5%(-4.34)#27,733 |
1
Common Questions
What are the Top 5 Zip Codes with the Highest Percentage of Population Employed in Production in Greenville, SC?
Top 5 Zip Codes with the Highest Percentage of Population Employed in Production in Greenville, SC are:
What zip code has the Highest Percentage of Population Employed in Production in Greenville, SC?
29605 has the Highest Percentage of Population Employed in Production in Greenville, SC with 11.1%.
What is the Percentage of Population Employed in Production in Greenville, SC?
Percentage of Population Employed in Production in Greenville is 5.6%.
What is the Percentage of Population Employed in Production in South Carolina?
Percentage of Population Employed in Production in South Carolina is 7.7%.
What is the Percentage of Population Employed in Production in the United States?
Percentage of Population Employed in Production in the United States is 5.5%.