Crane, MO Map & Demographics
Crane Map
Crane Overview
$20,590
PER CAPITA INCOME
$46,211
AVG FAMILY INCOME
$45,234
AVG HOUSEHOLD INCOME
35.9%
WAGE / INCOME GAP [ % ]
64.1¢/ $1
WAGE / INCOME GAP [ $ ]
$16,573
FAMILY INCOME DEFICIT
0.49
INEQUALITY / GINI INDEX
1,470
TOTAL POPULATION
630
MALE POPULATION
840
FEMALE POPULATION
75.00
MALES / 100 FEMALES
133.33
FEMALES / 100 MALES
30.6
MEDIAN AGE
3.4
AVG FAMILY SIZE
2.8
AVG HOUSEHOLD SIZE
557
LABOR FORCE [ PEOPLE ]
53.4%
PERCENT IN LABOR FORCE
4.3%
UNEMPLOYMENT RATE
Crane Zip Codes
Crane Area Codes
Income in Crane
Income Overview in Crane
Per Capita Income in Crane is $20,590, while median incomes of families and households are $46,211 and $45,234 respectively.
| Characteristic | Number | Measure |
| Per Capita Income | 1,470 | $20,590 |
| Median Family Income | 352 | $46,211 |
| Mean Family Income | 352 | $57,100 |
| Median Household Income | 482 | $45,234 |
| Mean Household Income | 482 | $60,087 |
| Income Deficit | 352 | $16,573 |
| Wage / Income Gap (%) | 1,470 | 35.93% |
| Wage / Income Gap ($) | 1,470 | 64.07¢ per $1 |
| Gini / Inequality Index | 1,470 | 0.49 |
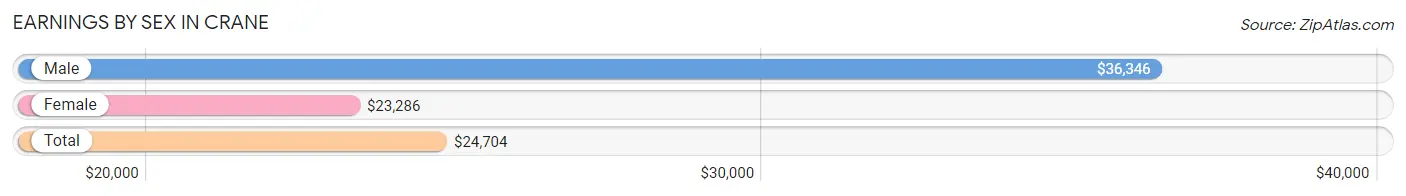
Earnings by Sex in Crane
Average Earnings in Crane are $24,704, $36,346 for men and $23,286 for women, a difference of 35.9%.
| Sex | Number | Average Earnings |
| Male | 246 (42.6%) | $36,346 |
| Female | 332 (57.4%) | $23,286 |
| Total | 578 (100.0%) | $24,704 |
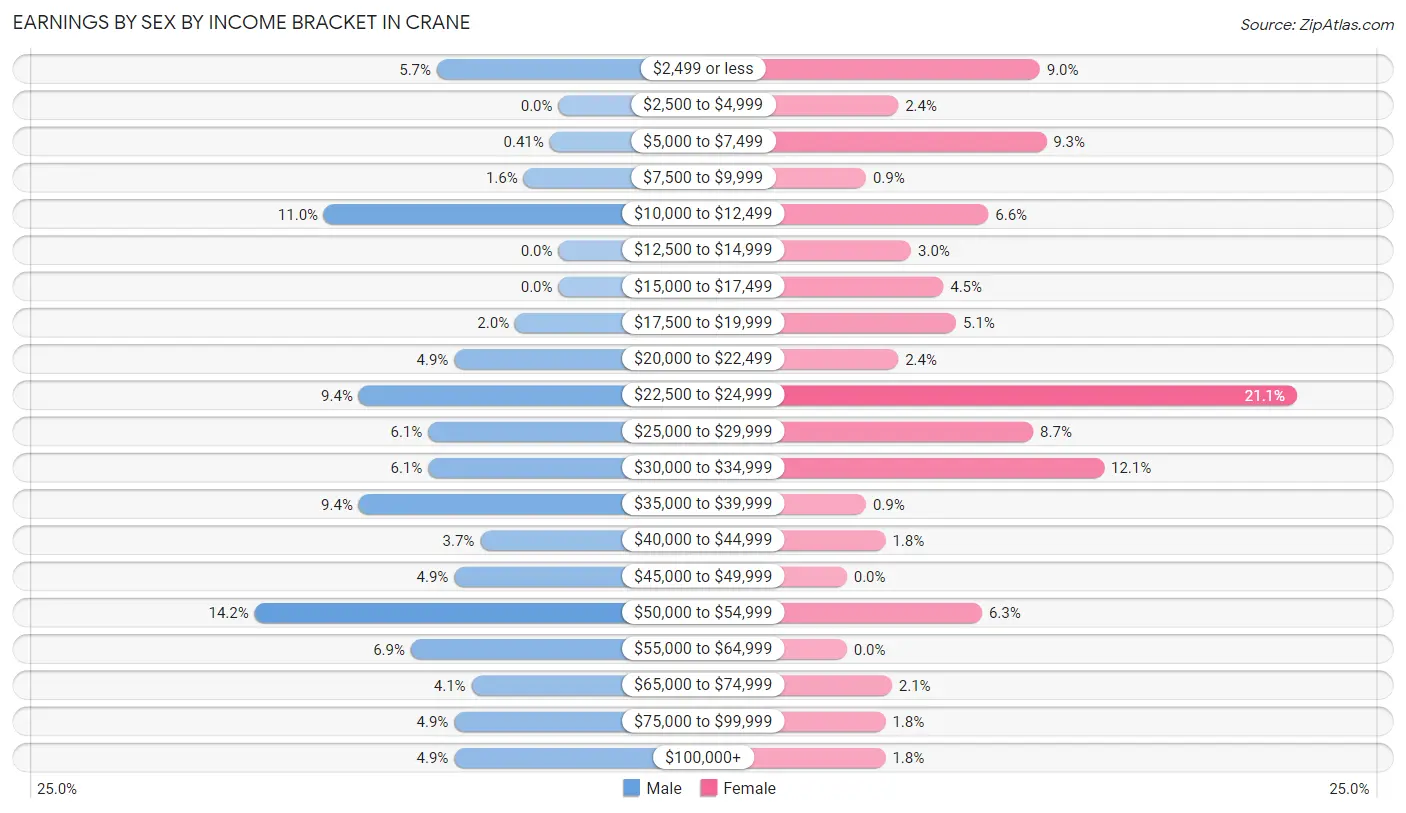
Earnings by Sex by Income Bracket in Crane
The most common earnings brackets in Crane are $50,000 to $54,999 for men (35 | 14.2%) and $22,500 to $24,999 for women (70 | 21.1%).
| Income | Male | Female |
| $2,499 or less | 14 (5.7%) | 30 (9.0%) |
| $2,500 to $4,999 | 0 (0.0%) | 8 (2.4%) |
| $5,000 to $7,499 | 1 (0.4%) | 31 (9.3%) |
| $7,500 to $9,999 | 4 (1.6%) | 3 (0.9%) |
| $10,000 to $12,499 | 27 (11.0%) | 22 (6.6%) |
| $12,500 to $14,999 | 0 (0.0%) | 10 (3.0%) |
| $15,000 to $17,499 | 0 (0.0%) | 15 (4.5%) |
| $17,500 to $19,999 | 5 (2.0%) | 17 (5.1%) |
| $20,000 to $22,499 | 12 (4.9%) | 8 (2.4%) |
| $22,500 to $24,999 | 23 (9.3%) | 70 (21.1%) |
| $25,000 to $29,999 | 15 (6.1%) | 29 (8.7%) |
| $30,000 to $34,999 | 15 (6.1%) | 40 (12.0%) |
| $35,000 to $39,999 | 23 (9.3%) | 3 (0.9%) |
| $40,000 to $44,999 | 9 (3.7%) | 6 (1.8%) |
| $45,000 to $49,999 | 12 (4.9%) | 0 (0.0%) |
| $50,000 to $54,999 | 35 (14.2%) | 21 (6.3%) |
| $55,000 to $64,999 | 17 (6.9%) | 0 (0.0%) |
| $65,000 to $74,999 | 10 (4.1%) | 7 (2.1%) |
| $75,000 to $99,999 | 12 (4.9%) | 6 (1.8%) |
| $100,000+ | 12 (4.9%) | 6 (1.8%) |
| Total | 246 (100.0%) | 332 (100.0%) |
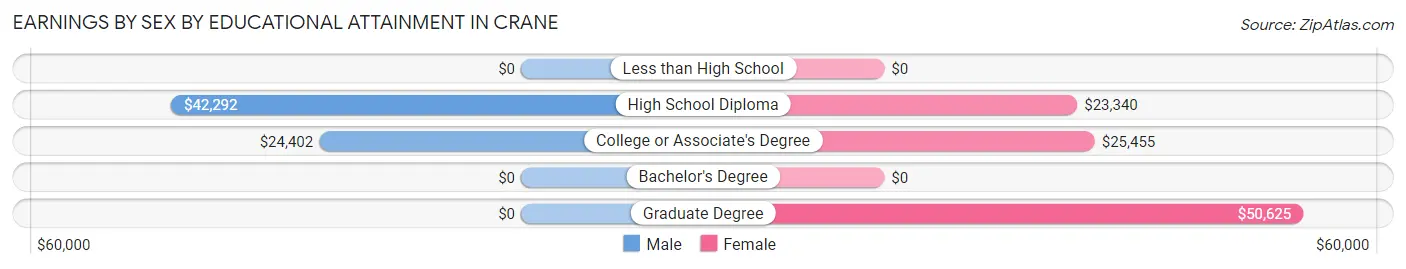
Earnings by Sex by Educational Attainment in Crane
Average earnings in Crane are $36,442 for men and $23,982 for women, a difference of 34.2%. Men with an educational attainment of high school diploma enjoy the highest average annual earnings of $42,292, while those with college or associate's degree education earn the least with $24,402. Women with an educational attainment of graduate degree earn the most with the average annual earnings of $50,625, while those with high school diploma education have the smallest earnings of $23,340.
| Educational Attainment | Male Income | Female Income |
| Less than High School | - | - |
| High School Diploma | $42,292 | $23,340 |
| College or Associate's Degree | $24,402 | $25,455 |
| Bachelor's Degree | - | - |
| Graduate Degree | - | - |
| Total | $36,442 | $23,982 |
Family Income in Crane
Family Income Brackets in Crane
According to the Crane family income data, there are 87 families falling into the $35,000 to $49,999 income range, which is the most common income bracket and makes up 24.7% of all families. Conversely, the $200,000+ income bracket is the least frequent group with only 6 families (1.7%) belonging to this category.
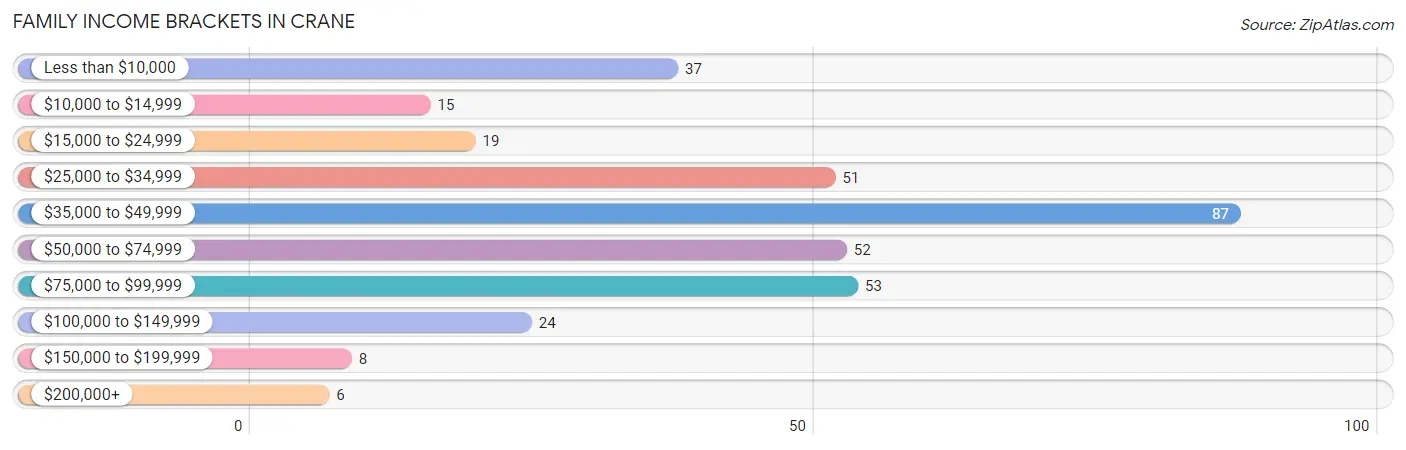
| Income Bracket | # Families | % Families |
| Less than $10,000 | 37 | 10.5% |
| $10,000 to $14,999 | 15 | 4.3% |
| $15,000 to $24,999 | 19 | 5.4% |
| $25,000 to $34,999 | 51 | 14.5% |
| $35,000 to $49,999 | 87 | 24.7% |
| $50,000 to $74,999 | 52 | 14.8% |
| $75,000 to $99,999 | 53 | 15.1% |
| $100,000 to $149,999 | 24 | 6.8% |
| $150,000 to $199,999 | 8 | 2.3% |
| $200,000+ | 6 | 1.7% |
Family Income by Famaliy Size in Crane
4-person families (55 | 15.6%) account for the highest median family income in Crane with $77,292 per family, while 2-person families (138 | 39.2%) have the highest median income of $20,312 per family member.
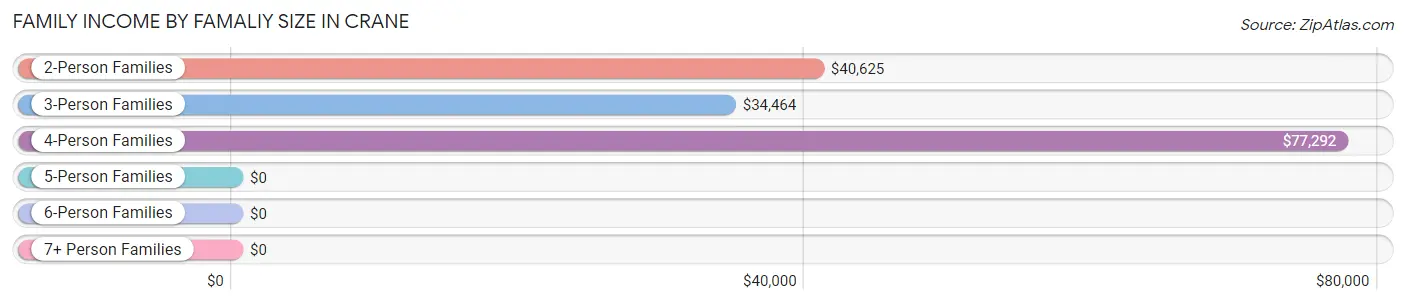
| Income Bracket | # Families | Median Income |
| 2-Person Families | 138 (39.2%) | $40,625 |
| 3-Person Families | 68 (19.3%) | $34,464 |
| 4-Person Families | 55 (15.6%) | $77,292 |
| 5-Person Families | 18 (5.1%) | $0 |
| 6-Person Families | 64 (18.2%) | $0 |
| 7+ Person Families | 9 (2.6%) | $0 |
| Total | 352 (100.0%) | $46,211 |
Family Income by Number of Earners in Crane
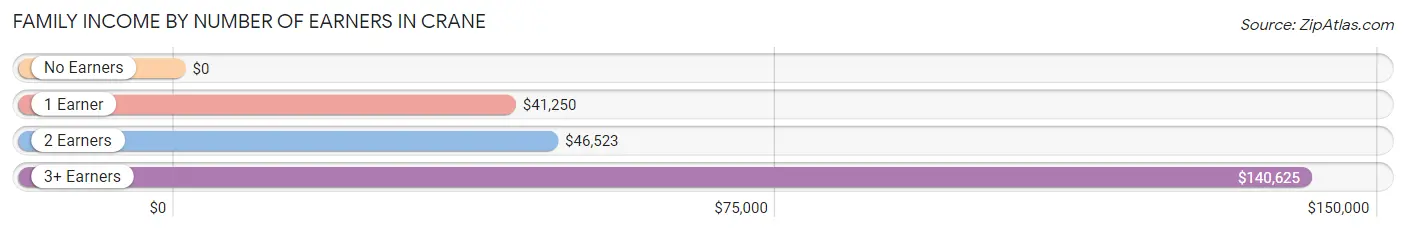
| Number of Earners | # Families | Median Income |
| No Earners | 70 (19.9%) | $0 |
| 1 Earner | 113 (32.1%) | $41,250 |
| 2 Earners | 148 (42.0%) | $46,523 |
| 3+ Earners | 21 (6.0%) | $140,625 |
| Total | 352 (100.0%) | $46,211 |
Household Income in Crane
Household Income Brackets in Crane
With 118 households falling in the category, the $35,000 to $49,999 income range is the most frequent in Crane, accounting for 24.5% of all households. In contrast, only 9 households (1.9%) fall into the $200,000+ income bracket, making it the least populous group.
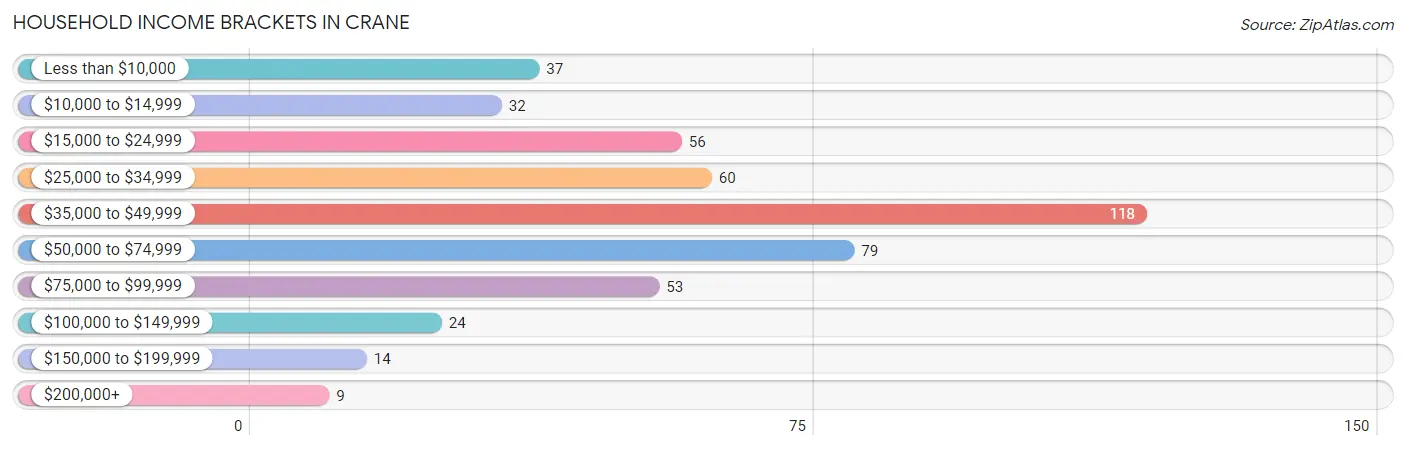
| Income Bracket | # Households | % Households |
| Less than $10,000 | 37 | 7.7% |
| $10,000 to $14,999 | 32 | 6.6% |
| $15,000 to $24,999 | 56 | 11.6% |
| $25,000 to $34,999 | 60 | 12.4% |
| $35,000 to $49,999 | 118 | 24.5% |
| $50,000 to $74,999 | 79 | 16.4% |
| $75,000 to $99,999 | 53 | 11.0% |
| $100,000 to $149,999 | 24 | 5.0% |
| $150,000 to $199,999 | 14 | 2.9% |
| $200,000+ | 9 | 1.9% |
Household Income by Householder Age in Crane
The median household income in Crane is $45,234, with the highest median household income of $62,813 found in the 45 to 64 years age bracket for the primary householder. A total of 161 households (33.4%) fall into this category. Meanwhile, the 65+ years age bracket for the primary householder has the lowest median household income of $25,000, with 112 households (23.2%) in this group.
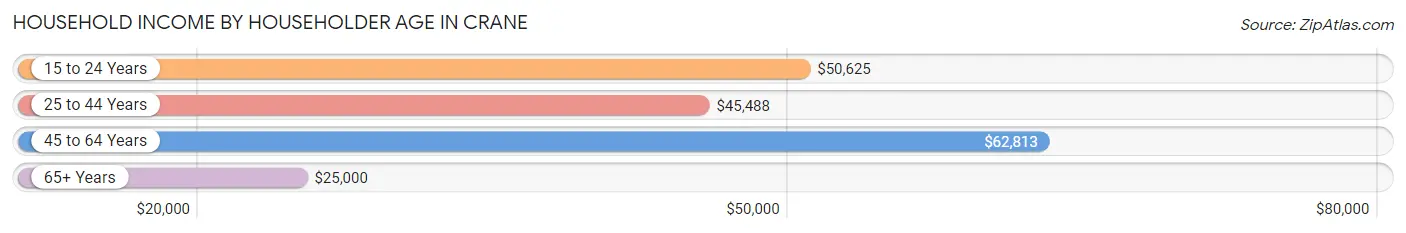
| Income Bracket | # Households | Median Income |
| 15 to 24 Years | 18 (3.7%) | $50,625 |
| 25 to 44 Years | 191 (39.6%) | $45,488 |
| 45 to 64 Years | 161 (33.4%) | $62,813 |
| 65+ Years | 112 (23.2%) | $25,000 |
| Total | 482 (100.0%) | $45,234 |
Poverty in Crane
Income Below Poverty by Sex and Age in Crane
With 23.0% poverty level for males and 21.9% for females among the residents of Crane, 12 to 14 year old males and 5 year old females are the most vulnerable to poverty, with 28 males (65.1%) and 12 females (100.0%) in their respective age groups living below the poverty level.
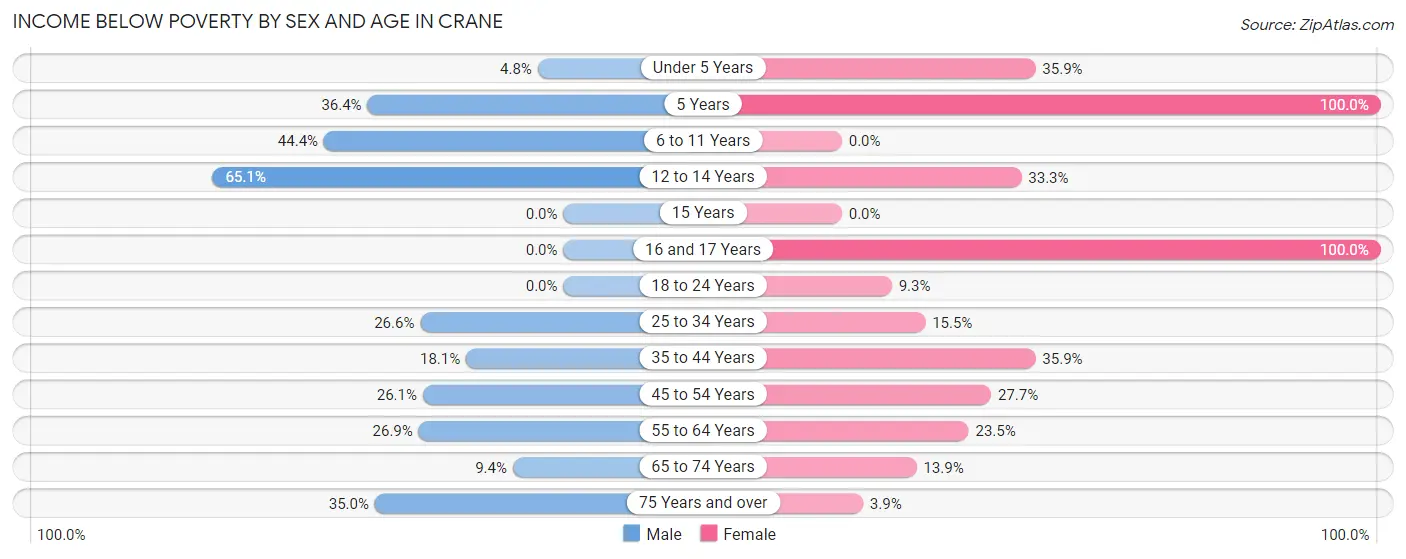
| Age Bracket | Male | Female |
| Under 5 Years | 6 (4.8%) | 23 (35.9%) |
| 5 Years | 4 (36.4%) | 12 (100.0%) |
| 6 to 11 Years | 20 (44.4%) | 0 (0.0%) |
| 12 to 14 Years | 28 (65.1%) | 11 (33.3%) |
| 15 Years | 0 (0.0%) | 0 (0.0%) |
| 16 and 17 Years | 0 (0.0%) | 21 (100.0%) |
| 18 to 24 Years | 0 (0.0%) | 5 (9.3%) |
| 25 to 34 Years | 17 (26.6%) | 26 (15.5%) |
| 35 to 44 Years | 13 (18.1%) | 23 (35.9%) |
| 45 to 54 Years | 18 (26.1%) | 23 (27.7%) |
| 55 to 64 Years | 18 (26.9%) | 16 (23.5%) |
| 65 to 74 Years | 3 (9.4%) | 14 (13.9%) |
| 75 Years and over | 7 (35.0%) | 2 (3.9%) |
| Total | 134 (23.0%) | 176 (21.9%) |
Income Above Poverty by Sex and Age in Crane
According to the poverty statistics in Crane, males aged 18 to 24 years and females aged 6 to 11 years are the age groups that are most secure financially, with 100.0% of males and 100.0% of females in these age groups living above the poverty line.
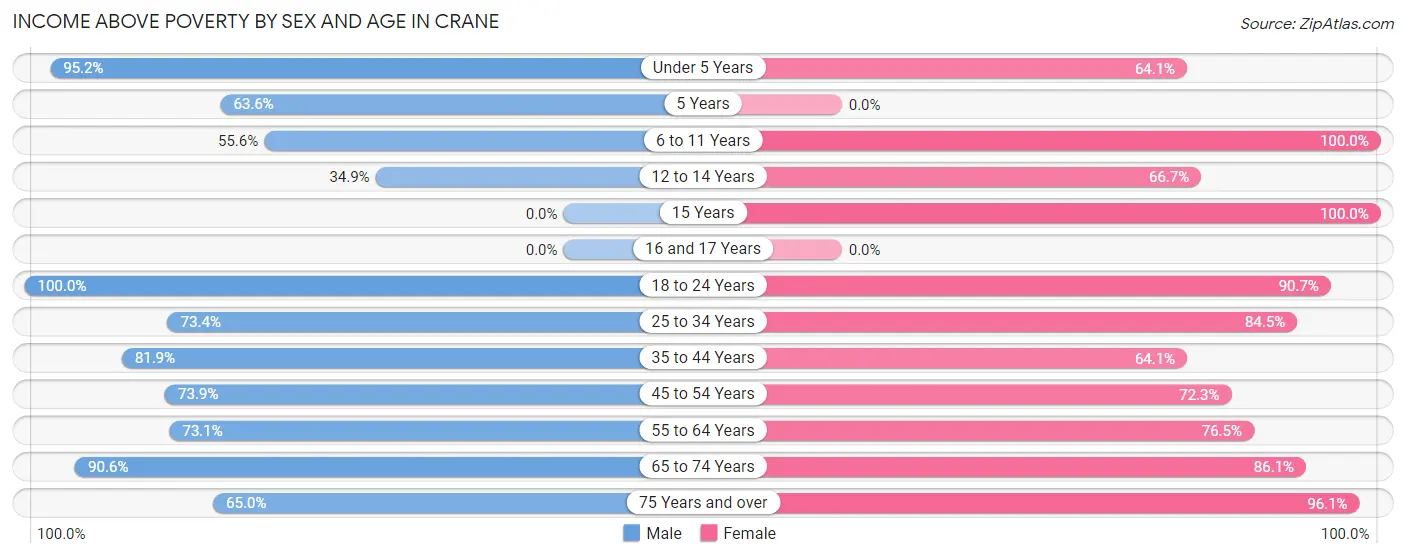
| Age Bracket | Male | Female |
| Under 5 Years | 120 (95.2%) | 41 (64.1%) |
| 5 Years | 7 (63.6%) | 0 (0.0%) |
| 6 to 11 Years | 25 (55.6%) | 73 (100.0%) |
| 12 to 14 Years | 15 (34.9%) | 22 (66.7%) |
| 15 Years | 0 (0.0%) | 11 (100.0%) |
| 16 and 17 Years | 0 (0.0%) | 0 (0.0%) |
| 18 to 24 Years | 33 (100.0%) | 49 (90.7%) |
| 25 to 34 Years | 47 (73.4%) | 142 (84.5%) |
| 35 to 44 Years | 59 (81.9%) | 41 (64.1%) |
| 45 to 54 Years | 51 (73.9%) | 60 (72.3%) |
| 55 to 64 Years | 49 (73.1%) | 52 (76.5%) |
| 65 to 74 Years | 29 (90.6%) | 87 (86.1%) |
| 75 Years and over | 13 (65.0%) | 49 (96.1%) |
| Total | 448 (77.0%) | 627 (78.1%) |
Income Below Poverty Among Married-Couple Families in Crane
The poverty statistics for married-couple families in Crane show that 14.1% or 36 of the total 256 families live below the poverty line. Families with 5 or more children have the highest poverty rate of 100.0%, comprising of 3 families. On the other hand, families with 3 or 4 children have the lowest poverty rate of 10.0%, which includes 8 families.
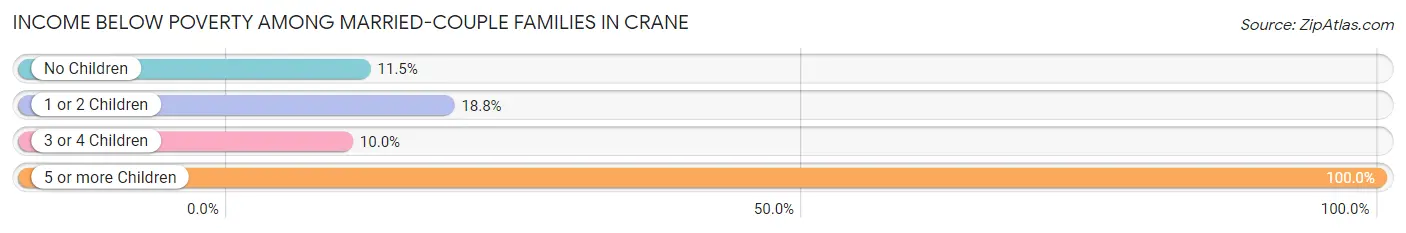
| Children | Above Poverty | Below Poverty |
| No Children | 92 (88.5%) | 12 (11.5%) |
| 1 or 2 Children | 56 (81.2%) | 13 (18.8%) |
| 3 or 4 Children | 72 (90.0%) | 8 (10.0%) |
| 5 or more Children | 0 (0.0%) | 3 (100.0%) |
| Total | 220 (85.9%) | 36 (14.1%) |
Income Below Poverty Among Single-Parent Households in Crane
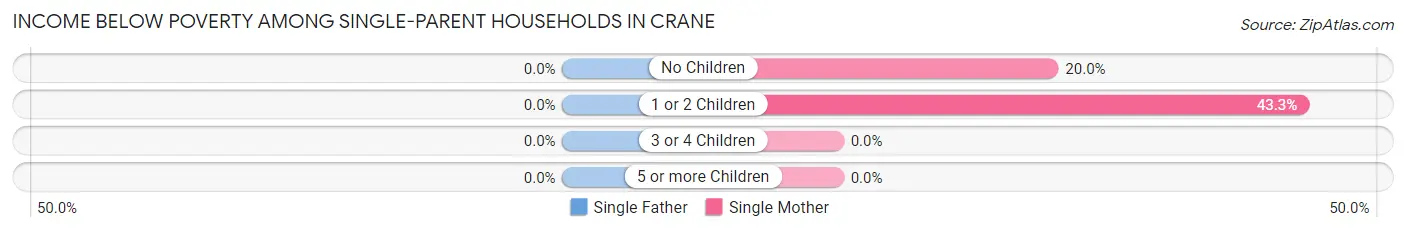
| Children | Single Father | Single Mother |
| No Children | 0 (0.0%) | 4 (20.0%) |
| 1 or 2 Children | 0 (0.0%) | 26 (43.3%) |
| 3 or 4 Children | 0 (0.0%) | 0 (0.0%) |
| 5 or more Children | 0 (0.0%) | 0 (0.0%) |
| Total | 0 (0.0%) | 30 (37.5%) |
Income Below Poverty Among Married-Couple vs Single-Parent Households in Crane
The poverty data for Crane shows that 36 of the married-couple family households (14.1%) and 30 of the single-parent households (31.2%) are living below the poverty level. Within the married-couple family households, those with 5 or more children have the highest poverty rate, with 3 households (100.0%) falling below the poverty line. Among the single-parent households, those with 1 or 2 children have the highest poverty rate, with 26 household (39.4%) living below poverty.
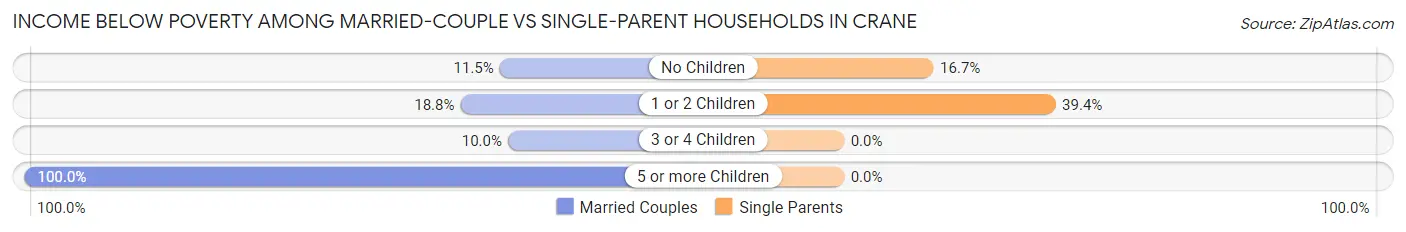
| Children | Married-Couple Families | Single-Parent Households |
| No Children | 12 (11.5%) | 4 (16.7%) |
| 1 or 2 Children | 13 (18.8%) | 26 (39.4%) |
| 3 or 4 Children | 8 (10.0%) | 0 (0.0%) |
| 5 or more Children | 3 (100.0%) | 0 (0.0%) |
| Total | 36 (14.1%) | 30 (31.2%) |
Race in Crane
The most populous races in Crane are White / Caucasian (1,394 | 94.8%), Two or more Races (70 | 4.8%), and Some other Race (5 | 0.3%).
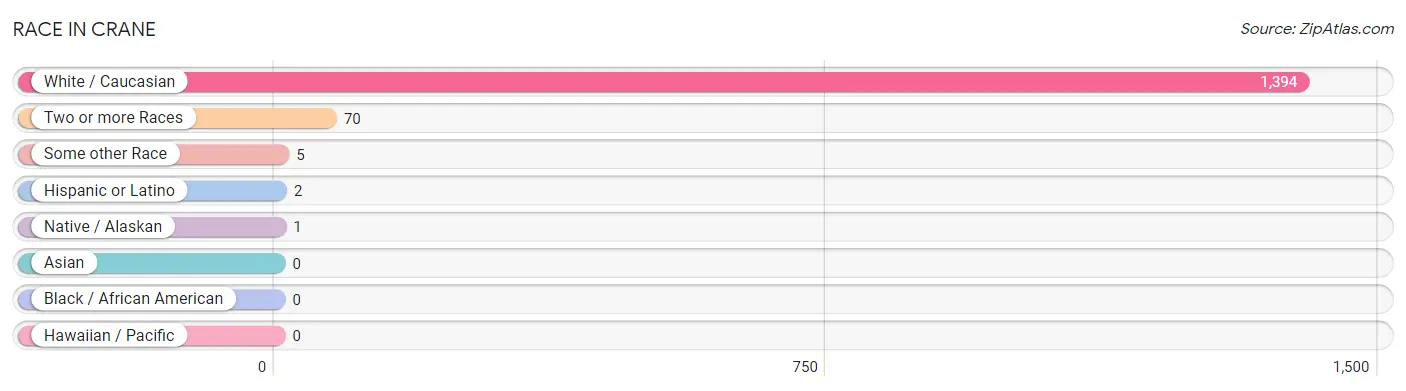
| Race | # Population | % Population |
| Asian | 0 | 0.0% |
| Black / African American | 0 | 0.0% |
| Hawaiian / Pacific | 0 | 0.0% |
| Hispanic or Latino | 2 | 0.1% |
| Native / Alaskan | 1 | 0.1% |
| White / Caucasian | 1,394 | 94.8% |
| Two or more Races | 70 | 4.8% |
| Some other Race | 5 | 0.3% |
| Total | 1,470 | 100.0% |
Ancestry in Crane
The most populous ancestries reported in Crane are Irish (225 | 15.3%), German (206 | 14.0%), European (131 | 8.9%), English (121 | 8.2%), and American (101 | 6.9%), together accounting for 53.3% of all Crane residents.
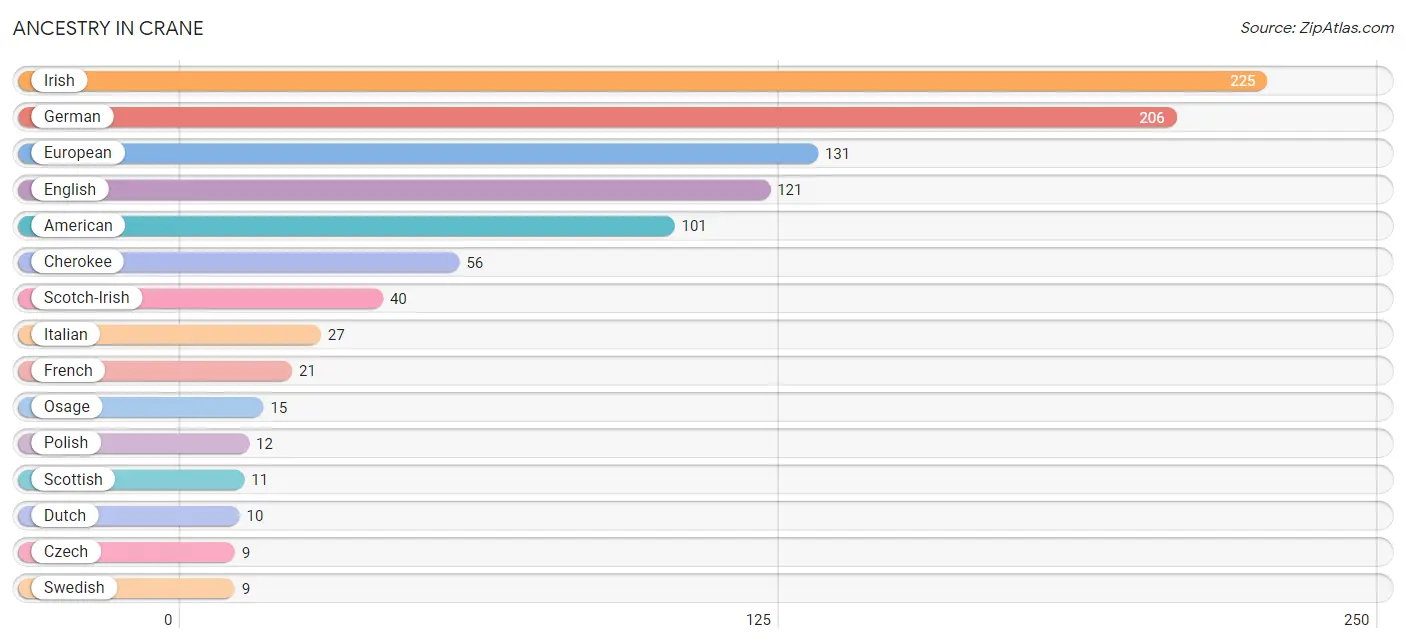
| Ancestry | # Population | % Population |
| American | 101 | 6.9% |
| British | 5 | 0.3% |
| Cherokee | 56 | 3.8% |
| Czech | 9 | 0.6% |
| Danish | 1 | 0.1% |
| Dutch | 10 | 0.7% |
| English | 121 | 8.2% |
| European | 131 | 8.9% |
| French | 21 | 1.4% |
| German | 206 | 14.0% |
| Greek | 3 | 0.2% |
| Irish | 225 | 15.3% |
| Italian | 27 | 1.8% |
| Mexican | 2 | 0.1% |
| Navajo | 3 | 0.2% |
| Norwegian | 6 | 0.4% |
| Osage | 15 | 1.0% |
| Polish | 12 | 0.8% |
| Scotch-Irish | 40 | 2.7% |
| Scottish | 11 | 0.7% |
| Swedish | 9 | 0.6% |
| Welsh | 3 | 0.2% | View All 22 Rows |
Immigrants in Crane

| Immigration Origin | # Population | % Population | View All 0 Rows |
Sex and Age in Crane
Sex and Age in Crane
The most populous age groups in Crane are Under 5 Years (126 | 20.0%) for men and 25 to 29 Years (140 | 16.7%) for women.
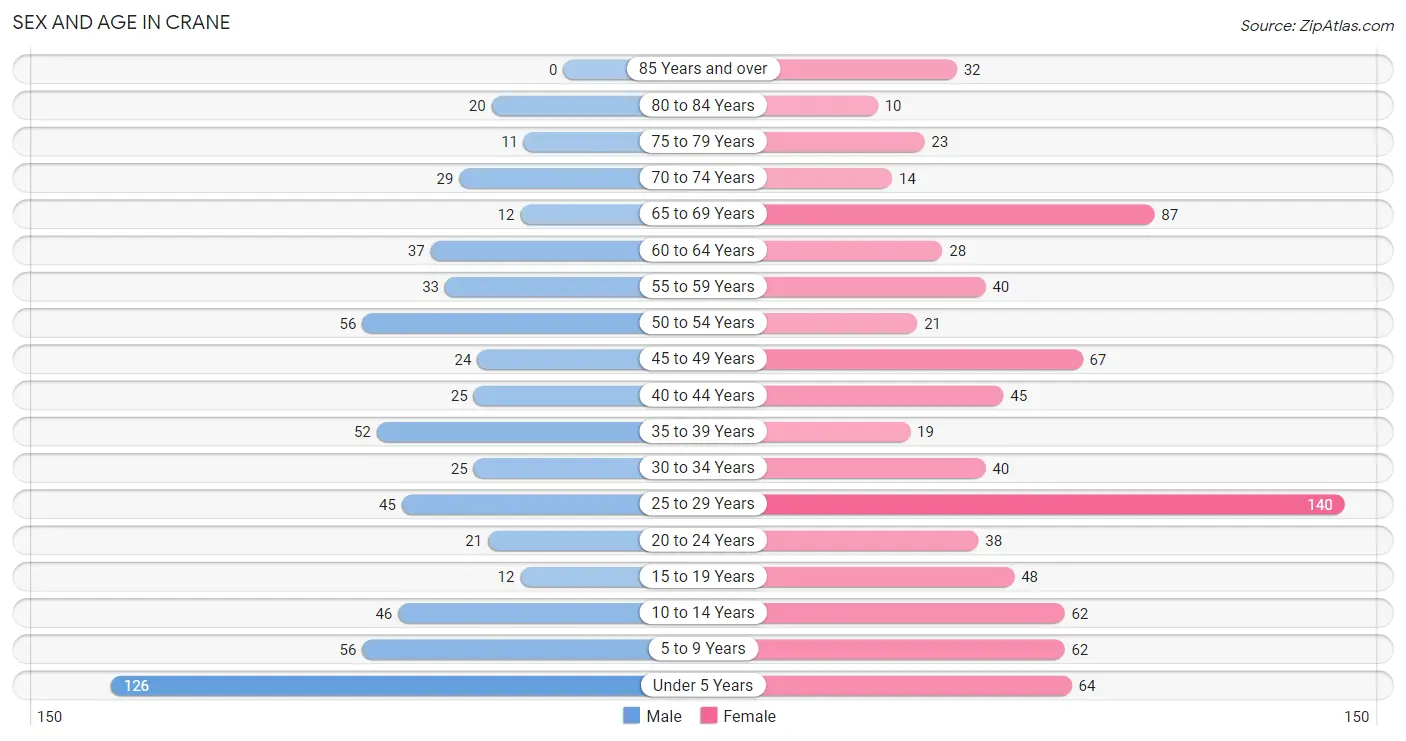
| Age Bracket | Male | Female |
| Under 5 Years | 126 (20.0%) | 64 (7.6%) |
| 5 to 9 Years | 56 (8.9%) | 62 (7.4%) |
| 10 to 14 Years | 46 (7.3%) | 62 (7.4%) |
| 15 to 19 Years | 12 (1.9%) | 48 (5.7%) |
| 20 to 24 Years | 21 (3.3%) | 38 (4.5%) |
| 25 to 29 Years | 45 (7.1%) | 140 (16.7%) |
| 30 to 34 Years | 25 (4.0%) | 40 (4.8%) |
| 35 to 39 Years | 52 (8.3%) | 19 (2.3%) |
| 40 to 44 Years | 25 (4.0%) | 45 (5.4%) |
| 45 to 49 Years | 24 (3.8%) | 67 (8.0%) |
| 50 to 54 Years | 56 (8.9%) | 21 (2.5%) |
| 55 to 59 Years | 33 (5.2%) | 40 (4.8%) |
| 60 to 64 Years | 37 (5.9%) | 28 (3.3%) |
| 65 to 69 Years | 12 (1.9%) | 87 (10.4%) |
| 70 to 74 Years | 29 (4.6%) | 14 (1.7%) |
| 75 to 79 Years | 11 (1.8%) | 23 (2.7%) |
| 80 to 84 Years | 20 (3.2%) | 10 (1.2%) |
| 85 Years and over | 0 (0.0%) | 32 (3.8%) |
| Total | 630 (100.0%) | 840 (100.0%) |
Families and Households in Crane
Median Family Size in Crane
The median family size in Crane is 3.38 persons per family, with single male/father families (16 | 4.5%) accounting for the largest median family size of 3.75 persons per family. On the other hand, single female/mother families (80 | 22.7%) represent the smallest median family size with 2.66 persons per family.
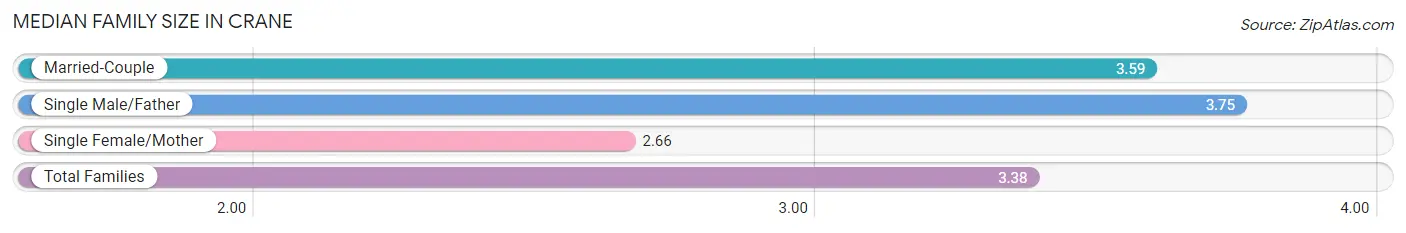
| Family Type | # Families | Family Size |
| Married-Couple | 256 (72.7%) | 3.59 |
| Single Male/Father | 16 (4.5%) | 3.75 |
| Single Female/Mother | 80 (22.7%) | 2.66 |
| Total Families | 352 (100.0%) | 3.38 |
Median Household Size in Crane
The median household size in Crane is 2.82 persons per household, with single male/father households (16 | 3.3%) accounting for the largest median household size of 3.75 persons per household. non-family households (130 | 27.0%) represent the smallest median household size with 1.15 persons per household.
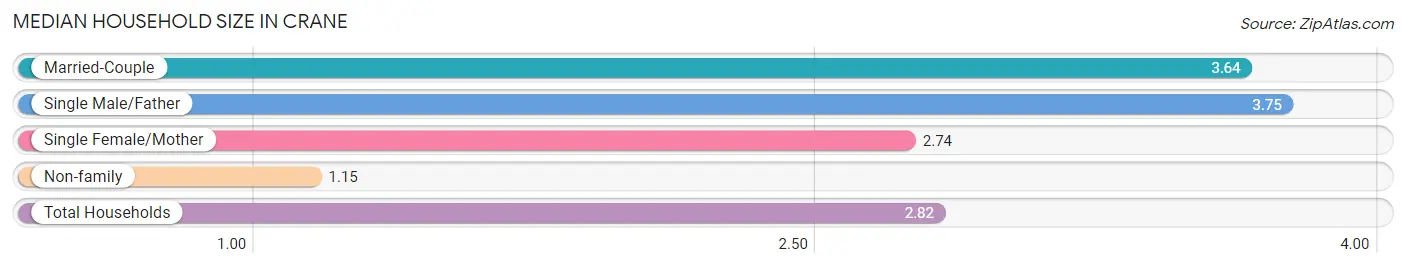
| Household Type | # Households | Household Size |
| Married-Couple | 256 (53.1%) | 3.64 |
| Single Male/Father | 16 (3.3%) | 3.75 |
| Single Female/Mother | 80 (16.6%) | 2.74 |
| Non-family | 130 (27.0%) | 1.15 |
| Total Households | 482 (100.0%) | 2.82 |
Household Size by Marriage Status in Crane
Out of a total of 482 households in Crane, 352 (73.0%) are family households, while 130 (27.0%) are nonfamily households. The most numerous type of family households are 2-person households, comprising 138, and the most common type of nonfamily households are 1-person households, comprising 116.
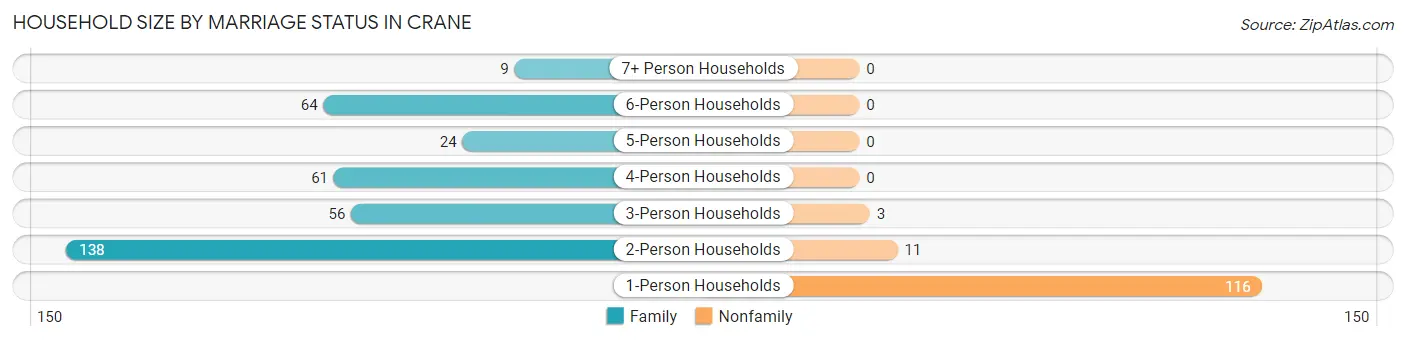
| Household Size | Family Households | Nonfamily Households |
| 1-Person Households | - | 116 (24.1%) |
| 2-Person Households | 138 (28.6%) | 11 (2.3%) |
| 3-Person Households | 56 (11.6%) | 3 (0.6%) |
| 4-Person Households | 61 (12.7%) | 0 (0.0%) |
| 5-Person Households | 24 (5.0%) | 0 (0.0%) |
| 6-Person Households | 64 (13.3%) | 0 (0.0%) |
| 7+ Person Households | 9 (1.9%) | 0 (0.0%) |
| Total | 352 (73.0%) | 130 (27.0%) |
Female Fertility in Crane
Fertility by Age in Crane
Average fertility rate in Crane is 126.0 births per 1,000 women. Women in the age bracket of 20 to 34 years have the highest fertility rate with 229.0 births per 1,000 women. Women in the age bracket of 20 to 34 years acount for 100.0% of all women with births.
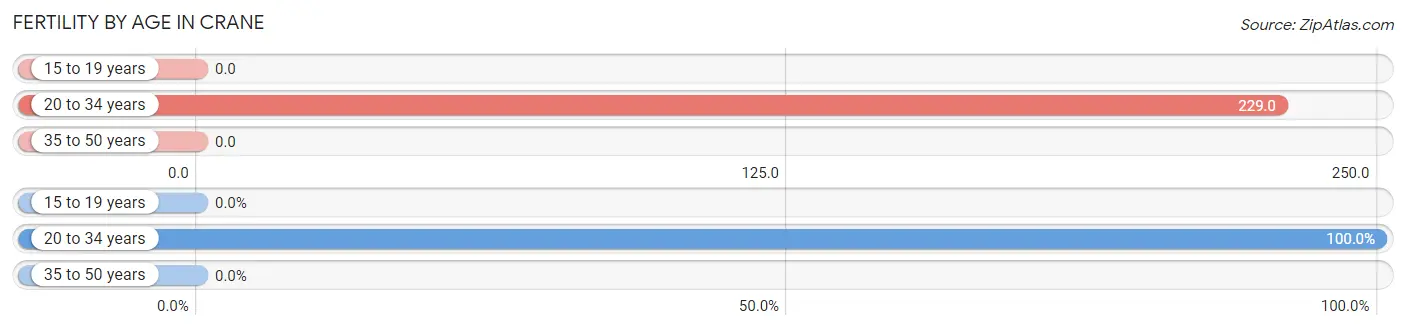
| Age Bracket | Women with Births | Births / 1,000 Women |
| 15 to 19 years | 0 (0.0%) | 0.0 |
| 20 to 34 years | 50 (100.0%) | 229.0 |
| 35 to 50 years | 0 (0.0%) | 0.0 |
| Total | 50 (100.0%) | 126.0 |
Fertility by Age by Marriage Status in Crane
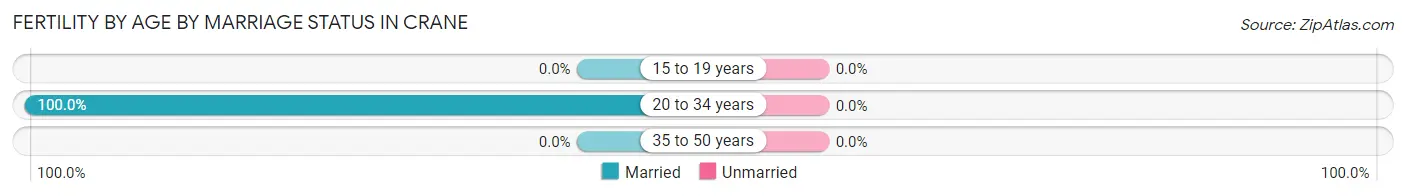
| Age Bracket | Married | Unmarried |
| 15 to 19 years | 0 (0.0%) | 0 (0.0%) |
| 20 to 34 years | 50 (100.0%) | 0 (0.0%) |
| 35 to 50 years | 0 (0.0%) | 0 (0.0%) |
| Total | 50 (100.0%) | 0 (0.0%) |
Fertility by Education in Crane
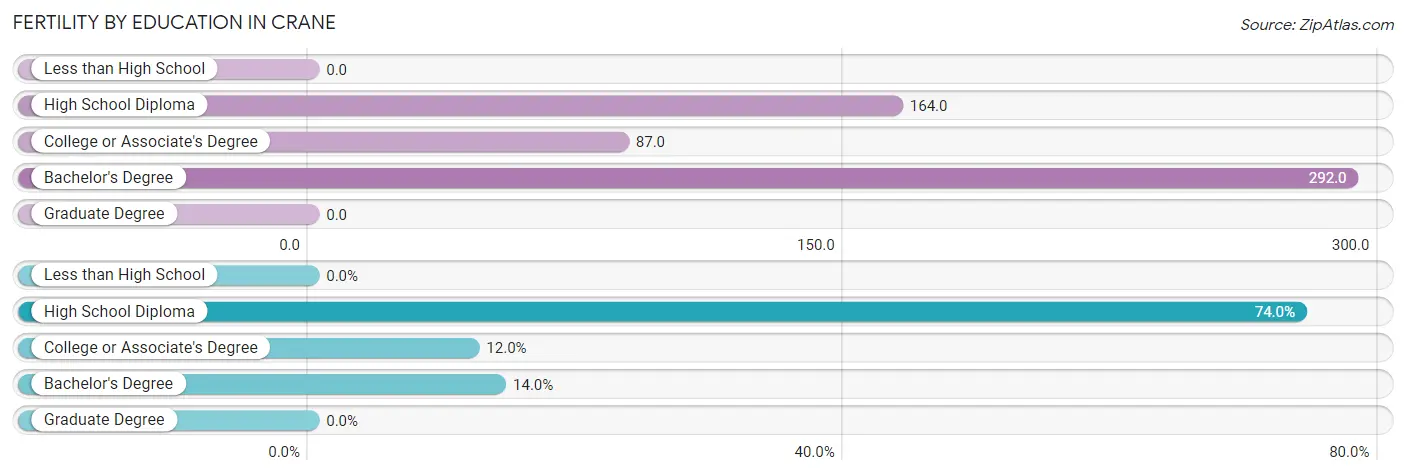
| Educational Attainment | Women with Births | Births / 1,000 Women |
| Less than High School | 0 (0.0%) | 0.0 |
| High School Diploma | 37 (74.0%) | 164.0 |
| College or Associate's Degree | 6 (12.0%) | 87.0 |
| Bachelor's Degree | 7 (14.0%) | 292.0 |
| Graduate Degree | 0 (0.0%) | 0.0 |
| Total | 50 (100.0%) | 126.0 |
Fertility by Education by Marriage Status in Crane
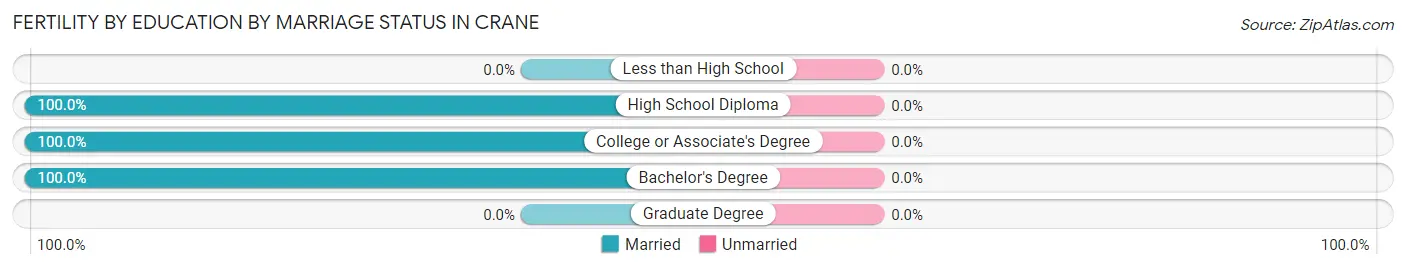
| Educational Attainment | Married | Unmarried |
| Less than High School | 0 (0.0%) | 0 (0.0%) |
| High School Diploma | 37 (100.0%) | 0 (0.0%) |
| College or Associate's Degree | 6 (100.0%) | 0 (0.0%) |
| Bachelor's Degree | 7 (100.0%) | 0 (0.0%) |
| Graduate Degree | 0 (0.0%) | 0 (0.0%) |
| Total | 50 (100.0%) | 0 (0.0%) |
Employment Characteristics in Crane
Employment by Class of Employer in Crane
Among the 511 employed individuals in Crane, private company employees (402 | 78.7%), not-for-profit organizations (47 | 9.2%), and self-employed (not incorporated) (30 | 5.9%) make up the most common classes of employment.
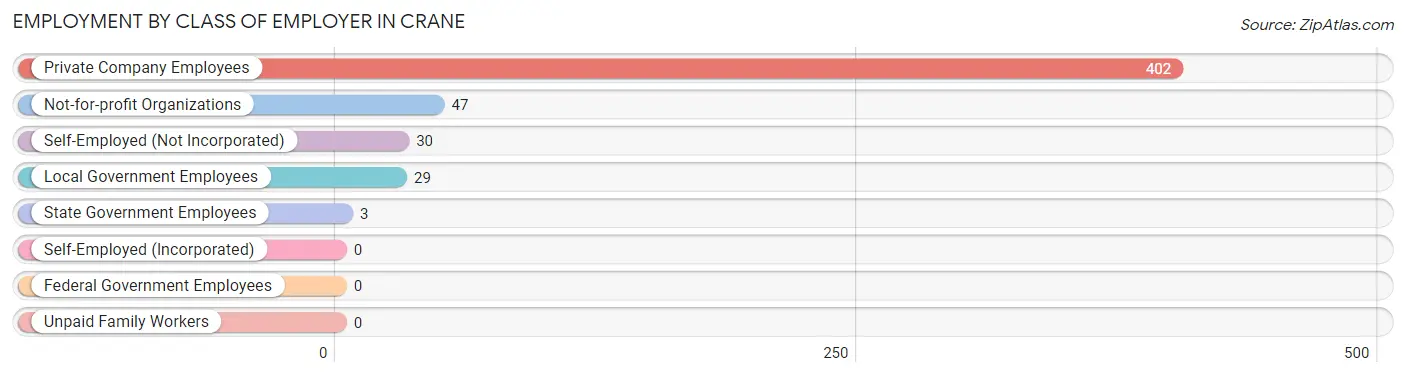
| Employer Class | # Employees | % Employees |
| Private Company Employees | 402 | 78.7% |
| Self-Employed (Incorporated) | 0 | 0.0% |
| Self-Employed (Not Incorporated) | 30 | 5.9% |
| Not-for-profit Organizations | 47 | 9.2% |
| Local Government Employees | 29 | 5.7% |
| State Government Employees | 3 | 0.6% |
| Federal Government Employees | 0 | 0.0% |
| Unpaid Family Workers | 0 | 0.0% |
| Total | 511 | 100.0% |
Employment Status by Age in Crane
According to the labor force statistics for Crane, out of the total population over 16 years of age (1,043), 53.4% or 557 individuals are in the labor force, with 4.3% or 24 of them unemployed. The age group with the highest labor force participation rate is 20 to 24 years, with 100.0% or 59 individuals in the labor force. Within the labor force, the 20 to 24 years age range has the highest percentage of unemployed individuals, with 13.6% or 8 of them being unemployed.
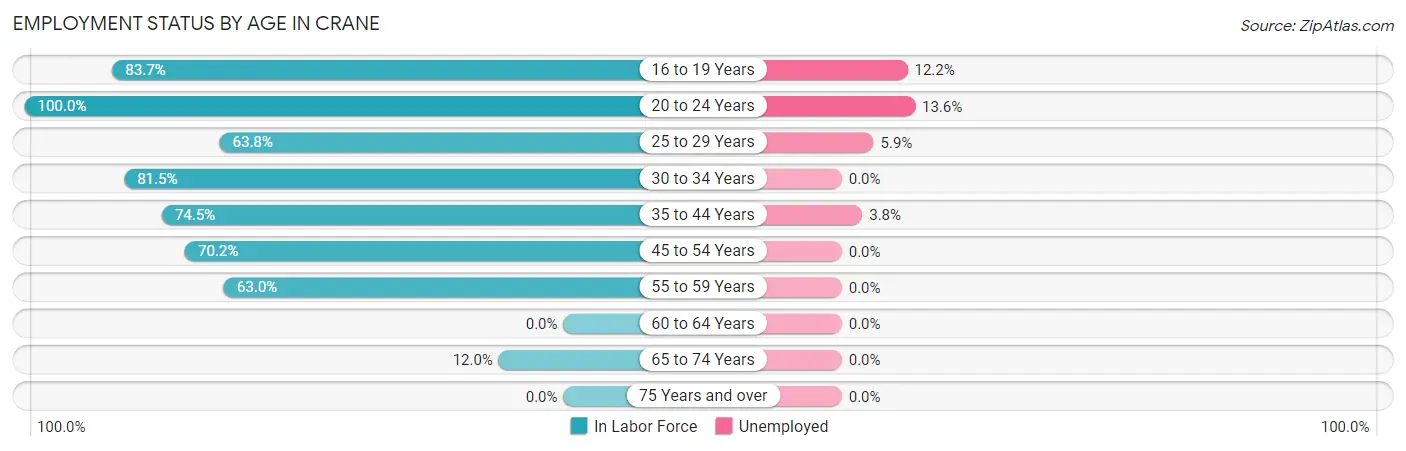
| Age Bracket | In Labor Force | Unemployed |
| 16 to 19 Years | 41 (83.7%) | 5 (12.2%) |
| 20 to 24 Years | 59 (100.0%) | 8 (13.6%) |
| 25 to 29 Years | 118 (63.8%) | 7 (5.9%) |
| 30 to 34 Years | 53 (81.5%) | 0 (0.0%) |
| 35 to 44 Years | 105 (74.5%) | 4 (3.8%) |
| 45 to 54 Years | 118 (70.2%) | 0 (0.0%) |
| 55 to 59 Years | 46 (63.0%) | 0 (0.0%) |
| 60 to 64 Years | 0 (0.0%) | 0 (0.0%) |
| 65 to 74 Years | 17 (12.0%) | 0 (0.0%) |
| 75 Years and over | 0 (0.0%) | 0 (0.0%) |
| Total | 557 (53.4%) | 24 (4.3%) |
Employment Status by Educational Attainment in Crane
According to labor force statistics for Crane, 63.1% of individuals (440) out of the total population between 25 and 64 years of age (697) are in the labor force, with 2.5% or 11 of them being unemployed. The group with the highest labor force participation rate are those with the educational attainment of bachelor's degree or higher, with 88.5% or 69 individuals in the labor force. Within the labor force, individuals with college / associate degree education have the highest percentage of unemployment, with 3.9% or 4 of them being unemployed.
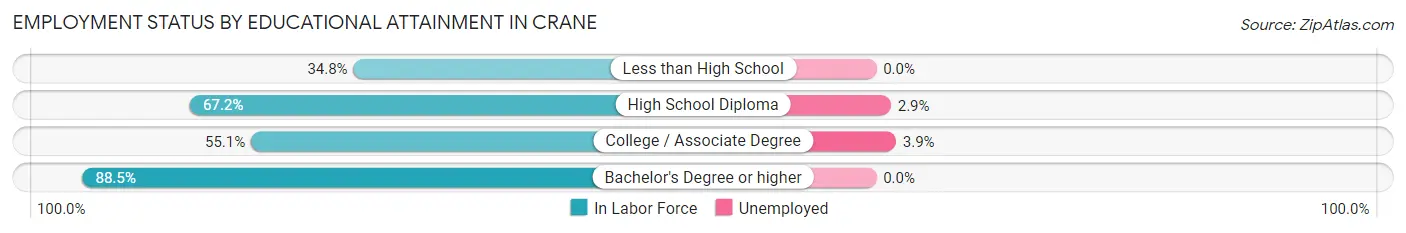
| Educational Attainment | In Labor Force | Unemployed |
| Less than High School | 24 (34.8%) | 0 (0.0%) |
| High School Diploma | 244 (67.2%) | 11 (2.9%) |
| College / Associate Degree | 103 (55.1%) | 7 (3.9%) |
| Bachelor's Degree or higher | 69 (88.5%) | 0 (0.0%) |
| Total | 440 (63.1%) | 17 (2.5%) |
Employment Occupations by Sex in Crane
Management, Business, Science and Arts Occupations
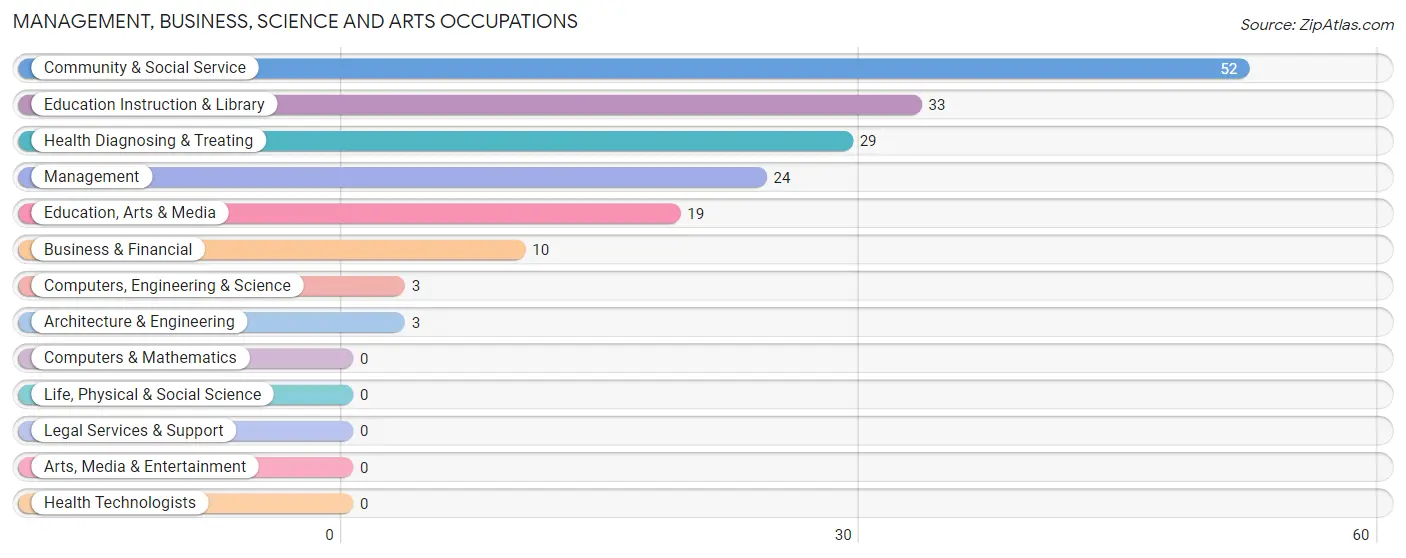
The most common Management, Business, Science and Arts occupations in Crane are Community & Social Service (52 | 9.8%), Education Instruction & Library (33 | 6.2%), Health Diagnosing & Treating (29 | 5.4%), Management (24 | 4.5%), and Education, Arts & Media (19 | 3.6%).
Management, Business, Science and Arts Occupations by Sex
Within the Management, Business, Science and Arts occupations in Crane, the most male-oriented occupations are Computers, Engineering & Science (100.0%), Architecture & Engineering (100.0%), and Health Diagnosing & Treating (69.0%), while the most female-oriented occupations are Business & Financial (100.0%), Community & Social Service (100.0%), and Education, Arts & Media (100.0%).
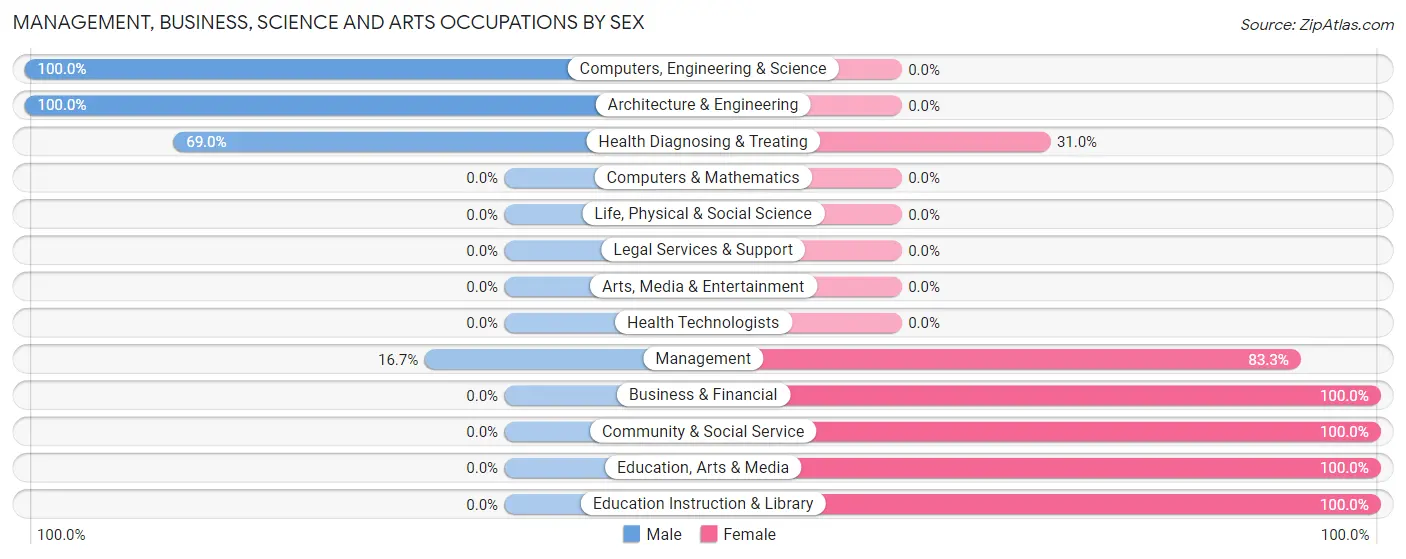
| Occupation | Male | Female |
| Management | 4 (16.7%) | 20 (83.3%) |
| Business & Financial | 0 (0.0%) | 10 (100.0%) |
| Computers, Engineering & Science | 3 (100.0%) | 0 (0.0%) |
| Computers & Mathematics | 0 (0.0%) | 0 (0.0%) |
| Architecture & Engineering | 3 (100.0%) | 0 (0.0%) |
| Life, Physical & Social Science | 0 (0.0%) | 0 (0.0%) |
| Community & Social Service | 0 (0.0%) | 52 (100.0%) |
| Education, Arts & Media | 0 (0.0%) | 19 (100.0%) |
| Legal Services & Support | 0 (0.0%) | 0 (0.0%) |
| Education Instruction & Library | 0 (0.0%) | 33 (100.0%) |
| Arts, Media & Entertainment | 0 (0.0%) | 0 (0.0%) |
| Health Diagnosing & Treating | 20 (69.0%) | 9 (31.0%) |
| Health Technologists | 0 (0.0%) | 0 (0.0%) |
| Total (Category) | 27 (22.9%) | 91 (77.1%) |
| Total (Overall) | 233 (43.7%) | 300 (56.3%) |
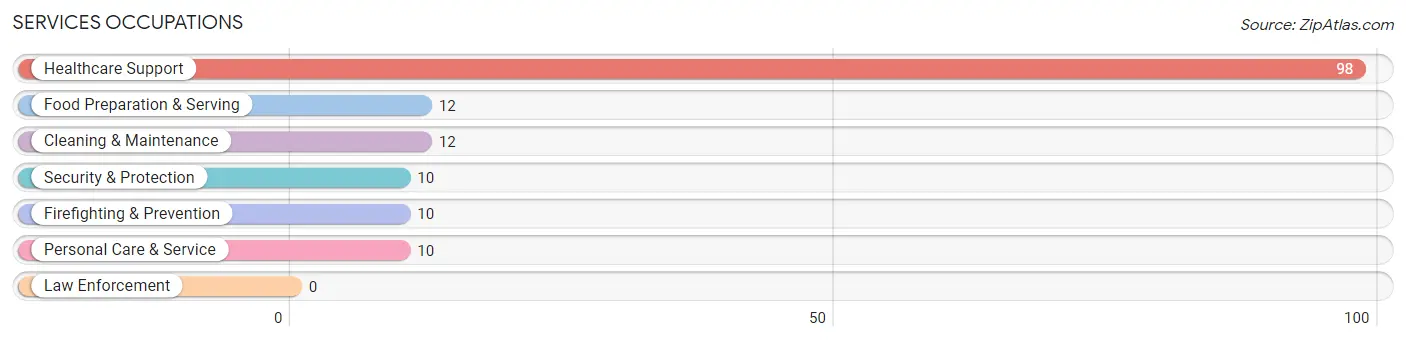
Services Occupations
The most common Services occupations in Crane are Healthcare Support (98 | 18.4%), Food Preparation & Serving (12 | 2.2%), Cleaning & Maintenance (12 | 2.2%), Security & Protection (10 | 1.9%), and Firefighting & Prevention (10 | 1.9%).
Services Occupations by Sex
Within the Services occupations in Crane, the most male-oriented occupations are Security & Protection (100.0%), Firefighting & Prevention (100.0%), and Cleaning & Maintenance (100.0%), while the most female-oriented occupations are Healthcare Support (100.0%), Food Preparation & Serving (91.7%), and Personal Care & Service (60.0%).
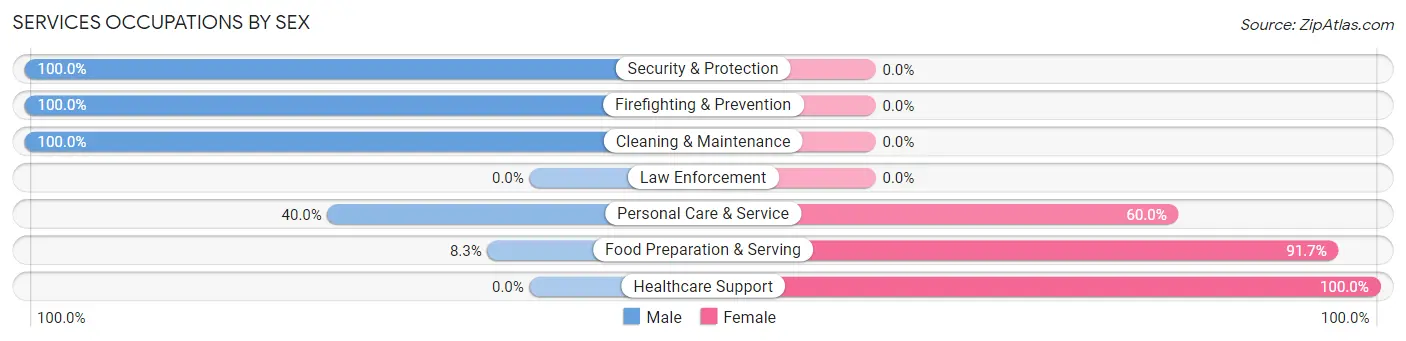
| Occupation | Male | Female |
| Healthcare Support | 0 (0.0%) | 98 (100.0%) |
| Security & Protection | 10 (100.0%) | 0 (0.0%) |
| Firefighting & Prevention | 10 (100.0%) | 0 (0.0%) |
| Law Enforcement | 0 (0.0%) | 0 (0.0%) |
| Food Preparation & Serving | 1 (8.3%) | 11 (91.7%) |
| Cleaning & Maintenance | 12 (100.0%) | 0 (0.0%) |
| Personal Care & Service | 4 (40.0%) | 6 (60.0%) |
| Total (Category) | 27 (19.0%) | 115 (81.0%) |
| Total (Overall) | 233 (43.7%) | 300 (56.3%) |
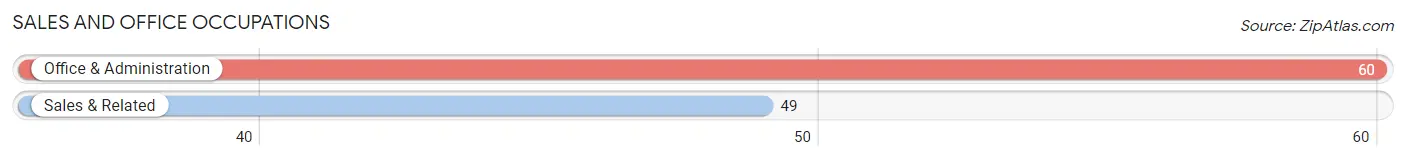
Sales and Office Occupations
The most common Sales and Office occupations in Crane are Office & Administration (60 | 11.3%), and Sales & Related (49 | 9.2%).
Sales and Office Occupations by Sex
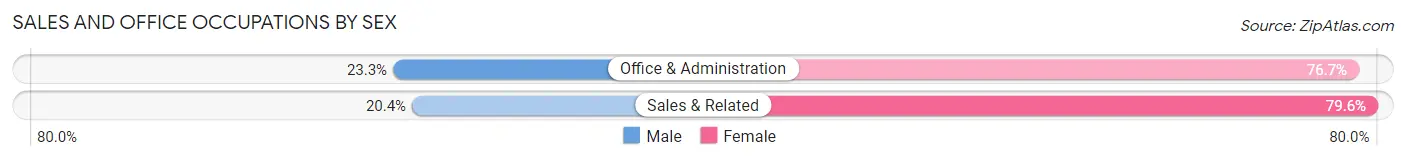
| Occupation | Male | Female |
| Sales & Related | 10 (20.4%) | 39 (79.6%) |
| Office & Administration | 14 (23.3%) | 46 (76.7%) |
| Total (Category) | 24 (22.0%) | 85 (78.0%) |
| Total (Overall) | 233 (43.7%) | 300 (56.3%) |
Natural Resources, Construction and Maintenance Occupations
The most common Natural Resources, Construction and Maintenance occupations in Crane are Construction & Extraction (32 | 6.0%), Installation, Maintenance & Repair (30 | 5.6%), and Farming, Fishing & Forestry (5 | 0.9%).
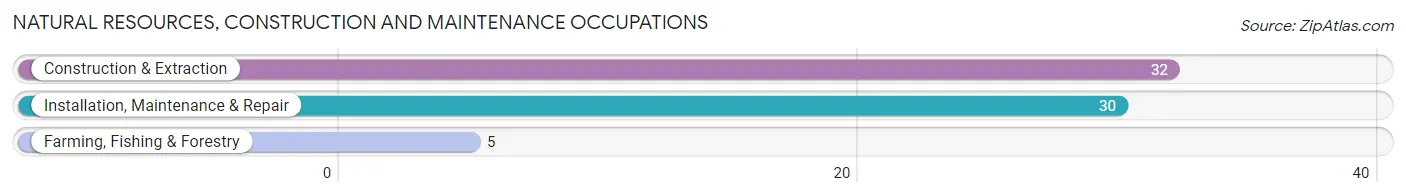
Natural Resources, Construction and Maintenance Occupations by Sex

| Occupation | Male | Female |
| Farming, Fishing & Forestry | 5 (100.0%) | 0 (0.0%) |
| Construction & Extraction | 32 (100.0%) | 0 (0.0%) |
| Installation, Maintenance & Repair | 30 (100.0%) | 0 (0.0%) |
| Total (Category) | 67 (100.0%) | 0 (0.0%) |
| Total (Overall) | 233 (43.7%) | 300 (56.3%) |
Production, Transportation and Moving Occupations
The most common Production, Transportation and Moving occupations in Crane are Production (65 | 12.2%), Transportation (25 | 4.7%), and Material Moving (7 | 1.3%).
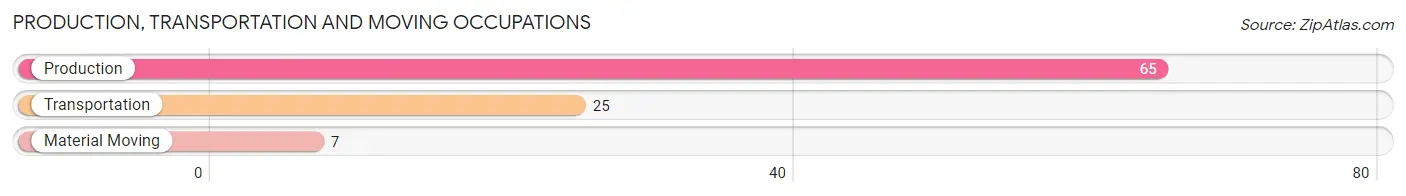
Production, Transportation and Moving Occupations by Sex
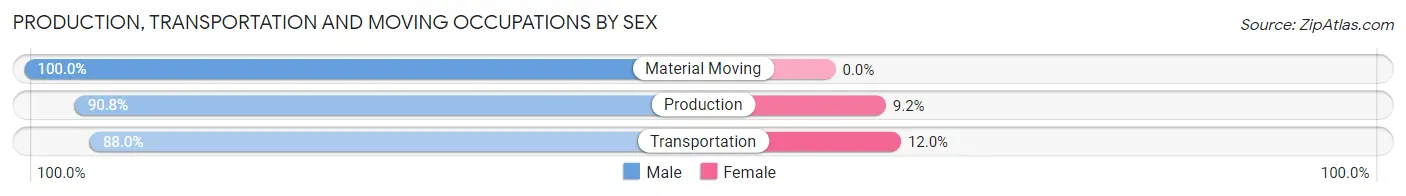
| Occupation | Male | Female |
| Production | 59 (90.8%) | 6 (9.2%) |
| Transportation | 22 (88.0%) | 3 (12.0%) |
| Material Moving | 7 (100.0%) | 0 (0.0%) |
| Total (Category) | 88 (90.7%) | 9 (9.3%) |
| Total (Overall) | 233 (43.7%) | 300 (56.3%) |
Employment Industries by Sex in Crane
Employment Industries in Crane
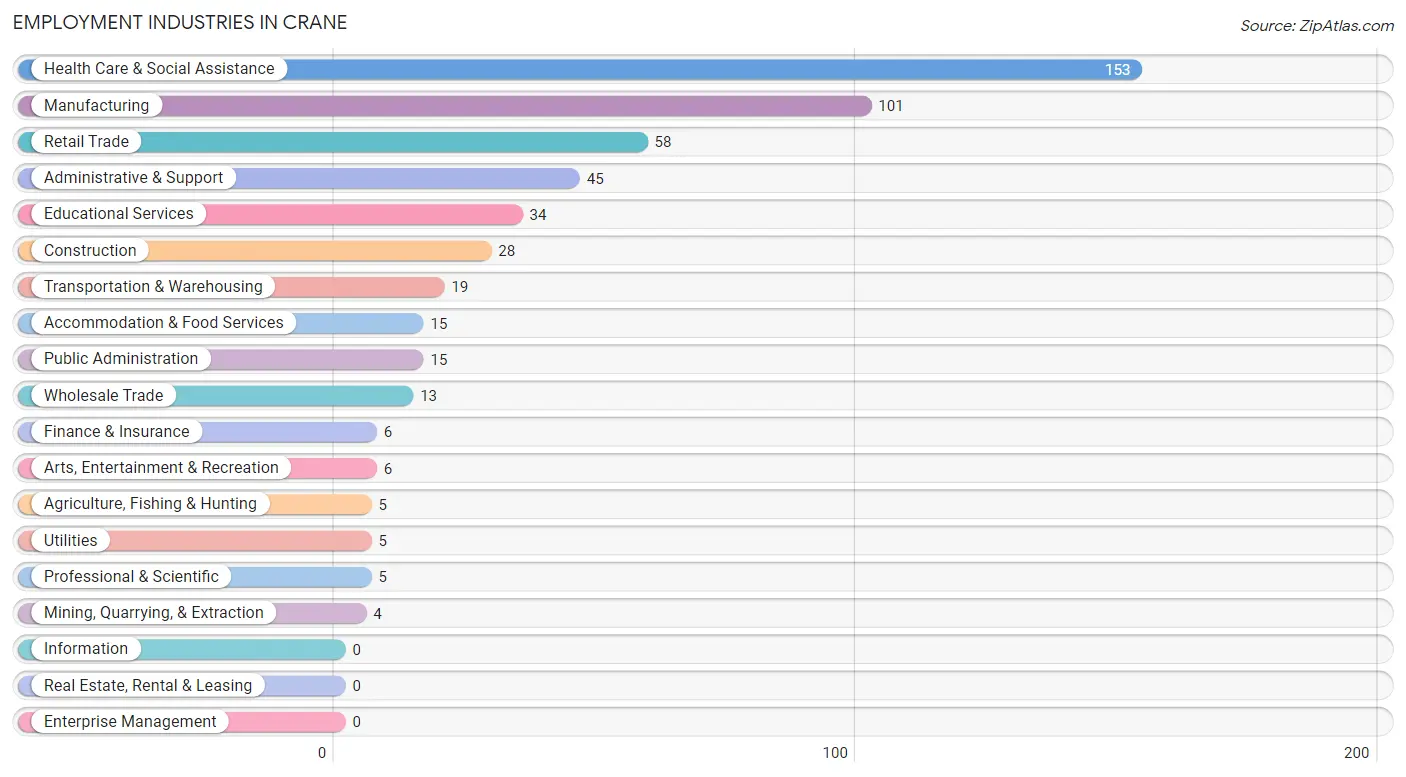
The major employment industries in Crane include Health Care & Social Assistance (153 | 28.7%), Manufacturing (101 | 19.0%), Retail Trade (58 | 10.9%), Administrative & Support (45 | 8.4%), and Educational Services (34 | 6.4%).
Employment Industries by Sex in Crane
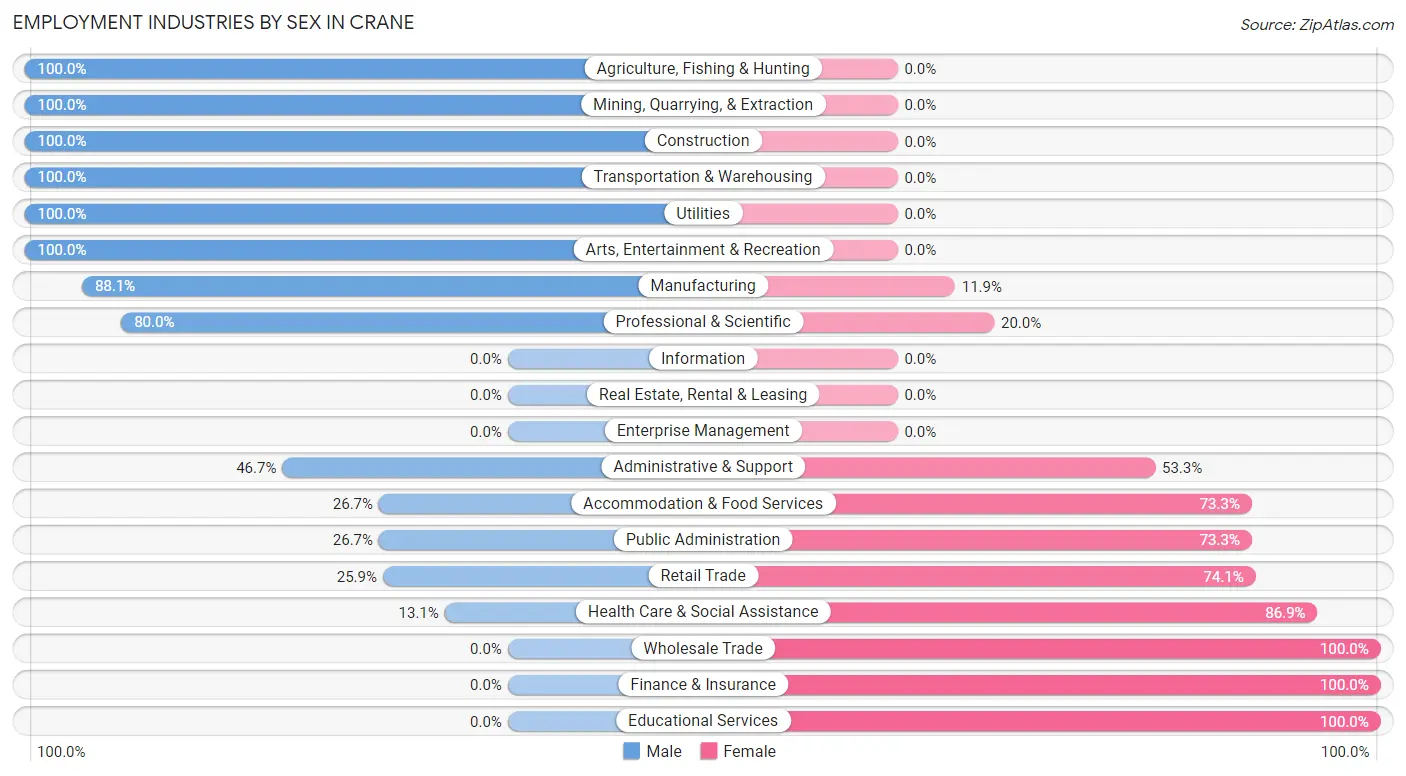
The Crane industries that see more men than women are Agriculture, Fishing & Hunting (100.0%), Mining, Quarrying, & Extraction (100.0%), and Construction (100.0%), whereas the industries that tend to have a higher number of women are Wholesale Trade (100.0%), Finance & Insurance (100.0%), and Educational Services (100.0%).
| Industry | Male | Female |
| Agriculture, Fishing & Hunting | 5 (100.0%) | 0 (0.0%) |
| Mining, Quarrying, & Extraction | 4 (100.0%) | 0 (0.0%) |
| Construction | 28 (100.0%) | 0 (0.0%) |
| Manufacturing | 89 (88.1%) | 12 (11.9%) |
| Wholesale Trade | 0 (0.0%) | 13 (100.0%) |
| Retail Trade | 15 (25.9%) | 43 (74.1%) |
| Transportation & Warehousing | 19 (100.0%) | 0 (0.0%) |
| Utilities | 5 (100.0%) | 0 (0.0%) |
| Information | 0 (0.0%) | 0 (0.0%) |
| Finance & Insurance | 0 (0.0%) | 6 (100.0%) |
| Real Estate, Rental & Leasing | 0 (0.0%) | 0 (0.0%) |
| Professional & Scientific | 4 (80.0%) | 1 (20.0%) |
| Enterprise Management | 0 (0.0%) | 0 (0.0%) |
| Administrative & Support | 21 (46.7%) | 24 (53.3%) |
| Educational Services | 0 (0.0%) | 34 (100.0%) |
| Health Care & Social Assistance | 20 (13.1%) | 133 (86.9%) |
| Arts, Entertainment & Recreation | 6 (100.0%) | 0 (0.0%) |
| Accommodation & Food Services | 4 (26.7%) | 11 (73.3%) |
| Public Administration | 4 (26.7%) | 11 (73.3%) |
| Total | 233 (43.7%) | 300 (56.3%) |
Education in Crane
School Enrollment in Crane
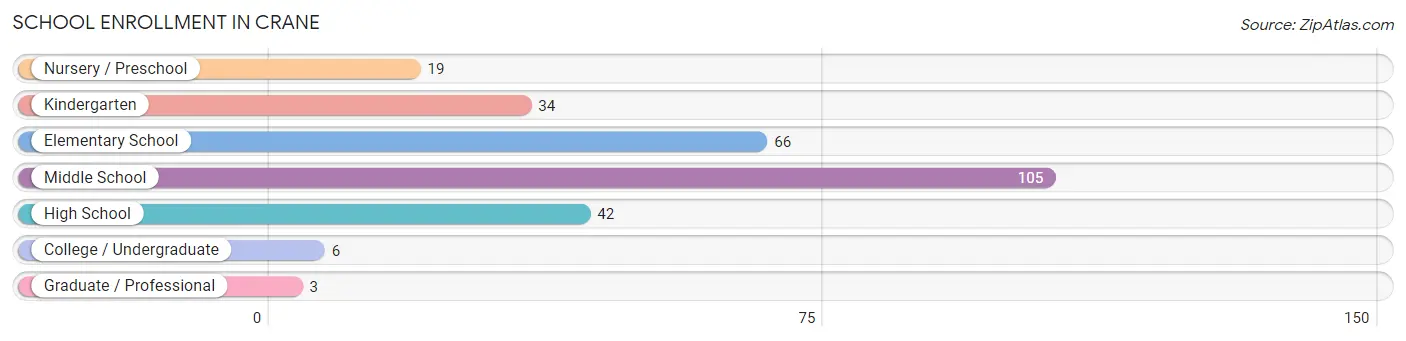
The most common levels of schooling among the 275 students in Crane are middle school (105 | 38.2%), elementary school (66 | 24.0%), and high school (42 | 15.3%).
| School Level | # Students | % Students |
| Nursery / Preschool | 19 | 6.9% |
| Kindergarten | 34 | 12.4% |
| Elementary School | 66 | 24.0% |
| Middle School | 105 | 38.2% |
| High School | 42 | 15.3% |
| College / Undergraduate | 6 | 2.2% |
| Graduate / Professional | 3 | 1.1% |
| Total | 275 | 100.0% |
School Enrollment by Age by Funding Source in Crane
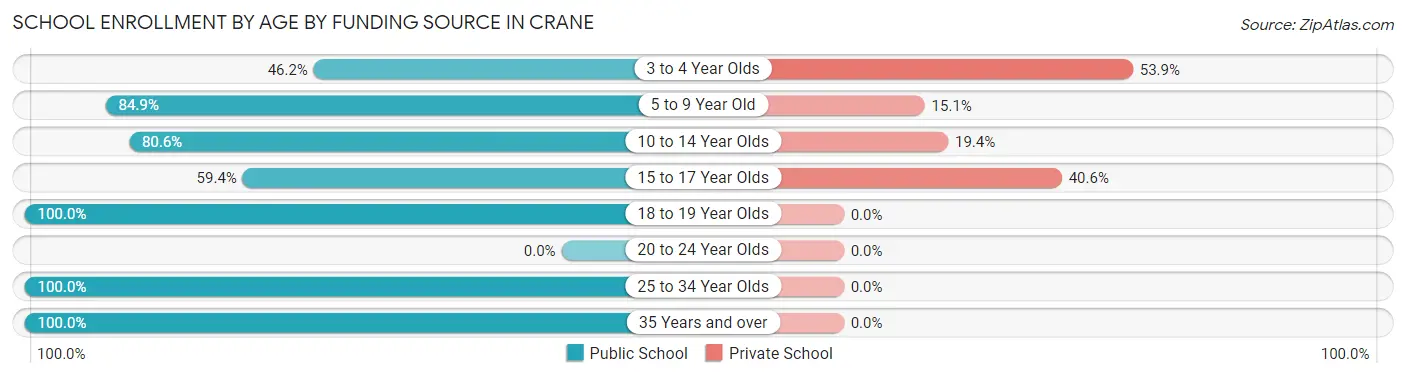
Out of a total of 275 students who are enrolled in schools in Crane, 57 (20.7%) attend a private institution, while the remaining 218 (79.3%) are enrolled in public schools. The age group of 3 to 4 year olds has the highest likelihood of being enrolled in private schools, with 7 (53.8% in the age bracket) enrolled. Conversely, the age group of 18 to 19 year olds has the lowest likelihood of being enrolled in a private school, with 7 (100.0% in the age bracket) attending a public institution.
| Age Bracket | Public School | Private School |
| 3 to 4 Year Olds | 6 (46.2%) | 7 (53.8%) |
| 5 to 9 Year Old | 90 (84.9%) | 16 (15.1%) |
| 10 to 14 Year Olds | 87 (80.6%) | 21 (19.4%) |
| 15 to 17 Year Olds | 19 (59.4%) | 13 (40.6%) |
| 18 to 19 Year Olds | 7 (100.0%) | 0 (0.0%) |
| 20 to 24 Year Olds | 0 (0.0%) | 0 (0.0%) |
| 25 to 34 Year Olds | 3 (100.0%) | 0 (0.0%) |
| 35 Years and over | 6 (100.0%) | 0 (0.0%) |
| Total | 218 (79.3%) | 57 (20.7%) |
Educational Attainment by Field of Study in Crane
Business (24 | 23.8%), education (20 | 19.8%), psychology (12 | 11.9%), arts & humanities (12 | 11.9%), and engineering (6 | 5.9%) are the most common fields of study among 101 individuals in Crane who have obtained a bachelor's degree or higher.
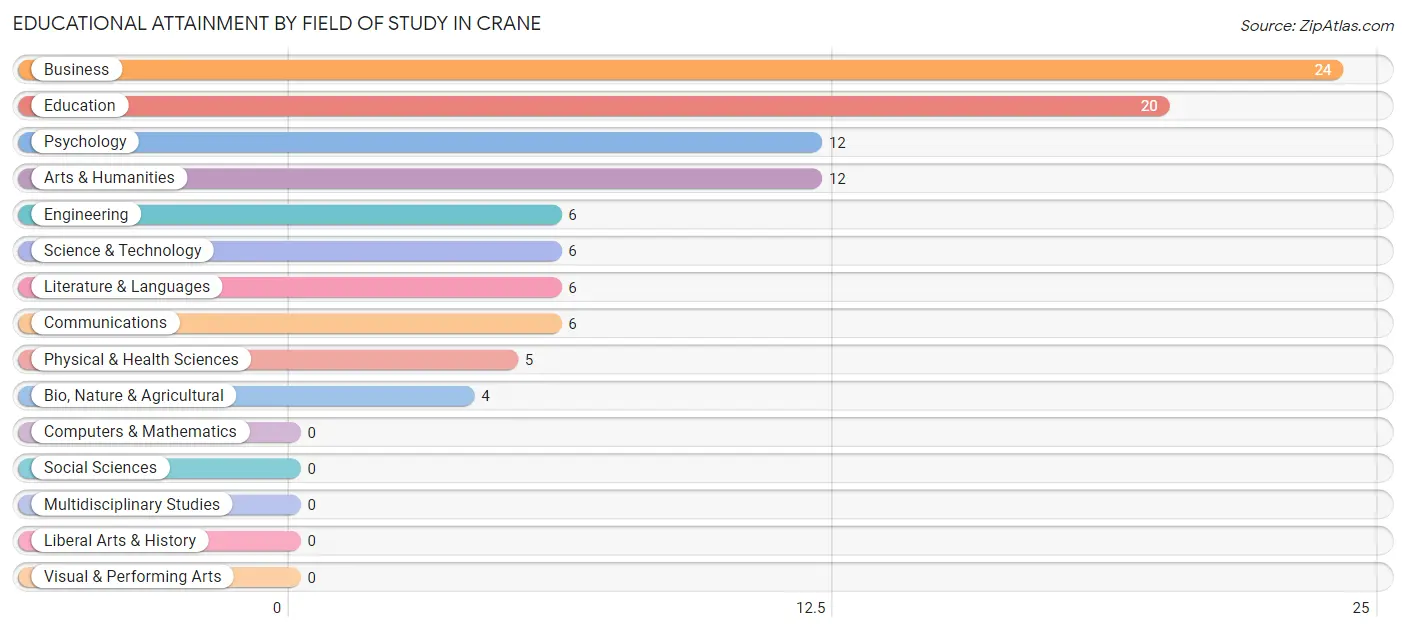
| Field of Study | # Graduates | % Graduates |
| Computers & Mathematics | 0 | 0.0% |
| Bio, Nature & Agricultural | 4 | 4.0% |
| Physical & Health Sciences | 5 | 5.0% |
| Psychology | 12 | 11.9% |
| Social Sciences | 0 | 0.0% |
| Engineering | 6 | 5.9% |
| Multidisciplinary Studies | 0 | 0.0% |
| Science & Technology | 6 | 5.9% |
| Business | 24 | 23.8% |
| Education | 20 | 19.8% |
| Literature & Languages | 6 | 5.9% |
| Liberal Arts & History | 0 | 0.0% |
| Visual & Performing Arts | 0 | 0.0% |
| Communications | 6 | 5.9% |
| Arts & Humanities | 12 | 11.9% |
| Total | 101 | 100.0% |
Transportation & Commute in Crane
Vehicle Availability by Sex in Crane
The most prevalent vehicle ownership categories in Crane are males with 2 vehicles (129, accounting for 57.1%) and females with 2 vehicles (147, making up 46.4%).
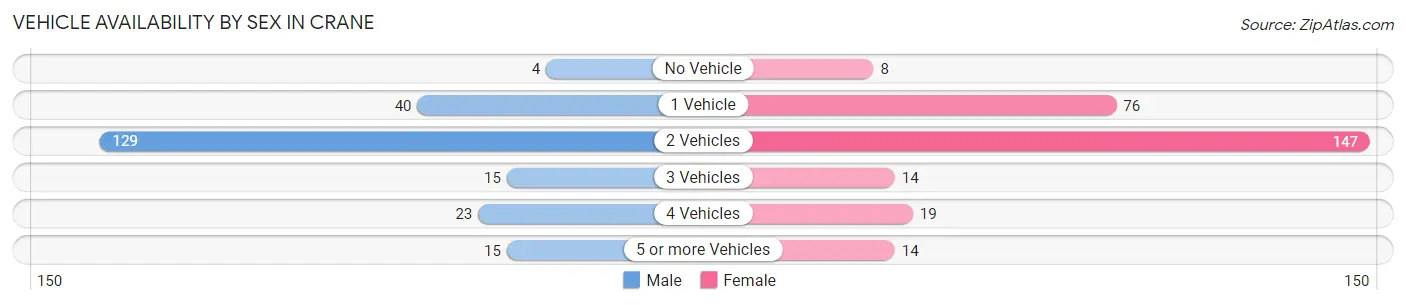
| Vehicles Available | Male | Female |
| No Vehicle | 4 (1.8%) | 8 (2.9%) |
| 1 Vehicle | 40 (17.7%) | 76 (27.3%) |
| 2 Vehicles | 129 (57.1%) | 147 (52.9%) |
| 3 Vehicles | 15 (6.6%) | 14 (5.0%) |
| 4 Vehicles | 23 (10.2%) | 19 (6.8%) |
| 5 or more Vehicles | 15 (6.6%) | 14 (5.0%) |
| Total | 226 (100.0%) | 278 (100.0%) |
Commute Time in Crane
The most frequently occuring commute durations in Crane are 45 to 59 minutes (120 commuters, 25.2%), 5 to 9 minutes (97 commuters, 20.4%), and less than 5 minutes (49 commuters, 10.3%).
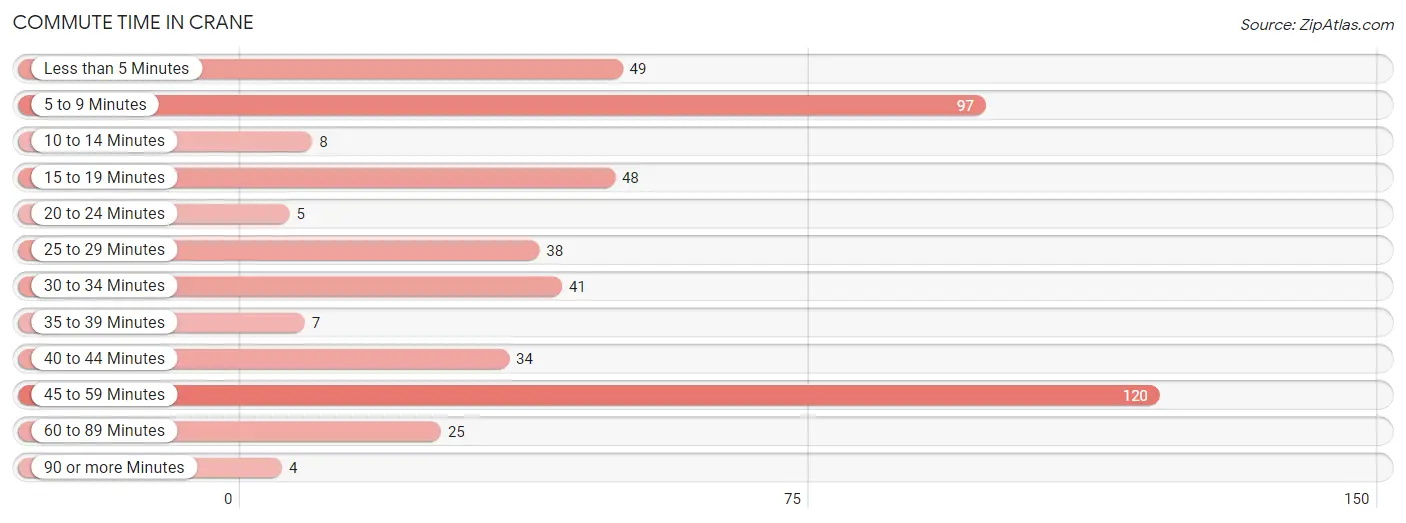
| Commute Time | # Commuters | % Commuters |
| Less than 5 Minutes | 49 | 10.3% |
| 5 to 9 Minutes | 97 | 20.4% |
| 10 to 14 Minutes | 8 | 1.7% |
| 15 to 19 Minutes | 48 | 10.1% |
| 20 to 24 Minutes | 5 | 1.1% |
| 25 to 29 Minutes | 38 | 8.0% |
| 30 to 34 Minutes | 41 | 8.6% |
| 35 to 39 Minutes | 7 | 1.5% |
| 40 to 44 Minutes | 34 | 7.1% |
| 45 to 59 Minutes | 120 | 25.2% |
| 60 to 89 Minutes | 25 | 5.2% |
| 90 or more Minutes | 4 | 0.8% |
Commute Time by Sex in Crane
The most common commute times in Crane are 45 to 59 minutes (85 commuters, 38.6%) for males and 5 to 9 minutes (80 commuters, 31.2%) for females.
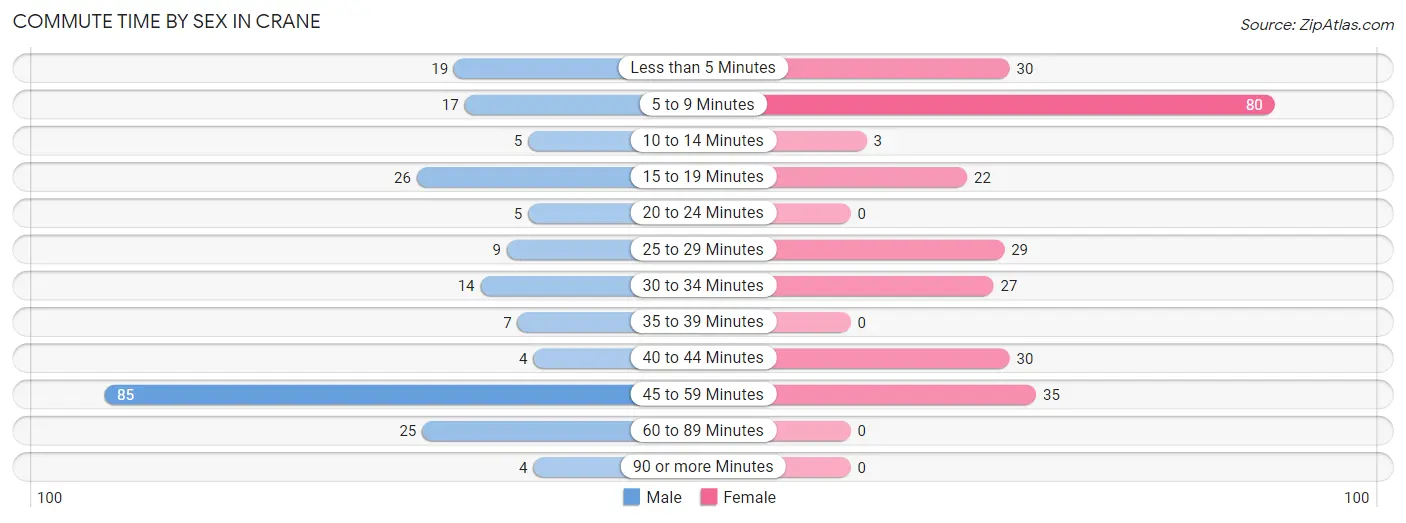
| Commute Time | Male | Female |
| Less than 5 Minutes | 19 (8.6%) | 30 (11.7%) |
| 5 to 9 Minutes | 17 (7.7%) | 80 (31.2%) |
| 10 to 14 Minutes | 5 (2.3%) | 3 (1.2%) |
| 15 to 19 Minutes | 26 (11.8%) | 22 (8.6%) |
| 20 to 24 Minutes | 5 (2.3%) | 0 (0.0%) |
| 25 to 29 Minutes | 9 (4.1%) | 29 (11.3%) |
| 30 to 34 Minutes | 14 (6.4%) | 27 (10.5%) |
| 35 to 39 Minutes | 7 (3.2%) | 0 (0.0%) |
| 40 to 44 Minutes | 4 (1.8%) | 30 (11.7%) |
| 45 to 59 Minutes | 85 (38.6%) | 35 (13.7%) |
| 60 to 89 Minutes | 25 (11.4%) | 0 (0.0%) |
| 90 or more Minutes | 4 (1.8%) | 0 (0.0%) |
Time of Departure to Work by Sex in Crane
The most frequent times of departure to work in Crane are 6:00 AM to 6:29 AM (47, 21.4%) for males and 4:00 PM to 11:59 PM (72, 28.1%) for females.
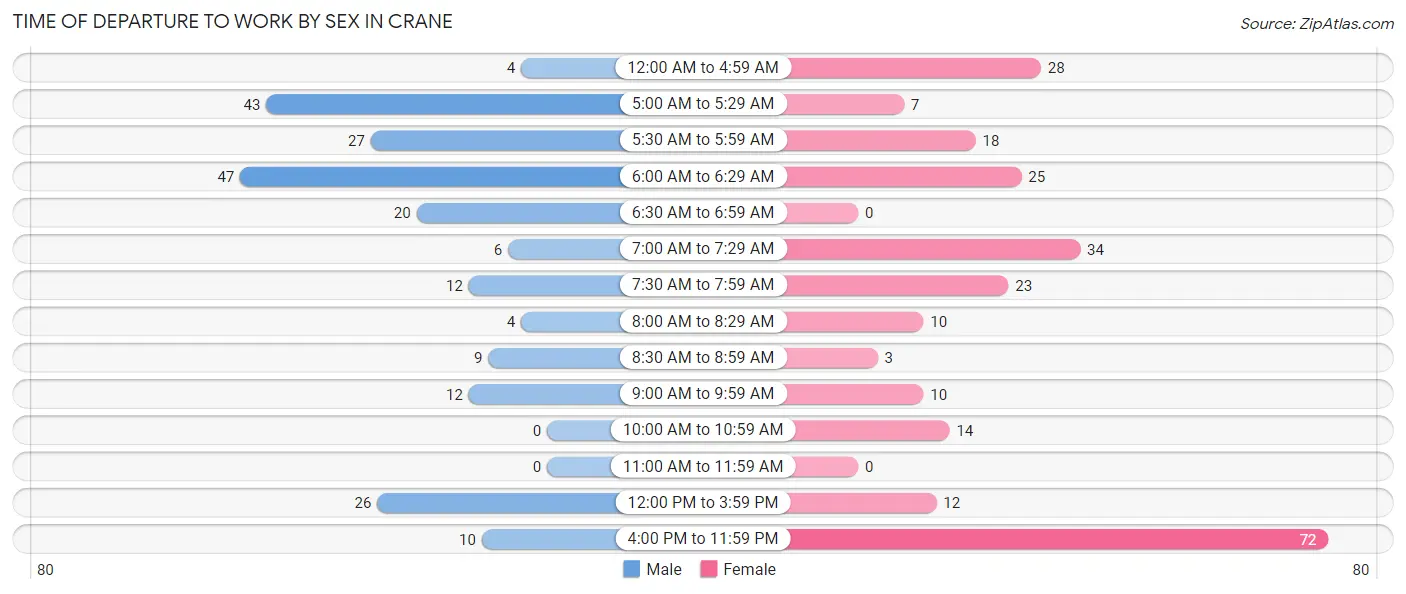
| Time of Departure | Male | Female |
| 12:00 AM to 4:59 AM | 4 (1.8%) | 28 (10.9%) |
| 5:00 AM to 5:29 AM | 43 (19.6%) | 7 (2.7%) |
| 5:30 AM to 5:59 AM | 27 (12.3%) | 18 (7.0%) |
| 6:00 AM to 6:29 AM | 47 (21.4%) | 25 (9.8%) |
| 6:30 AM to 6:59 AM | 20 (9.1%) | 0 (0.0%) |
| 7:00 AM to 7:29 AM | 6 (2.7%) | 34 (13.3%) |
| 7:30 AM to 7:59 AM | 12 (5.4%) | 23 (9.0%) |
| 8:00 AM to 8:29 AM | 4 (1.8%) | 10 (3.9%) |
| 8:30 AM to 8:59 AM | 9 (4.1%) | 3 (1.2%) |
| 9:00 AM to 9:59 AM | 12 (5.4%) | 10 (3.9%) |
| 10:00 AM to 10:59 AM | 0 (0.0%) | 14 (5.5%) |
| 11:00 AM to 11:59 AM | 0 (0.0%) | 0 (0.0%) |
| 12:00 PM to 3:59 PM | 26 (11.8%) | 12 (4.7%) |
| 4:00 PM to 11:59 PM | 10 (4.5%) | 72 (28.1%) |
| Total | 220 (100.0%) | 256 (100.0%) |
Housing Occupancy in Crane
Occupancy by Ownership in Crane
Of the total 482 dwellings in Crane, owner-occupied units account for 298 (61.8%), while renter-occupied units make up 184 (38.2%).
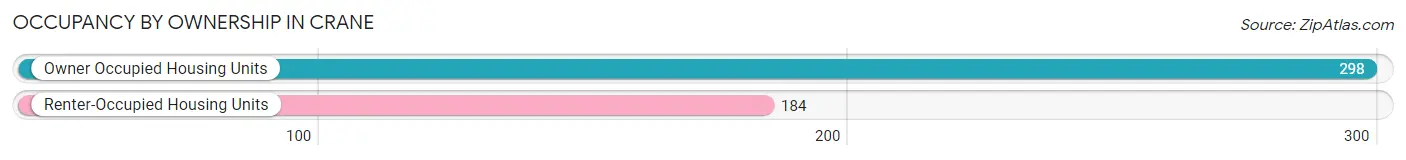
| Occupancy | # Housing Units | % Housing Units |
| Owner Occupied Housing Units | 298 | 61.8% |
| Renter-Occupied Housing Units | 184 | 38.2% |
| Total Occupied Housing Units | 482 | 100.0% |
Occupancy by Household Size in Crane
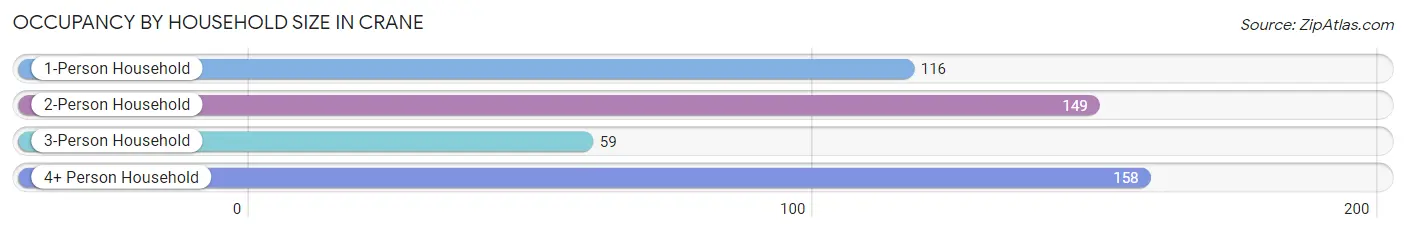
| Household Size | # Housing Units | % Housing Units |
| 1-Person Household | 116 | 24.1% |
| 2-Person Household | 149 | 30.9% |
| 3-Person Household | 59 | 12.2% |
| 4+ Person Household | 158 | 32.8% |
| Total Housing Units | 482 | 100.0% |
Occupancy by Ownership by Household Size in Crane
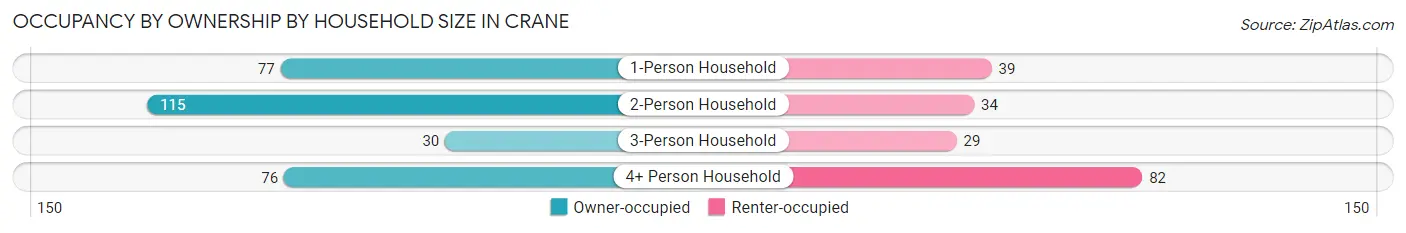
| Household Size | Owner-occupied | Renter-occupied |
| 1-Person Household | 77 (66.4%) | 39 (33.6%) |
| 2-Person Household | 115 (77.2%) | 34 (22.8%) |
| 3-Person Household | 30 (50.8%) | 29 (49.1%) |
| 4+ Person Household | 76 (48.1%) | 82 (51.9%) |
| Total Housing Units | 298 (61.8%) | 184 (38.2%) |
Occupancy by Educational Attainment in Crane
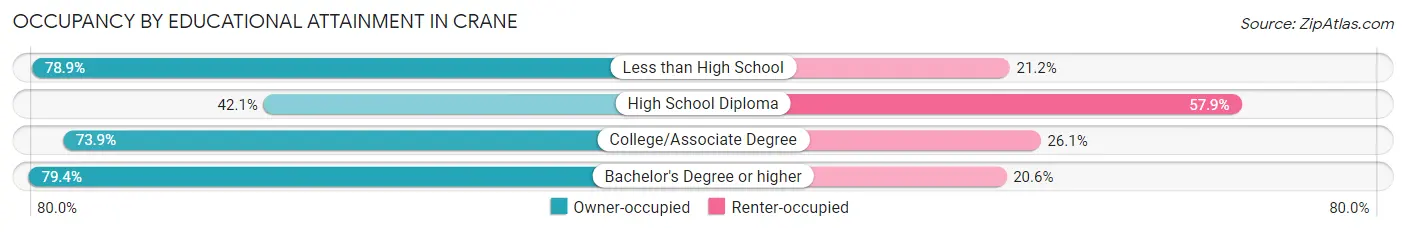
| Household Size | Owner-occupied | Renter-occupied |
| Less than High School | 41 (78.8%) | 11 (21.1%) |
| High School Diploma | 85 (42.1%) | 117 (57.9%) |
| College/Associate Degree | 122 (73.9%) | 43 (26.1%) |
| Bachelor's Degree or higher | 50 (79.4%) | 13 (20.6%) |
Occupancy by Age of Householder in Crane
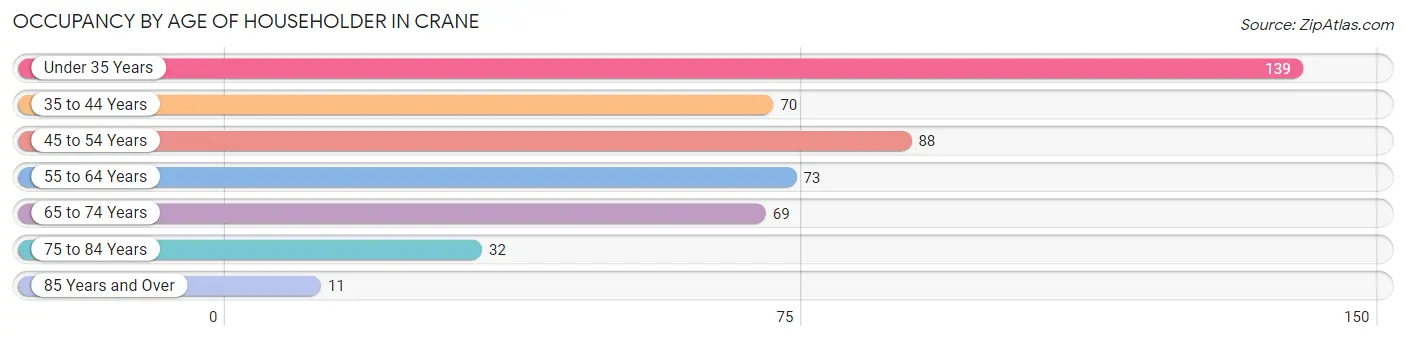
| Age Bracket | # Households | % Households |
| Under 35 Years | 139 | 28.8% |
| 35 to 44 Years | 70 | 14.5% |
| 45 to 54 Years | 88 | 18.3% |
| 55 to 64 Years | 73 | 15.1% |
| 65 to 74 Years | 69 | 14.3% |
| 75 to 84 Years | 32 | 6.6% |
| 85 Years and Over | 11 | 2.3% |
| Total | 482 | 100.0% |
Housing Finances in Crane
Median Income by Occupancy in Crane
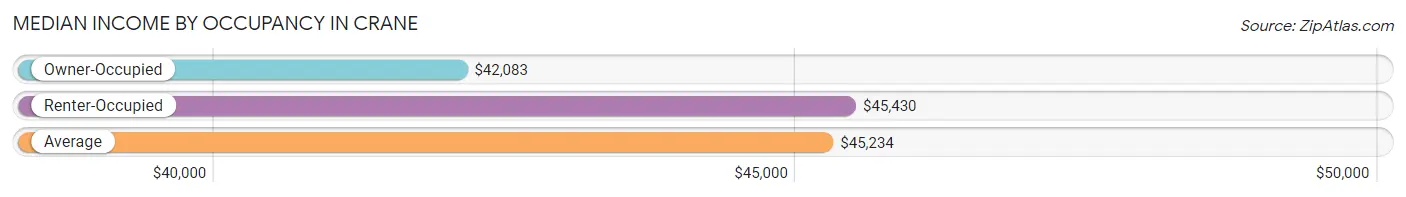
| Occupancy Type | # Households | Median Income |
| Owner-Occupied | 298 (61.8%) | $42,083 |
| Renter-Occupied | 184 (38.2%) | $45,430 |
| Average | 482 (100.0%) | $45,234 |
Occupancy by Householder Income Bracket in Crane
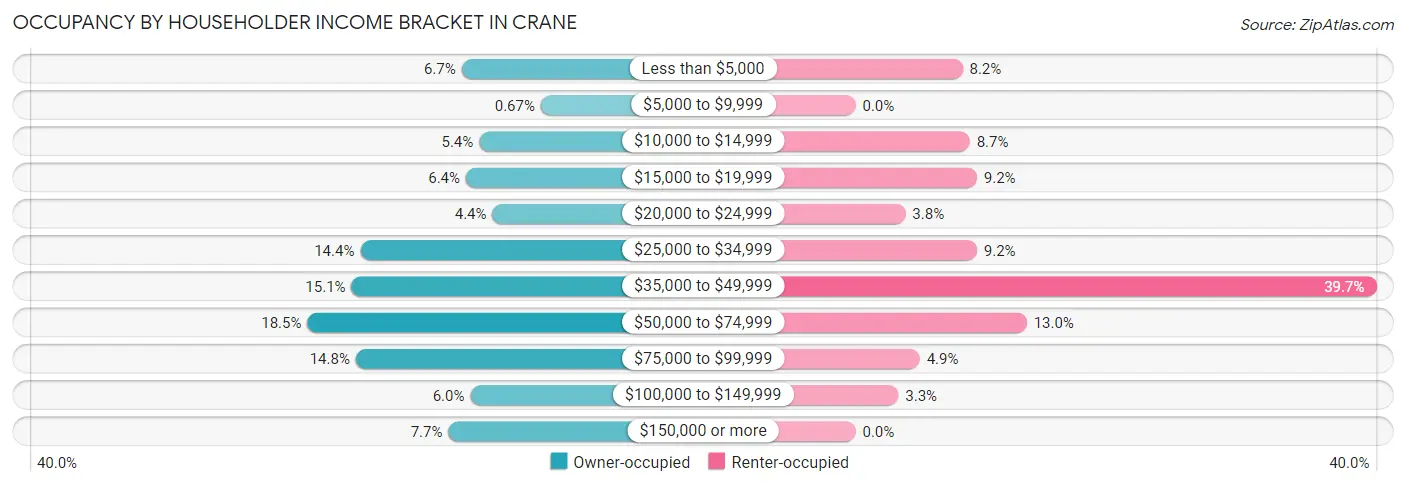
| Income Bracket | Owner-occupied | Renter-occupied |
| Less than $5,000 | 20 (6.7%) | 15 (8.2%) |
| $5,000 to $9,999 | 2 (0.7%) | 0 (0.0%) |
| $10,000 to $14,999 | 16 (5.4%) | 16 (8.7%) |
| $15,000 to $19,999 | 19 (6.4%) | 17 (9.2%) |
| $20,000 to $24,999 | 13 (4.4%) | 7 (3.8%) |
| $25,000 to $34,999 | 43 (14.4%) | 17 (9.2%) |
| $35,000 to $49,999 | 45 (15.1%) | 73 (39.7%) |
| $50,000 to $74,999 | 55 (18.5%) | 24 (13.0%) |
| $75,000 to $99,999 | 44 (14.8%) | 9 (4.9%) |
| $100,000 to $149,999 | 18 (6.0%) | 6 (3.3%) |
| $150,000 or more | 23 (7.7%) | 0 (0.0%) |
| Total | 298 (100.0%) | 184 (100.0%) |
Monthly Housing Cost Tiers in Crane
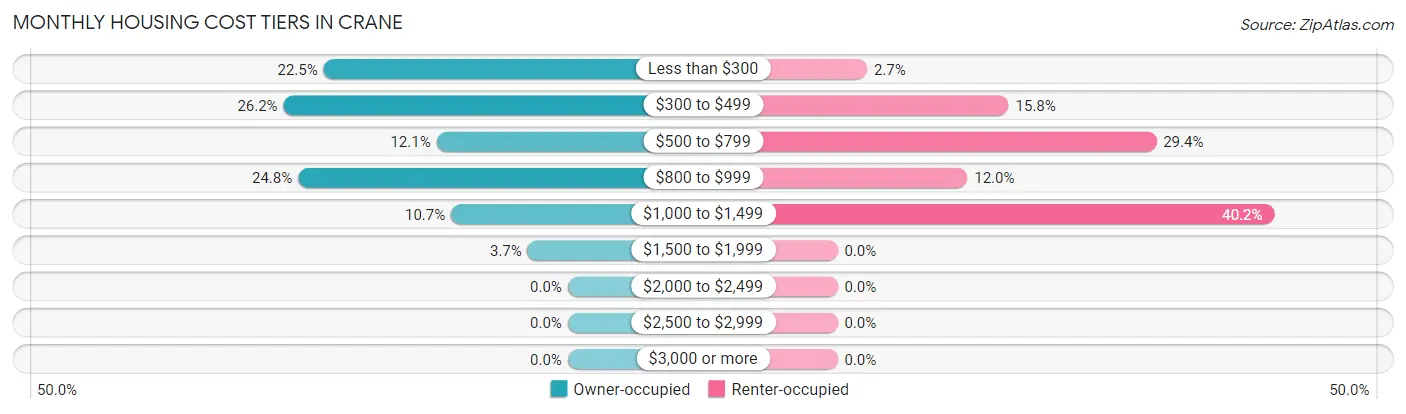
| Monthly Cost | Owner-occupied | Renter-occupied |
| Less than $300 | 67 (22.5%) | 5 (2.7%) |
| $300 to $499 | 78 (26.2%) | 29 (15.8%) |
| $500 to $799 | 36 (12.1%) | 54 (29.3%) |
| $800 to $999 | 74 (24.8%) | 22 (12.0%) |
| $1,000 to $1,499 | 32 (10.7%) | 74 (40.2%) |
| $1,500 to $1,999 | 11 (3.7%) | 0 (0.0%) |
| $2,000 to $2,499 | 0 (0.0%) | 0 (0.0%) |
| $2,500 to $2,999 | 0 (0.0%) | 0 (0.0%) |
| $3,000 or more | 0 (0.0%) | 0 (0.0%) |
| Total | 298 (100.0%) | 184 (100.0%) |
Physical Housing Characteristics in Crane
Housing Structures in Crane
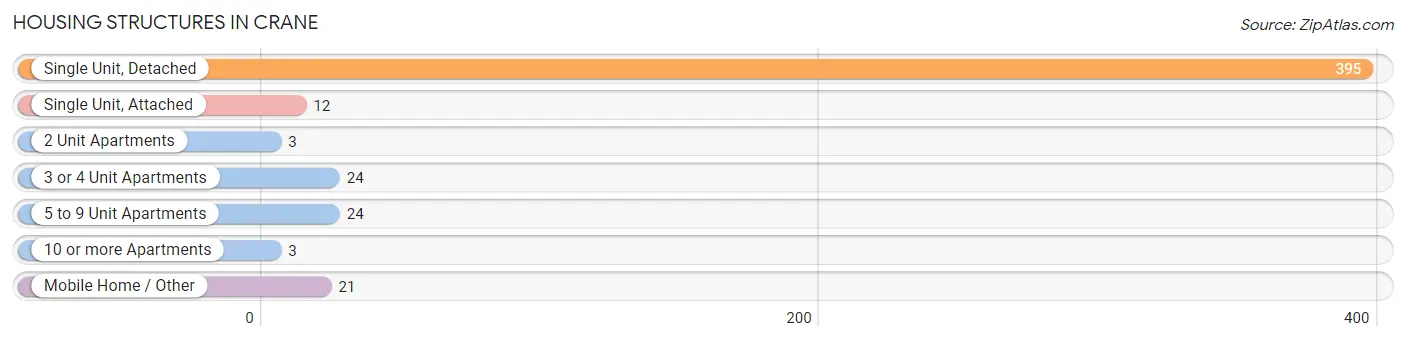
| Structure Type | # Housing Units | % Housing Units |
| Single Unit, Detached | 395 | 82.0% |
| Single Unit, Attached | 12 | 2.5% |
| 2 Unit Apartments | 3 | 0.6% |
| 3 or 4 Unit Apartments | 24 | 5.0% |
| 5 to 9 Unit Apartments | 24 | 5.0% |
| 10 or more Apartments | 3 | 0.6% |
| Mobile Home / Other | 21 | 4.4% |
| Total | 482 | 100.0% |
Housing Structures by Occupancy in Crane
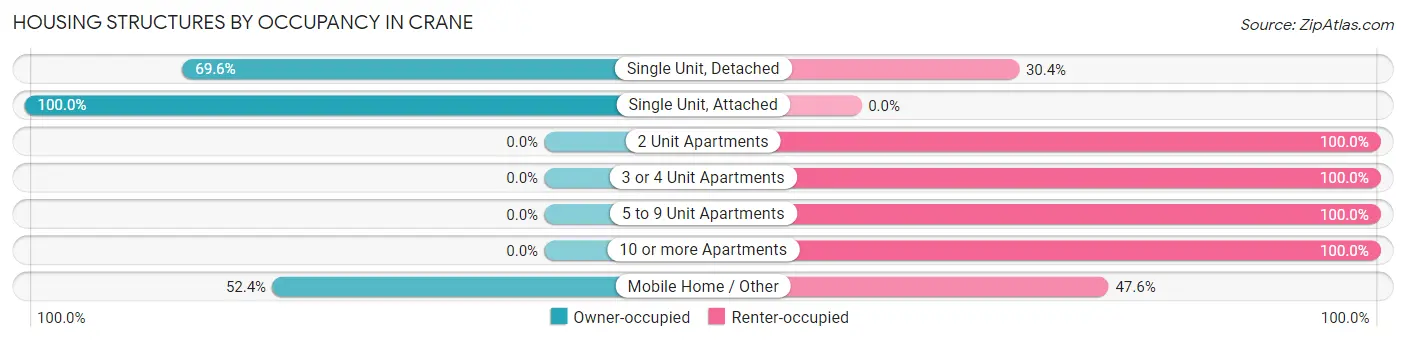
| Structure Type | Owner-occupied | Renter-occupied |
| Single Unit, Detached | 275 (69.6%) | 120 (30.4%) |
| Single Unit, Attached | 12 (100.0%) | 0 (0.0%) |
| 2 Unit Apartments | 0 (0.0%) | 3 (100.0%) |
| 3 or 4 Unit Apartments | 0 (0.0%) | 24 (100.0%) |
| 5 to 9 Unit Apartments | 0 (0.0%) | 24 (100.0%) |
| 10 or more Apartments | 0 (0.0%) | 3 (100.0%) |
| Mobile Home / Other | 11 (52.4%) | 10 (47.6%) |
| Total | 298 (61.8%) | 184 (38.2%) |
Housing Structures by Number of Rooms in Crane
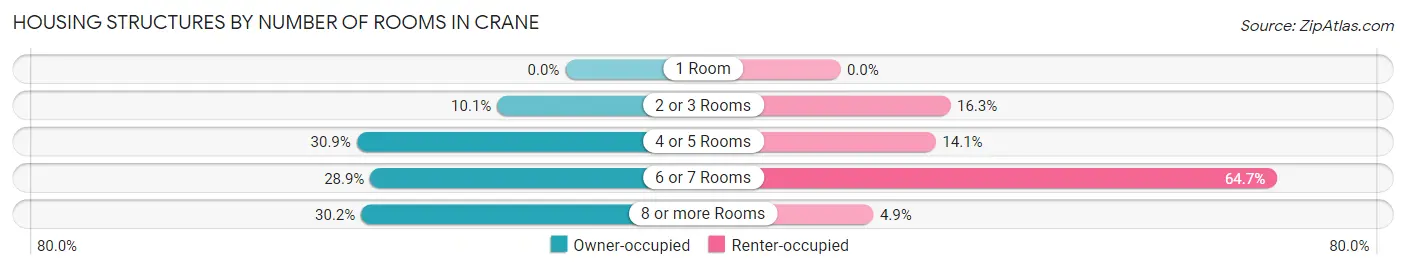
| Number of Rooms | Owner-occupied | Renter-occupied |
| 1 Room | 0 (0.0%) | 0 (0.0%) |
| 2 or 3 Rooms | 30 (10.1%) | 30 (16.3%) |
| 4 or 5 Rooms | 92 (30.9%) | 26 (14.1%) |
| 6 or 7 Rooms | 86 (28.9%) | 119 (64.7%) |
| 8 or more Rooms | 90 (30.2%) | 9 (4.9%) |
| Total | 298 (100.0%) | 184 (100.0%) |
Housing Structure by Heating Type in Crane
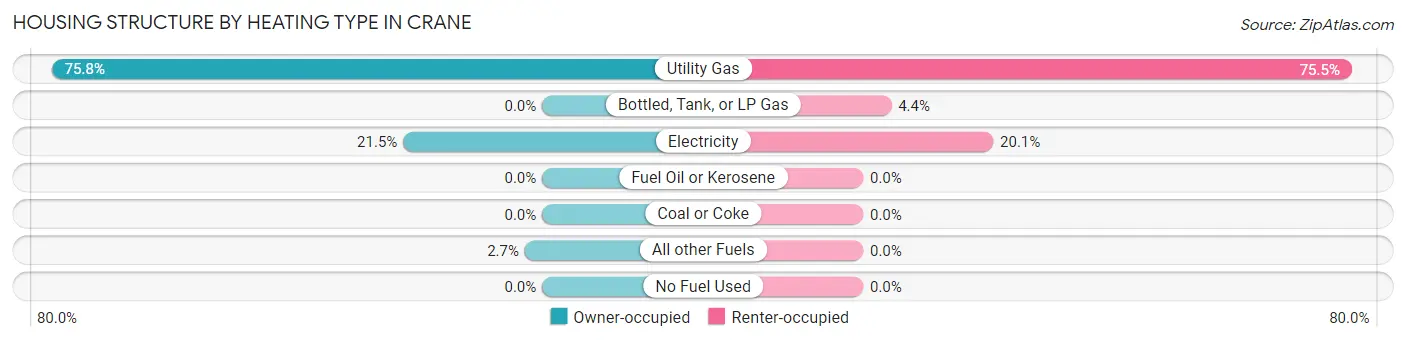
| Heating Type | Owner-occupied | Renter-occupied |
| Utility Gas | 226 (75.8%) | 139 (75.5%) |
| Bottled, Tank, or LP Gas | 0 (0.0%) | 8 (4.3%) |
| Electricity | 64 (21.5%) | 37 (20.1%) |
| Fuel Oil or Kerosene | 0 (0.0%) | 0 (0.0%) |
| Coal or Coke | 0 (0.0%) | 0 (0.0%) |
| All other Fuels | 8 (2.7%) | 0 (0.0%) |
| No Fuel Used | 0 (0.0%) | 0 (0.0%) |
| Total | 298 (100.0%) | 184 (100.0%) |
Household Vehicle Usage in Crane
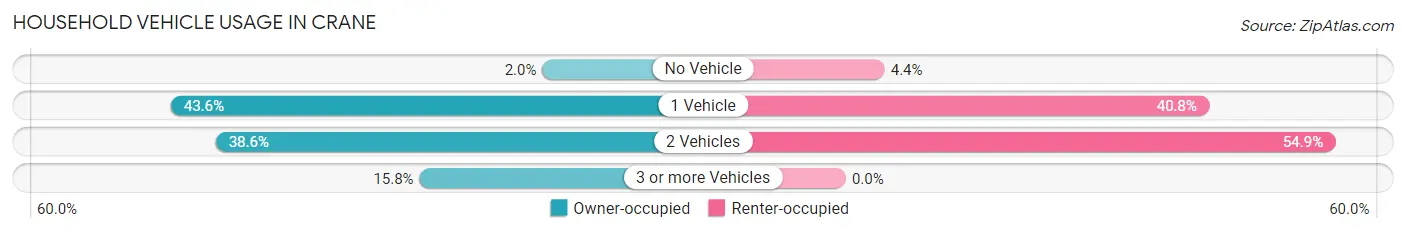
| Vehicles per Household | Owner-occupied | Renter-occupied |
| No Vehicle | 6 (2.0%) | 8 (4.3%) |
| 1 Vehicle | 130 (43.6%) | 75 (40.8%) |
| 2 Vehicles | 115 (38.6%) | 101 (54.9%) |
| 3 or more Vehicles | 47 (15.8%) | 0 (0.0%) |
| Total | 298 (100.0%) | 184 (100.0%) |
Real Estate & Mortgages in Crane
Real Estate and Mortgage Overview in Crane
| Characteristic | Without Mortgage | With Mortgage |
| Housing Units | 152 | 146 |
| Median Property Value | $83,000 | $106,500 |
| Median Household Income | $34,737 | $8 |
| Monthly Housing Costs | $323 | $0 |
| Real Estate Taxes | $495 | $0 |
Property Value by Mortgage Status in Crane
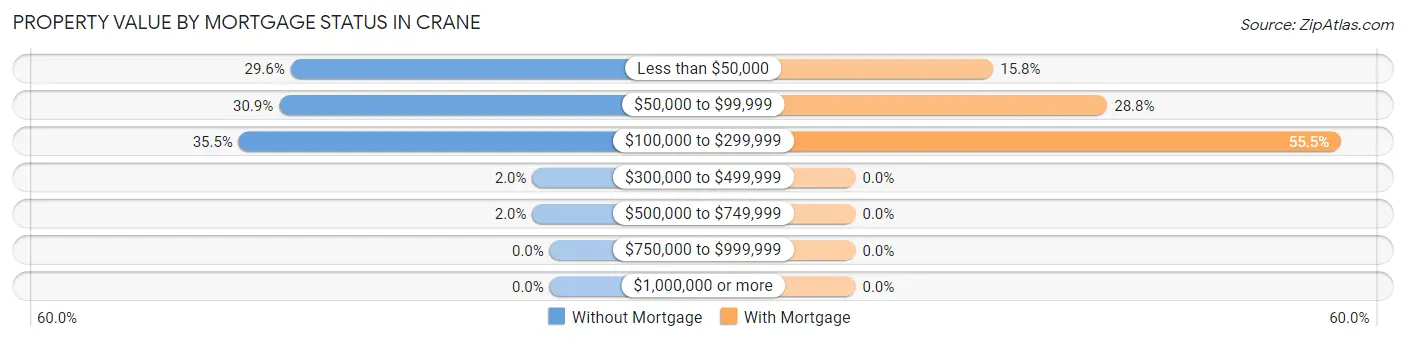
| Property Value | Without Mortgage | With Mortgage |
| Less than $50,000 | 45 (29.6%) | 23 (15.8%) |
| $50,000 to $99,999 | 47 (30.9%) | 42 (28.8%) |
| $100,000 to $299,999 | 54 (35.5%) | 81 (55.5%) |
| $300,000 to $499,999 | 3 (2.0%) | 0 (0.0%) |
| $500,000 to $749,999 | 3 (2.0%) | 0 (0.0%) |
| $750,000 to $999,999 | 0 (0.0%) | 0 (0.0%) |
| $1,000,000 or more | 0 (0.0%) | 0 (0.0%) |
| Total | 152 (100.0%) | 146 (100.0%) |
Household Income by Mortgage Status in Crane
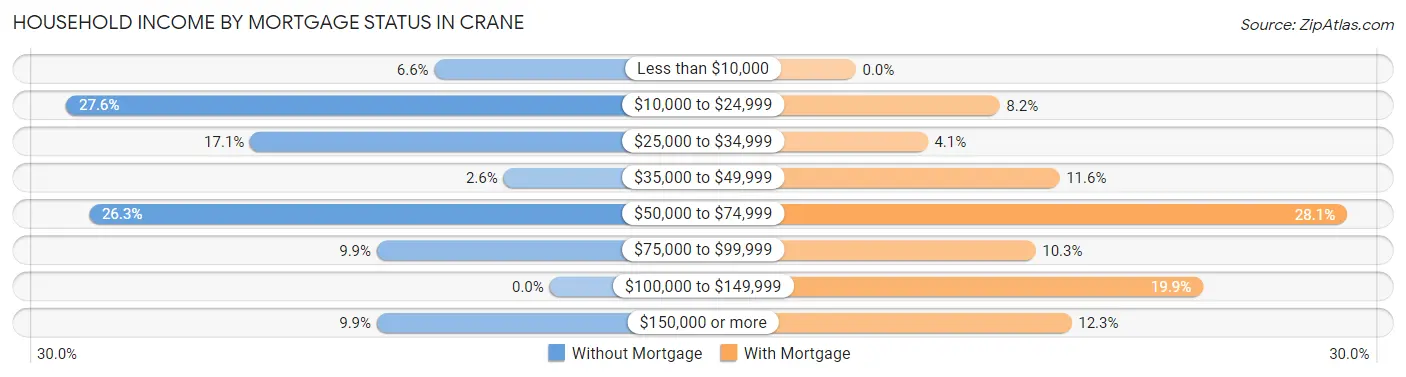
| Household Income | Without Mortgage | With Mortgage |
| Less than $10,000 | 10 (6.6%) | 0 (0.0%) |
| $10,000 to $24,999 | 42 (27.6%) | 12 (8.2%) |
| $25,000 to $34,999 | 26 (17.1%) | 6 (4.1%) |
| $35,000 to $49,999 | 4 (2.6%) | 17 (11.6%) |
| $50,000 to $74,999 | 40 (26.3%) | 41 (28.1%) |
| $75,000 to $99,999 | 15 (9.9%) | 15 (10.3%) |
| $100,000 to $149,999 | 0 (0.0%) | 29 (19.9%) |
| $150,000 or more | 15 (9.9%) | 18 (12.3%) |
| Total | 152 (100.0%) | 146 (100.0%) |
Property Value to Household Income Ratio in Crane
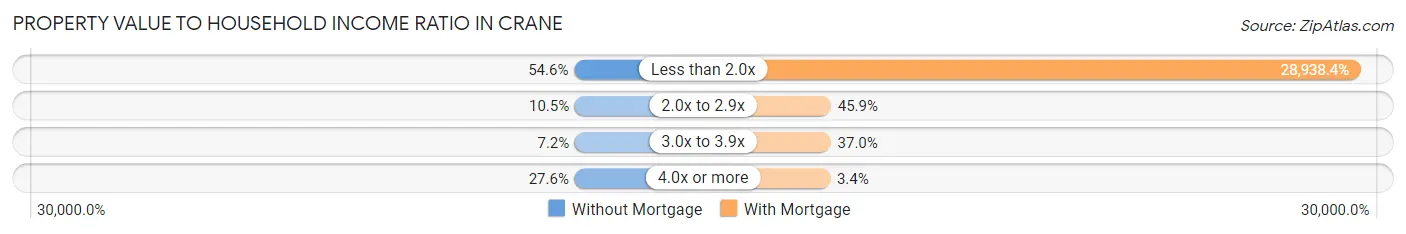
| Value-to-Income Ratio | Without Mortgage | With Mortgage |
| Less than 2.0x | 83 (54.6%) | 42,250 (28,938.4%) |
| 2.0x to 2.9x | 16 (10.5%) | 67 (45.9%) |
| 3.0x to 3.9x | 11 (7.2%) | 54 (37.0%) |
| 4.0x or more | 42 (27.6%) | 5 (3.4%) |
| Total | 152 (100.0%) | 146 (100.0%) |
Real Estate Taxes by Mortgage Status in Crane
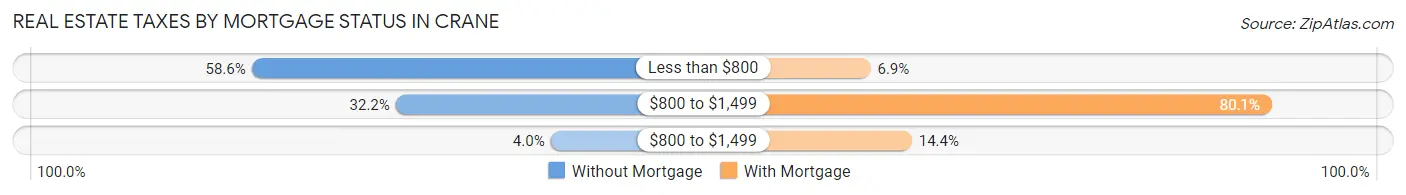
| Property Taxes | Without Mortgage | With Mortgage |
| Less than $800 | 89 (58.6%) | 10 (6.9%) |
| $800 to $1,499 | 49 (32.2%) | 117 (80.1%) |
| $800 to $1,499 | 6 (4.0%) | 21 (14.4%) |
| Total | 152 (100.0%) | 146 (100.0%) |
Health & Disability in Crane
Health Insurance Coverage by Age in Crane
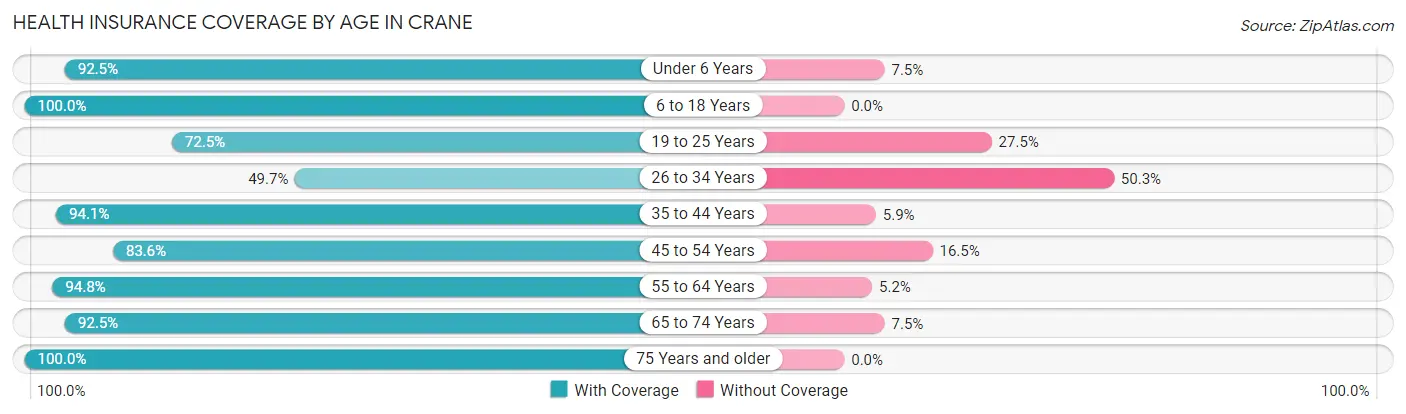
| Age Bracket | With Coverage | Without Coverage |
| Under 6 Years | 197 (92.5%) | 16 (7.5%) |
| 6 to 18 Years | 242 (100.0%) | 0 (0.0%) |
| 19 to 25 Years | 95 (72.5%) | 36 (27.5%) |
| 26 to 34 Years | 90 (49.7%) | 91 (50.3%) |
| 35 to 44 Years | 128 (94.1%) | 8 (5.9%) |
| 45 to 54 Years | 127 (83.6%) | 25 (16.5%) |
| 55 to 64 Years | 128 (94.8%) | 7 (5.2%) |
| 65 to 74 Years | 123 (92.5%) | 10 (7.5%) |
| 75 Years and older | 71 (100.0%) | 0 (0.0%) |
| Total | 1,201 (86.2%) | 193 (13.9%) |
Health Insurance Coverage by Citizenship Status in Crane
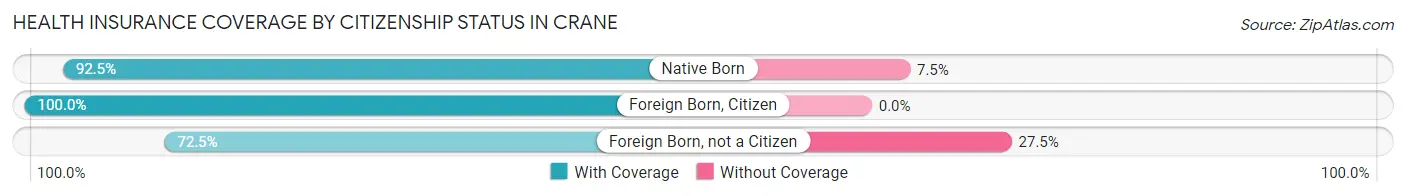
| Citizenship Status | With Coverage | Without Coverage |
| Native Born | 197 (92.5%) | 16 (7.5%) |
| Foreign Born, Citizen | 242 (100.0%) | 0 (0.0%) |
| Foreign Born, not a Citizen | 95 (72.5%) | 36 (27.5%) |
Health Insurance Coverage by Household Income in Crane
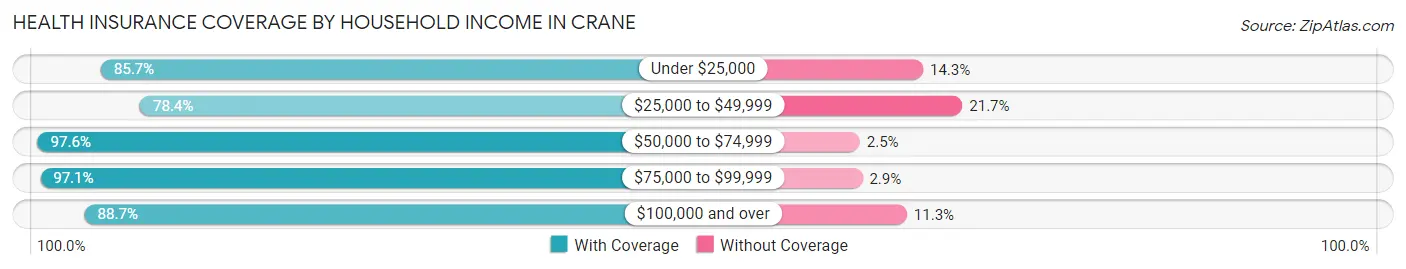
| Household Income | With Coverage | Without Coverage |
| Under $25,000 | 228 (85.7%) | 38 (14.3%) |
| $25,000 to $49,999 | 409 (78.3%) | 113 (21.6%) |
| $50,000 to $74,999 | 199 (97.6%) | 5 (2.5%) |
| $75,000 to $99,999 | 132 (97.1%) | 4 (2.9%) |
| $100,000 and over | 205 (88.7%) | 26 (11.3%) |
Public vs Private Health Insurance Coverage by Age in Crane
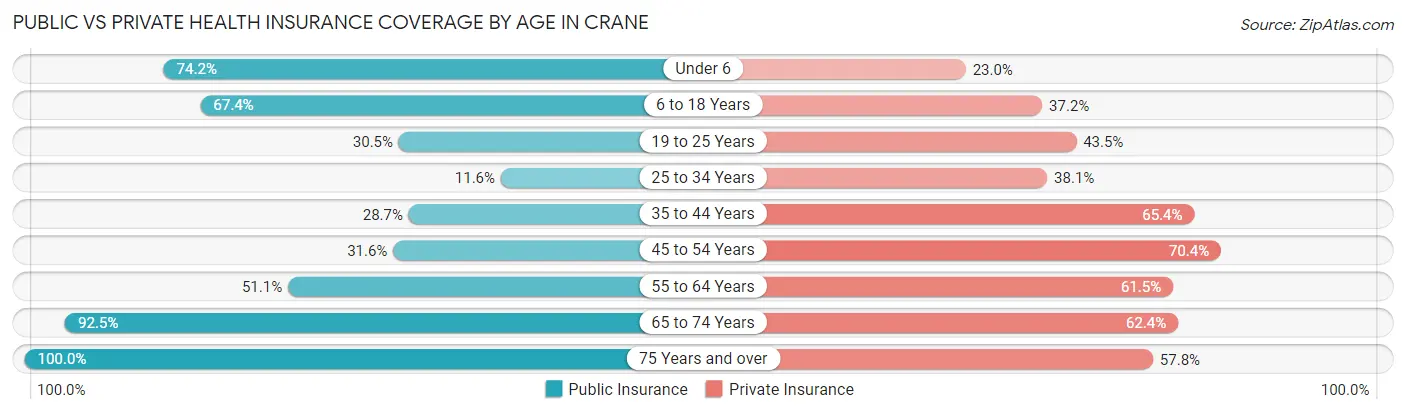
| Age Bracket | Public Insurance | Private Insurance |
| Under 6 | 158 (74.2%) | 49 (23.0%) |
| 6 to 18 Years | 163 (67.4%) | 90 (37.2%) |
| 19 to 25 Years | 40 (30.5%) | 57 (43.5%) |
| 25 to 34 Years | 21 (11.6%) | 69 (38.1%) |
| 35 to 44 Years | 39 (28.7%) | 89 (65.4%) |
| 45 to 54 Years | 48 (31.6%) | 107 (70.4%) |
| 55 to 64 Years | 69 (51.1%) | 83 (61.5%) |
| 65 to 74 Years | 123 (92.5%) | 83 (62.4%) |
| 75 Years and over | 71 (100.0%) | 41 (57.8%) |
| Total | 732 (52.5%) | 668 (47.9%) |
Disability Status by Sex by Age in Crane
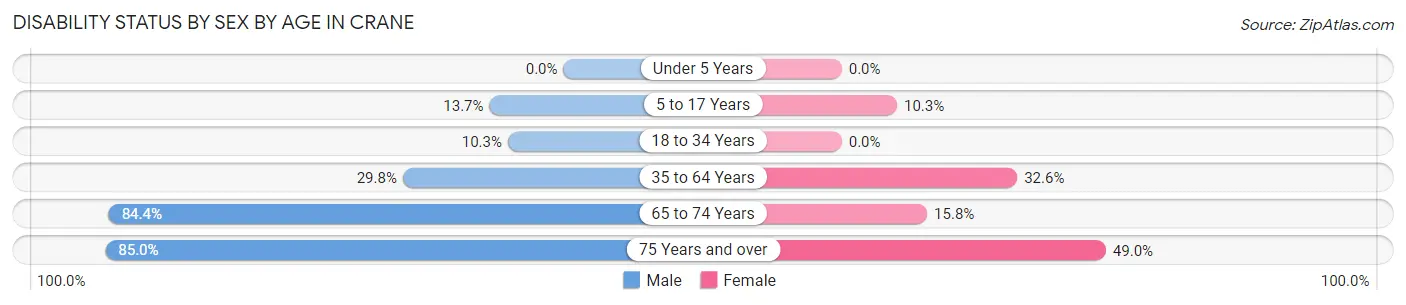
| Age Bracket | Male | Female |
| Under 5 Years | 0 (0.0%) | 0 (0.0%) |
| 5 to 17 Years | 14 (13.7%) | 16 (10.3%) |
| 18 to 34 Years | 10 (10.3%) | 0 (0.0%) |
| 35 to 64 Years | 62 (29.8%) | 70 (32.6%) |
| 65 to 74 Years | 27 (84.4%) | 16 (15.8%) |
| 75 Years and over | 17 (85.0%) | 25 (49.0%) |
Disability Class by Sex by Age in Crane
Disability Class: Hearing Difficulty
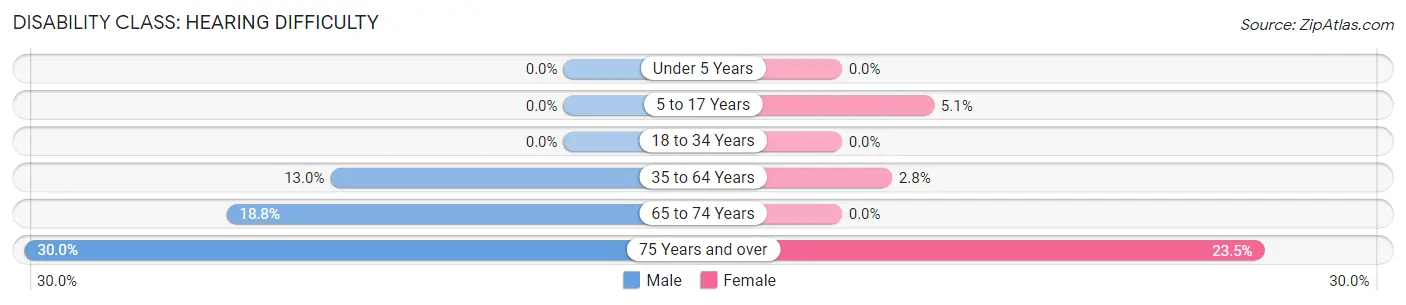
| Age Bracket | Male | Female |
| Under 5 Years | 0 (0.0%) | 0 (0.0%) |
| 5 to 17 Years | 0 (0.0%) | 8 (5.1%) |
| 18 to 34 Years | 0 (0.0%) | 0 (0.0%) |
| 35 to 64 Years | 27 (13.0%) | 6 (2.8%) |
| 65 to 74 Years | 6 (18.8%) | 0 (0.0%) |
| 75 Years and over | 6 (30.0%) | 12 (23.5%) |
Disability Class: Vision Difficulty
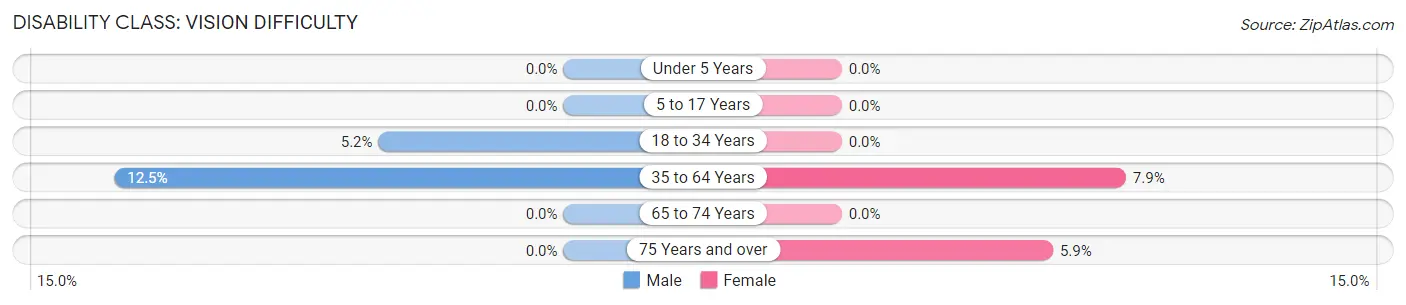
| Age Bracket | Male | Female |
| Under 5 Years | 0 (0.0%) | 0 (0.0%) |
| 5 to 17 Years | 0 (0.0%) | 0 (0.0%) |
| 18 to 34 Years | 5 (5.1%) | 0 (0.0%) |
| 35 to 64 Years | 26 (12.5%) | 17 (7.9%) |
| 65 to 74 Years | 0 (0.0%) | 0 (0.0%) |
| 75 Years and over | 0 (0.0%) | 3 (5.9%) |
Disability Class: Cognitive Difficulty
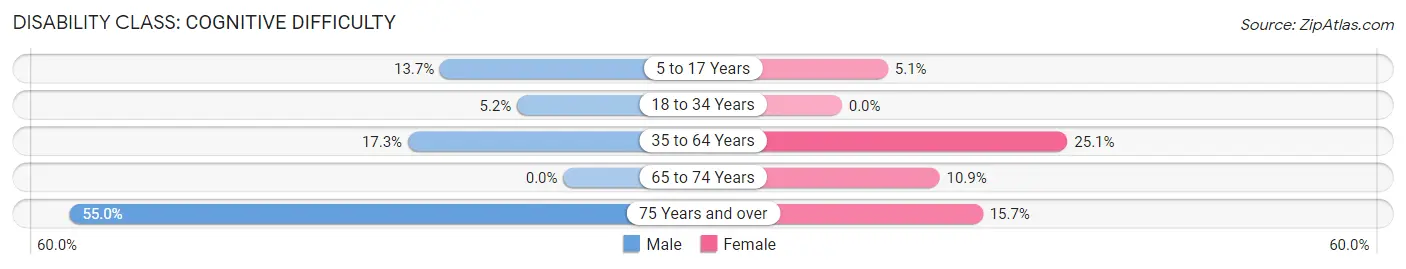
| Age Bracket | Male | Female |
| 5 to 17 Years | 14 (13.7%) | 8 (5.1%) |
| 18 to 34 Years | 5 (5.1%) | 0 (0.0%) |
| 35 to 64 Years | 36 (17.3%) | 54 (25.1%) |
| 65 to 74 Years | 0 (0.0%) | 11 (10.9%) |
| 75 Years and over | 11 (55.0%) | 8 (15.7%) |
Disability Class: Ambulatory Difficulty
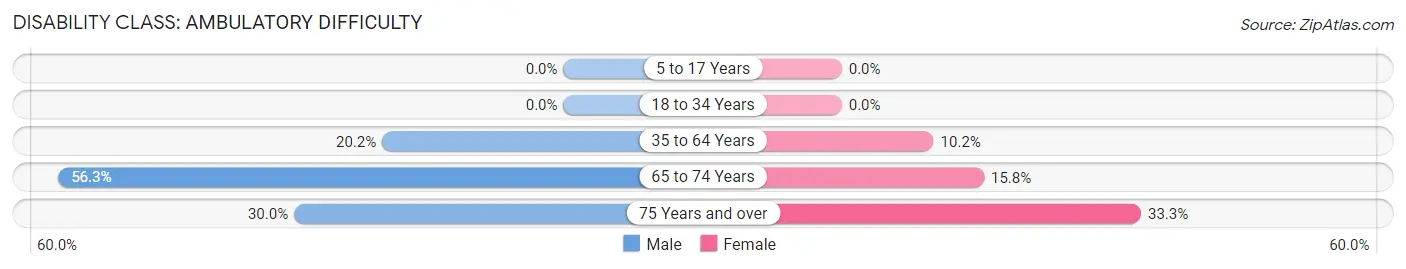
| Age Bracket | Male | Female |
| 5 to 17 Years | 0 (0.0%) | 0 (0.0%) |
| 18 to 34 Years | 0 (0.0%) | 0 (0.0%) |
| 35 to 64 Years | 42 (20.2%) | 22 (10.2%) |
| 65 to 74 Years | 18 (56.2%) | 16 (15.8%) |
| 75 Years and over | 6 (30.0%) | 17 (33.3%) |
Disability Class: Self-Care Difficulty
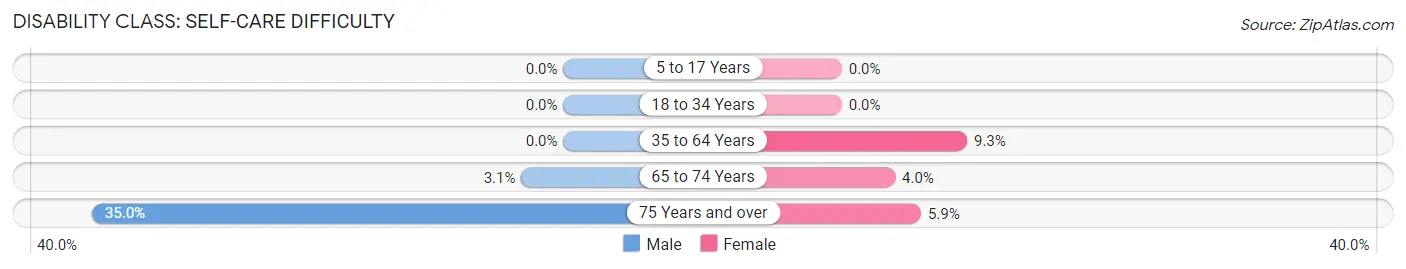
| Age Bracket | Male | Female |
| 5 to 17 Years | 0 (0.0%) | 0 (0.0%) |
| 18 to 34 Years | 0 (0.0%) | 0 (0.0%) |
| 35 to 64 Years | 0 (0.0%) | 20 (9.3%) |
| 65 to 74 Years | 1 (3.1%) | 4 (4.0%) |
| 75 Years and over | 7 (35.0%) | 3 (5.9%) |
Technology Access in Crane
Computing Device Access in Crane
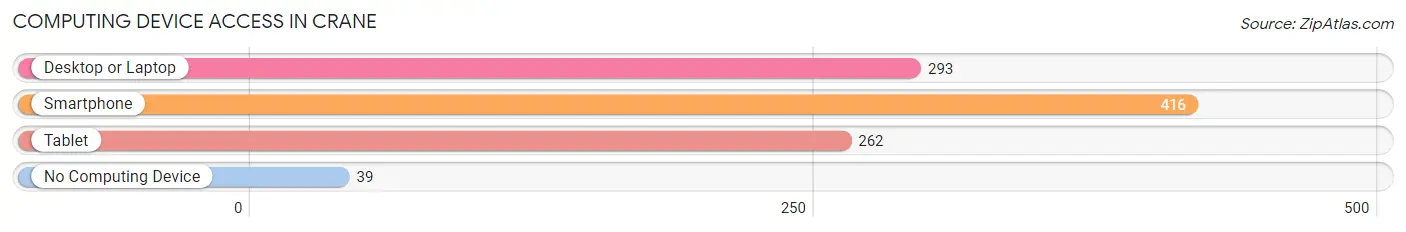
| Device Type | # Households | % Households |
| Desktop or Laptop | 293 | 60.8% |
| Smartphone | 416 | 86.3% |
| Tablet | 262 | 54.4% |
| No Computing Device | 39 | 8.1% |
| Total | 482 | 100.0% |
Internet Access in Crane
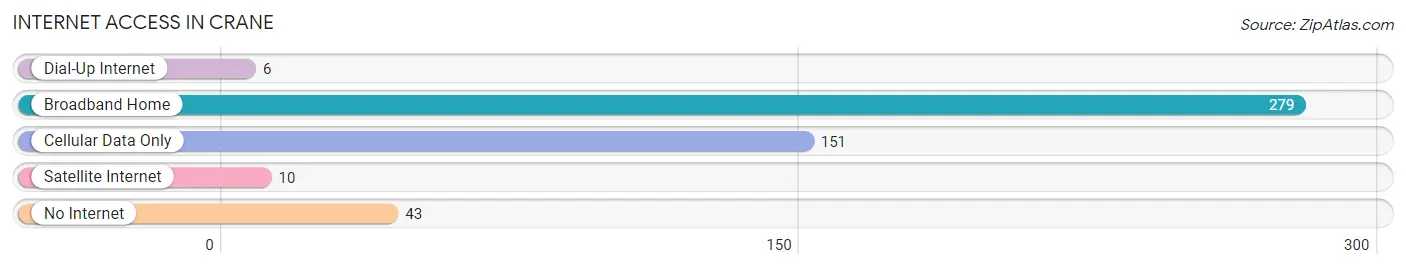
| Internet Type | # Households | % Households |
| Dial-Up Internet | 6 | 1.2% |
| Broadband Home | 279 | 57.9% |
| Cellular Data Only | 151 | 31.3% |
| Satellite Internet | 10 | 2.1% |
| No Internet | 43 | 8.9% |
| Total | 482 | 100.0% |
Crane Summary
Crane, Missouri is a small town located in Stone County, Missouri. It is situated on the banks of the White River, and is home to a population of approximately 1,000 people. The town was founded in 1883 and has a rich history of farming, logging, and mining.
Geography
Crane is located in the Ozark Mountains of southwestern Missouri. It is situated on the banks of the White River, which is a tributary of the Arkansas River. The town is surrounded by rolling hills and forests, and is home to a variety of wildlife. The climate in Crane is humid subtropical, with hot summers and mild winters.
Economy
Crane’s economy is largely based on agriculture and tourism. The town is home to several farms, which produce a variety of crops, including corn, soybeans, wheat, and hay. The town also has a thriving tourism industry, with visitors coming to enjoy the area’s natural beauty and outdoor activities.
Demographics
As of the 2010 census, Crane had a population of 1,000 people. The racial makeup of the town was 97.2% White, 0.7% African American, 0.3% Native American, 0.2% Asian, 0.1% Pacific Islander, and 1.5% from other races. The median household income was $30,000, and the median family income was $35,000.
History
Crane was founded in 1883 by a group of settlers from Arkansas. The town was named after a local family, the Cranes, who had settled in the area in the early 1800s. The town quickly grew, and by the early 1900s, it had become a thriving agricultural and logging center. The town was also home to several mines, which produced lead, zinc, and other minerals.
In the early 20th century, Crane was a popular tourist destination, with visitors coming to enjoy the area’s natural beauty and outdoor activities. The town was also home to several resorts, which attracted visitors from all over the country.
In the late 20th century, Crane’s economy shifted away from agriculture and mining, and towards tourism. The town is now home to several bed and breakfasts, restaurants, and other tourist attractions.
Conclusion
Crane, Missouri is a small town located in Stone County, Missouri. It is situated on the banks of the White River, and is home to a population of approximately 1,000 people. The town was founded in 1883 and has a rich history of farming, logging, and mining. Today, Crane’s economy is largely based on agriculture and tourism, and the town is home to several bed and breakfasts, restaurants, and other tourist attractions.
Common Questions
What is Per Capita Income in Crane?
Per Capita income in Crane is $20,590.
What is the Median Family Income in Crane?
Median Family Income in Crane is $46,211.
What is the Median Household income in Crane?
Median Household Income in Crane is $45,234.
What is Income or Wage Gap in Crane?
Income or Wage Gap in Crane is 35.9%.
Women in Crane earn 64.1 cents for every dollar earned by a man.
What is Family Income Deficit in Crane?
Family Income Deficit in Crane is $16,573.
Families that are below poverty line in Crane earn $16,573 less on average than the poverty threshold level.
What is Inequality or Gini Index in Crane?
Inequality or Gini Index in Crane is 0.49.
What is the Total Population of Crane?
Total Population of Crane is 1,470.
What is the Total Male Population of Crane?
Total Male Population of Crane is 630.
What is the Total Female Population of Crane?
Total Female Population of Crane is 840.
What is the Ratio of Males per 100 Females in Crane?
There are 75.00 Males per 100 Females in Crane.
What is the Ratio of Females per 100 Males in Crane?
There are 133.33 Females per 100 Males in Crane.
What is the Median Population Age in Crane?
Median Population Age in Crane is 30.6 Years.
What is the Average Family Size in Crane
Average Family Size in Crane is 3.4 People.
What is the Average Household Size in Crane
Average Household Size in Crane is 2.8 People.
How Large is the Labor Force in Crane?
There are 557 People in the Labor Forcein in Crane.
What is the Percentage of People in the Labor Force in Crane?
53.4% of People are in the Labor Force in Crane.
What is the Unemployment Rate in Crane?
Unemployment Rate in Crane is 4.3%.