Zip Codes with the Highest Percentage of Population with a Degree in Physical and Health Sciences in Independence, MO
RELATED REPORTS & OPTIONS
Physical and Health Sciences
Independence
Compare Zip Codes
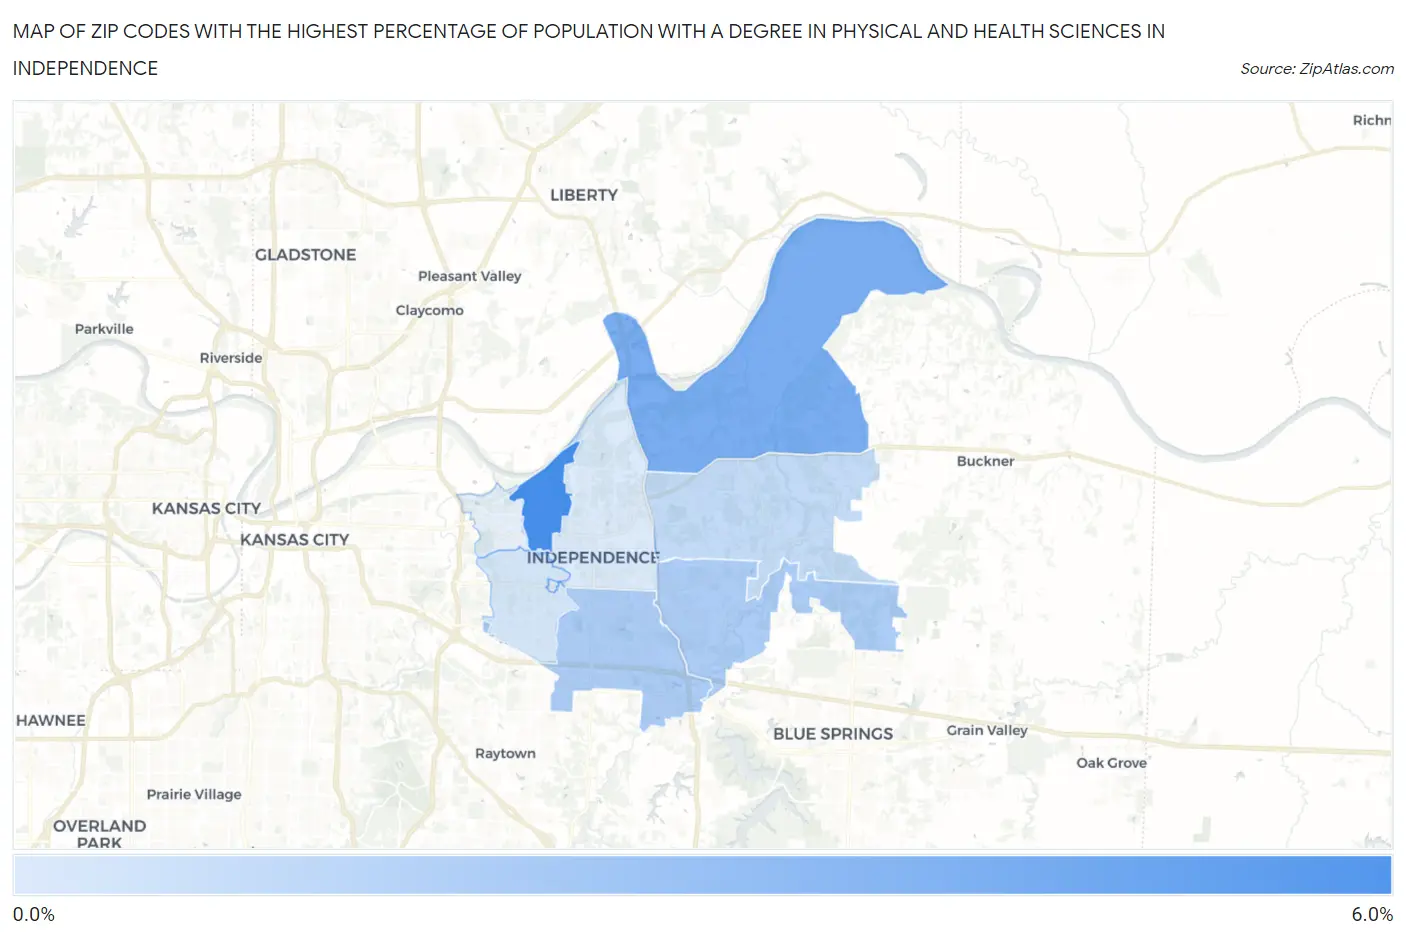
Map of Zip Codes with the Highest Percentage of Population with a Degree in Physical and Health Sciences in Independence
0.62%
5.6%
Zip Codes with the Highest Percentage of Population with a Degree in Physical and Health Sciences in Independence, MO
| Zip Code | % Graduates | vs State | vs National | |
| 1. | 64054 | 5.6% | 2.6%(+3.04)#90 | 3.1%(+2.54)#3,635 |
| 2. | 64058 | 3.9% | 2.6%(+1.29)#161 | 3.1%(+0.790)#7,077 |
| 3. | 64055 | 2.2% | 2.6%(-0.357)#299 | 3.1%(-0.857)#13,952 |
| 4. | 64057 | 2.2% | 2.6%(-0.361)#302 | 3.1%(-0.860)#13,969 |
| 5. | 64056 | 1.5% | 2.6%(-1.15)#390 | 3.1%(-1.64)#17,495 |
| 6. | 64052 | 0.85% | 2.6%(-1.75)#447 | 3.1%(-2.25)#19,710 |
| 7. | 64050 | 0.62% | 2.6%(-1.98)#477 | 3.1%(-2.48)#20,345 |
1
Common Questions
What are the Top 5 Zip Codes with the Highest Percentage of Population with a Degree in Physical and Health Sciences in Independence, MO?
Top 5 Zip Codes with the Highest Percentage of Population with a Degree in Physical and Health Sciences in Independence, MO are:
What zip code has the Highest Percentage of Population with a Degree in Physical and Health Sciences in Independence, MO?
64054 has the Highest Percentage of Population with a Degree in Physical and Health Sciences in Independence, MO with 5.6%.
What is the Percentage of Population with a Degree in Physical and Health Sciences in Independence, MO?
Percentage of Population with a Degree in Physical and Health Sciences in Independence is 1.7%.
What is the Percentage of Population with a Degree in Physical and Health Sciences in Missouri?
Percentage of Population with a Degree in Physical and Health Sciences in Missouri is 2.6%.
What is the Percentage of Population with a Degree in Physical and Health Sciences in the United States?
Percentage of Population with a Degree in Physical and Health Sciences in the United States is 3.1%.