Advance, MO Map & Demographics
Advance Map
Advance Overview
$28,181
PER CAPITA INCOME
$57,500
AVG FAMILY INCOME
$48,500
AVG HOUSEHOLD INCOME
35.7%
WAGE / INCOME GAP [ % ]
64.3¢/ $1
WAGE / INCOME GAP [ $ ]
0.42
INEQUALITY / GINI INDEX
1,451
TOTAL POPULATION
721
MALE POPULATION
730
FEMALE POPULATION
98.77
MALES / 100 FEMALES
101.25
FEMALES / 100 MALES
44.3
MEDIAN AGE
2.8
AVG FAMILY SIZE
2.0
AVG HOUSEHOLD SIZE
705
LABOR FORCE [ PEOPLE ]
57.4%
PERCENT IN LABOR FORCE
3.7%
UNEMPLOYMENT RATE
Advance Zip Codes
Advance Area Codes
Income in Advance
Income Overview in Advance
Per Capita Income in Advance is $28,181, while median incomes of families and households are $57,500 and $48,500 respectively.
| Characteristic | Number | Measure |
| Per Capita Income | 1,451 | $28,181 |
| Median Family Income | 330 | $57,500 |
| Mean Family Income | 330 | $71,008 |
| Median Household Income | 712 | $48,500 |
| Mean Household Income | 712 | $57,846 |
| Income Deficit | 330 | $0 |
| Wage / Income Gap (%) | 1,451 | 35.72% |
| Wage / Income Gap ($) | 1,451 | 64.28¢ per $1 |
| Gini / Inequality Index | 1,451 | 0.42 |
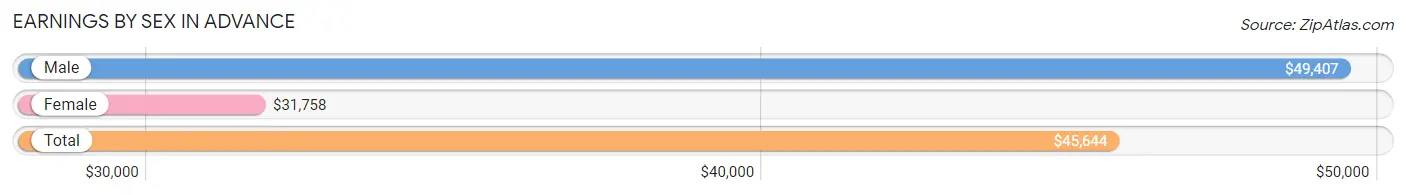
Earnings by Sex in Advance
Average Earnings in Advance are $45,644, $49,407 for men and $31,758 for women, a difference of 35.7%.
| Sex | Number | Average Earnings |
| Male | 384 (54.0%) | $49,407 |
| Female | 327 (46.0%) | $31,758 |
| Total | 711 (100.0%) | $45,644 |
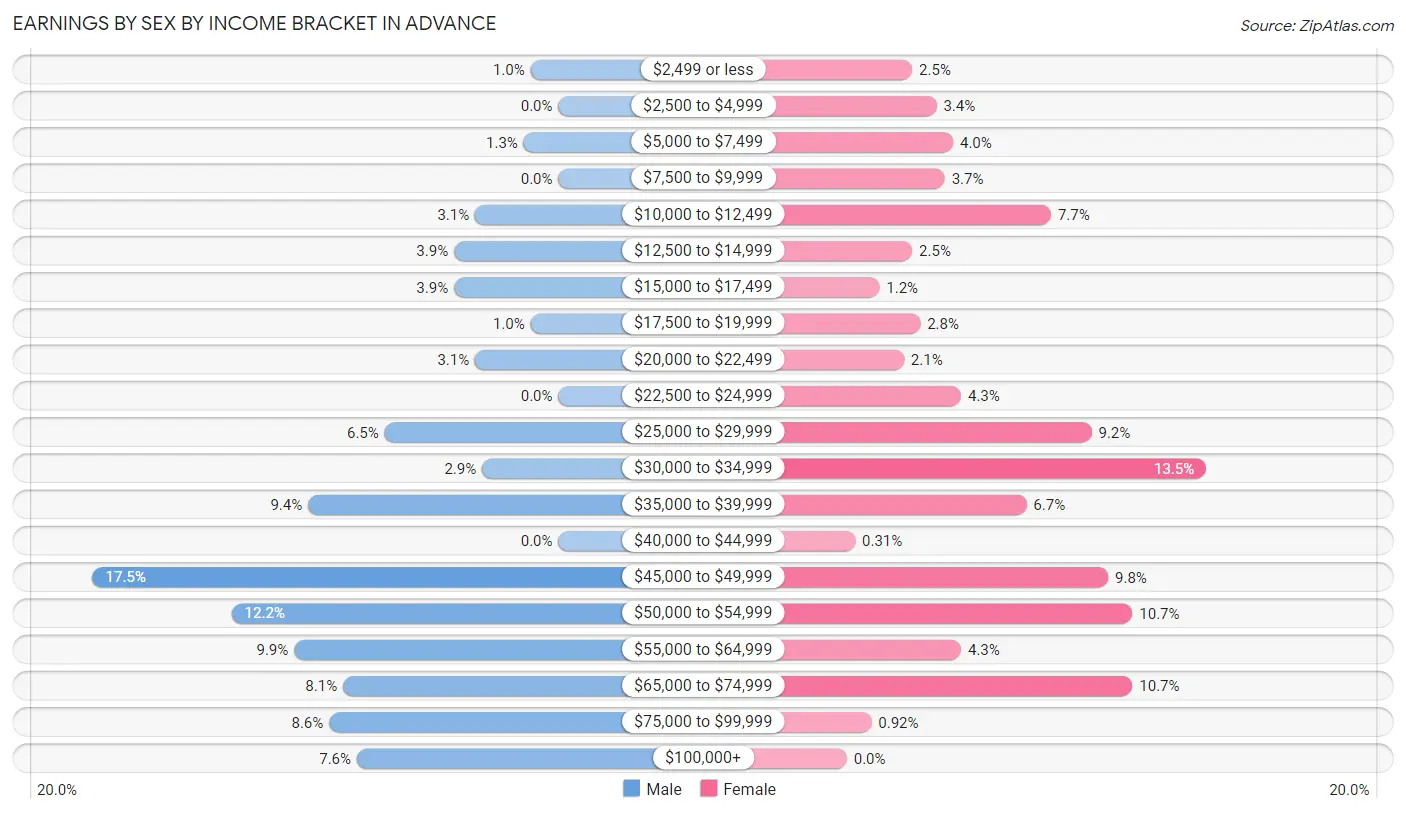
Earnings by Sex by Income Bracket in Advance
The most common earnings brackets in Advance are $45,000 to $49,999 for men (67 | 17.4%) and $30,000 to $34,999 for women (44 | 13.5%).
| Income | Male | Female |
| $2,499 or less | 4 (1.0%) | 8 (2.5%) |
| $2,500 to $4,999 | 0 (0.0%) | 11 (3.4%) |
| $5,000 to $7,499 | 5 (1.3%) | 13 (4.0%) |
| $7,500 to $9,999 | 0 (0.0%) | 12 (3.7%) |
| $10,000 to $12,499 | 12 (3.1%) | 25 (7.6%) |
| $12,500 to $14,999 | 15 (3.9%) | 8 (2.5%) |
| $15,000 to $17,499 | 15 (3.9%) | 4 (1.2%) |
| $17,500 to $19,999 | 4 (1.0%) | 9 (2.8%) |
| $20,000 to $22,499 | 12 (3.1%) | 7 (2.1%) |
| $22,500 to $24,999 | 0 (0.0%) | 14 (4.3%) |
| $25,000 to $29,999 | 25 (6.5%) | 30 (9.2%) |
| $30,000 to $34,999 | 11 (2.9%) | 44 (13.5%) |
| $35,000 to $39,999 | 36 (9.4%) | 22 (6.7%) |
| $40,000 to $44,999 | 0 (0.0%) | 1 (0.3%) |
| $45,000 to $49,999 | 67 (17.4%) | 32 (9.8%) |
| $50,000 to $54,999 | 47 (12.2%) | 35 (10.7%) |
| $55,000 to $64,999 | 38 (9.9%) | 14 (4.3%) |
| $65,000 to $74,999 | 31 (8.1%) | 35 (10.7%) |
| $75,000 to $99,999 | 33 (8.6%) | 3 (0.9%) |
| $100,000+ | 29 (7.5%) | 0 (0.0%) |
| Total | 384 (100.0%) | 327 (100.0%) |
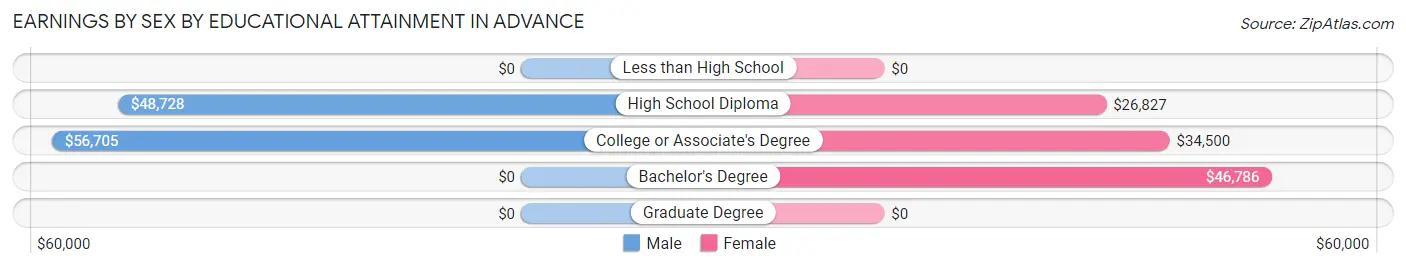
Earnings by Sex by Educational Attainment in Advance
Average earnings in Advance are $49,258 for men and $36,964 for women, a difference of 25.0%. Men with an educational attainment of college or associate's degree enjoy the highest average annual earnings of $56,705, while those with high school diploma education earn the least with $48,728. Women with an educational attainment of bachelor's degree earn the most with the average annual earnings of $46,786, while those with high school diploma education have the smallest earnings of $26,827.
| Educational Attainment | Male Income | Female Income |
| Less than High School | - | - |
| High School Diploma | $48,728 | $26,827 |
| College or Associate's Degree | $56,705 | $34,500 |
| Bachelor's Degree | - | - |
| Graduate Degree | - | - |
| Total | $49,258 | $36,964 |
Family Income in Advance
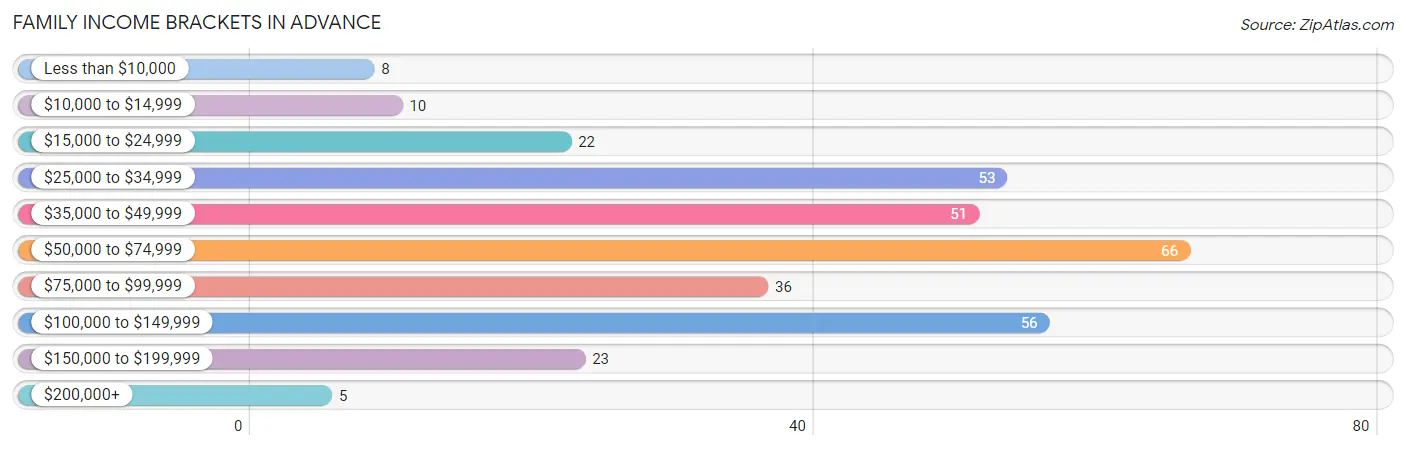
Family Income Brackets in Advance
According to the Advance family income data, there are 66 families falling into the $50,000 to $74,999 income range, which is the most common income bracket and makes up 20.0% of all families. Conversely, the $200,000+ income bracket is the least frequent group with only 5 families (1.5%) belonging to this category.
| Income Bracket | # Families | % Families |
| Less than $10,000 | 8 | 2.4% |
| $10,000 to $14,999 | 10 | 3.0% |
| $15,000 to $24,999 | 22 | 6.7% |
| $25,000 to $34,999 | 53 | 16.1% |
| $35,000 to $49,999 | 51 | 15.5% |
| $50,000 to $74,999 | 66 | 20.0% |
| $75,000 to $99,999 | 36 | 10.9% |
| $100,000 to $149,999 | 56 | 17.0% |
| $150,000 to $199,999 | 23 | 7.0% |
| $200,000+ | 5 | 1.5% |
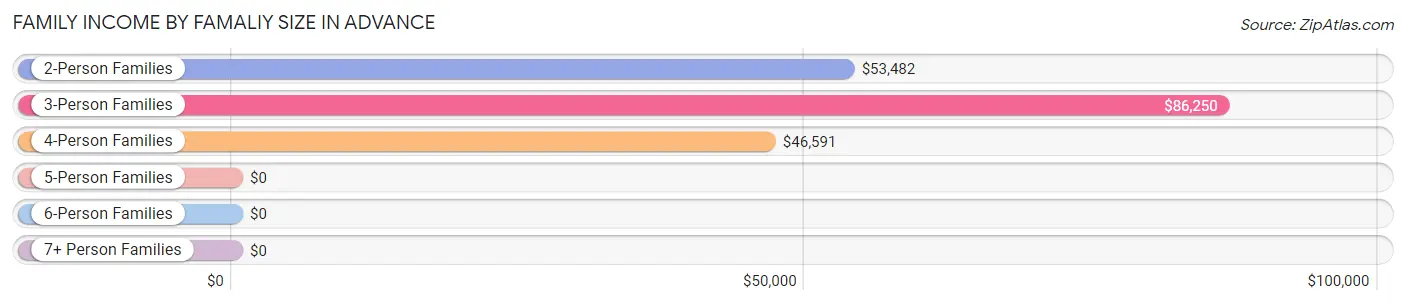
Family Income by Famaliy Size in Advance
3-person families (92 | 27.9%) account for the highest median family income in Advance with $86,250 per family, while 3-person families (92 | 27.9%) have the highest median income of $28,750 per family member.
| Income Bracket | # Families | Median Income |
| 2-Person Families | 155 (47.0%) | $53,482 |
| 3-Person Families | 92 (27.9%) | $86,250 |
| 4-Person Families | 64 (19.4%) | $46,591 |
| 5-Person Families | 11 (3.3%) | $0 |
| 6-Person Families | 8 (2.4%) | $0 |
| 7+ Person Families | 0 (0.0%) | $0 |
| Total | 330 (100.0%) | $57,500 |
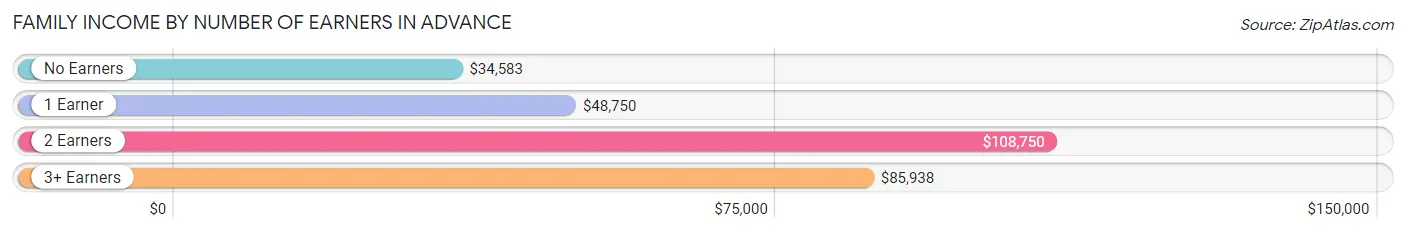
Family Income by Number of Earners in Advance
The median family income in Advance is $57,500, with families comprising 2 earners (130) having the highest median family income of $108,750, while families with no earners (83) have the lowest median family income of $34,583, accounting for 39.4% and 25.2% of families, respectively.
| Number of Earners | # Families | Median Income |
| No Earners | 83 (25.2%) | $34,583 |
| 1 Earner | 100 (30.3%) | $48,750 |
| 2 Earners | 130 (39.4%) | $108,750 |
| 3+ Earners | 17 (5.1%) | $85,938 |
| Total | 330 (100.0%) | $57,500 |
Household Income in Advance
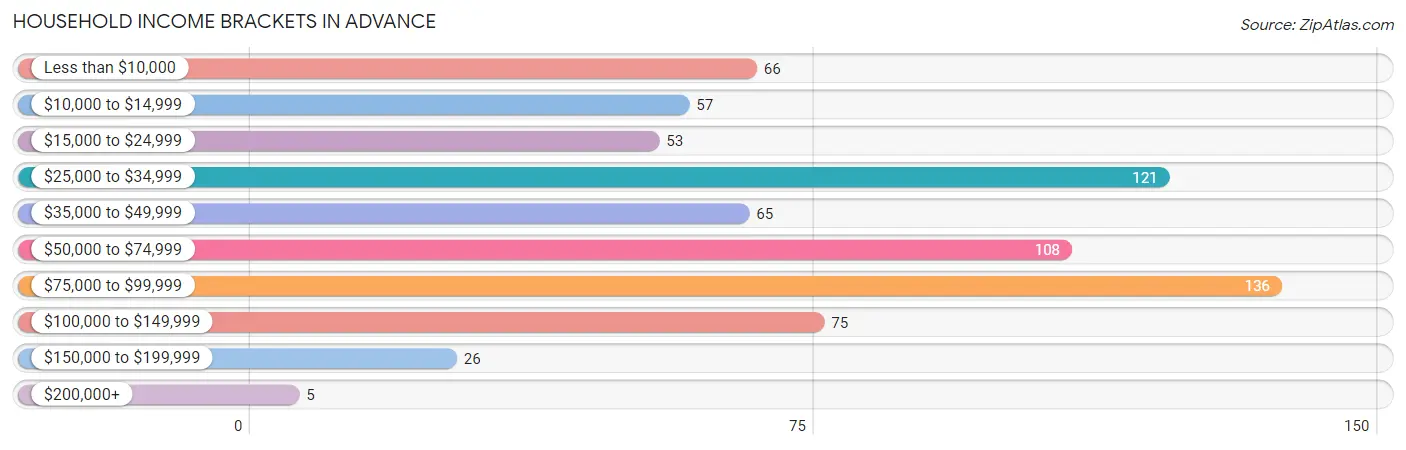
Household Income Brackets in Advance
With 136 households falling in the category, the $75,000 to $99,999 income range is the most frequent in Advance, accounting for 19.1% of all households. In contrast, only 5 households (0.7%) fall into the $200,000+ income bracket, making it the least populous group.
| Income Bracket | # Households | % Households |
| Less than $10,000 | 66 | 9.3% |
| $10,000 to $14,999 | 57 | 8.0% |
| $15,000 to $24,999 | 53 | 7.4% |
| $25,000 to $34,999 | 121 | 17.0% |
| $35,000 to $49,999 | 65 | 9.1% |
| $50,000 to $74,999 | 108 | 15.2% |
| $75,000 to $99,999 | 136 | 19.1% |
| $100,000 to $149,999 | 75 | 10.5% |
| $150,000 to $199,999 | 26 | 3.7% |
| $200,000+ | 5 | 0.7% |
Household Income by Householder Age in Advance
The median household income in Advance is $48,500, with the highest median household income of $77,546 found in the 25 to 44 years age bracket for the primary householder. A total of 223 households (31.3%) fall into this category. Meanwhile, the 15 to 24 years age bracket for the primary householder has the lowest median household income of $0, with 17 households (2.4%) in this group.
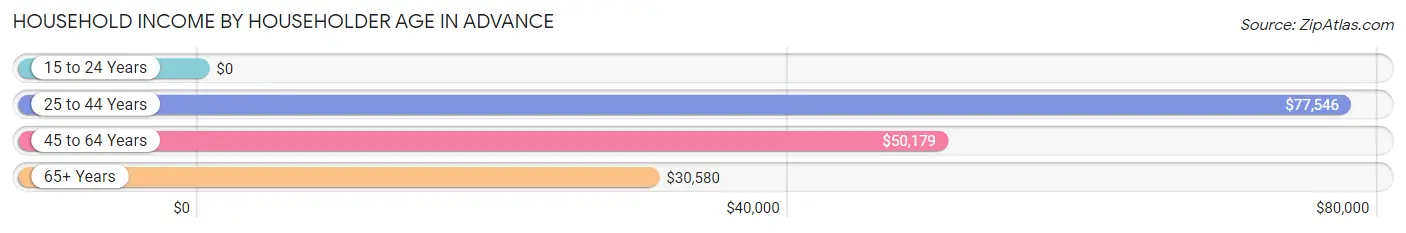
| Income Bracket | # Households | Median Income |
| 15 to 24 Years | 17 (2.4%) | $0 |
| 25 to 44 Years | 223 (31.3%) | $77,546 |
| 45 to 64 Years | 237 (33.3%) | $50,179 |
| 65+ Years | 235 (33.0%) | $30,580 |
| Total | 712 (100.0%) | $48,500 |
Poverty in Advance
Income Below Poverty by Sex and Age in Advance
With 15.2% poverty level for males and 14.8% for females among the residents of Advance, 55 to 64 year old males and 75 year old and over females are the most vulnerable to poverty, with 54 males (32.1%) and 38 females (41.3%) in their respective age groups living below the poverty level.
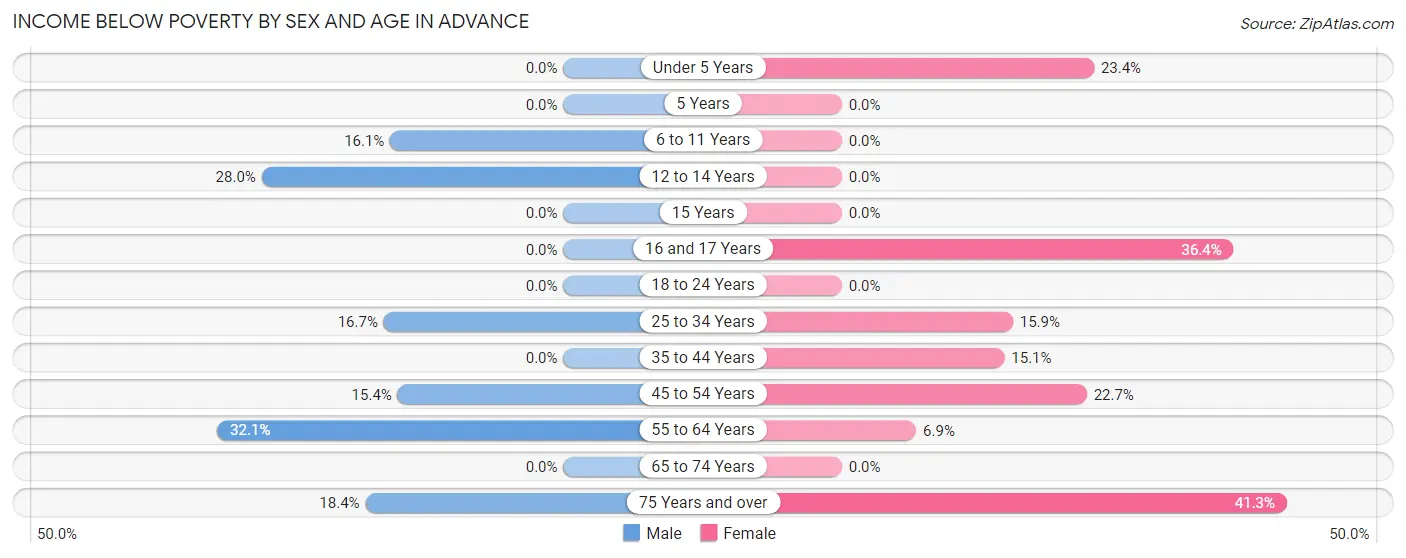
| Age Bracket | Male | Female |
| Under 5 Years | 0 (0.0%) | 11 (23.4%) |
| 5 Years | 0 (0.0%) | 0 (0.0%) |
| 6 to 11 Years | 9 (16.1%) | 0 (0.0%) |
| 12 to 14 Years | 7 (28.0%) | 0 (0.0%) |
| 15 Years | 0 (0.0%) | 0 (0.0%) |
| 16 and 17 Years | 0 (0.0%) | 4 (36.4%) |
| 18 to 24 Years | 0 (0.0%) | 0 (0.0%) |
| 25 to 34 Years | 18 (16.7%) | 20 (15.9%) |
| 35 to 44 Years | 0 (0.0%) | 8 (15.1%) |
| 45 to 54 Years | 10 (15.4%) | 20 (22.7%) |
| 55 to 64 Years | 54 (32.1%) | 6 (6.9%) |
| 65 to 74 Years | 0 (0.0%) | 0 (0.0%) |
| 75 Years and over | 9 (18.4%) | 38 (41.3%) |
| Total | 107 (15.2%) | 107 (14.8%) |
Income Above Poverty by Sex and Age in Advance
According to the poverty statistics in Advance, males aged under 5 years and females aged 5 years are the age groups that are most secure financially, with 100.0% of males and 100.0% of females in these age groups living above the poverty line.
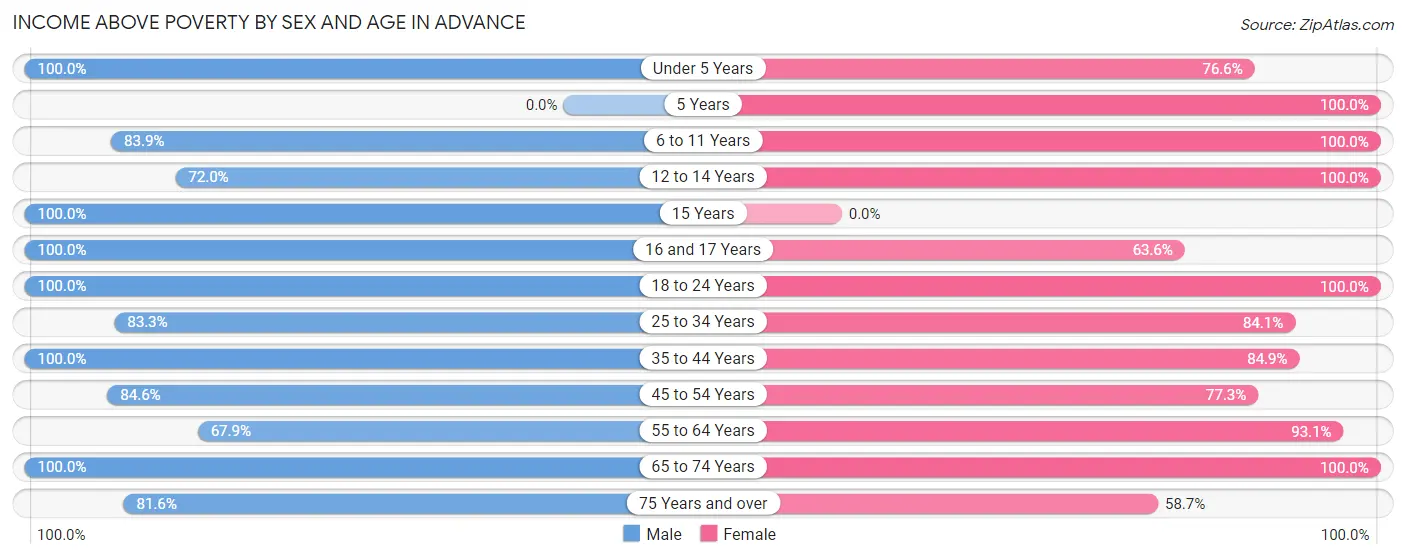
| Age Bracket | Male | Female |
| Under 5 Years | 30 (100.0%) | 36 (76.6%) |
| 5 Years | 0 (0.0%) | 5 (100.0%) |
| 6 to 11 Years | 47 (83.9%) | 12 (100.0%) |
| 12 to 14 Years | 18 (72.0%) | 31 (100.0%) |
| 15 Years | 5 (100.0%) | 0 (0.0%) |
| 16 and 17 Years | 2 (100.0%) | 7 (63.6%) |
| 18 to 24 Years | 45 (100.0%) | 58 (100.0%) |
| 25 to 34 Years | 90 (83.3%) | 106 (84.1%) |
| 35 to 44 Years | 103 (100.0%) | 45 (84.9%) |
| 45 to 54 Years | 55 (84.6%) | 68 (77.3%) |
| 55 to 64 Years | 114 (67.9%) | 81 (93.1%) |
| 65 to 74 Years | 47 (100.0%) | 113 (100.0%) |
| 75 Years and over | 40 (81.6%) | 54 (58.7%) |
| Total | 596 (84.8%) | 616 (85.2%) |
Income Below Poverty Among Married-Couple Families in Advance
The poverty statistics for married-couple families in Advance show that 8.4% or 22 of the total 263 families live below the poverty line. Families with 1 or 2 children have the highest poverty rate of 13.0%, comprising of 14 families. On the other hand, families with 3 or 4 children have the lowest poverty rate of 0.0%, which includes 0 families.
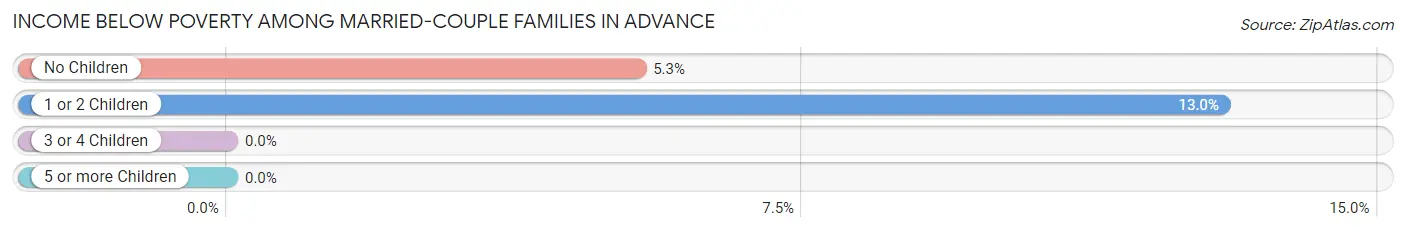
| Children | Above Poverty | Below Poverty |
| No Children | 142 (94.7%) | 8 (5.3%) |
| 1 or 2 Children | 94 (87.0%) | 14 (13.0%) |
| 3 or 4 Children | 5 (100.0%) | 0 (0.0%) |
| 5 or more Children | 0 (0.0%) | 0 (0.0%) |
| Total | 241 (91.6%) | 22 (8.4%) |
Income Below Poverty Among Single-Parent Households in Advance
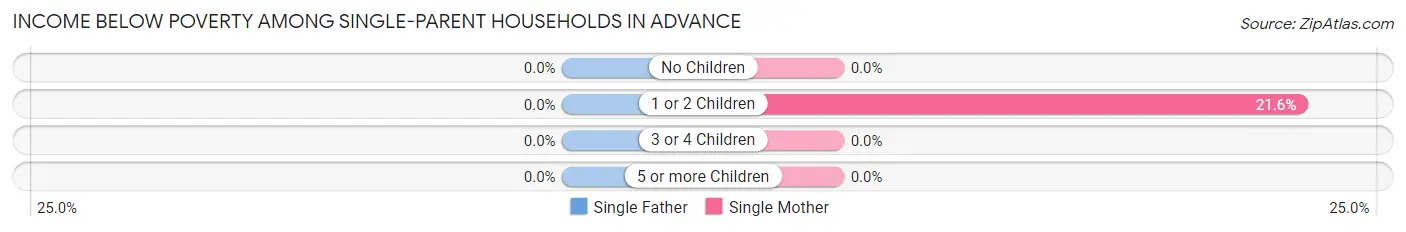
| Children | Single Father | Single Mother |
| No Children | 0 (0.0%) | 0 (0.0%) |
| 1 or 2 Children | 0 (0.0%) | 8 (21.6%) |
| 3 or 4 Children | 0 (0.0%) | 0 (0.0%) |
| 5 or more Children | 0 (0.0%) | 0 (0.0%) |
| Total | 0 (0.0%) | 8 (17.0%) |
Income Below Poverty Among Married-Couple vs Single-Parent Households in Advance
The poverty data for Advance shows that 22 of the married-couple family households (8.4%) and 8 of the single-parent households (11.9%) are living below the poverty level. Within the married-couple family households, those with 1 or 2 children have the highest poverty rate, with 14 households (13.0%) falling below the poverty line. Among the single-parent households, those with 1 or 2 children have the highest poverty rate, with 8 household (17.4%) living below poverty.
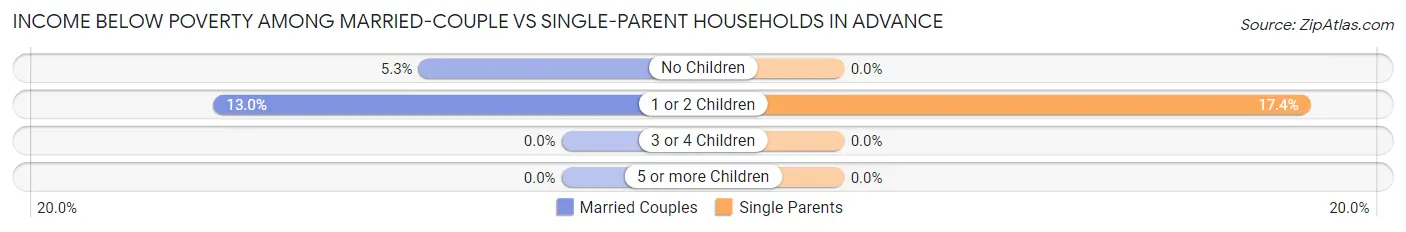
| Children | Married-Couple Families | Single-Parent Households |
| No Children | 8 (5.3%) | 0 (0.0%) |
| 1 or 2 Children | 14 (13.0%) | 8 (17.4%) |
| 3 or 4 Children | 0 (0.0%) | 0 (0.0%) |
| 5 or more Children | 0 (0.0%) | 0 (0.0%) |
| Total | 22 (8.4%) | 8 (11.9%) |
Race in Advance
The most populous races in Advance are White / Caucasian (1,417 | 97.7%), Two or more Races (30 | 2.1%), and Black / African American (4 | 0.3%).
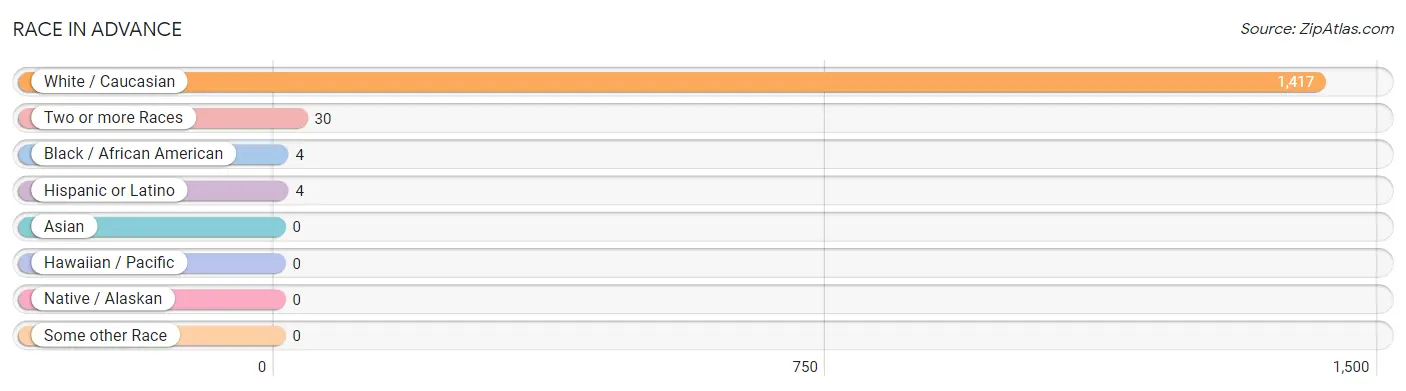
| Race | # Population | % Population |
| Asian | 0 | 0.0% |
| Black / African American | 4 | 0.3% |
| Hawaiian / Pacific | 0 | 0.0% |
| Hispanic or Latino | 4 | 0.3% |
| Native / Alaskan | 0 | 0.0% |
| White / Caucasian | 1,417 | 97.7% |
| Two or more Races | 30 | 2.1% |
| Some other Race | 0 | 0.0% |
| Total | 1,451 | 100.0% |
Ancestry in Advance
The most populous ancestries reported in Advance are American (195 | 13.4%), German (194 | 13.4%), Irish (144 | 9.9%), English (133 | 9.2%), and Dutch (62 | 4.3%), together accounting for 50.2% of all Advance residents.
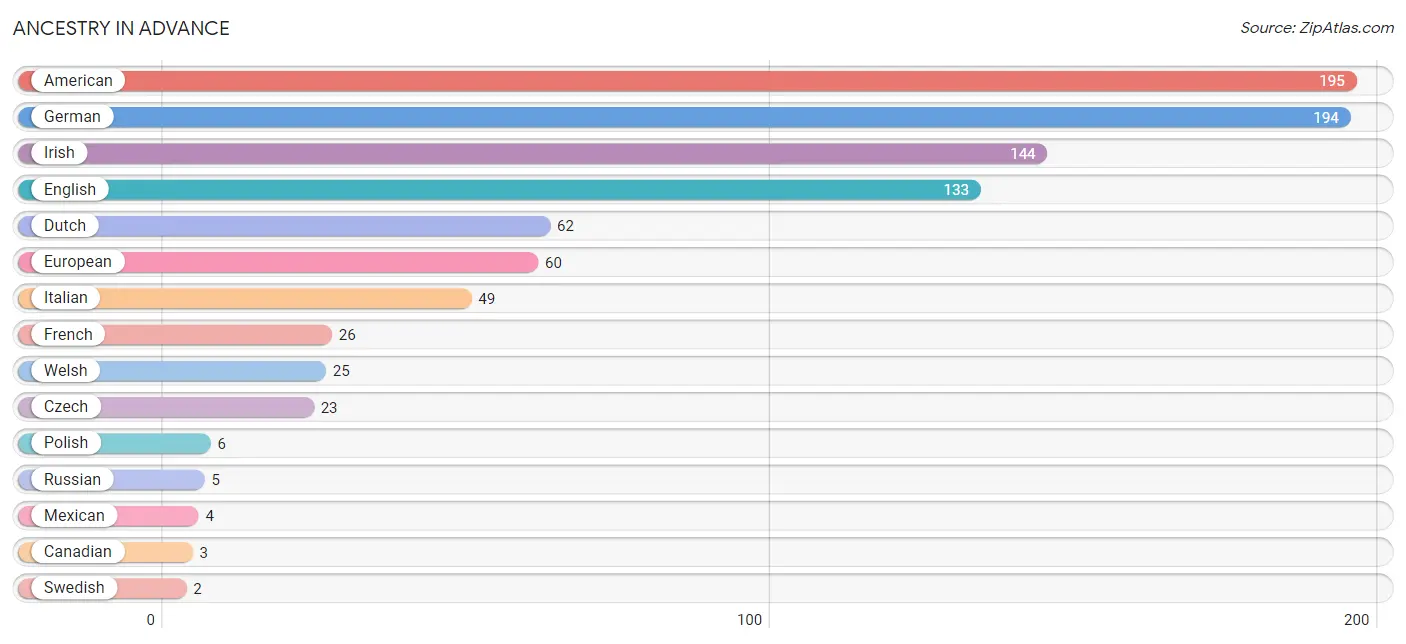
| Ancestry | # Population | % Population |
| American | 195 | 13.4% |
| Canadian | 3 | 0.2% |
| Czech | 23 | 1.6% |
| Dutch | 62 | 4.3% |
| English | 133 | 9.2% |
| European | 60 | 4.1% |
| French | 26 | 1.8% |
| German | 194 | 13.4% |
| Irish | 144 | 9.9% |
| Italian | 49 | 3.4% |
| Mexican | 4 | 0.3% |
| Polish | 6 | 0.4% |
| Russian | 5 | 0.3% |
| Swedish | 2 | 0.1% |
| Welsh | 25 | 1.7% | View All 15 Rows |
Immigrants in Advance
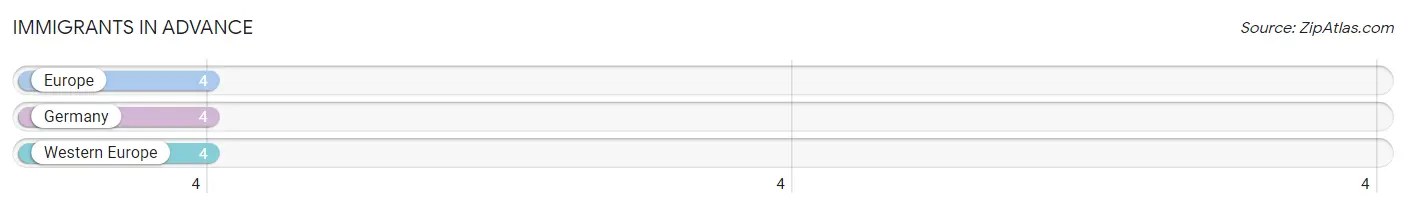
The most numerous immigrant groups reported in Advance came from Europe (4 | 0.3%), Germany (4 | 0.3%), and Western Europe (4 | 0.3%), together accounting for 0.8% of all Advance residents.
| Immigration Origin | # Population | % Population |
| Europe | 4 | 0.3% |
| Germany | 4 | 0.3% |
| Western Europe | 4 | 0.3% | View All 3 Rows |
Sex and Age in Advance
Sex and Age in Advance
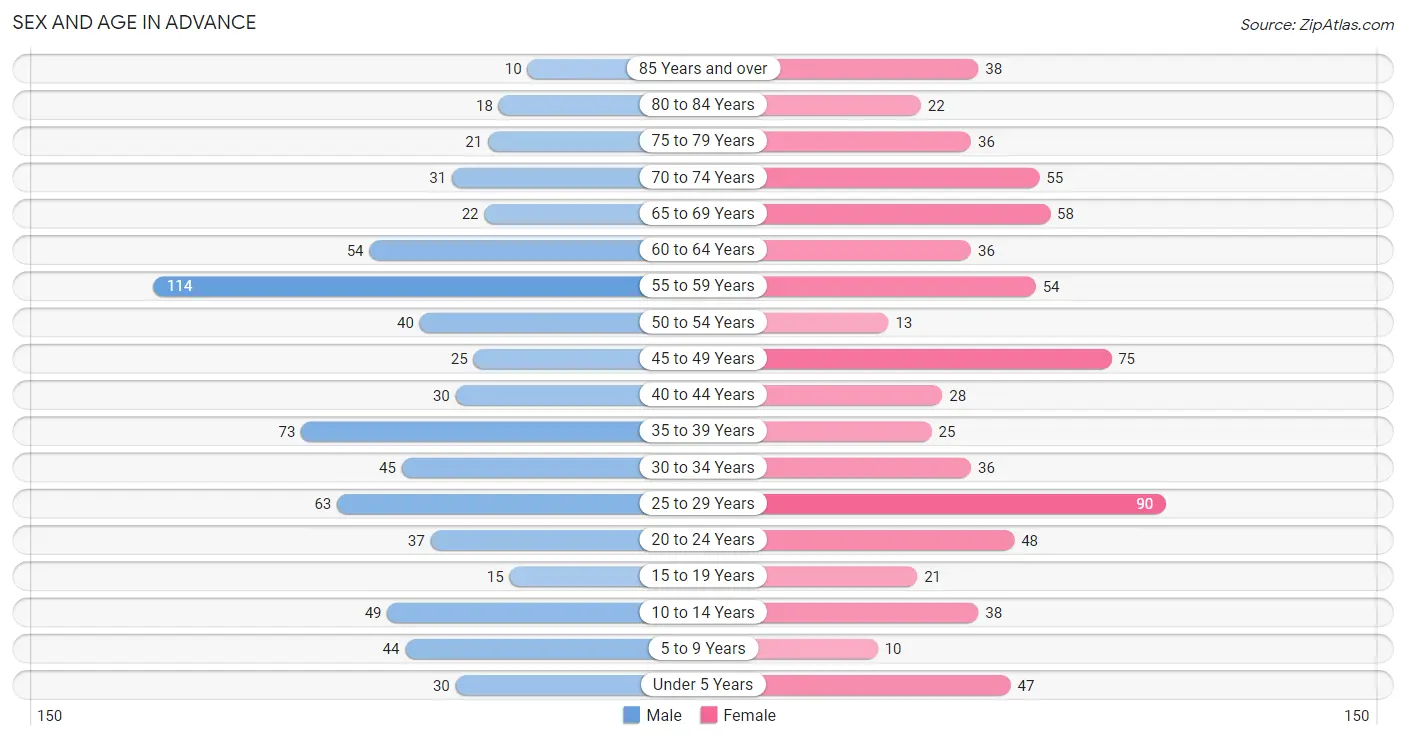
The most populous age groups in Advance are 55 to 59 Years (114 | 15.8%) for men and 25 to 29 Years (90 | 12.3%) for women.
| Age Bracket | Male | Female |
| Under 5 Years | 30 (4.2%) | 47 (6.4%) |
| 5 to 9 Years | 44 (6.1%) | 10 (1.4%) |
| 10 to 14 Years | 49 (6.8%) | 38 (5.2%) |
| 15 to 19 Years | 15 (2.1%) | 21 (2.9%) |
| 20 to 24 Years | 37 (5.1%) | 48 (6.6%) |
| 25 to 29 Years | 63 (8.7%) | 90 (12.3%) |
| 30 to 34 Years | 45 (6.2%) | 36 (4.9%) |
| 35 to 39 Years | 73 (10.1%) | 25 (3.4%) |
| 40 to 44 Years | 30 (4.2%) | 28 (3.8%) |
| 45 to 49 Years | 25 (3.5%) | 75 (10.3%) |
| 50 to 54 Years | 40 (5.6%) | 13 (1.8%) |
| 55 to 59 Years | 114 (15.8%) | 54 (7.4%) |
| 60 to 64 Years | 54 (7.5%) | 36 (4.9%) |
| 65 to 69 Years | 22 (3.0%) | 58 (8.0%) |
| 70 to 74 Years | 31 (4.3%) | 55 (7.5%) |
| 75 to 79 Years | 21 (2.9%) | 36 (4.9%) |
| 80 to 84 Years | 18 (2.5%) | 22 (3.0%) |
| 85 Years and over | 10 (1.4%) | 38 (5.2%) |
| Total | 721 (100.0%) | 730 (100.0%) |
Families and Households in Advance
Median Family Size in Advance
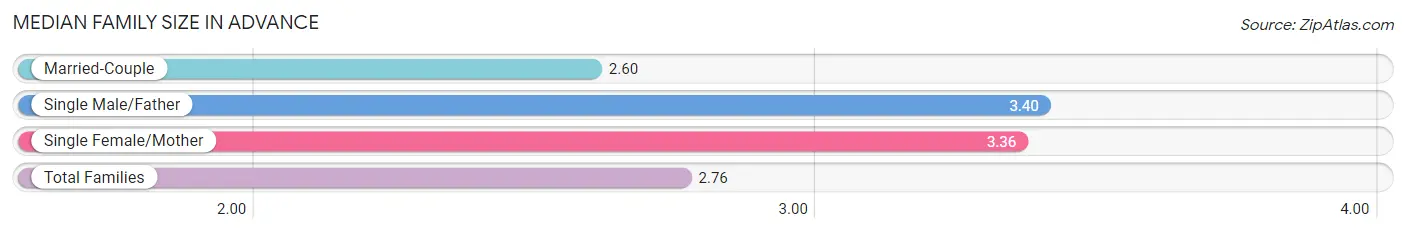
The median family size in Advance is 2.76 persons per family, with single male/father families (20 | 6.1%) accounting for the largest median family size of 3.4 persons per family. On the other hand, married-couple families (263 | 79.7%) represent the smallest median family size with 2.60 persons per family.
| Family Type | # Families | Family Size |
| Married-Couple | 263 (79.7%) | 2.60 |
| Single Male/Father | 20 (6.1%) | 3.40 |
| Single Female/Mother | 47 (14.2%) | 3.36 |
| Total Families | 330 (100.0%) | 2.76 |
Median Household Size in Advance
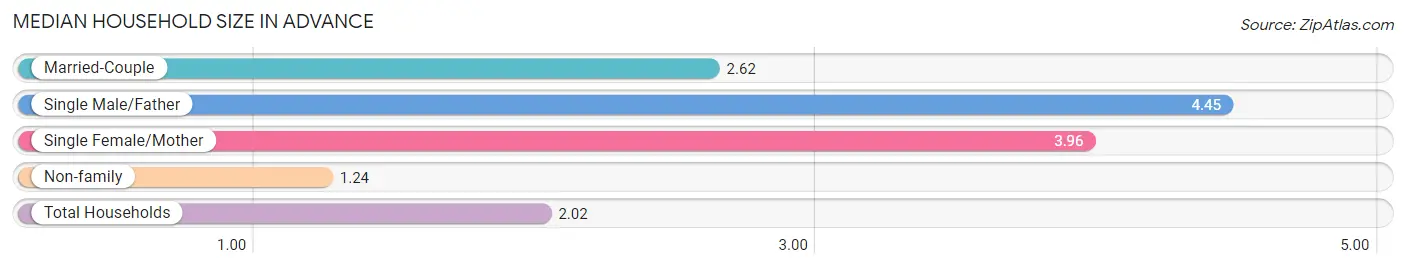
The median household size in Advance is 2.02 persons per household, with single male/father households (20 | 2.8%) accounting for the largest median household size of 4.45 persons per household. non-family households (382 | 53.6%) represent the smallest median household size with 1.24 persons per household.
| Household Type | # Households | Household Size |
| Married-Couple | 263 (36.9%) | 2.62 |
| Single Male/Father | 20 (2.8%) | 4.45 |
| Single Female/Mother | 47 (6.6%) | 3.96 |
| Non-family | 382 (53.6%) | 1.24 |
| Total Households | 712 (100.0%) | 2.02 |
Household Size by Marriage Status in Advance
Out of a total of 712 households in Advance, 330 (46.4%) are family households, while 382 (53.6%) are nonfamily households. The most numerous type of family households are 2-person households, comprising 147, and the most common type of nonfamily households are 1-person households, comprising 289.
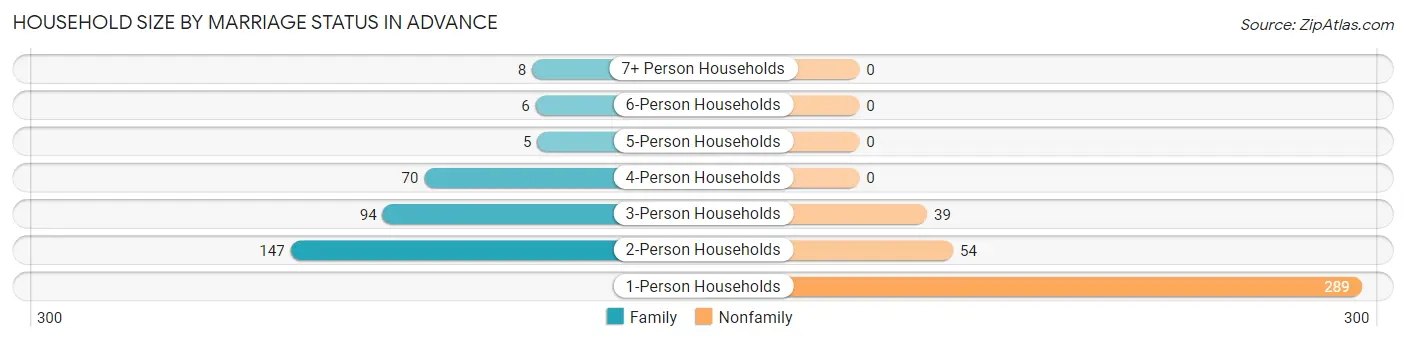
| Household Size | Family Households | Nonfamily Households |
| 1-Person Households | - | 289 (40.6%) |
| 2-Person Households | 147 (20.6%) | 54 (7.6%) |
| 3-Person Households | 94 (13.2%) | 39 (5.5%) |
| 4-Person Households | 70 (9.8%) | 0 (0.0%) |
| 5-Person Households | 5 (0.7%) | 0 (0.0%) |
| 6-Person Households | 6 (0.8%) | 0 (0.0%) |
| 7+ Person Households | 8 (1.1%) | 0 (0.0%) |
| Total | 330 (46.4%) | 382 (53.6%) |
Female Fertility in Advance
Fertility by Age in Advance
Average fertility rate in Advance is 43.0 births per 1,000 women. Women in the age bracket of 20 to 34 years have the highest fertility rate with 80.0 births per 1,000 women. Women in the age bracket of 20 to 34 years acount for 100.0% of all women with births.
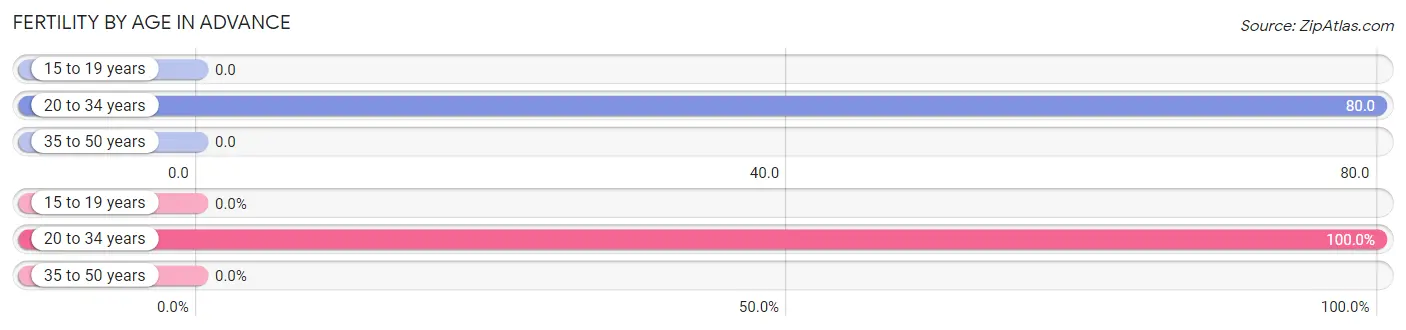
| Age Bracket | Women with Births | Births / 1,000 Women |
| 15 to 19 years | 0 (0.0%) | 0.0 |
| 20 to 34 years | 14 (100.0%) | 80.0 |
| 35 to 50 years | 0 (0.0%) | 0.0 |
| Total | 14 (100.0%) | 43.0 |
Fertility by Age by Marriage Status in Advance
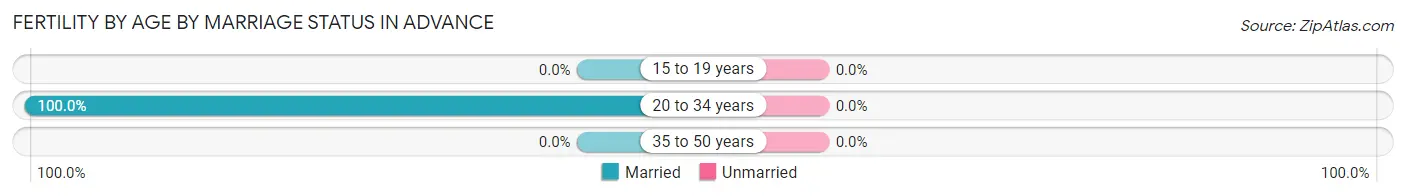
| Age Bracket | Married | Unmarried |
| 15 to 19 years | 0 (0.0%) | 0 (0.0%) |
| 20 to 34 years | 14 (100.0%) | 0 (0.0%) |
| 35 to 50 years | 0 (0.0%) | 0 (0.0%) |
| Total | 14 (100.0%) | 0 (0.0%) |
Fertility by Education in Advance
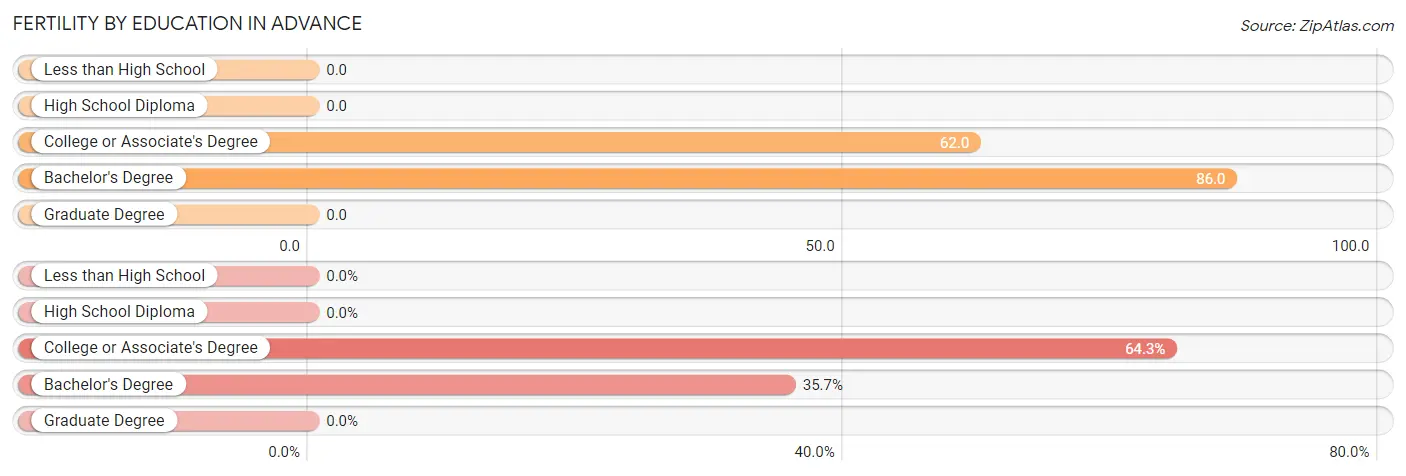
| Educational Attainment | Women with Births | Births / 1,000 Women |
| Less than High School | 0 (0.0%) | 0.0 |
| High School Diploma | 0 (0.0%) | 0.0 |
| College or Associate's Degree | 9 (64.3%) | 62.0 |
| Bachelor's Degree | 5 (35.7%) | 86.0 |
| Graduate Degree | 0 (0.0%) | 0.0 |
| Total | 14 (100.0%) | 43.0 |
Fertility by Education by Marriage Status in Advance
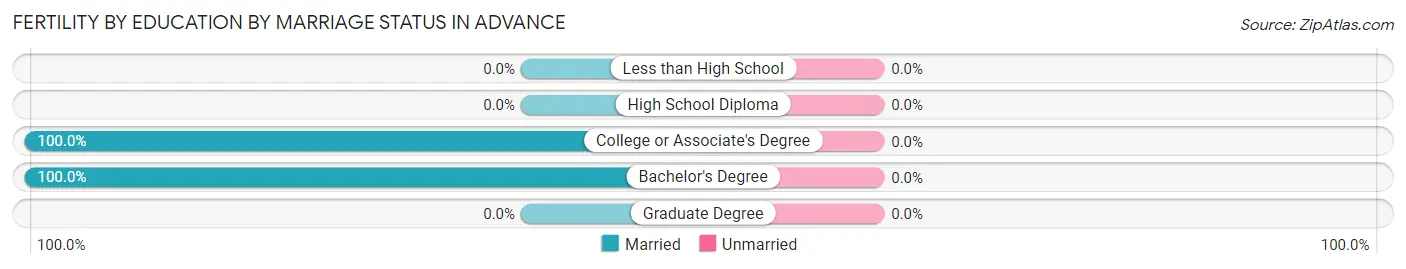
| Educational Attainment | Married | Unmarried |
| Less than High School | 0 (0.0%) | 0 (0.0%) |
| High School Diploma | 0 (0.0%) | 0 (0.0%) |
| College or Associate's Degree | 9 (100.0%) | 0 (0.0%) |
| Bachelor's Degree | 5 (100.0%) | 0 (0.0%) |
| Graduate Degree | 0 (0.0%) | 0 (0.0%) |
| Total | 14 (100.0%) | 0 (0.0%) |
Employment Characteristics in Advance
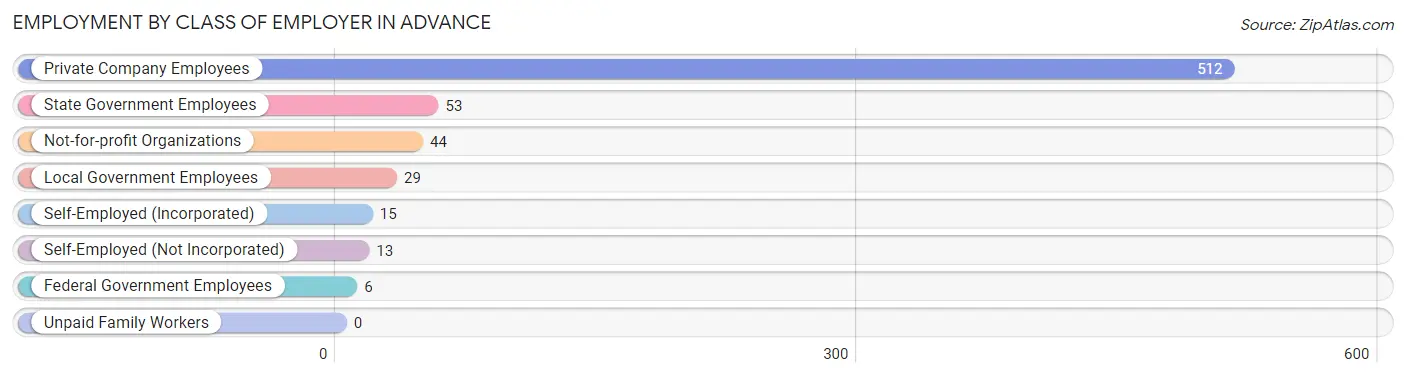
Employment by Class of Employer in Advance
Among the 672 employed individuals in Advance, private company employees (512 | 76.2%), state government employees (53 | 7.9%), and not-for-profit organizations (44 | 6.6%) make up the most common classes of employment.
| Employer Class | # Employees | % Employees |
| Private Company Employees | 512 | 76.2% |
| Self-Employed (Incorporated) | 15 | 2.2% |
| Self-Employed (Not Incorporated) | 13 | 1.9% |
| Not-for-profit Organizations | 44 | 6.6% |
| Local Government Employees | 29 | 4.3% |
| State Government Employees | 53 | 7.9% |
| Federal Government Employees | 6 | 0.9% |
| Unpaid Family Workers | 0 | 0.0% |
| Total | 672 | 100.0% |
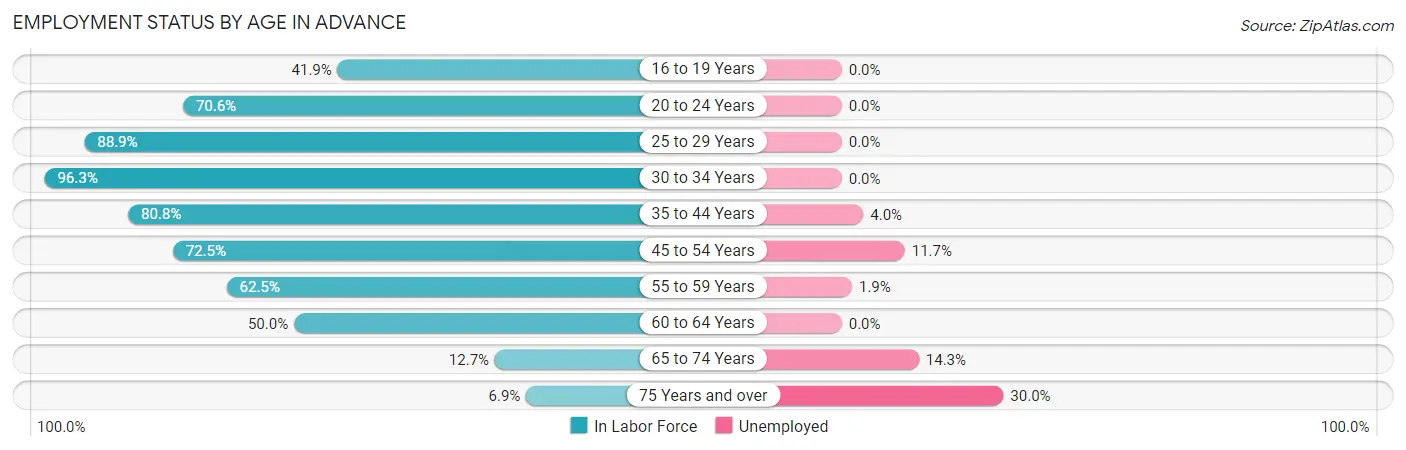
Employment Status by Age in Advance
According to the labor force statistics for Advance, out of the total population over 16 years of age (1,228), 57.4% or 705 individuals are in the labor force, with 3.7% or 26 of them unemployed. The age group with the highest labor force participation rate is 30 to 34 years, with 96.3% or 78 individuals in the labor force. Within the labor force, the 75 years and over age range has the highest percentage of unemployed individuals, with 30.0% or 3 of them being unemployed.
| Age Bracket | In Labor Force | Unemployed |
| 16 to 19 Years | 13 (41.9%) | 0 (0.0%) |
| 20 to 24 Years | 60 (70.6%) | 0 (0.0%) |
| 25 to 29 Years | 136 (88.9%) | 0 (0.0%) |
| 30 to 34 Years | 78 (96.3%) | 0 (0.0%) |
| 35 to 44 Years | 126 (80.8%) | 5 (4.0%) |
| 45 to 54 Years | 111 (72.5%) | 13 (11.7%) |
| 55 to 59 Years | 105 (62.5%) | 2 (1.9%) |
| 60 to 64 Years | 45 (50.0%) | 0 (0.0%) |
| 65 to 74 Years | 21 (12.7%) | 3 (14.3%) |
| 75 Years and over | 10 (6.9%) | 3 (30.0%) |
| Total | 705 (57.4%) | 26 (3.7%) |
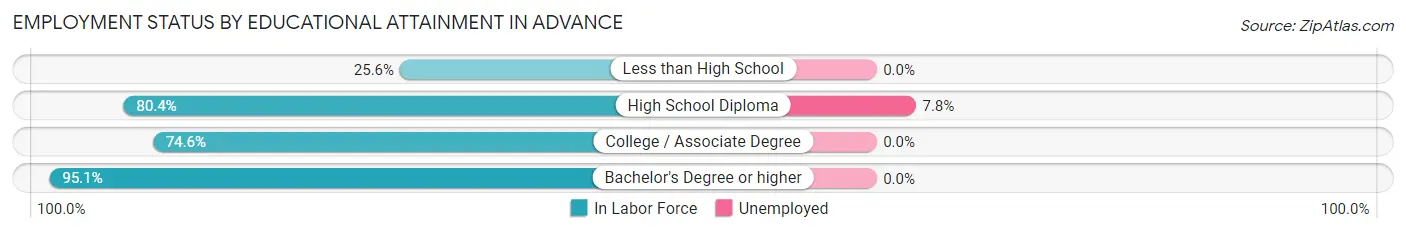
Employment Status by Educational Attainment in Advance
According to labor force statistics for Advance, 75.0% of individuals (601) out of the total population between 25 and 64 years of age (801) are in the labor force, with 3.3% or 20 of them being unemployed. The group with the highest labor force participation rate are those with the educational attainment of bachelor's degree or higher, with 95.1% or 135 individuals in the labor force. Within the labor force, individuals with high school diploma education have the highest percentage of unemployment, with 7.8% or 20 of them being unemployed.
| Educational Attainment | In Labor Force | Unemployed |
| Less than High School | 23 (25.6%) | 0 (0.0%) |
| High School Diploma | 258 (80.4%) | 25 (7.8%) |
| College / Associate Degree | 185 (74.6%) | 0 (0.0%) |
| Bachelor's Degree or higher | 135 (95.1%) | 0 (0.0%) |
| Total | 601 (75.0%) | 26 (3.3%) |
Employment Occupations by Sex in Advance
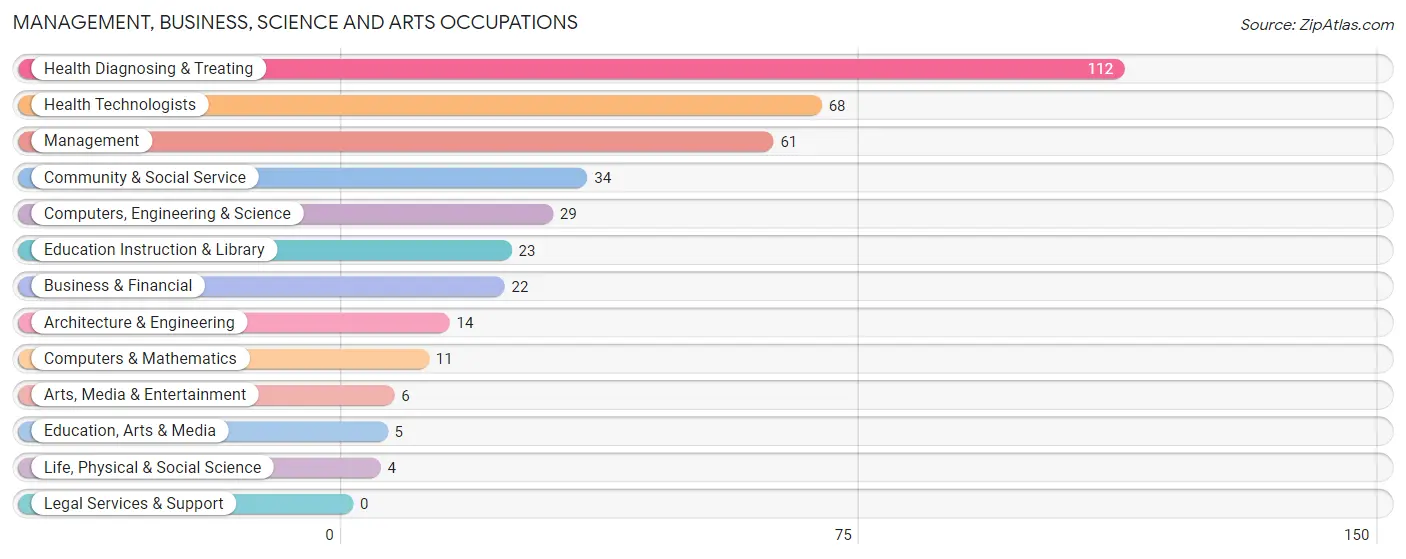
Management, Business, Science and Arts Occupations
The most common Management, Business, Science and Arts occupations in Advance are Health Diagnosing & Treating (112 | 16.5%), Health Technologists (68 | 10.0%), Management (61 | 9.0%), Community & Social Service (34 | 5.0%), and Computers, Engineering & Science (29 | 4.3%).
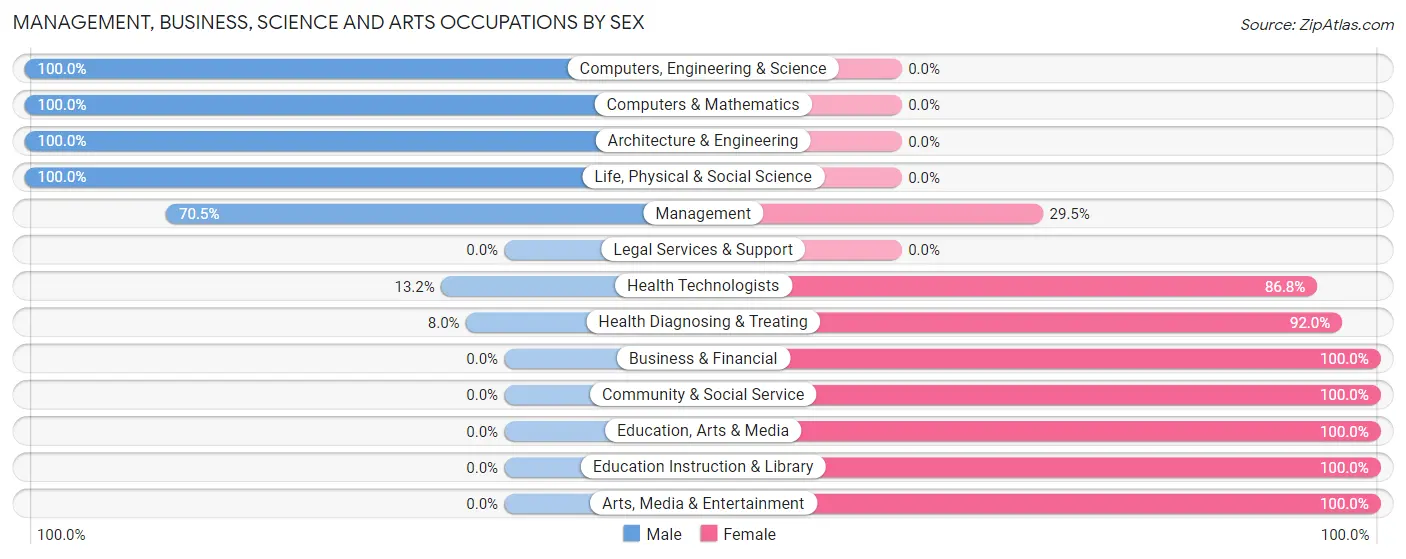
Management, Business, Science and Arts Occupations by Sex
Within the Management, Business, Science and Arts occupations in Advance, the most male-oriented occupations are Computers, Engineering & Science (100.0%), Computers & Mathematics (100.0%), and Architecture & Engineering (100.0%), while the most female-oriented occupations are Business & Financial (100.0%), Community & Social Service (100.0%), and Education, Arts & Media (100.0%).
| Occupation | Male | Female |
| Management | 43 (70.5%) | 18 (29.5%) |
| Business & Financial | 0 (0.0%) | 22 (100.0%) |
| Computers, Engineering & Science | 29 (100.0%) | 0 (0.0%) |
| Computers & Mathematics | 11 (100.0%) | 0 (0.0%) |
| Architecture & Engineering | 14 (100.0%) | 0 (0.0%) |
| Life, Physical & Social Science | 4 (100.0%) | 0 (0.0%) |
| Community & Social Service | 0 (0.0%) | 34 (100.0%) |
| Education, Arts & Media | 0 (0.0%) | 5 (100.0%) |
| Legal Services & Support | 0 (0.0%) | 0 (0.0%) |
| Education Instruction & Library | 0 (0.0%) | 23 (100.0%) |
| Arts, Media & Entertainment | 0 (0.0%) | 6 (100.0%) |
| Health Diagnosing & Treating | 9 (8.0%) | 103 (92.0%) |
| Health Technologists | 9 (13.2%) | 59 (86.8%) |
| Total (Category) | 81 (31.4%) | 177 (68.6%) |
| Total (Overall) | 367 (54.0%) | 312 (46.0%) |
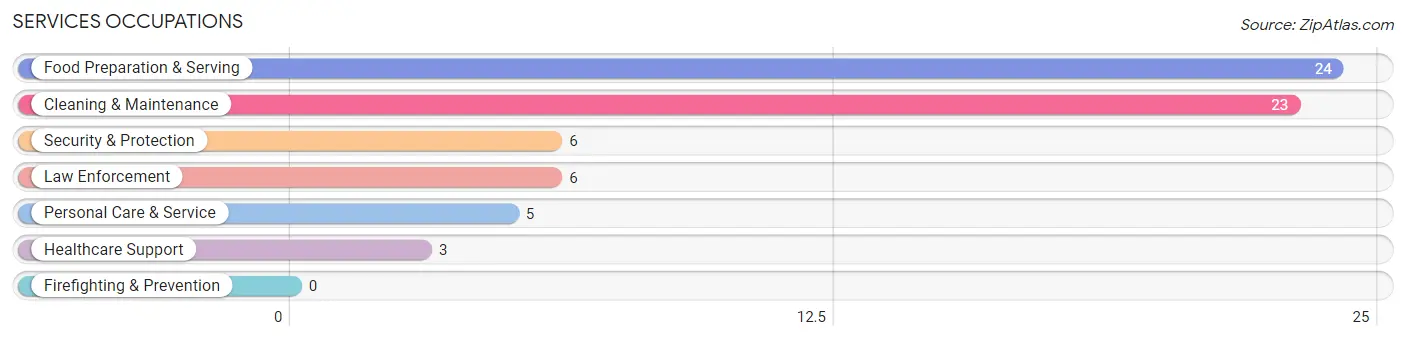
Services Occupations
The most common Services occupations in Advance are Food Preparation & Serving (24 | 3.5%), Cleaning & Maintenance (23 | 3.4%), Security & Protection (6 | 0.9%), Law Enforcement (6 | 0.9%), and Personal Care & Service (5 | 0.7%).
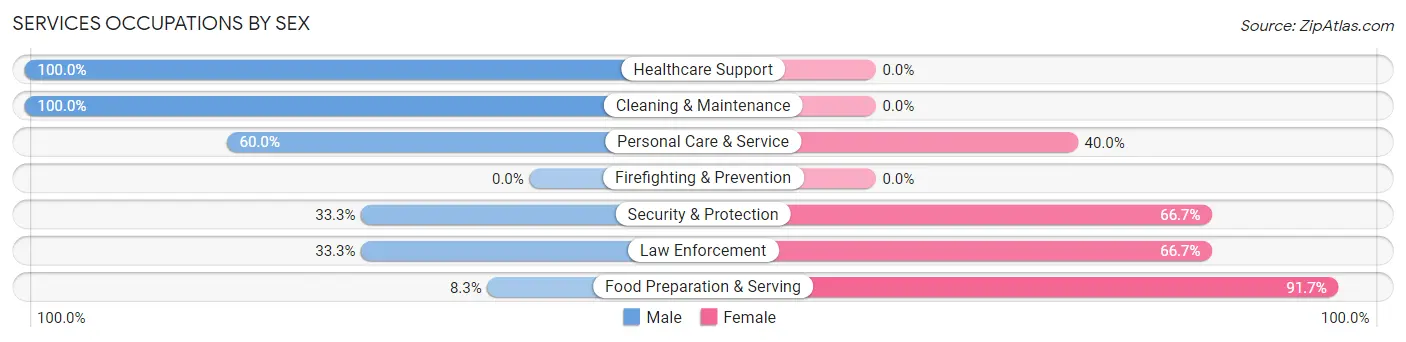
Services Occupations by Sex
Within the Services occupations in Advance, the most male-oriented occupations are Healthcare Support (100.0%), Cleaning & Maintenance (100.0%), and Personal Care & Service (60.0%), while the most female-oriented occupations are Food Preparation & Serving (91.7%), Security & Protection (66.7%), and Law Enforcement (66.7%).
| Occupation | Male | Female |
| Healthcare Support | 3 (100.0%) | 0 (0.0%) |
| Security & Protection | 2 (33.3%) | 4 (66.7%) |
| Firefighting & Prevention | 0 (0.0%) | 0 (0.0%) |
| Law Enforcement | 2 (33.3%) | 4 (66.7%) |
| Food Preparation & Serving | 2 (8.3%) | 22 (91.7%) |
| Cleaning & Maintenance | 23 (100.0%) | 0 (0.0%) |
| Personal Care & Service | 3 (60.0%) | 2 (40.0%) |
| Total (Category) | 33 (54.1%) | 28 (45.9%) |
| Total (Overall) | 367 (54.0%) | 312 (46.0%) |
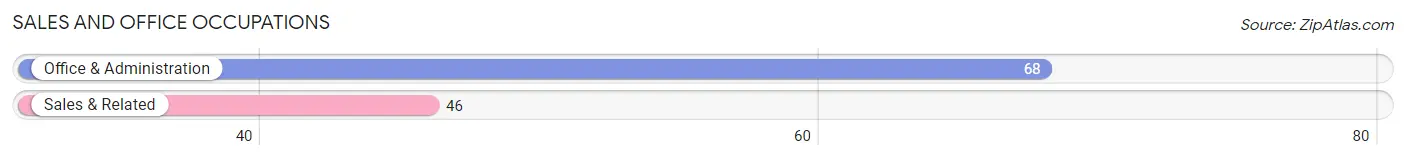
Sales and Office Occupations
The most common Sales and Office occupations in Advance are Office & Administration (68 | 10.0%), and Sales & Related (46 | 6.8%).
Sales and Office Occupations by Sex
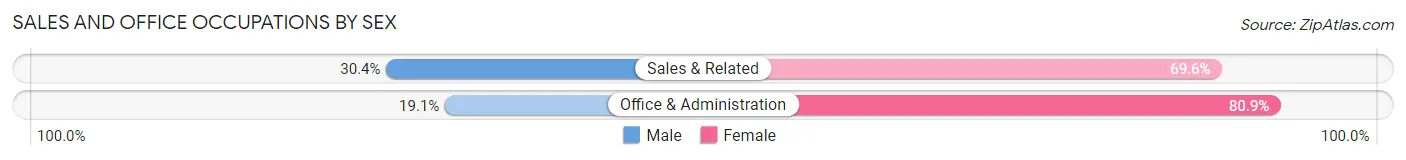
| Occupation | Male | Female |
| Sales & Related | 14 (30.4%) | 32 (69.6%) |
| Office & Administration | 13 (19.1%) | 55 (80.9%) |
| Total (Category) | 27 (23.7%) | 87 (76.3%) |
| Total (Overall) | 367 (54.0%) | 312 (46.0%) |
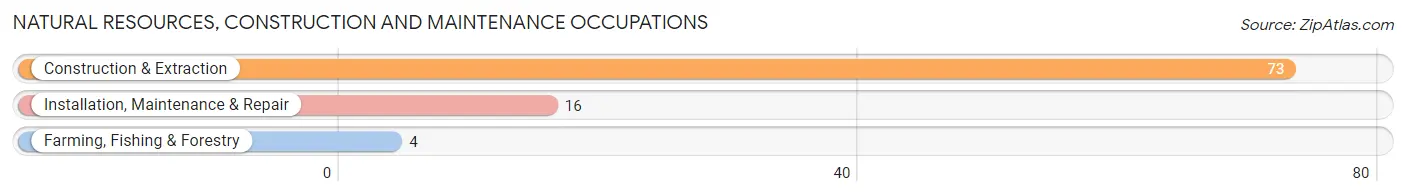
Natural Resources, Construction and Maintenance Occupations
The most common Natural Resources, Construction and Maintenance occupations in Advance are Construction & Extraction (73 | 10.7%), Installation, Maintenance & Repair (16 | 2.4%), and Farming, Fishing & Forestry (4 | 0.6%).
Natural Resources, Construction and Maintenance Occupations by Sex
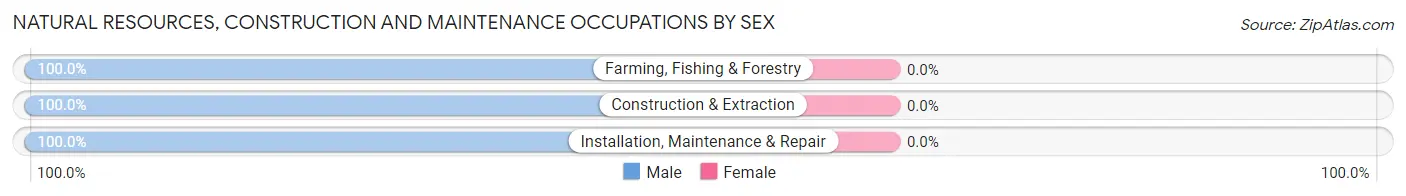
| Occupation | Male | Female |
| Farming, Fishing & Forestry | 4 (100.0%) | 0 (0.0%) |
| Construction & Extraction | 73 (100.0%) | 0 (0.0%) |
| Installation, Maintenance & Repair | 16 (100.0%) | 0 (0.0%) |
| Total (Category) | 93 (100.0%) | 0 (0.0%) |
| Total (Overall) | 367 (54.0%) | 312 (46.0%) |
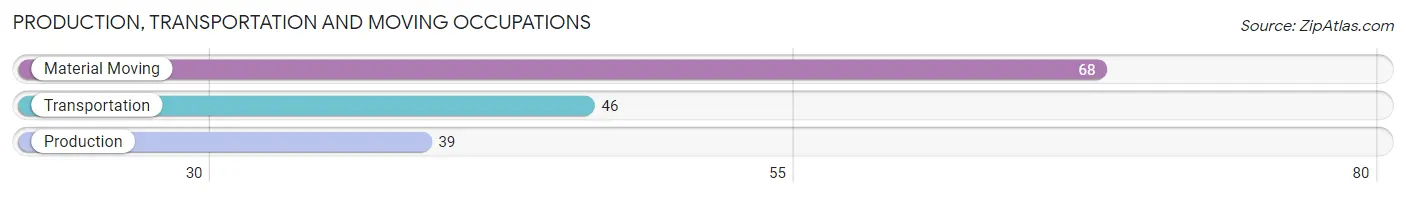
Production, Transportation and Moving Occupations
The most common Production, Transportation and Moving occupations in Advance are Material Moving (68 | 10.0%), Transportation (46 | 6.8%), and Production (39 | 5.7%).
Production, Transportation and Moving Occupations by Sex
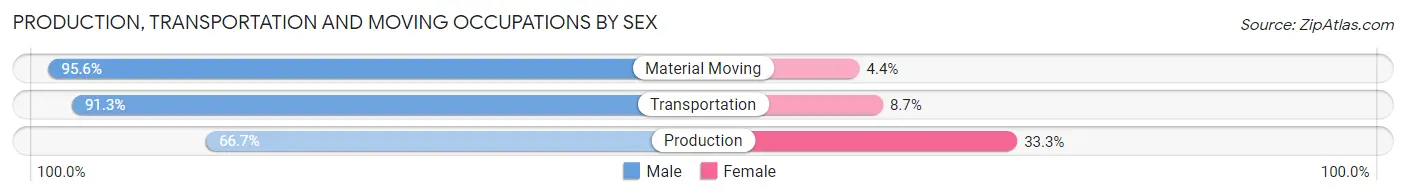
| Occupation | Male | Female |
| Production | 26 (66.7%) | 13 (33.3%) |
| Transportation | 42 (91.3%) | 4 (8.7%) |
| Material Moving | 65 (95.6%) | 3 (4.4%) |
| Total (Category) | 133 (86.9%) | 20 (13.1%) |
| Total (Overall) | 367 (54.0%) | 312 (46.0%) |
Employment Industries by Sex in Advance
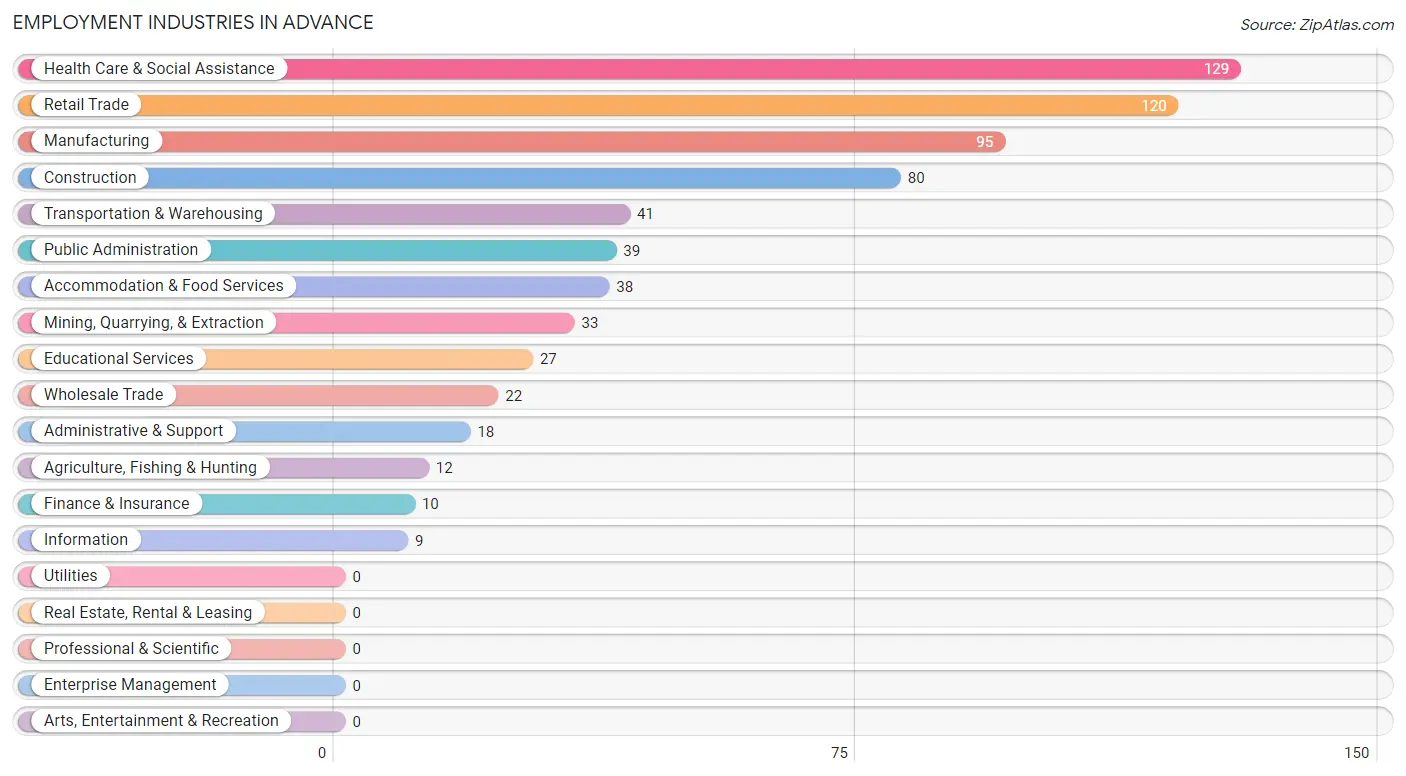
Employment Industries in Advance
The major employment industries in Advance include Health Care & Social Assistance (129 | 19.0%), Retail Trade (120 | 17.7%), Manufacturing (95 | 14.0%), Construction (80 | 11.8%), and Transportation & Warehousing (41 | 6.0%).
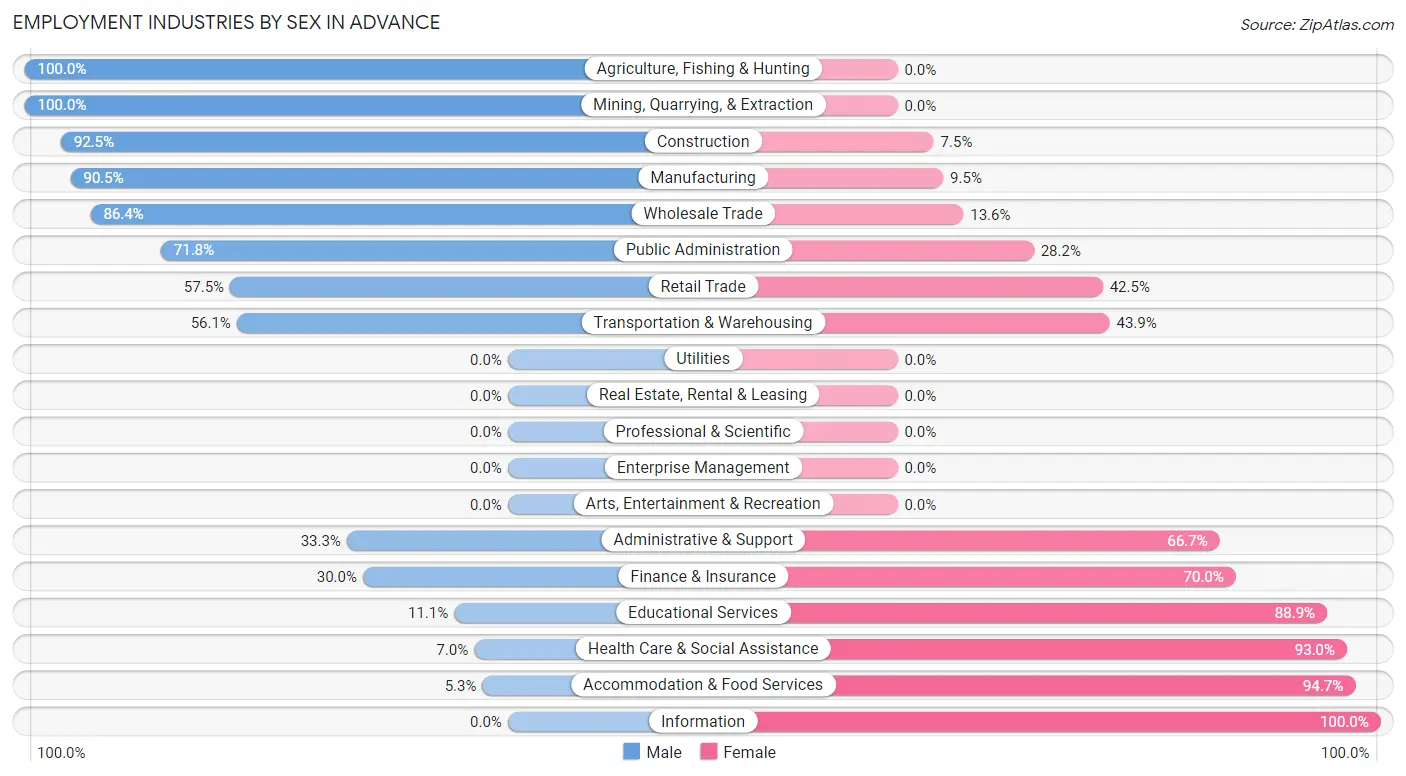
Employment Industries by Sex in Advance
The Advance industries that see more men than women are Agriculture, Fishing & Hunting (100.0%), Mining, Quarrying, & Extraction (100.0%), and Construction (92.5%), whereas the industries that tend to have a higher number of women are Information (100.0%), Accommodation & Food Services (94.7%), and Health Care & Social Assistance (93.0%).
| Industry | Male | Female |
| Agriculture, Fishing & Hunting | 12 (100.0%) | 0 (0.0%) |
| Mining, Quarrying, & Extraction | 33 (100.0%) | 0 (0.0%) |
| Construction | 74 (92.5%) | 6 (7.5%) |
| Manufacturing | 86 (90.5%) | 9 (9.5%) |
| Wholesale Trade | 19 (86.4%) | 3 (13.6%) |
| Retail Trade | 69 (57.5%) | 51 (42.5%) |
| Transportation & Warehousing | 23 (56.1%) | 18 (43.9%) |
| Utilities | 0 (0.0%) | 0 (0.0%) |
| Information | 0 (0.0%) | 9 (100.0%) |
| Finance & Insurance | 3 (30.0%) | 7 (70.0%) |
| Real Estate, Rental & Leasing | 0 (0.0%) | 0 (0.0%) |
| Professional & Scientific | 0 (0.0%) | 0 (0.0%) |
| Enterprise Management | 0 (0.0%) | 0 (0.0%) |
| Administrative & Support | 6 (33.3%) | 12 (66.7%) |
| Educational Services | 3 (11.1%) | 24 (88.9%) |
| Health Care & Social Assistance | 9 (7.0%) | 120 (93.0%) |
| Arts, Entertainment & Recreation | 0 (0.0%) | 0 (0.0%) |
| Accommodation & Food Services | 2 (5.3%) | 36 (94.7%) |
| Public Administration | 28 (71.8%) | 11 (28.2%) |
| Total | 367 (54.0%) | 312 (46.0%) |
Education in Advance
School Enrollment in Advance
The most common levels of schooling among the 237 students in Advance are elementary school (64 | 27.0%), middle school (54 | 22.8%), and college / undergraduate (54 | 22.8%).
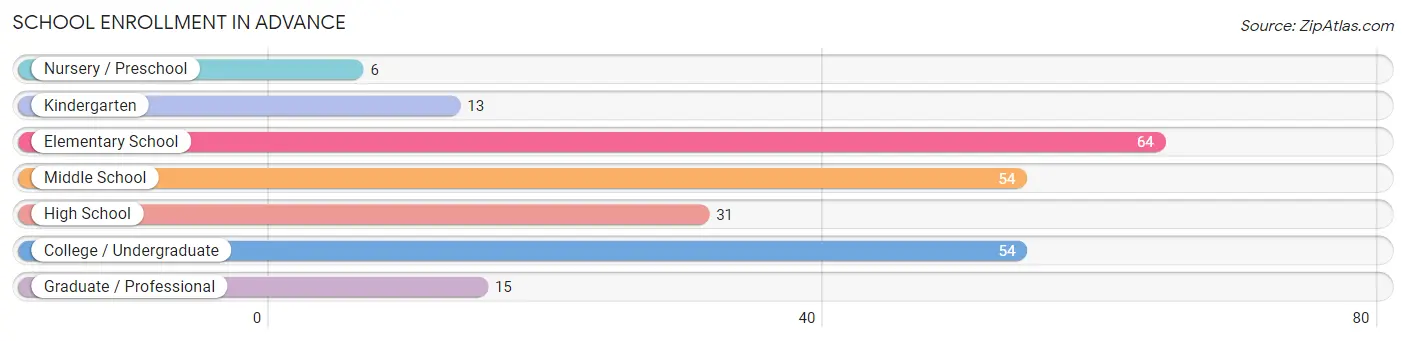
| School Level | # Students | % Students |
| Nursery / Preschool | 6 | 2.5% |
| Kindergarten | 13 | 5.5% |
| Elementary School | 64 | 27.0% |
| Middle School | 54 | 22.8% |
| High School | 31 | 13.1% |
| College / Undergraduate | 54 | 22.8% |
| Graduate / Professional | 15 | 6.3% |
| Total | 237 | 100.0% |
School Enrollment by Age by Funding Source in Advance
Out of a total of 237 students who are enrolled in schools in Advance, 22 (9.3%) attend a private institution, while the remaining 215 (90.7%) are enrolled in public schools. The age group of 18 to 19 year olds has the highest likelihood of being enrolled in private schools, with 6 (46.2% in the age bracket) enrolled. Conversely, the age group of 3 to 4 year olds has the lowest likelihood of being enrolled in a private school, with 6 (100.0% in the age bracket) attending a public institution.
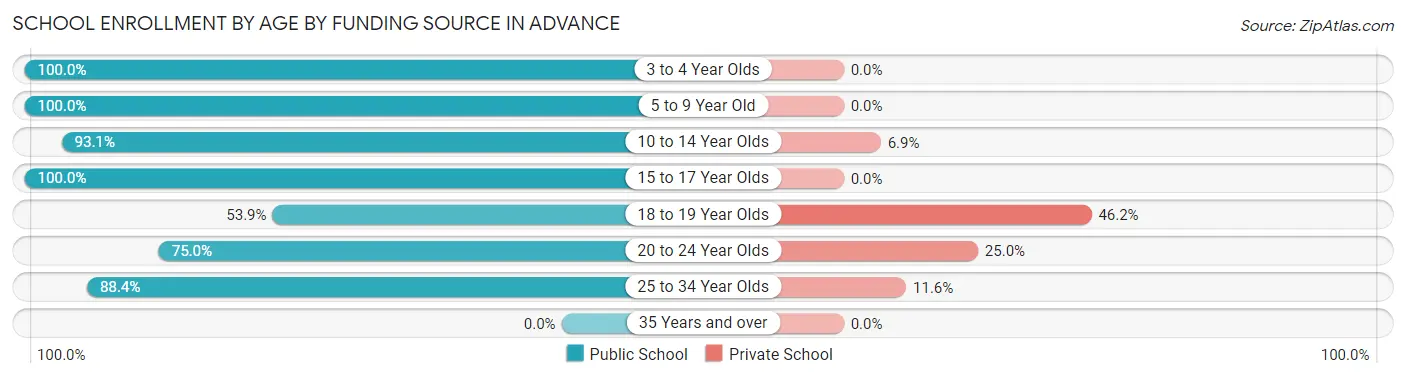
| Age Bracket | Public School | Private School |
| 3 to 4 Year Olds | 6 (100.0%) | 0 (0.0%) |
| 5 to 9 Year Old | 50 (100.0%) | 0 (0.0%) |
| 10 to 14 Year Olds | 81 (93.1%) | 6 (6.9%) |
| 15 to 17 Year Olds | 18 (100.0%) | 0 (0.0%) |
| 18 to 19 Year Olds | 7 (53.8%) | 6 (46.2%) |
| 20 to 24 Year Olds | 15 (75.0%) | 5 (25.0%) |
| 25 to 34 Year Olds | 38 (88.4%) | 5 (11.6%) |
| 35 Years and over | 0 (0.0%) | 0 (0.0%) |
| Total | 215 (90.7%) | 22 (9.3%) |
Educational Attainment by Field of Study in Advance
Education (83 | 43.0%), science & technology (26 | 13.5%), liberal arts & history (26 | 13.5%), business (20 | 10.4%), and physical & health sciences (10 | 5.2%) are the most common fields of study among 193 individuals in Advance who have obtained a bachelor's degree or higher.
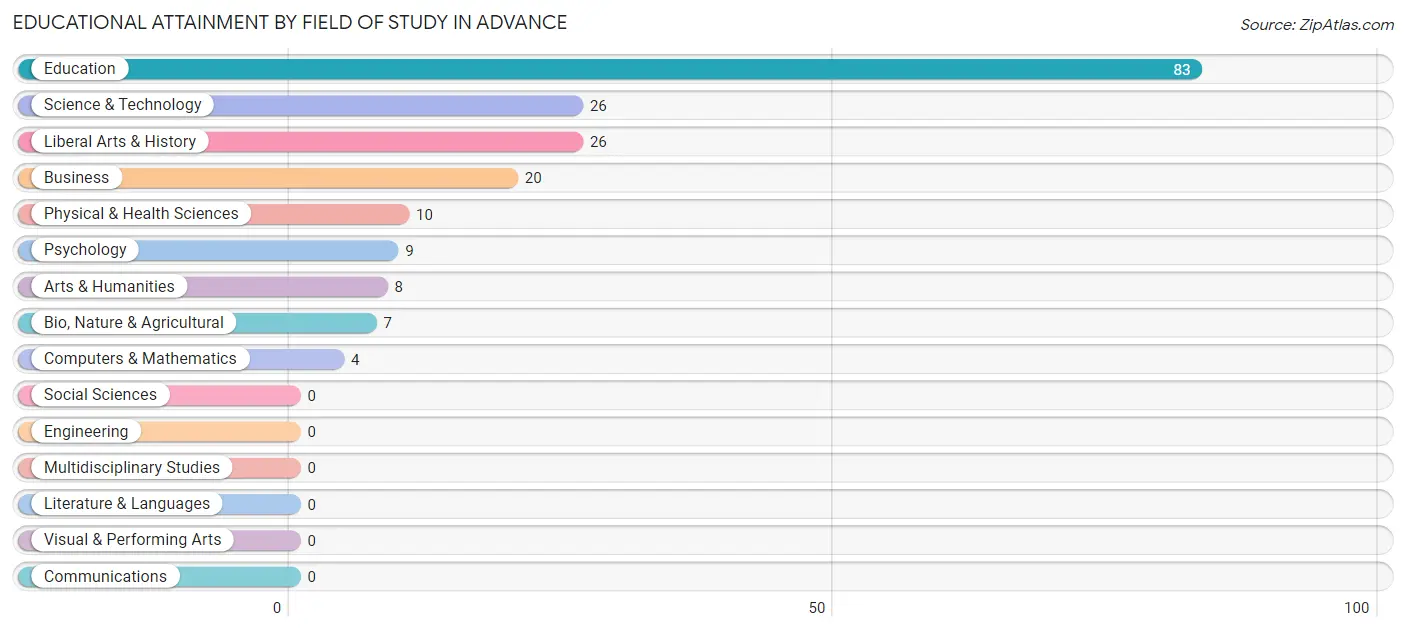
| Field of Study | # Graduates | % Graduates |
| Computers & Mathematics | 4 | 2.1% |
| Bio, Nature & Agricultural | 7 | 3.6% |
| Physical & Health Sciences | 10 | 5.2% |
| Psychology | 9 | 4.7% |
| Social Sciences | 0 | 0.0% |
| Engineering | 0 | 0.0% |
| Multidisciplinary Studies | 0 | 0.0% |
| Science & Technology | 26 | 13.5% |
| Business | 20 | 10.4% |
| Education | 83 | 43.0% |
| Literature & Languages | 0 | 0.0% |
| Liberal Arts & History | 26 | 13.5% |
| Visual & Performing Arts | 0 | 0.0% |
| Communications | 0 | 0.0% |
| Arts & Humanities | 8 | 4.2% |
| Total | 193 | 100.0% |
Transportation & Commute in Advance
Vehicle Availability by Sex in Advance
The most prevalent vehicle ownership categories in Advance are males with 2 vehicles (169, accounting for 46.1%) and females with 2 vehicles (109, making up 55.4%).
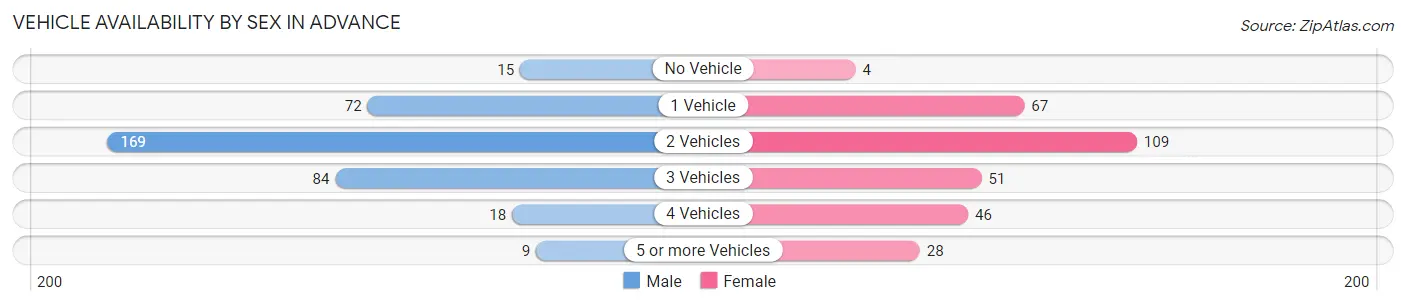
| Vehicles Available | Male | Female |
| No Vehicle | 15 (4.1%) | 4 (1.3%) |
| 1 Vehicle | 72 (19.6%) | 67 (22.0%) |
| 2 Vehicles | 169 (46.1%) | 109 (35.7%) |
| 3 Vehicles | 84 (22.9%) | 51 (16.7%) |
| 4 Vehicles | 18 (4.9%) | 46 (15.1%) |
| 5 or more Vehicles | 9 (2.5%) | 28 (9.2%) |
| Total | 367 (100.0%) | 305 (100.0%) |
Commute Time in Advance
The most frequently occuring commute durations in Advance are 30 to 34 minutes (126 commuters, 19.2%), 45 to 59 minutes (96 commuters, 14.6%), and 5 to 9 minutes (74 commuters, 11.3%).
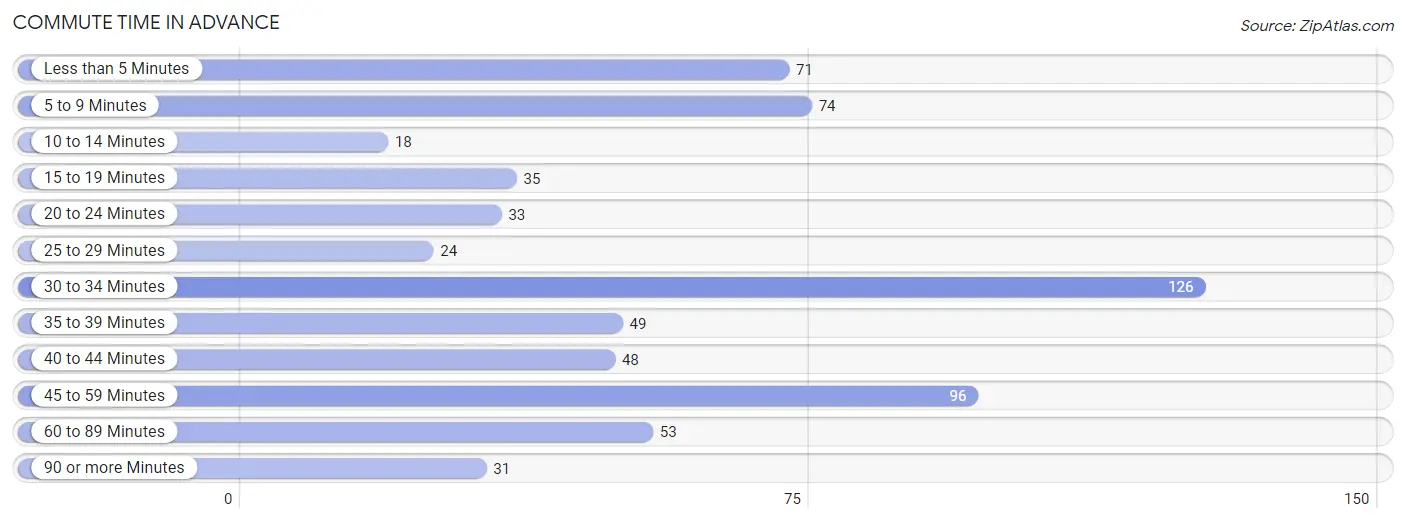
| Commute Time | # Commuters | % Commuters |
| Less than 5 Minutes | 71 | 10.8% |
| 5 to 9 Minutes | 74 | 11.3% |
| 10 to 14 Minutes | 18 | 2.7% |
| 15 to 19 Minutes | 35 | 5.3% |
| 20 to 24 Minutes | 33 | 5.0% |
| 25 to 29 Minutes | 24 | 3.6% |
| 30 to 34 Minutes | 126 | 19.2% |
| 35 to 39 Minutes | 49 | 7.4% |
| 40 to 44 Minutes | 48 | 7.3% |
| 45 to 59 Minutes | 96 | 14.6% |
| 60 to 89 Minutes | 53 | 8.1% |
| 90 or more Minutes | 31 | 4.7% |
Commute Time by Sex in Advance
The most common commute times in Advance are 30 to 34 minutes (68 commuters, 18.5%) for males and 30 to 34 minutes (58 commuters, 19.9%) for females.
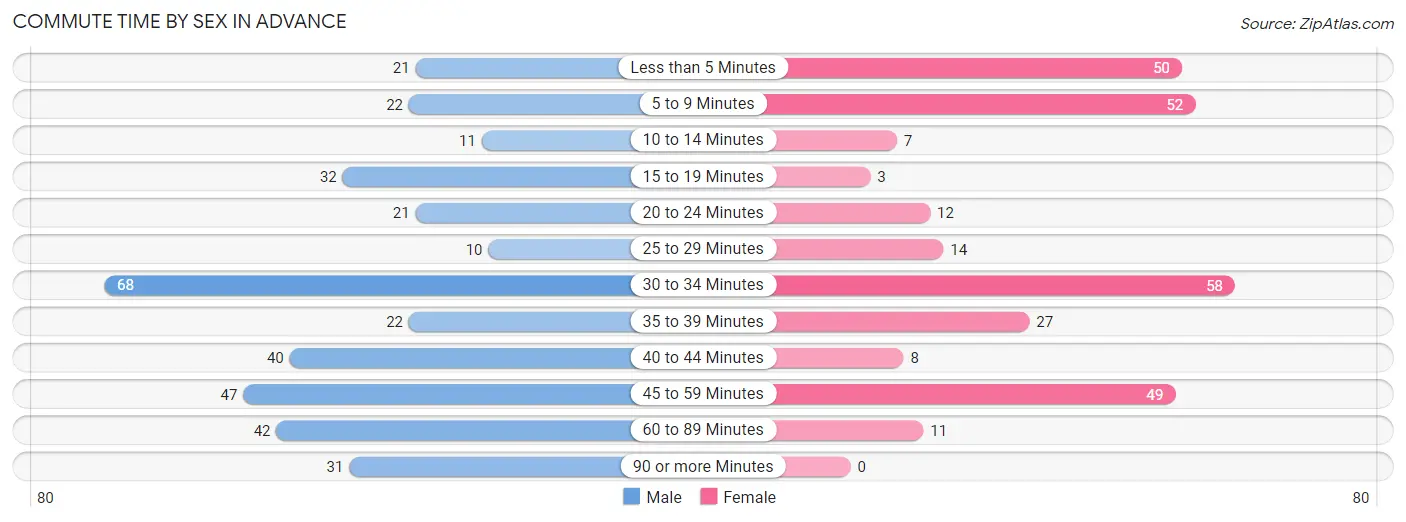
| Commute Time | Male | Female |
| Less than 5 Minutes | 21 (5.7%) | 50 (17.2%) |
| 5 to 9 Minutes | 22 (6.0%) | 52 (17.9%) |
| 10 to 14 Minutes | 11 (3.0%) | 7 (2.4%) |
| 15 to 19 Minutes | 32 (8.7%) | 3 (1.0%) |
| 20 to 24 Minutes | 21 (5.7%) | 12 (4.1%) |
| 25 to 29 Minutes | 10 (2.7%) | 14 (4.8%) |
| 30 to 34 Minutes | 68 (18.5%) | 58 (19.9%) |
| 35 to 39 Minutes | 22 (6.0%) | 27 (9.3%) |
| 40 to 44 Minutes | 40 (10.9%) | 8 (2.8%) |
| 45 to 59 Minutes | 47 (12.8%) | 49 (16.8%) |
| 60 to 89 Minutes | 42 (11.4%) | 11 (3.8%) |
| 90 or more Minutes | 31 (8.5%) | 0 (0.0%) |
Time of Departure to Work by Sex in Advance
The most frequent times of departure to work in Advance are 5:00 AM to 5:29 AM (68, 18.5%) for males and 7:30 AM to 7:59 AM (84, 28.9%) for females.
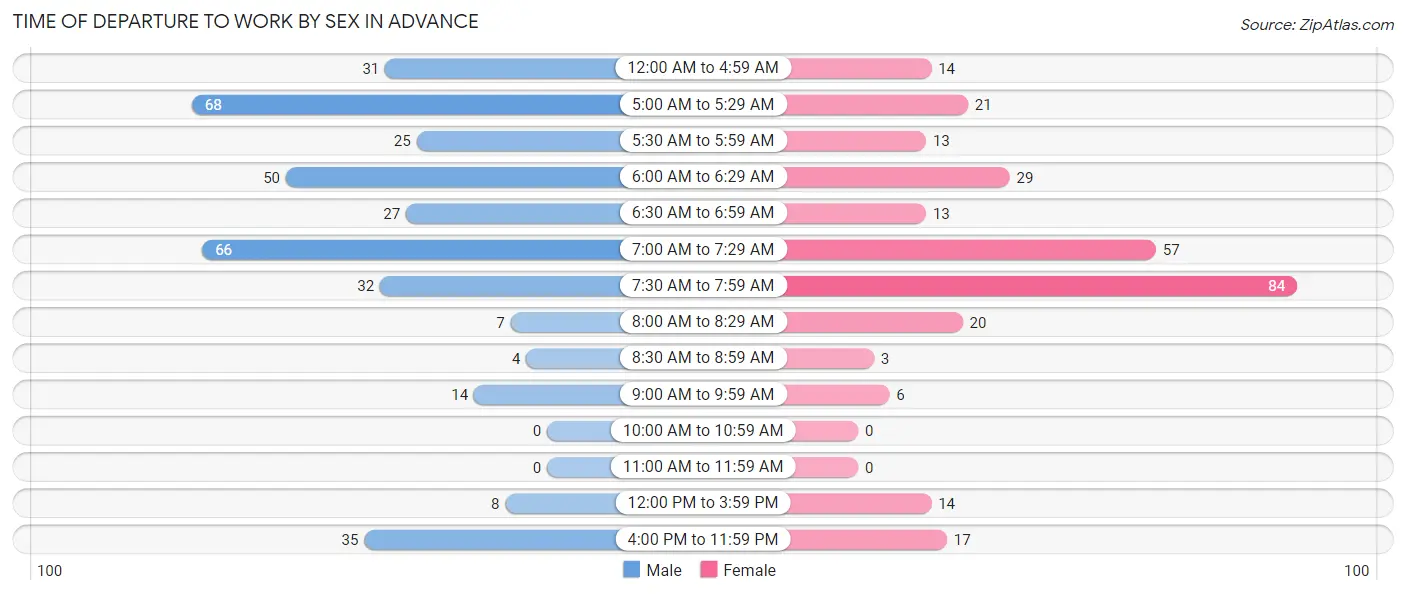
| Time of Departure | Male | Female |
| 12:00 AM to 4:59 AM | 31 (8.5%) | 14 (4.8%) |
| 5:00 AM to 5:29 AM | 68 (18.5%) | 21 (7.2%) |
| 5:30 AM to 5:59 AM | 25 (6.8%) | 13 (4.5%) |
| 6:00 AM to 6:29 AM | 50 (13.6%) | 29 (10.0%) |
| 6:30 AM to 6:59 AM | 27 (7.4%) | 13 (4.5%) |
| 7:00 AM to 7:29 AM | 66 (18.0%) | 57 (19.6%) |
| 7:30 AM to 7:59 AM | 32 (8.7%) | 84 (28.9%) |
| 8:00 AM to 8:29 AM | 7 (1.9%) | 20 (6.9%) |
| 8:30 AM to 8:59 AM | 4 (1.1%) | 3 (1.0%) |
| 9:00 AM to 9:59 AM | 14 (3.8%) | 6 (2.1%) |
| 10:00 AM to 10:59 AM | 0 (0.0%) | 0 (0.0%) |
| 11:00 AM to 11:59 AM | 0 (0.0%) | 0 (0.0%) |
| 12:00 PM to 3:59 PM | 8 (2.2%) | 14 (4.8%) |
| 4:00 PM to 11:59 PM | 35 (9.5%) | 17 (5.8%) |
| Total | 367 (100.0%) | 291 (100.0%) |
Housing Occupancy in Advance
Occupancy by Ownership in Advance
Of the total 712 dwellings in Advance, owner-occupied units account for 548 (77.0%), while renter-occupied units make up 164 (23.0%).
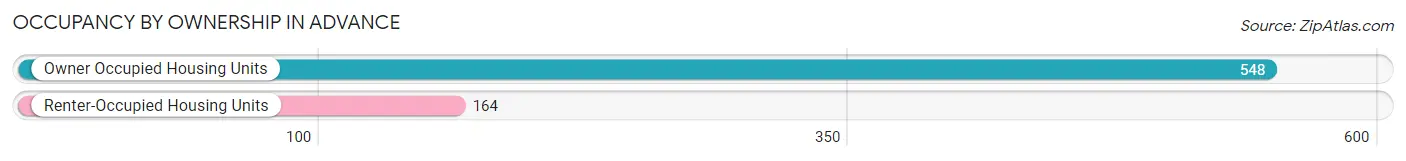
| Occupancy | # Housing Units | % Housing Units |
| Owner Occupied Housing Units | 548 | 77.0% |
| Renter-Occupied Housing Units | 164 | 23.0% |
| Total Occupied Housing Units | 712 | 100.0% |
Occupancy by Household Size in Advance
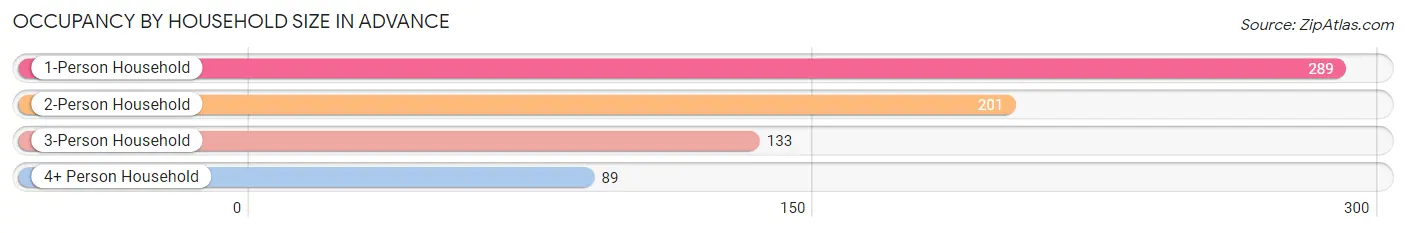
| Household Size | # Housing Units | % Housing Units |
| 1-Person Household | 289 | 40.6% |
| 2-Person Household | 201 | 28.2% |
| 3-Person Household | 133 | 18.7% |
| 4+ Person Household | 89 | 12.5% |
| Total Housing Units | 712 | 100.0% |
Occupancy by Ownership by Household Size in Advance
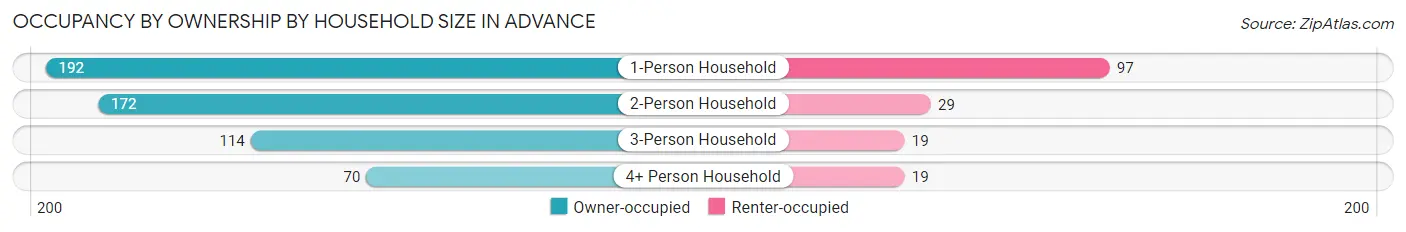
| Household Size | Owner-occupied | Renter-occupied |
| 1-Person Household | 192 (66.4%) | 97 (33.6%) |
| 2-Person Household | 172 (85.6%) | 29 (14.4%) |
| 3-Person Household | 114 (85.7%) | 19 (14.3%) |
| 4+ Person Household | 70 (78.6%) | 19 (21.3%) |
| Total Housing Units | 548 (77.0%) | 164 (23.0%) |
Occupancy by Educational Attainment in Advance
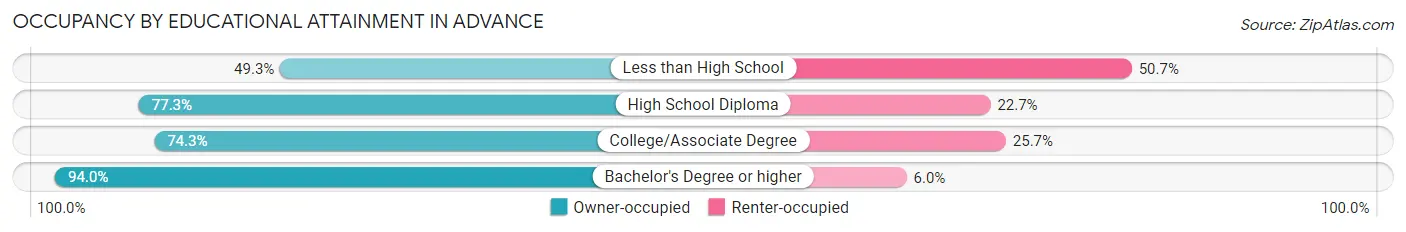
| Household Size | Owner-occupied | Renter-occupied |
| Less than High School | 37 (49.3%) | 38 (50.7%) |
| High School Diploma | 215 (77.3%) | 63 (22.7%) |
| College/Associate Degree | 156 (74.3%) | 54 (25.7%) |
| Bachelor's Degree or higher | 140 (94.0%) | 9 (6.0%) |
Occupancy by Age of Householder in Advance
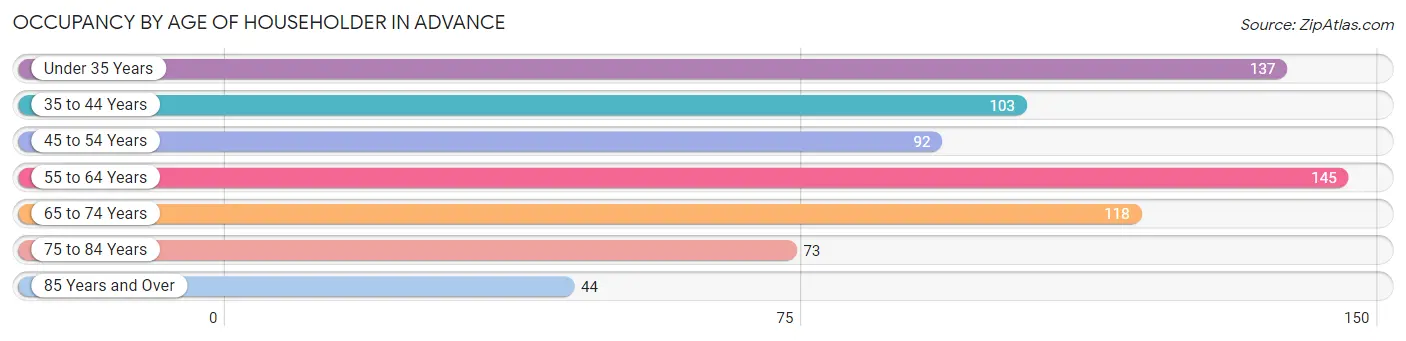
| Age Bracket | # Households | % Households |
| Under 35 Years | 137 | 19.2% |
| 35 to 44 Years | 103 | 14.5% |
| 45 to 54 Years | 92 | 12.9% |
| 55 to 64 Years | 145 | 20.4% |
| 65 to 74 Years | 118 | 16.6% |
| 75 to 84 Years | 73 | 10.2% |
| 85 Years and Over | 44 | 6.2% |
| Total | 712 | 100.0% |
Housing Finances in Advance
Median Income by Occupancy in Advance
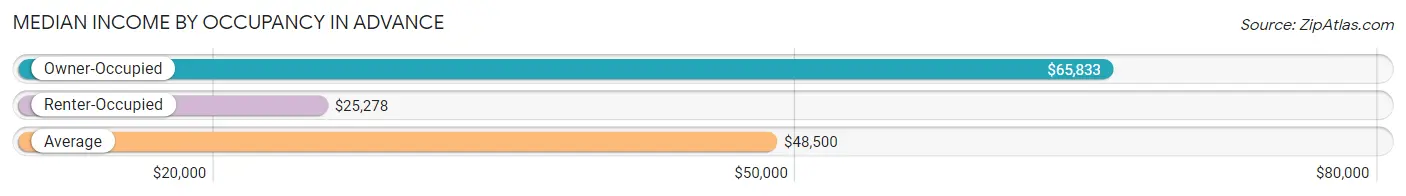
| Occupancy Type | # Households | Median Income |
| Owner-Occupied | 548 (77.0%) | $65,833 |
| Renter-Occupied | 164 (23.0%) | $25,278 |
| Average | 712 (100.0%) | $48,500 |
Occupancy by Householder Income Bracket in Advance
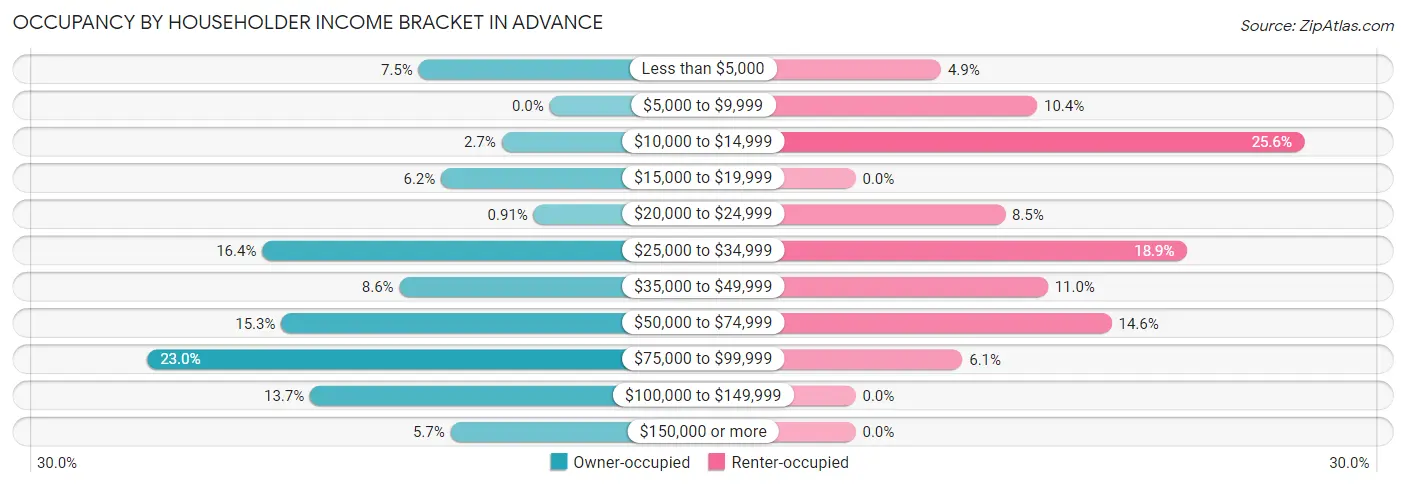
| Income Bracket | Owner-occupied | Renter-occupied |
| Less than $5,000 | 41 (7.5%) | 8 (4.9%) |
| $5,000 to $9,999 | 0 (0.0%) | 17 (10.4%) |
| $10,000 to $14,999 | 15 (2.7%) | 42 (25.6%) |
| $15,000 to $19,999 | 34 (6.2%) | 0 (0.0%) |
| $20,000 to $24,999 | 5 (0.9%) | 14 (8.5%) |
| $25,000 to $34,999 | 90 (16.4%) | 31 (18.9%) |
| $35,000 to $49,999 | 47 (8.6%) | 18 (11.0%) |
| $50,000 to $74,999 | 84 (15.3%) | 24 (14.6%) |
| $75,000 to $99,999 | 126 (23.0%) | 10 (6.1%) |
| $100,000 to $149,999 | 75 (13.7%) | 0 (0.0%) |
| $150,000 or more | 31 (5.7%) | 0 (0.0%) |
| Total | 548 (100.0%) | 164 (100.0%) |
Monthly Housing Cost Tiers in Advance
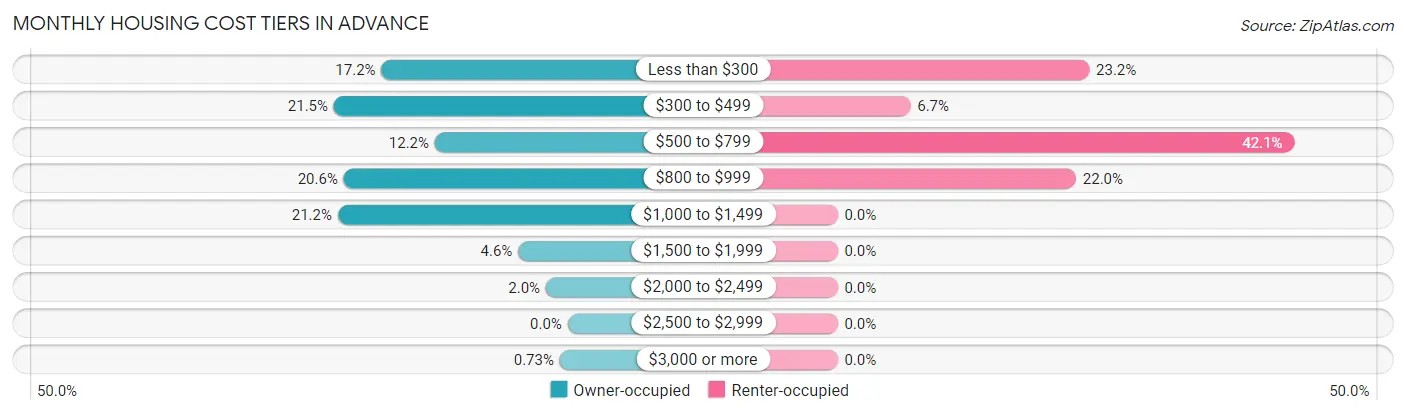
| Monthly Cost | Owner-occupied | Renter-occupied |
| Less than $300 | 94 (17.2%) | 38 (23.2%) |
| $300 to $499 | 118 (21.5%) | 11 (6.7%) |
| $500 to $799 | 67 (12.2%) | 69 (42.1%) |
| $800 to $999 | 113 (20.6%) | 36 (22.0%) |
| $1,000 to $1,499 | 116 (21.2%) | 0 (0.0%) |
| $1,500 to $1,999 | 25 (4.6%) | 0 (0.0%) |
| $2,000 to $2,499 | 11 (2.0%) | 0 (0.0%) |
| $2,500 to $2,999 | 0 (0.0%) | 0 (0.0%) |
| $3,000 or more | 4 (0.7%) | 0 (0.0%) |
| Total | 548 (100.0%) | 164 (100.0%) |
Physical Housing Characteristics in Advance
Housing Structures in Advance
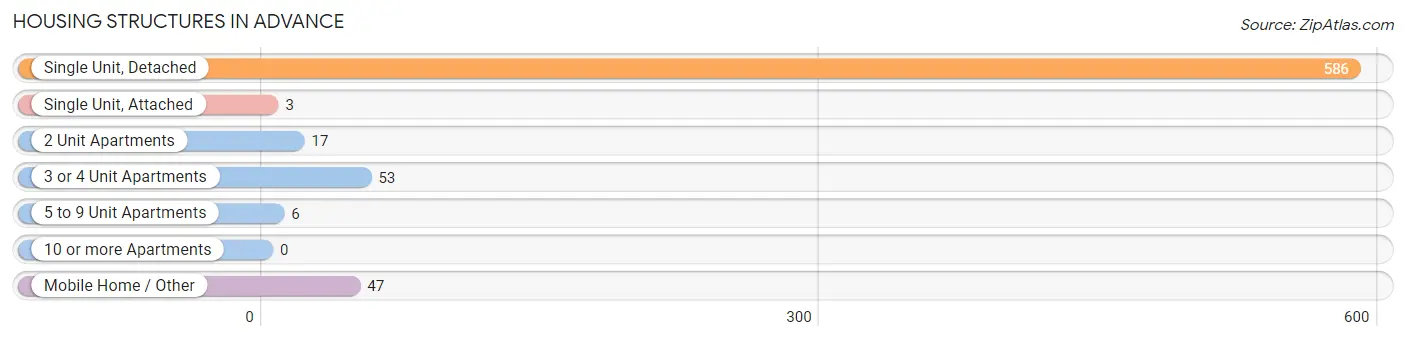
| Structure Type | # Housing Units | % Housing Units |
| Single Unit, Detached | 586 | 82.3% |
| Single Unit, Attached | 3 | 0.4% |
| 2 Unit Apartments | 17 | 2.4% |
| 3 or 4 Unit Apartments | 53 | 7.4% |
| 5 to 9 Unit Apartments | 6 | 0.8% |
| 10 or more Apartments | 0 | 0.0% |
| Mobile Home / Other | 47 | 6.6% |
| Total | 712 | 100.0% |
Housing Structures by Occupancy in Advance
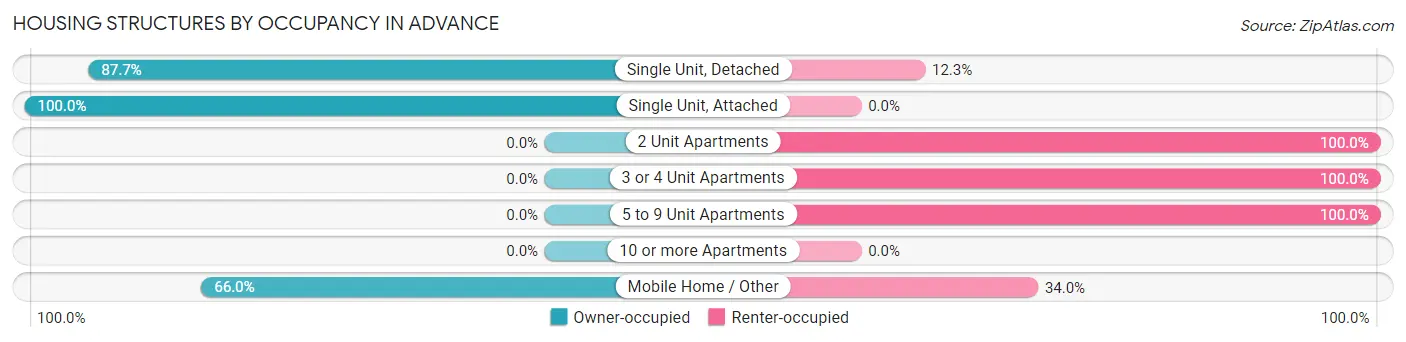
| Structure Type | Owner-occupied | Renter-occupied |
| Single Unit, Detached | 514 (87.7%) | 72 (12.3%) |
| Single Unit, Attached | 3 (100.0%) | 0 (0.0%) |
| 2 Unit Apartments | 0 (0.0%) | 17 (100.0%) |
| 3 or 4 Unit Apartments | 0 (0.0%) | 53 (100.0%) |
| 5 to 9 Unit Apartments | 0 (0.0%) | 6 (100.0%) |
| 10 or more Apartments | 0 (0.0%) | 0 (0.0%) |
| Mobile Home / Other | 31 (66.0%) | 16 (34.0%) |
| Total | 548 (77.0%) | 164 (23.0%) |
Housing Structures by Number of Rooms in Advance
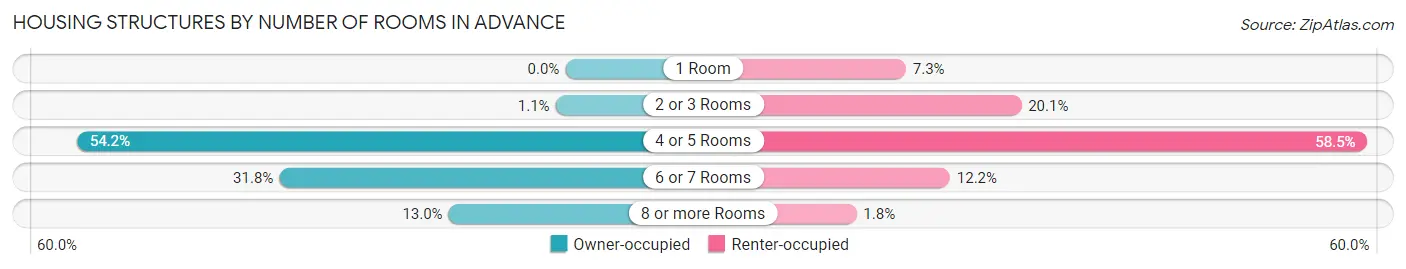
| Number of Rooms | Owner-occupied | Renter-occupied |
| 1 Room | 0 (0.0%) | 12 (7.3%) |
| 2 or 3 Rooms | 6 (1.1%) | 33 (20.1%) |
| 4 or 5 Rooms | 297 (54.2%) | 96 (58.5%) |
| 6 or 7 Rooms | 174 (31.8%) | 20 (12.2%) |
| 8 or more Rooms | 71 (13.0%) | 3 (1.8%) |
| Total | 548 (100.0%) | 164 (100.0%) |
Housing Structure by Heating Type in Advance
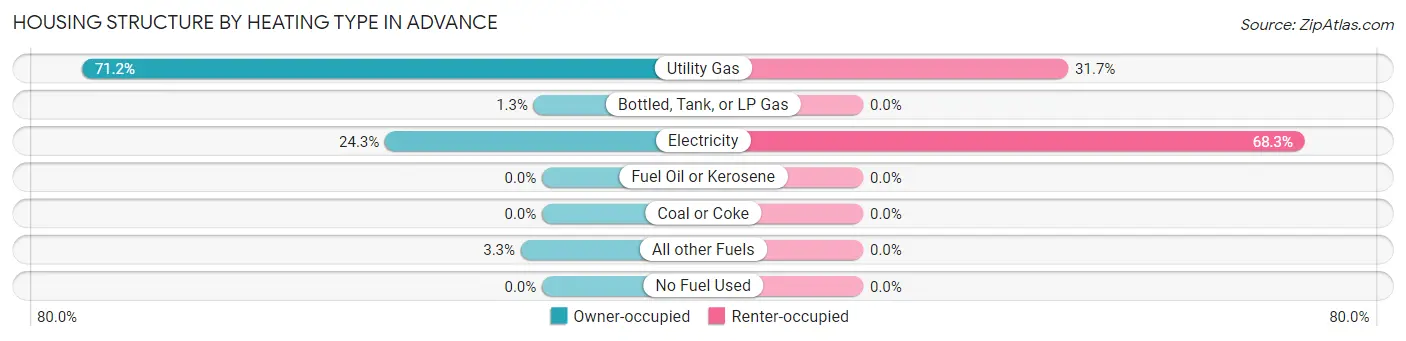
| Heating Type | Owner-occupied | Renter-occupied |
| Utility Gas | 390 (71.2%) | 52 (31.7%) |
| Bottled, Tank, or LP Gas | 7 (1.3%) | 0 (0.0%) |
| Electricity | 133 (24.3%) | 112 (68.3%) |
| Fuel Oil or Kerosene | 0 (0.0%) | 0 (0.0%) |
| Coal or Coke | 0 (0.0%) | 0 (0.0%) |
| All other Fuels | 18 (3.3%) | 0 (0.0%) |
| No Fuel Used | 0 (0.0%) | 0 (0.0%) |
| Total | 548 (100.0%) | 164 (100.0%) |
Household Vehicle Usage in Advance
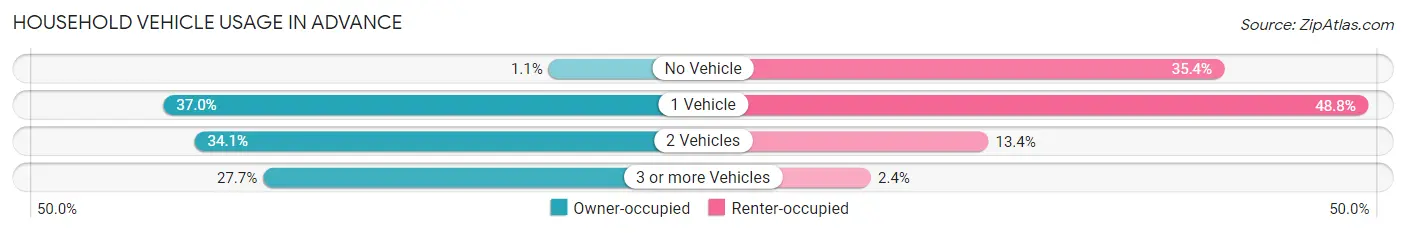
| Vehicles per Household | Owner-occupied | Renter-occupied |
| No Vehicle | 6 (1.1%) | 58 (35.4%) |
| 1 Vehicle | 203 (37.0%) | 80 (48.8%) |
| 2 Vehicles | 187 (34.1%) | 22 (13.4%) |
| 3 or more Vehicles | 152 (27.7%) | 4 (2.4%) |
| Total | 548 (100.0%) | 164 (100.0%) |
Real Estate & Mortgages in Advance
Real Estate and Mortgage Overview in Advance
| Characteristic | Without Mortgage | With Mortgage |
| Housing Units | 226 | 322 |
| Median Property Value | $100,000 | $112,100 |
| Median Household Income | $32,500 | $20 |
| Monthly Housing Costs | $324 | $4 |
| Real Estate Taxes | $633 | $6 |
Property Value by Mortgage Status in Advance
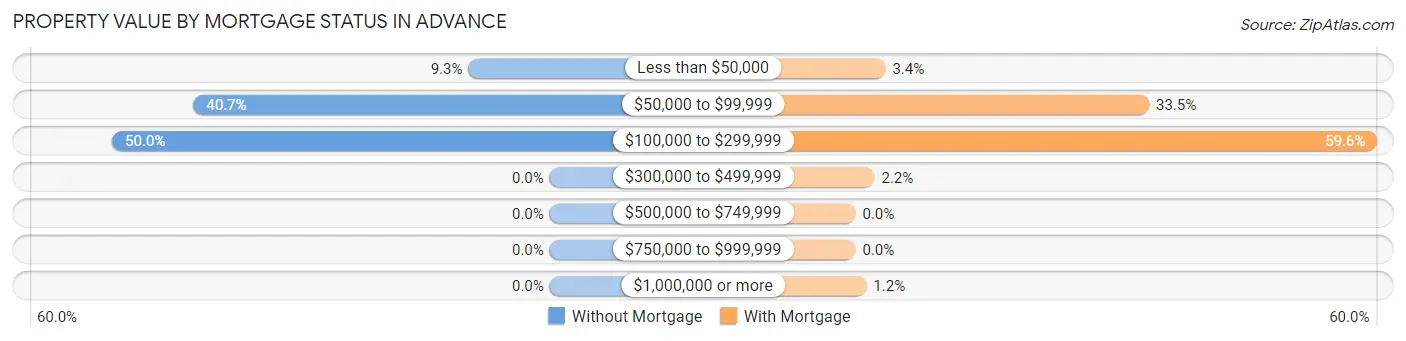
| Property Value | Without Mortgage | With Mortgage |
| Less than $50,000 | 21 (9.3%) | 11 (3.4%) |
| $50,000 to $99,999 | 92 (40.7%) | 108 (33.5%) |
| $100,000 to $299,999 | 113 (50.0%) | 192 (59.6%) |
| $300,000 to $499,999 | 0 (0.0%) | 7 (2.2%) |
| $500,000 to $749,999 | 0 (0.0%) | 0 (0.0%) |
| $750,000 to $999,999 | 0 (0.0%) | 0 (0.0%) |
| $1,000,000 or more | 0 (0.0%) | 4 (1.2%) |
| Total | 226 (100.0%) | 322 (100.0%) |
Household Income by Mortgage Status in Advance
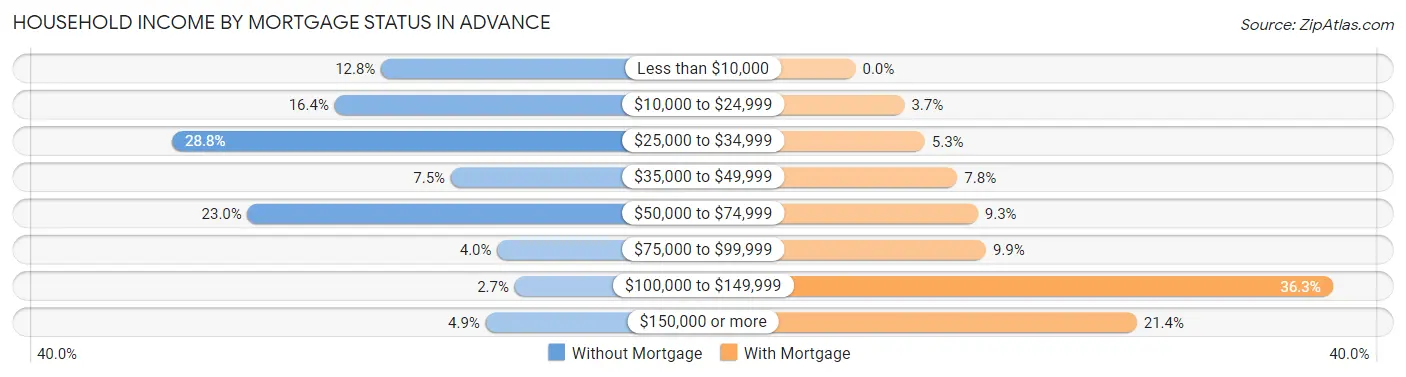
| Household Income | Without Mortgage | With Mortgage |
| Less than $10,000 | 29 (12.8%) | 0 (0.0%) |
| $10,000 to $24,999 | 37 (16.4%) | 12 (3.7%) |
| $25,000 to $34,999 | 65 (28.8%) | 17 (5.3%) |
| $35,000 to $49,999 | 17 (7.5%) | 25 (7.8%) |
| $50,000 to $74,999 | 52 (23.0%) | 30 (9.3%) |
| $75,000 to $99,999 | 9 (4.0%) | 32 (9.9%) |
| $100,000 to $149,999 | 6 (2.6%) | 117 (36.3%) |
| $150,000 or more | 11 (4.9%) | 69 (21.4%) |
| Total | 226 (100.0%) | 322 (100.0%) |
Property Value to Household Income Ratio in Advance
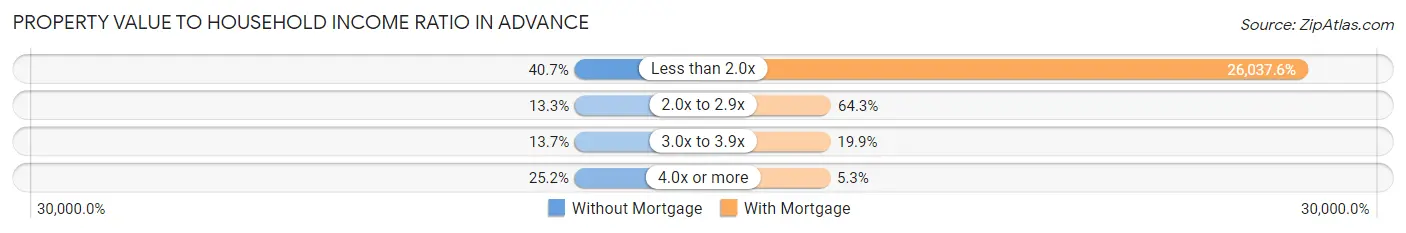
| Value-to-Income Ratio | Without Mortgage | With Mortgage |
| Less than 2.0x | 92 (40.7%) | 83,841 (26,037.6%) |
| 2.0x to 2.9x | 30 (13.3%) | 207 (64.3%) |
| 3.0x to 3.9x | 31 (13.7%) | 64 (19.9%) |
| 4.0x or more | 57 (25.2%) | 17 (5.3%) |
| Total | 226 (100.0%) | 322 (100.0%) |
Real Estate Taxes by Mortgage Status in Advance
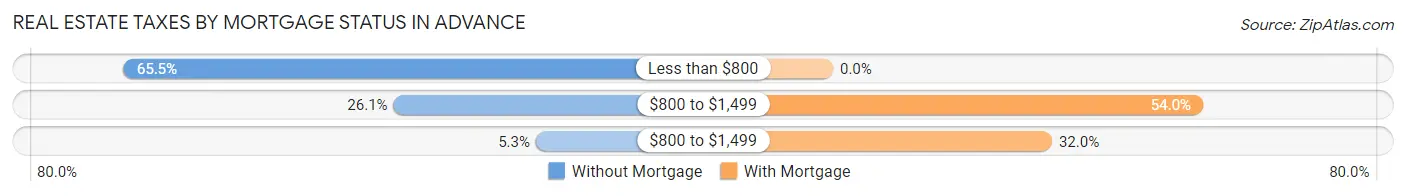
| Property Taxes | Without Mortgage | With Mortgage |
| Less than $800 | 148 (65.5%) | 0 (0.0%) |
| $800 to $1,499 | 59 (26.1%) | 174 (54.0%) |
| $800 to $1,499 | 12 (5.3%) | 103 (32.0%) |
| Total | 226 (100.0%) | 322 (100.0%) |
Health & Disability in Advance
Health Insurance Coverage by Age in Advance
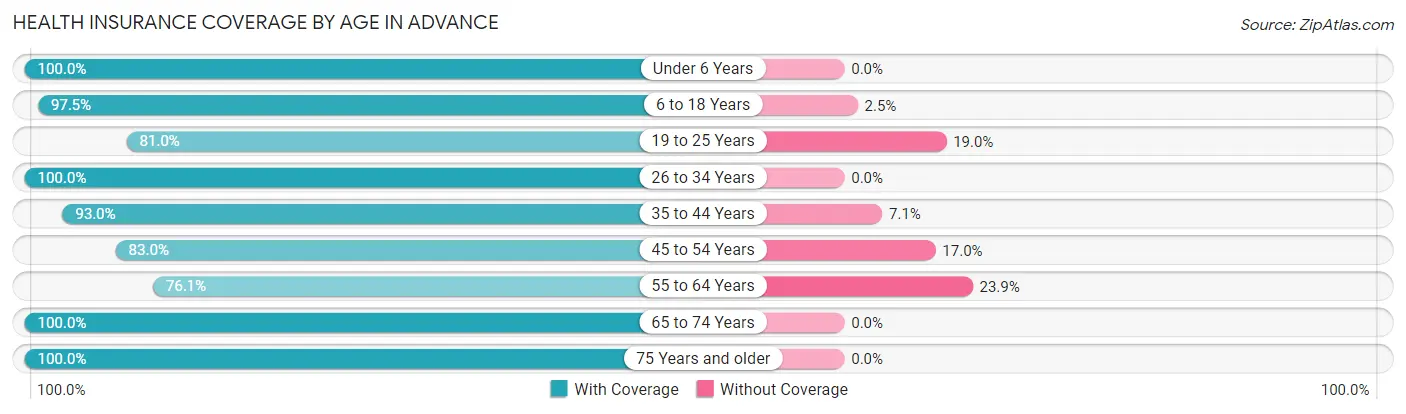
| Age Bracket | With Coverage | Without Coverage |
| Under 6 Years | 82 (100.0%) | 0 (0.0%) |
| 6 to 18 Years | 157 (97.5%) | 4 (2.5%) |
| 19 to 25 Years | 81 (81.0%) | 19 (19.0%) |
| 26 to 34 Years | 230 (100.0%) | 0 (0.0%) |
| 35 to 44 Years | 145 (92.9%) | 11 (7.0%) |
| 45 to 54 Years | 127 (83.0%) | 26 (17.0%) |
| 55 to 64 Years | 194 (76.1%) | 61 (23.9%) |
| 65 to 74 Years | 160 (100.0%) | 0 (0.0%) |
| 75 Years and older | 141 (100.0%) | 0 (0.0%) |
| Total | 1,317 (91.6%) | 121 (8.4%) |
Health Insurance Coverage by Citizenship Status in Advance
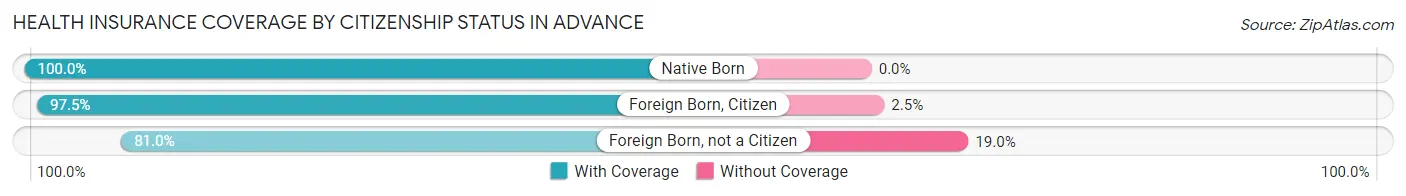
| Citizenship Status | With Coverage | Without Coverage |
| Native Born | 82 (100.0%) | 0 (0.0%) |
| Foreign Born, Citizen | 157 (97.5%) | 4 (2.5%) |
| Foreign Born, not a Citizen | 81 (81.0%) | 19 (19.0%) |
Health Insurance Coverage by Household Income in Advance
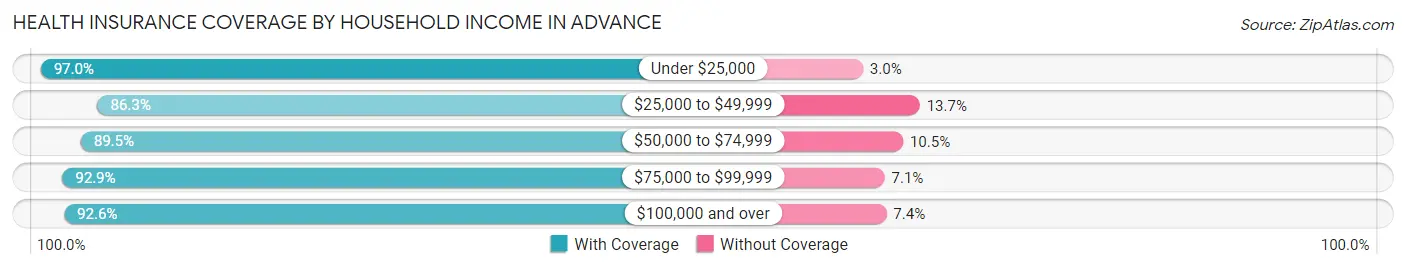
| Household Income | With Coverage | Without Coverage |
| Under $25,000 | 257 (97.0%) | 8 (3.0%) |
| $25,000 to $49,999 | 278 (86.3%) | 44 (13.7%) |
| $50,000 to $74,999 | 204 (89.5%) | 24 (10.5%) |
| $75,000 to $99,999 | 341 (92.9%) | 26 (7.1%) |
| $100,000 and over | 237 (92.6%) | 19 (7.4%) |
Public vs Private Health Insurance Coverage by Age in Advance
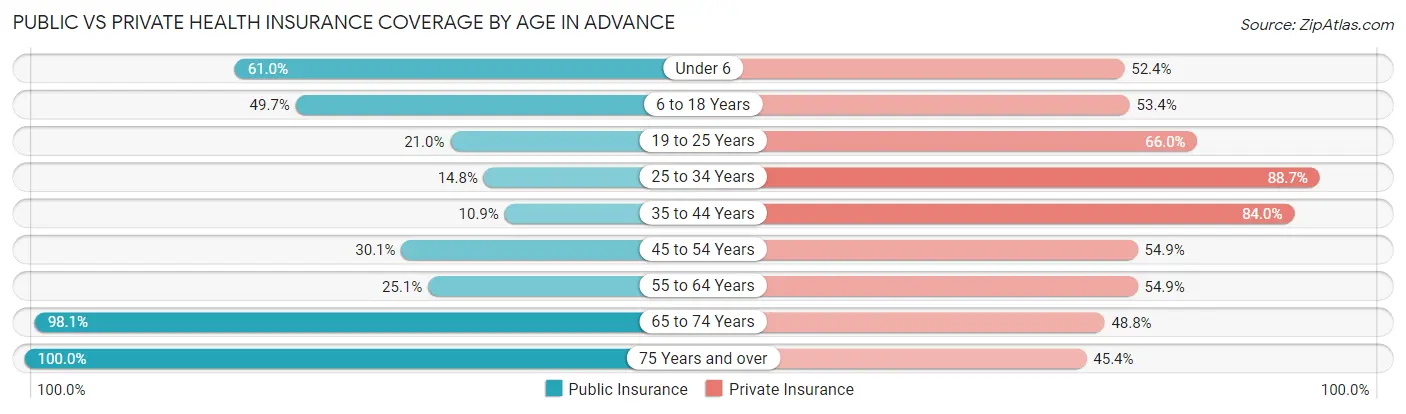
| Age Bracket | Public Insurance | Private Insurance |
| Under 6 | 50 (61.0%) | 43 (52.4%) |
| 6 to 18 Years | 80 (49.7%) | 86 (53.4%) |
| 19 to 25 Years | 21 (21.0%) | 66 (66.0%) |
| 25 to 34 Years | 34 (14.8%) | 204 (88.7%) |
| 35 to 44 Years | 17 (10.9%) | 131 (84.0%) |
| 45 to 54 Years | 46 (30.1%) | 84 (54.9%) |
| 55 to 64 Years | 64 (25.1%) | 140 (54.9%) |
| 65 to 74 Years | 157 (98.1%) | 78 (48.7%) |
| 75 Years and over | 141 (100.0%) | 64 (45.4%) |
| Total | 610 (42.4%) | 896 (62.3%) |
Disability Status by Sex by Age in Advance
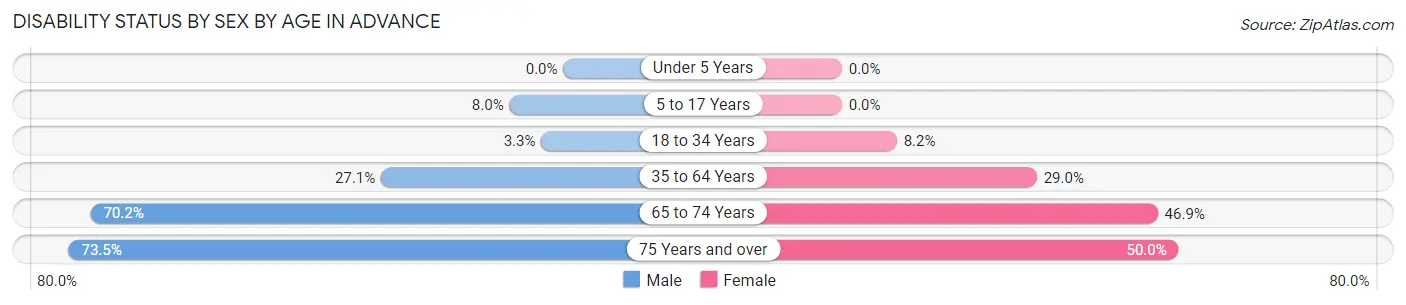
| Age Bracket | Male | Female |
| Under 5 Years | 0 (0.0%) | 0 (0.0%) |
| 5 to 17 Years | 8 (8.0%) | 0 (0.0%) |
| 18 to 34 Years | 5 (3.3%) | 15 (8.2%) |
| 35 to 64 Years | 91 (27.1%) | 66 (28.9%) |
| 65 to 74 Years | 33 (70.2%) | 53 (46.9%) |
| 75 Years and over | 36 (73.5%) | 46 (50.0%) |
Disability Class by Sex by Age in Advance
Disability Class: Hearing Difficulty
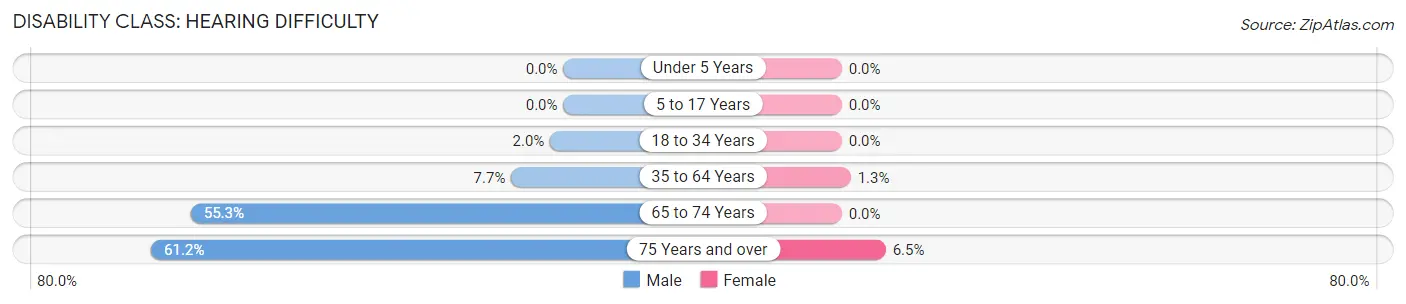
| Age Bracket | Male | Female |
| Under 5 Years | 0 (0.0%) | 0 (0.0%) |
| 5 to 17 Years | 0 (0.0%) | 0 (0.0%) |
| 18 to 34 Years | 3 (2.0%) | 0 (0.0%) |
| 35 to 64 Years | 26 (7.7%) | 3 (1.3%) |
| 65 to 74 Years | 26 (55.3%) | 0 (0.0%) |
| 75 Years and over | 30 (61.2%) | 6 (6.5%) |
Disability Class: Vision Difficulty
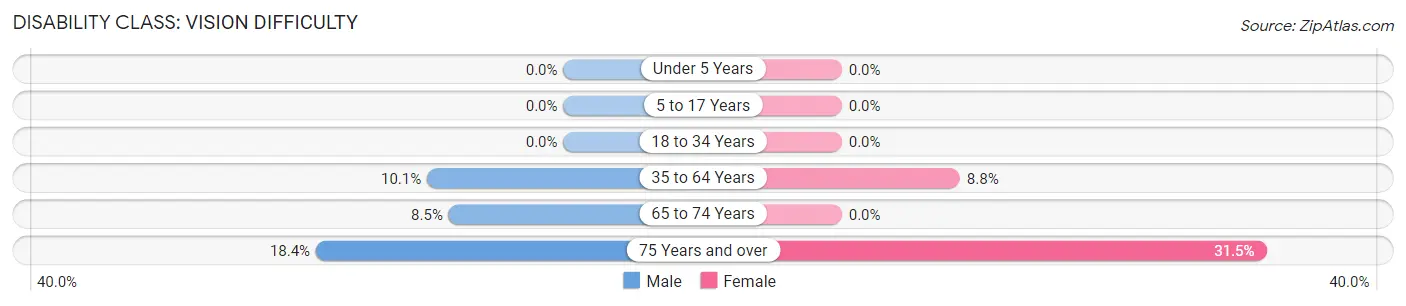
| Age Bracket | Male | Female |
| Under 5 Years | 0 (0.0%) | 0 (0.0%) |
| 5 to 17 Years | 0 (0.0%) | 0 (0.0%) |
| 18 to 34 Years | 0 (0.0%) | 0 (0.0%) |
| 35 to 64 Years | 34 (10.1%) | 20 (8.8%) |
| 65 to 74 Years | 4 (8.5%) | 0 (0.0%) |
| 75 Years and over | 9 (18.4%) | 29 (31.5%) |
Disability Class: Cognitive Difficulty
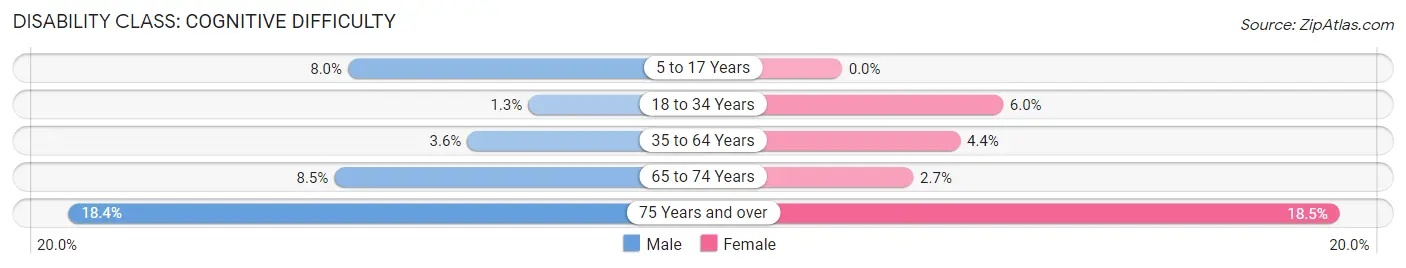
| Age Bracket | Male | Female |
| 5 to 17 Years | 8 (8.0%) | 0 (0.0%) |
| 18 to 34 Years | 2 (1.3%) | 11 (6.0%) |
| 35 to 64 Years | 12 (3.6%) | 10 (4.4%) |
| 65 to 74 Years | 4 (8.5%) | 3 (2.6%) |
| 75 Years and over | 9 (18.4%) | 17 (18.5%) |
Disability Class: Ambulatory Difficulty
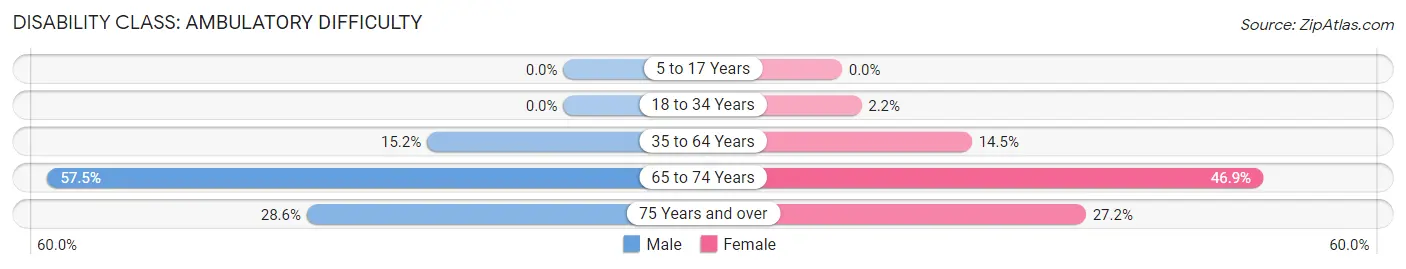
| Age Bracket | Male | Female |
| 5 to 17 Years | 0 (0.0%) | 0 (0.0%) |
| 18 to 34 Years | 0 (0.0%) | 4 (2.2%) |
| 35 to 64 Years | 51 (15.2%) | 33 (14.5%) |
| 65 to 74 Years | 27 (57.5%) | 53 (46.9%) |
| 75 Years and over | 14 (28.6%) | 25 (27.2%) |
Disability Class: Self-Care Difficulty
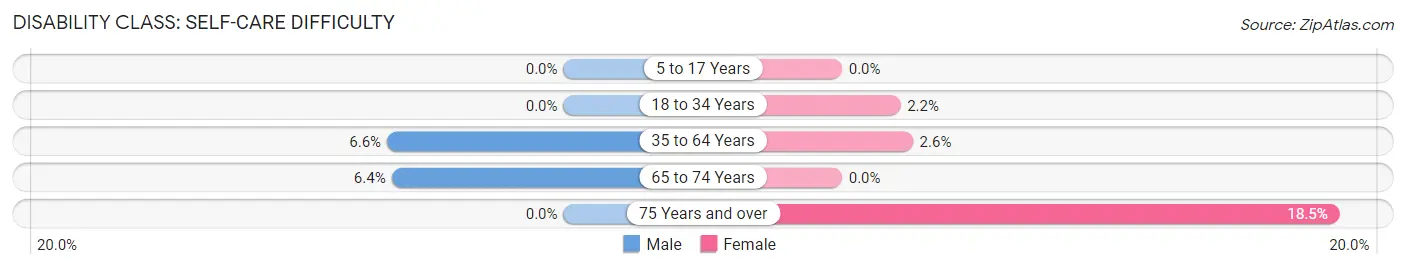
| Age Bracket | Male | Female |
| 5 to 17 Years | 0 (0.0%) | 0 (0.0%) |
| 18 to 34 Years | 0 (0.0%) | 4 (2.2%) |
| 35 to 64 Years | 22 (6.6%) | 6 (2.6%) |
| 65 to 74 Years | 3 (6.4%) | 0 (0.0%) |
| 75 Years and over | 0 (0.0%) | 17 (18.5%) |
Technology Access in Advance
Computing Device Access in Advance
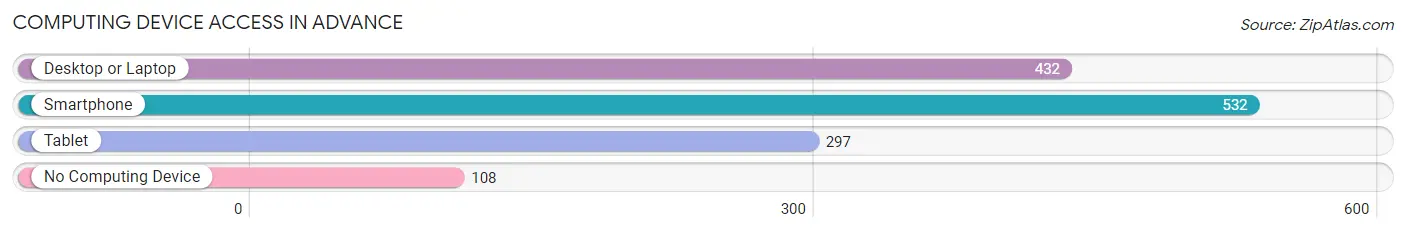
| Device Type | # Households | % Households |
| Desktop or Laptop | 432 | 60.7% |
| Smartphone | 532 | 74.7% |
| Tablet | 297 | 41.7% |
| No Computing Device | 108 | 15.2% |
| Total | 712 | 100.0% |
Internet Access in Advance
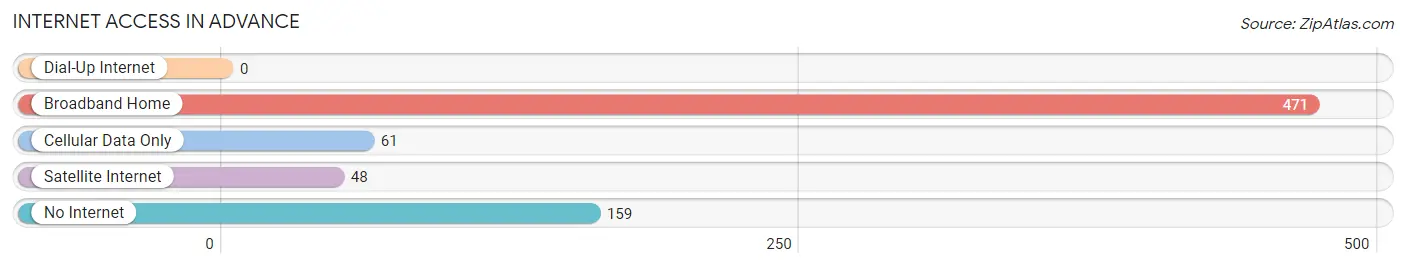
| Internet Type | # Households | % Households |
| Dial-Up Internet | 0 | 0.0% |
| Broadband Home | 471 | 66.1% |
| Cellular Data Only | 61 | 8.6% |
| Satellite Internet | 48 | 6.7% |
| No Internet | 159 | 22.3% |
| Total | 712 | 100.0% |
Advance Summary
History
Advance is a small town located in Stoddard County, Missouri. It was founded in 1883 by the Stoddard County Court and was named after the Advance Coal Company. The town was originally a coal mining town, and the Advance Coal Company was the main employer in the area. The town grew rapidly in the late 19th century, and by the early 20th century, it had become a thriving community with a population of over 1,000 people.
The town was home to several businesses, including a general store, a bank, a hotel, a blacksmith shop, and a post office. The town also had a school, a church, and a cemetery. The town was known for its coal mining industry, and the coal mines were the main source of employment for the town's residents.
In the early 20th century, the town began to decline as the coal industry began to decline. By the mid-20th century, the town had become a ghost town, with only a few residents remaining. In the late 20th century, the town began to experience a resurgence as new businesses began to move into the area. Today, Advance is a small town with a population of around 500 people.
Geography
Advance is located in Stoddard County, Missouri, in the southeastern part of the state. The town is situated on the banks of the Castor River, which flows through the town. The town is surrounded by rolling hills and farmland, and is located about 25 miles from the nearest major city, Cape Girardeau.
The town has a total area of 0.7 square miles, all of which is land. The town has a humid subtropical climate, with hot, humid summers and mild winters. The average annual temperature is around 60 degrees Fahrenheit, and the average annual precipitation is around 40 inches.
Economy
Advance is a small town with a population of around 500 people. The town's economy is largely based on agriculture, with the majority of the town's residents employed in farming and related industries. The town also has a few small businesses, including a general store, a bank, and a post office.
The town is also home to a few manufacturing companies, including a furniture factory and a plastics factory. The town is also home to a few small restaurants and bars.
Demographics
As of the 2010 census, the population of Advance was 498 people. The racial makeup of the town was 97.2% White, 0.2% African American, 0.2% Native American, 0.2% Asian, 0.2% from other races, and 1.8% from two or more races. Hispanic or Latino of any race were 0.8% of the population.
The median income for a household in the town was $30,000, and the median income for a family was $35,000. The per capita income for the town was $14,000. About 15.2% of the population was below the poverty line.
Common Questions
What is Per Capita Income in Advance?
Per Capita income in Advance is $28,181.
What is the Median Family Income in Advance?
Median Family Income in Advance is $57,500.
What is the Median Household income in Advance?
Median Household Income in Advance is $48,500.
What is Income or Wage Gap in Advance?
Income or Wage Gap in Advance is 35.7%.
Women in Advance earn 64.3 cents for every dollar earned by a man.
What is Inequality or Gini Index in Advance?
Inequality or Gini Index in Advance is 0.42.
What is the Total Population of Advance?
Total Population of Advance is 1,451.
What is the Total Male Population of Advance?
Total Male Population of Advance is 721.
What is the Total Female Population of Advance?
Total Female Population of Advance is 730.
What is the Ratio of Males per 100 Females in Advance?
There are 98.77 Males per 100 Females in Advance.
What is the Ratio of Females per 100 Males in Advance?
There are 101.25 Females per 100 Males in Advance.
What is the Median Population Age in Advance?
Median Population Age in Advance is 44.3 Years.
What is the Average Family Size in Advance
Average Family Size in Advance is 2.8 People.
What is the Average Household Size in Advance
Average Household Size in Advance is 2.0 People.
How Large is the Labor Force in Advance?
There are 705 People in the Labor Forcein in Advance.
What is the Percentage of People in the Labor Force in Advance?
57.4% of People are in the Labor Force in Advance.
What is the Unemployment Rate in Advance?
Unemployment Rate in Advance is 3.7%.