Immigrants from Philippines vs Alaska Native Wage/Income Gap
COMPARE
Immigrants from Philippines
Alaska Native
Wage/Income Gap
Wage/Income Gap Comparison
Immigrants from Philippines
Alaska Natives
24.7%
WAGE/INCOME GAP
93.0/ 100
METRIC RATING
131st/ 347
METRIC RANK
24.4%
WAGE/INCOME GAP
96.0/ 100
METRIC RATING
116th/ 347
METRIC RANK
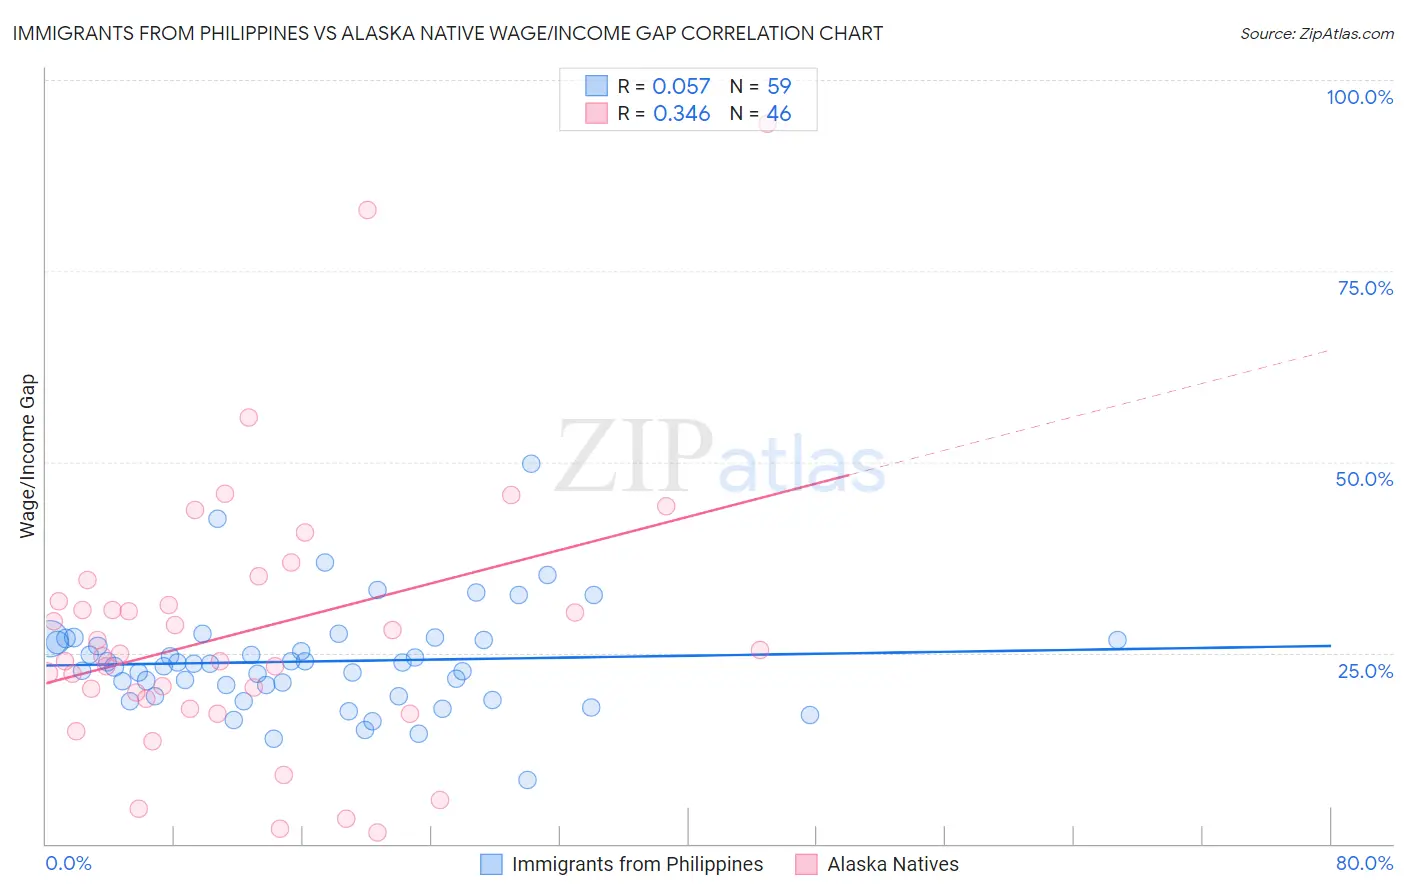
Immigrants from Philippines vs Alaska Native Wage/Income Gap Correlation Chart
The statistical analysis conducted on geographies consisting of 470,842,100 people shows a slight positive correlation between the proportion of Immigrants from Philippines and wage/income gap percentage in the United States with a correlation coefficient (R) of 0.057 and weighted average of 24.7%. Similarly, the statistical analysis conducted on geographies consisting of 76,725,822 people shows a mild positive correlation between the proportion of Alaska Natives and wage/income gap percentage in the United States with a correlation coefficient (R) of 0.346 and weighted average of 24.4%, a difference of 1.1%.
Wage/Income Gap Correlation Summary
| Measurement | Immigrants from Philippines | Alaska Native |
| Minimum | 8.4% | 1.4% |
| Maximum | 49.7% | 94.2% |
| Range | 41.3% | 92.8% |
| Mean | 23.9% | 27.7% |
| Median | 23.5% | 24.7% |
| Interquartile 25% (IQ1) | 19.4% | 18.9% |
| Interquartile 75% (IQ3) | 26.6% | 31.7% |
| Interquartile Range (IQR) | 7.3% | 12.8% |
| Standard Deviation (Sample) | 6.8% | 17.8% |
| Standard Deviation (Population) | 6.8% | 17.6% |
Demographics Similar to Immigrants from Philippines and Alaska Natives by Wage/Income Gap
In terms of wage/income gap, the demographic groups most similar to Immigrants from Philippines are Alsatian (24.7%, a difference of 0.070%), Yup'ik (24.7%, a difference of 0.090%), Immigrants from Central America (24.6%, a difference of 0.15%), Immigrants from Costa Rica (24.7%, a difference of 0.15%), and Colombian (24.7%, a difference of 0.15%). Similarly, the demographic groups most similar to Alaska Natives are Immigrants from Afghanistan (24.4%, a difference of 0.060%), Immigrants from Micronesia (24.4%, a difference of 0.090%), Kenyan (24.5%, a difference of 0.11%), Immigrants from Kenya (24.4%, a difference of 0.17%), and Cree (24.5%, a difference of 0.19%).
| Demographics | Rating | Rank | Wage/Income Gap |
| Sioux | 96.9 /100 | #113 | Exceptional 24.3% |
| Panamanians | 96.5 /100 | #114 | Exceptional 24.4% |
| Immigrants | Kenya | 96.4 /100 | #115 | Exceptional 24.4% |
| Alaska Natives | 96.0 /100 | #116 | Exceptional 24.4% |
| Immigrants | Afghanistan | 95.9 /100 | #117 | Exceptional 24.4% |
| Immigrants | Micronesia | 95.8 /100 | #118 | Exceptional 24.4% |
| Kenyans | 95.8 /100 | #119 | Exceptional 24.5% |
| Cree | 95.6 /100 | #120 | Exceptional 24.5% |
| Immigrants | Thailand | 94.9 /100 | #121 | Exceptional 24.5% |
| Apache | 94.8 /100 | #122 | Exceptional 24.5% |
| Natives/Alaskans | 94.6 /100 | #123 | Exceptional 24.6% |
| Immigrants | South America | 93.9 /100 | #124 | Exceptional 24.6% |
| Spanish Americans | 93.8 /100 | #125 | Exceptional 24.6% |
| Immigrants | Uruguay | 93.8 /100 | #126 | Exceptional 24.6% |
| German Russians | 93.7 /100 | #127 | Exceptional 24.6% |
| Immigrants | Central America | 93.5 /100 | #128 | Exceptional 24.6% |
| Yup'ik | 93.3 /100 | #129 | Exceptional 24.7% |
| Alsatians | 93.2 /100 | #130 | Exceptional 24.7% |
| Immigrants | Philippines | 93.0 /100 | #131 | Exceptional 24.7% |
| Immigrants | Costa Rica | 92.4 /100 | #132 | Exceptional 24.7% |
| Colombians | 92.4 /100 | #133 | Exceptional 24.7% |