Immigrants from Philippines vs Immigrants from North Macedonia Wage/Income Gap
COMPARE
Immigrants from Philippines
Immigrants from North Macedonia
Wage/Income Gap
Wage/Income Gap Comparison
Immigrants from Philippines
Immigrants from North Macedonia
24.7%
WAGE/INCOME GAP
93.0/ 100
METRIC RATING
131st/ 347
METRIC RANK
28.4%
WAGE/INCOME GAP
0.2/ 100
METRIC RATING
299th/ 347
METRIC RANK
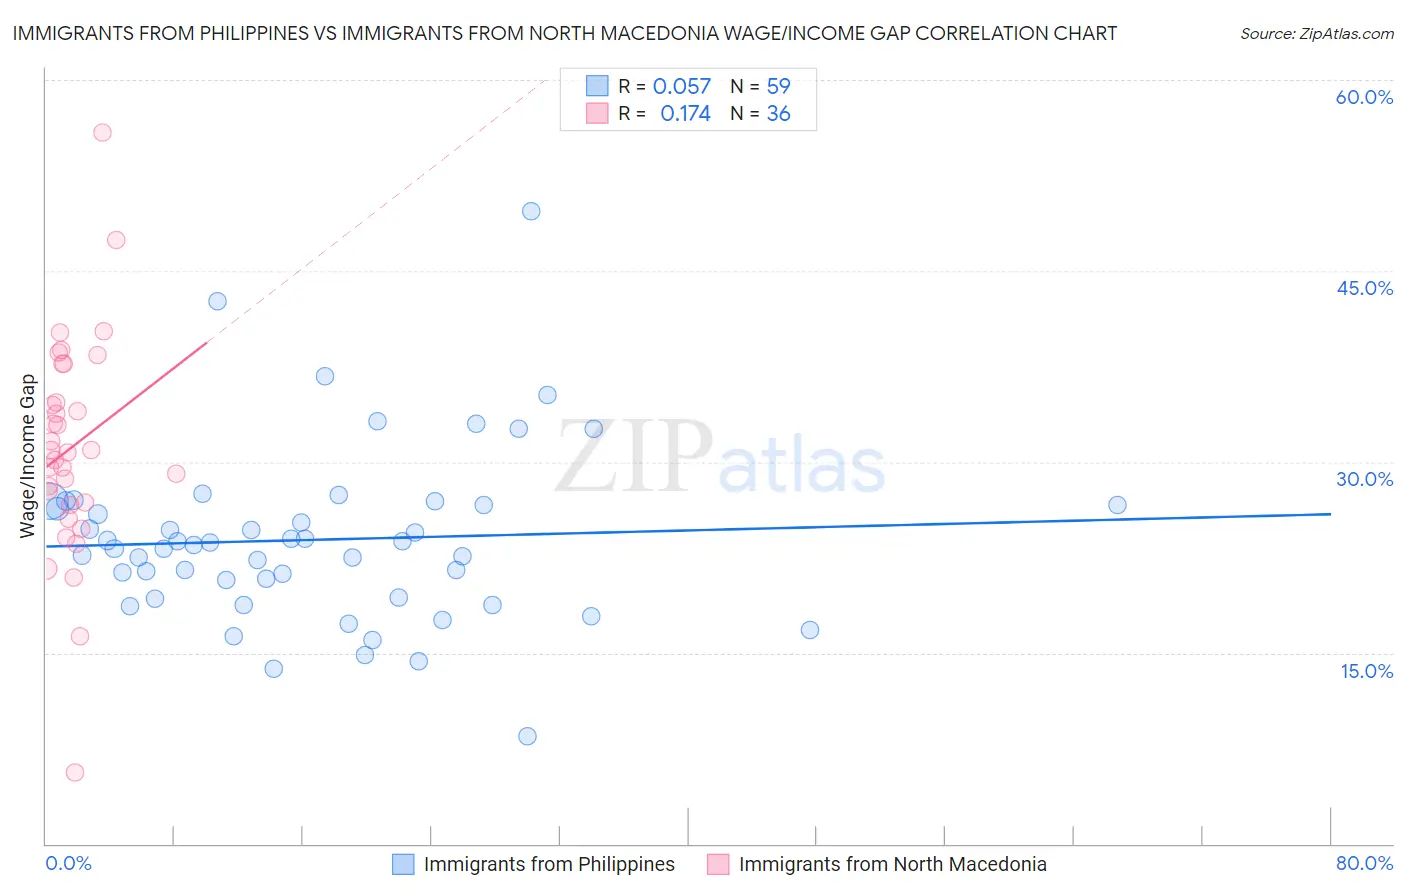
Immigrants from Philippines vs Immigrants from North Macedonia Wage/Income Gap Correlation Chart
The statistical analysis conducted on geographies consisting of 470,842,100 people shows a slight positive correlation between the proportion of Immigrants from Philippines and wage/income gap percentage in the United States with a correlation coefficient (R) of 0.057 and weighted average of 24.7%. Similarly, the statistical analysis conducted on geographies consisting of 74,314,405 people shows a poor positive correlation between the proportion of Immigrants from North Macedonia and wage/income gap percentage in the United States with a correlation coefficient (R) of 0.174 and weighted average of 28.4%, a difference of 15.1%.
Wage/Income Gap Correlation Summary
| Measurement | Immigrants from Philippines | Immigrants from North Macedonia |
| Minimum | 8.4% | 5.6% |
| Maximum | 49.7% | 55.9% |
| Range | 41.3% | 50.3% |
| Mean | 23.9% | 31.1% |
| Median | 23.5% | 30.8% |
| Interquartile 25% (IQ1) | 19.4% | 26.7% |
| Interquartile 75% (IQ3) | 26.6% | 36.2% |
| Interquartile Range (IQR) | 7.3% | 9.4% |
| Standard Deviation (Sample) | 6.8% | 8.7% |
| Standard Deviation (Population) | 6.8% | 8.6% |
Similar Demographics by Wage/Income Gap
Demographics Similar to Immigrants from Philippines by Wage/Income Gap
In terms of wage/income gap, the demographic groups most similar to Immigrants from Philippines are Alsatian (24.7%, a difference of 0.070%), Yup'ik (24.7%, a difference of 0.090%), Immigrants from Central America (24.6%, a difference of 0.15%), Immigrants from Costa Rica (24.7%, a difference of 0.15%), and Colombian (24.7%, a difference of 0.15%).
| Demographics | Rating | Rank | Wage/Income Gap |
| Immigrants | South America | 93.9 /100 | #124 | Exceptional 24.6% |
| Spanish Americans | 93.8 /100 | #125 | Exceptional 24.6% |
| Immigrants | Uruguay | 93.8 /100 | #126 | Exceptional 24.6% |
| German Russians | 93.7 /100 | #127 | Exceptional 24.6% |
| Immigrants | Central America | 93.5 /100 | #128 | Exceptional 24.6% |
| Yup'ik | 93.3 /100 | #129 | Exceptional 24.7% |
| Alsatians | 93.2 /100 | #130 | Exceptional 24.7% |
| Immigrants | Philippines | 93.0 /100 | #131 | Exceptional 24.7% |
| Immigrants | Costa Rica | 92.4 /100 | #132 | Exceptional 24.7% |
| Colombians | 92.4 /100 | #133 | Exceptional 24.7% |
| Mexican American Indians | 92.2 /100 | #134 | Exceptional 24.7% |
| South American Indians | 92.0 /100 | #135 | Exceptional 24.7% |
| Armenians | 91.3 /100 | #136 | Exceptional 24.8% |
| Immigrants | South Eastern Asia | 90.9 /100 | #137 | Exceptional 24.8% |
| Immigrants | Bosnia and Herzegovina | 90.1 /100 | #138 | Exceptional 24.8% |
Demographics Similar to Immigrants from North Macedonia by Wage/Income Gap
In terms of wage/income gap, the demographic groups most similar to Immigrants from North Macedonia are Immigrants from North America (28.4%, a difference of 0.050%), Austrian (28.4%, a difference of 0.050%), Immigrants from Northern Europe (28.5%, a difference of 0.12%), Immigrants from Canada (28.5%, a difference of 0.16%), and Scotch-Irish (28.5%, a difference of 0.19%).
| Demographics | Rating | Rank | Wage/Income Gap |
| Immigrants | Australia | 0.3 /100 | #292 | Tragic 28.2% |
| Immigrants | Israel | 0.3 /100 | #293 | Tragic 28.2% |
| Greeks | 0.3 /100 | #294 | Tragic 28.2% |
| Slovenes | 0.3 /100 | #295 | Tragic 28.3% |
| Northern Europeans | 0.3 /100 | #296 | Tragic 28.3% |
| Immigrants | North America | 0.2 /100 | #297 | Tragic 28.4% |
| Austrians | 0.2 /100 | #298 | Tragic 28.4% |
| Immigrants | North Macedonia | 0.2 /100 | #299 | Tragic 28.4% |
| Immigrants | Northern Europe | 0.2 /100 | #300 | Tragic 28.5% |
| Immigrants | Canada | 0.2 /100 | #301 | Tragic 28.5% |
| Scotch-Irish | 0.2 /100 | #302 | Tragic 28.5% |
| Irish | 0.2 /100 | #303 | Tragic 28.5% |
| Immigrants | Netherlands | 0.2 /100 | #304 | Tragic 28.5% |
| Immigrants | South Africa | 0.1 /100 | #305 | Tragic 28.5% |
| Whites/Caucasians | 0.1 /100 | #306 | Tragic 28.5% |