Fostoria, IA Map & Demographics
Fostoria Map
Fostoria Overview
$45,840
PER CAPITA INCOME
$95,795
AVG FAMILY INCOME
$76,250
AVG HOUSEHOLD INCOME
29.9%
WAGE / INCOME GAP [ % ]
70.1¢/ $1
WAGE / INCOME GAP [ $ ]
0.30
INEQUALITY / GINI INDEX
174
TOTAL POPULATION
83
MALE POPULATION
91
FEMALE POPULATION
91.21
MALES / 100 FEMALES
109.64
FEMALES / 100 MALES
56.8
MEDIAN AGE
2.3
AVG FAMILY SIZE
2.0
AVG HOUSEHOLD SIZE
115
LABOR FORCE [ PEOPLE ]
67.6%
PERCENT IN LABOR FORCE
Fostoria Zip Codes
Fostoria Area Codes
Income in Fostoria
Income Overview in Fostoria
Per Capita Income in Fostoria is $45,840, while median incomes of families and households are $95,795 and $76,250 respectively.
| Characteristic | Number | Measure |
| Per Capita Income | 174 | $45,840 |
| Median Family Income | 55 | $95,795 |
| Mean Family Income | 55 | $100,373 |
| Median Household Income | 89 | $76,250 |
| Mean Household Income | 89 | $85,316 |
| Income Deficit | 55 | $0 |
| Wage / Income Gap (%) | 174 | 29.95% |
| Wage / Income Gap ($) | 174 | 70.05¢ per $1 |
| Gini / Inequality Index | 174 | 0.30 |
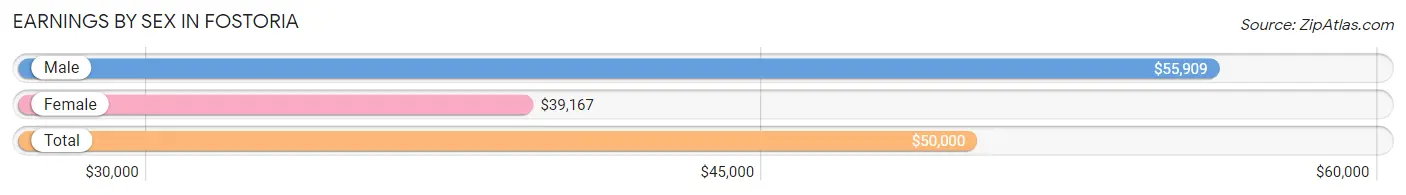
Earnings by Sex in Fostoria
Average Earnings in Fostoria are $50,000, $55,909 for men and $39,167 for women, a difference of 29.9%.
| Sex | Number | Average Earnings |
| Male | 58 (45.3%) | $55,909 |
| Female | 70 (54.7%) | $39,167 |
| Total | 128 (100.0%) | $50,000 |
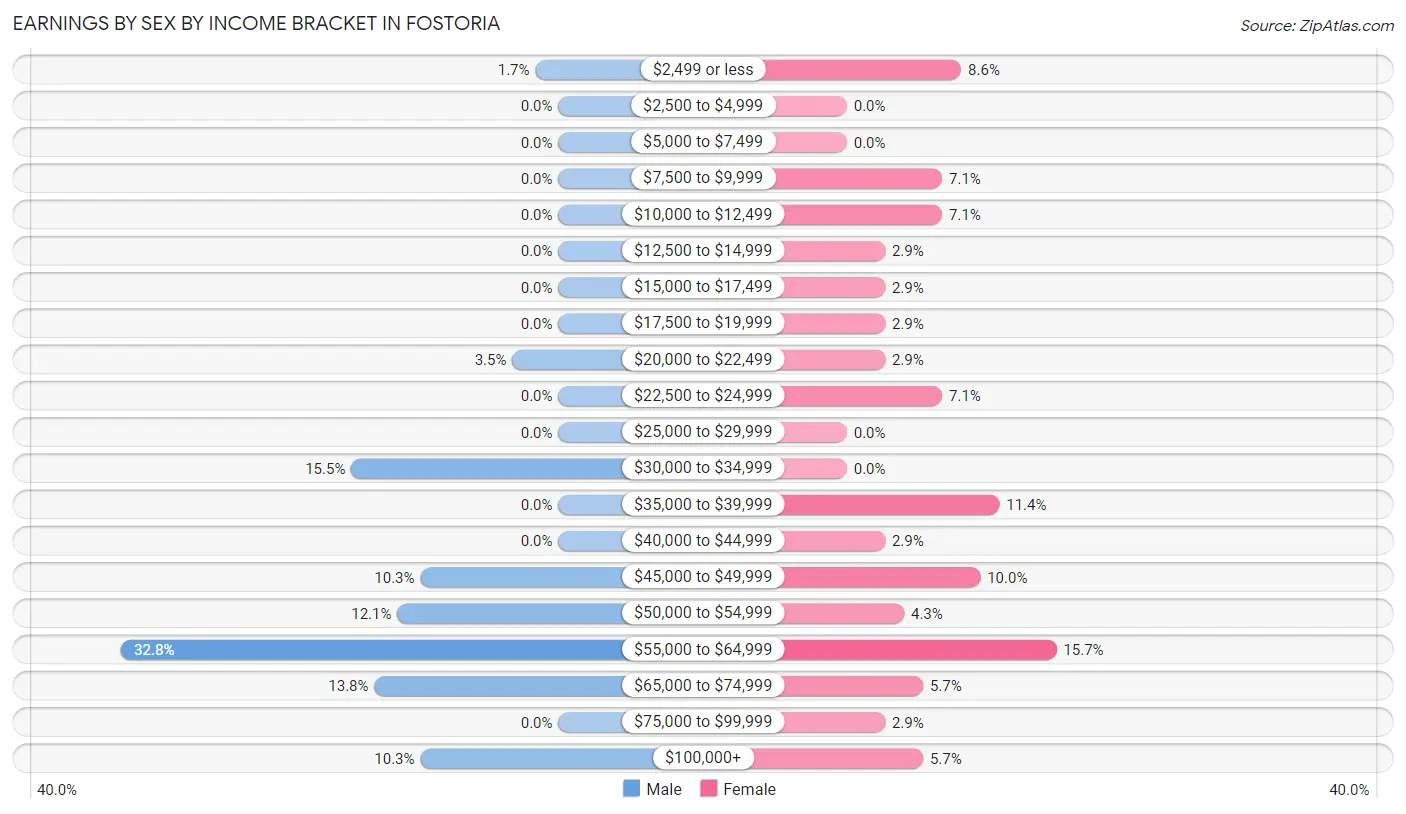
Earnings by Sex by Income Bracket in Fostoria
The most common earnings brackets in Fostoria are $55,000 to $64,999 for men (19 | 32.8%) and $55,000 to $64,999 for women (11 | 15.7%).
| Income | Male | Female |
| $2,499 or less | 1 (1.7%) | 6 (8.6%) |
| $2,500 to $4,999 | 0 (0.0%) | 0 (0.0%) |
| $5,000 to $7,499 | 0 (0.0%) | 0 (0.0%) |
| $7,500 to $9,999 | 0 (0.0%) | 5 (7.1%) |
| $10,000 to $12,499 | 0 (0.0%) | 5 (7.1%) |
| $12,500 to $14,999 | 0 (0.0%) | 2 (2.9%) |
| $15,000 to $17,499 | 0 (0.0%) | 2 (2.9%) |
| $17,500 to $19,999 | 0 (0.0%) | 2 (2.9%) |
| $20,000 to $22,499 | 2 (3.5%) | 2 (2.9%) |
| $22,500 to $24,999 | 0 (0.0%) | 5 (7.1%) |
| $25,000 to $29,999 | 0 (0.0%) | 0 (0.0%) |
| $30,000 to $34,999 | 9 (15.5%) | 0 (0.0%) |
| $35,000 to $39,999 | 0 (0.0%) | 8 (11.4%) |
| $40,000 to $44,999 | 0 (0.0%) | 2 (2.9%) |
| $45,000 to $49,999 | 6 (10.3%) | 7 (10.0%) |
| $50,000 to $54,999 | 7 (12.1%) | 3 (4.3%) |
| $55,000 to $64,999 | 19 (32.8%) | 11 (15.7%) |
| $65,000 to $74,999 | 8 (13.8%) | 4 (5.7%) |
| $75,000 to $99,999 | 0 (0.0%) | 2 (2.9%) |
| $100,000+ | 6 (10.3%) | 4 (5.7%) |
| Total | 58 (100.0%) | 70 (100.0%) |
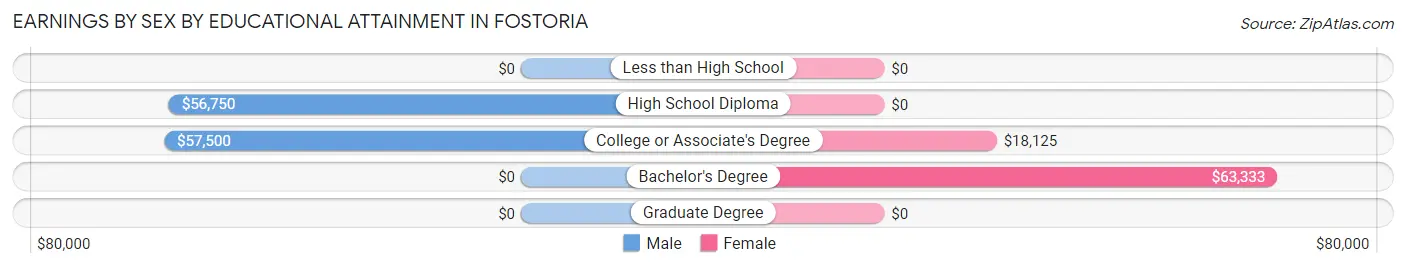
Earnings by Sex by Educational Attainment in Fostoria
Average earnings in Fostoria are $57,222 for men and $39,167 for women, a difference of 31.6%. Men with an educational attainment of college or associate's degree enjoy the highest average annual earnings of $57,500, while those with high school diploma education earn the least with $56,750. Women with an educational attainment of bachelor's degree earn the most with the average annual earnings of $63,333, while those with college or associate's degree education have the smallest earnings of $18,125.
| Educational Attainment | Male Income | Female Income |
| Less than High School | - | - |
| High School Diploma | $56,750 | $0 |
| College or Associate's Degree | $57,500 | $18,125 |
| Bachelor's Degree | - | - |
| Graduate Degree | - | - |
| Total | $57,222 | $39,167 |
Family Income in Fostoria
Family Income Brackets in Fostoria
According to the Fostoria family income data, there are 16 families falling into the $75,000 to $99,999 income range, which is the most common income bracket and makes up 29.1% of all families.
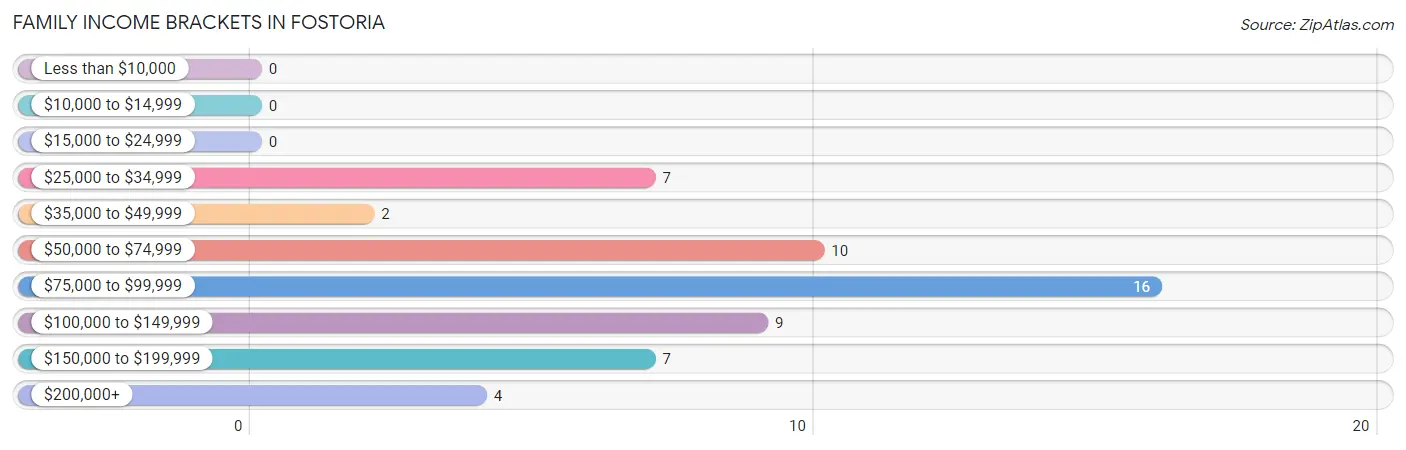
| Income Bracket | # Families | % Families |
| Less than $10,000 | 0 | 0.0% |
| $10,000 to $14,999 | 0 | 0.0% |
| $15,000 to $24,999 | 0 | 0.0% |
| $25,000 to $34,999 | 7 | 12.7% |
| $35,000 to $49,999 | 2 | 3.6% |
| $50,000 to $74,999 | 10 | 18.2% |
| $75,000 to $99,999 | 16 | 29.1% |
| $100,000 to $149,999 | 9 | 16.4% |
| $150,000 to $199,999 | 7 | 12.7% |
| $200,000+ | 4 | 7.3% |
Family Income by Famaliy Size in Fostoria
2-person families (49 | 89.1%) account for the highest median family income in Fostoria with $96,023 per family, while 2-person families (49 | 89.1%) have the highest median income of $48,012 per family member.
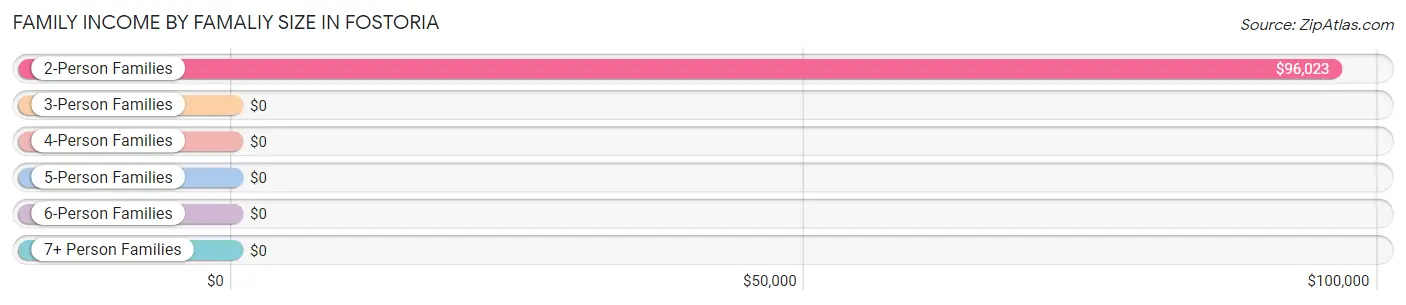
| Income Bracket | # Families | Median Income |
| 2-Person Families | 49 (89.1%) | $96,023 |
| 3-Person Families | 5 (9.1%) | $0 |
| 4-Person Families | 0 (0.0%) | $0 |
| 5-Person Families | 1 (1.8%) | $0 |
| 6-Person Families | 0 (0.0%) | $0 |
| 7+ Person Families | 0 (0.0%) | $0 |
| Total | 55 (100.0%) | $95,795 |
Family Income by Number of Earners in Fostoria
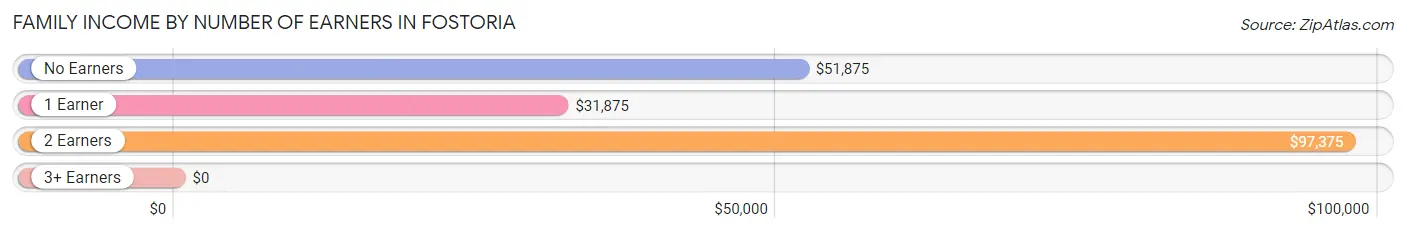
| Number of Earners | # Families | Median Income |
| No Earners | 8 (14.5%) | $51,875 |
| 1 Earner | 8 (14.5%) | $31,875 |
| 2 Earners | 39 (70.9%) | $97,375 |
| 3+ Earners | 0 (0.0%) | $0 |
| Total | 55 (100.0%) | $95,795 |
Household Income in Fostoria
Household Income Brackets in Fostoria
With 23 households falling in the category, the $75,000 to $99,999 income range is the most frequent in Fostoria, accounting for 25.8% of all households.
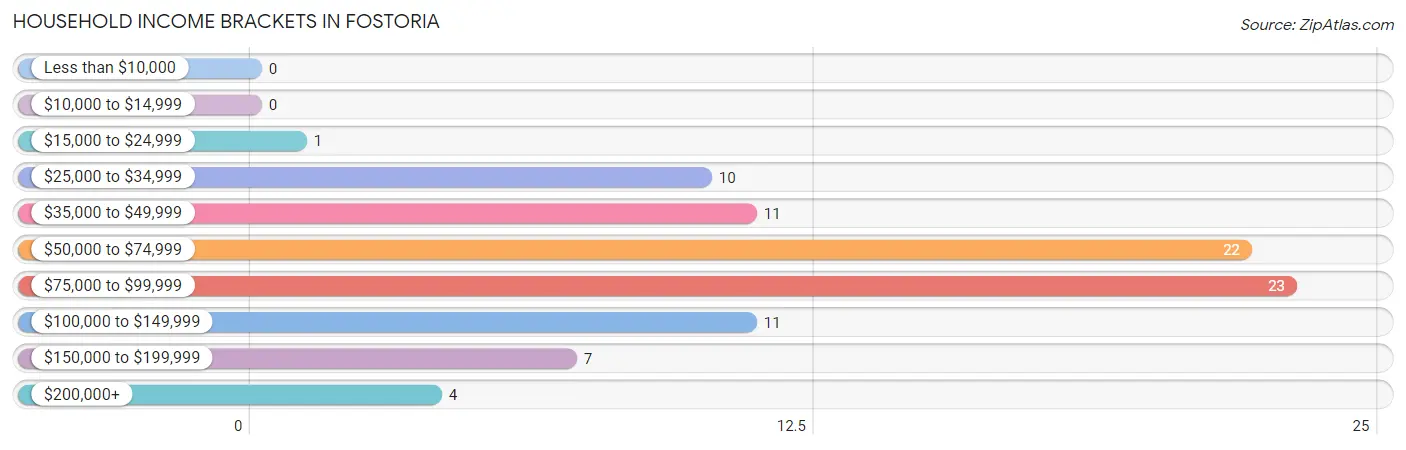
| Income Bracket | # Households | % Households |
| Less than $10,000 | 0 | 0.0% |
| $10,000 to $14,999 | 0 | 0.0% |
| $15,000 to $24,999 | 1 | 1.1% |
| $25,000 to $34,999 | 10 | 11.2% |
| $35,000 to $49,999 | 11 | 12.4% |
| $50,000 to $74,999 | 22 | 24.7% |
| $75,000 to $99,999 | 23 | 25.8% |
| $100,000 to $149,999 | 11 | 12.4% |
| $150,000 to $199,999 | 7 | 7.9% |
| $200,000+ | 4 | 4.5% |
Household Income by Householder Age in Fostoria
The median household income in Fostoria is $76,250, with the highest median household income of $95,125 found in the 45 to 64 years age bracket for the primary householder. A total of 47 households (52.8%) fall into this category. Meanwhile, the 15 to 24 years age bracket for the primary householder has the lowest median household income of $0, with 2 households (2.2%) in this group.
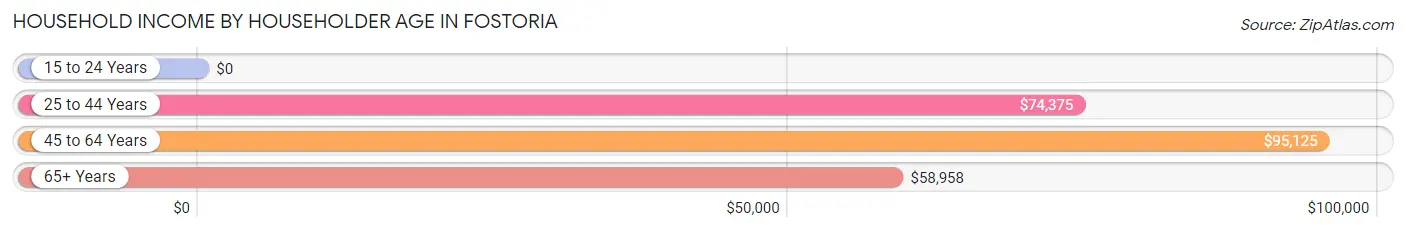
| Income Bracket | # Households | Median Income |
| 15 to 24 Years | 2 (2.2%) | $0 |
| 25 to 44 Years | 9 (10.1%) | $74,375 |
| 45 to 64 Years | 47 (52.8%) | $95,125 |
| 65+ Years | 31 (34.8%) | $58,958 |
| Total | 89 (100.0%) | $76,250 |
Poverty in Fostoria
Income Below Poverty by Sex and Age in Fostoria
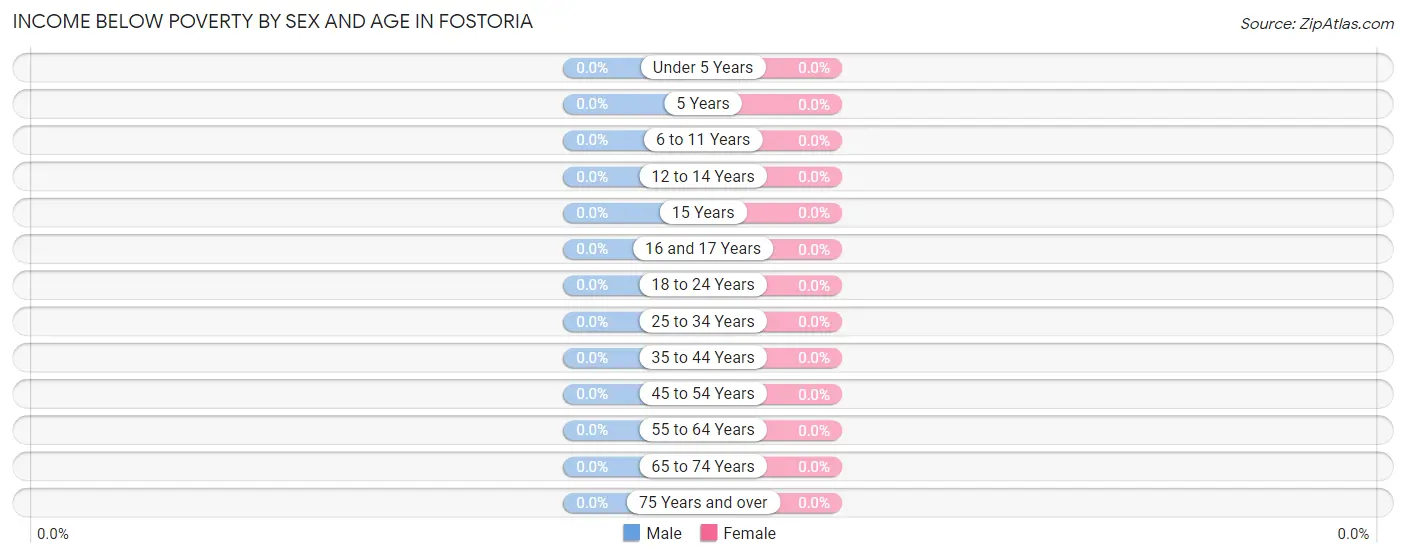
| Age Bracket | Male | Female |
| Under 5 Years | 0 (0.0%) | 0 (0.0%) |
| 5 Years | 0 (0.0%) | 0 (0.0%) |
| 6 to 11 Years | 0 (0.0%) | 0 (0.0%) |
| 12 to 14 Years | 0 (0.0%) | 0 (0.0%) |
| 15 Years | 0 (0.0%) | 0 (0.0%) |
| 16 and 17 Years | 0 (0.0%) | 0 (0.0%) |
| 18 to 24 Years | 0 (0.0%) | 0 (0.0%) |
| 25 to 34 Years | 0 (0.0%) | 0 (0.0%) |
| 35 to 44 Years | 0 (0.0%) | 0 (0.0%) |
| 45 to 54 Years | 0 (0.0%) | 0 (0.0%) |
| 55 to 64 Years | 0 (0.0%) | 0 (0.0%) |
| 65 to 74 Years | 0 (0.0%) | 0 (0.0%) |
| 75 Years and over | 0 (0.0%) | 0 (0.0%) |
| Total | 0 (0.0%) | 0 (0.0%) |
Income Above Poverty by Sex and Age in Fostoria
According to the poverty statistics in Fostoria, males aged 6 to 11 years and females aged under 5 years are the age groups that are most secure financially, with 100.0% of males and 100.0% of females in these age groups living above the poverty line.
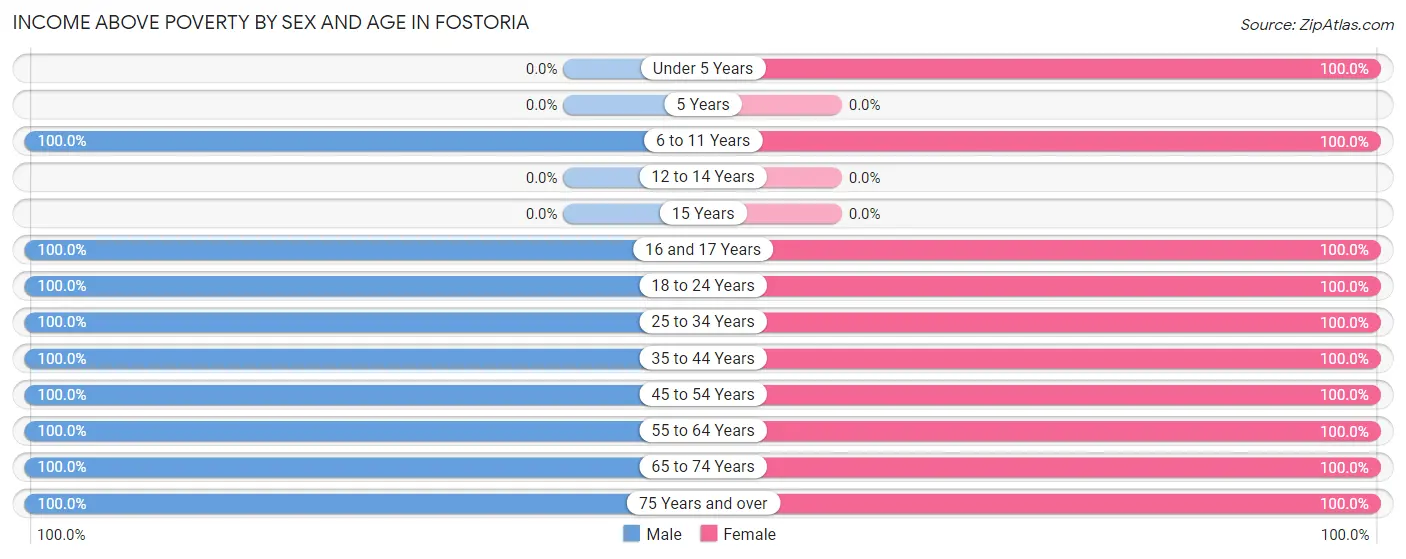
| Age Bracket | Male | Female |
| Under 5 Years | 0 (0.0%) | 1 (100.0%) |
| 5 Years | 0 (0.0%) | 0 (0.0%) |
| 6 to 11 Years | 1 (100.0%) | 2 (100.0%) |
| 12 to 14 Years | 0 (0.0%) | 0 (0.0%) |
| 15 Years | 0 (0.0%) | 0 (0.0%) |
| 16 and 17 Years | 1 (100.0%) | 2 (100.0%) |
| 18 to 24 Years | 11 (100.0%) | 2 (100.0%) |
| 25 to 34 Years | 5 (100.0%) | 4 (100.0%) |
| 35 to 44 Years | 2 (100.0%) | 3 (100.0%) |
| 45 to 54 Years | 15 (100.0%) | 26 (100.0%) |
| 55 to 64 Years | 24 (100.0%) | 20 (100.0%) |
| 65 to 74 Years | 11 (100.0%) | 20 (100.0%) |
| 75 Years and over | 13 (100.0%) | 11 (100.0%) |
| Total | 83 (100.0%) | 91 (100.0%) |
Income Below Poverty Among Married-Couple Families in Fostoria
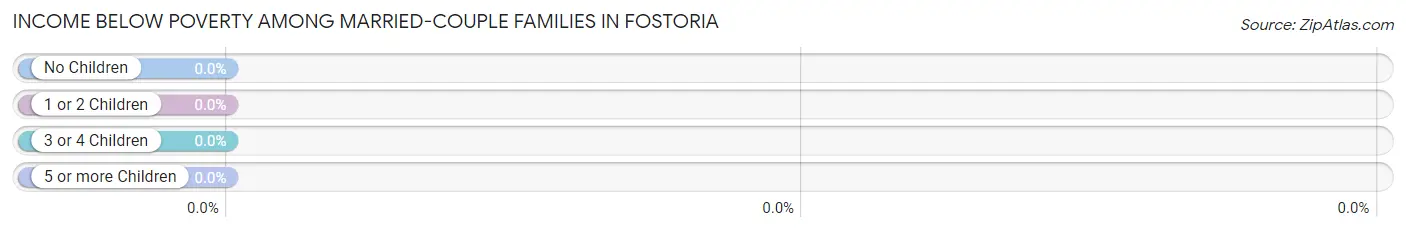
| Children | Above Poverty | Below Poverty |
| No Children | 36 (100.0%) | 0 (0.0%) |
| 1 or 2 Children | 4 (100.0%) | 0 (0.0%) |
| 3 or 4 Children | 1 (100.0%) | 0 (0.0%) |
| 5 or more Children | 0 (0.0%) | 0 (0.0%) |
| Total | 41 (100.0%) | 0 (0.0%) |
Income Below Poverty Among Single-Parent Households in Fostoria
| Children | Single Father | Single Mother |
| No Children | 0 (0.0%) | 0 (0.0%) |
| 1 or 2 Children | 0 (0.0%) | 0 (0.0%) |
| 3 or 4 Children | 0 (0.0%) | 0 (0.0%) |
| 5 or more Children | 0 (0.0%) | 0 (0.0%) |
| Total | 0 (0.0%) | 0 (0.0%) |
Income Below Poverty Among Married-Couple vs Single-Parent Households in Fostoria
| Children | Married-Couple Families | Single-Parent Households |
| No Children | 0 (0.0%) | 0 (0.0%) |
| 1 or 2 Children | 0 (0.0%) | 0 (0.0%) |
| 3 or 4 Children | 0 (0.0%) | 0 (0.0%) |
| 5 or more Children | 0 (0.0%) | 0 (0.0%) |
| Total | 0 (0.0%) | 0 (0.0%) |
Race in Fostoria
The most populous races in Fostoria are White / Caucasian (164 | 94.3%), Hispanic or Latino (6 | 3.5%), and Two or more Races (5 | 2.9%).
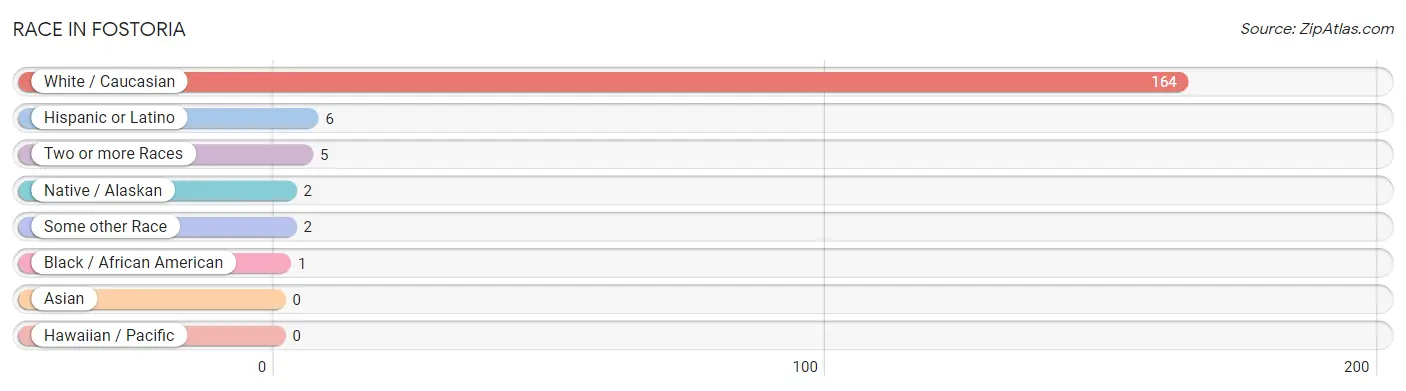
| Race | # Population | % Population |
| Asian | 0 | 0.0% |
| Black / African American | 1 | 0.6% |
| Hawaiian / Pacific | 0 | 0.0% |
| Hispanic or Latino | 6 | 3.5% |
| Native / Alaskan | 2 | 1.1% |
| White / Caucasian | 164 | 94.3% |
| Two or more Races | 5 | 2.9% |
| Some other Race | 2 | 1.1% |
| Total | 174 | 100.0% |
Ancestry in Fostoria
The most populous ancestries reported in Fostoria are German (97 | 55.7%), Irish (43 | 24.7%), Norwegian (18 | 10.3%), Dutch (12 | 6.9%), and Swedish (9 | 5.2%), together accounting for 102.9% of all Fostoria residents.
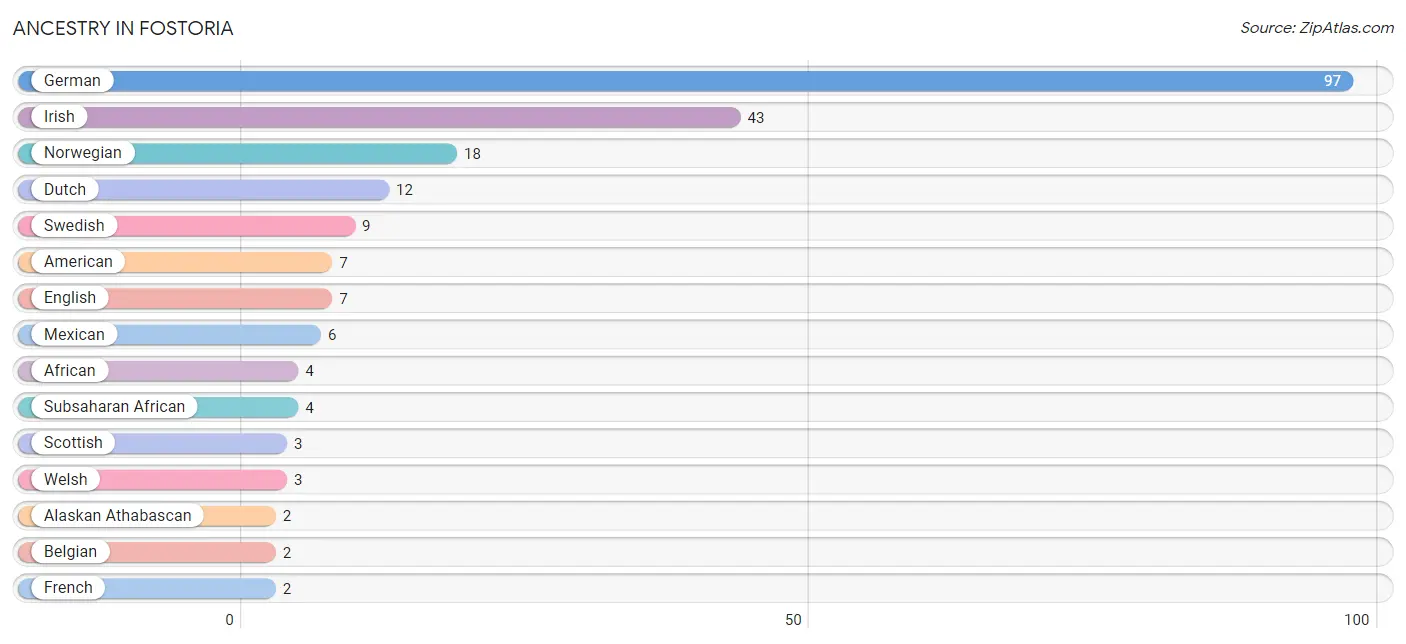
| Ancestry | # Population | % Population |
| African | 4 | 2.3% |
| Alaskan Athabascan | 2 | 1.1% |
| American | 7 | 4.0% |
| Belgian | 2 | 1.1% |
| Dutch | 12 | 6.9% |
| English | 7 | 4.0% |
| French | 2 | 1.1% |
| German | 97 | 55.7% |
| Greek | 1 | 0.6% |
| Irish | 43 | 24.7% |
| Mexican | 6 | 3.5% |
| Norwegian | 18 | 10.3% |
| Polish | 1 | 0.6% |
| Scottish | 3 | 1.7% |
| Subsaharan African | 4 | 2.3% |
| Swedish | 9 | 5.2% |
| Welsh | 3 | 1.7% | View All 17 Rows |
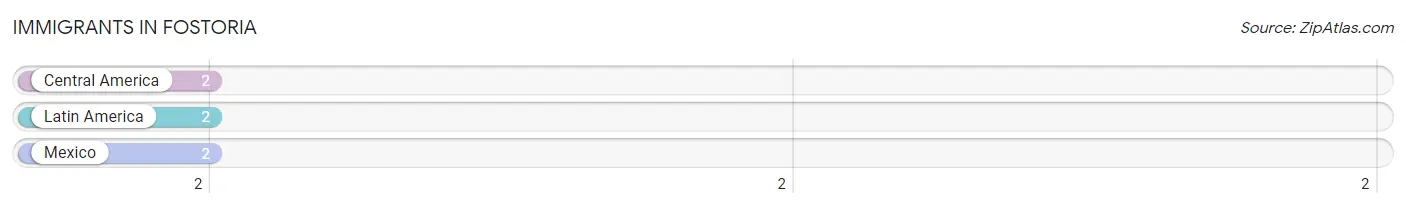
Immigrants in Fostoria
The most numerous immigrant groups reported in Fostoria came from Central America (2 | 1.1%), Latin America (2 | 1.1%), and Mexico (2 | 1.1%), together accounting for 3.5% of all Fostoria residents.
| Immigration Origin | # Population | % Population |
| Central America | 2 | 1.1% |
| Latin America | 2 | 1.1% |
| Mexico | 2 | 1.1% | View All 3 Rows |
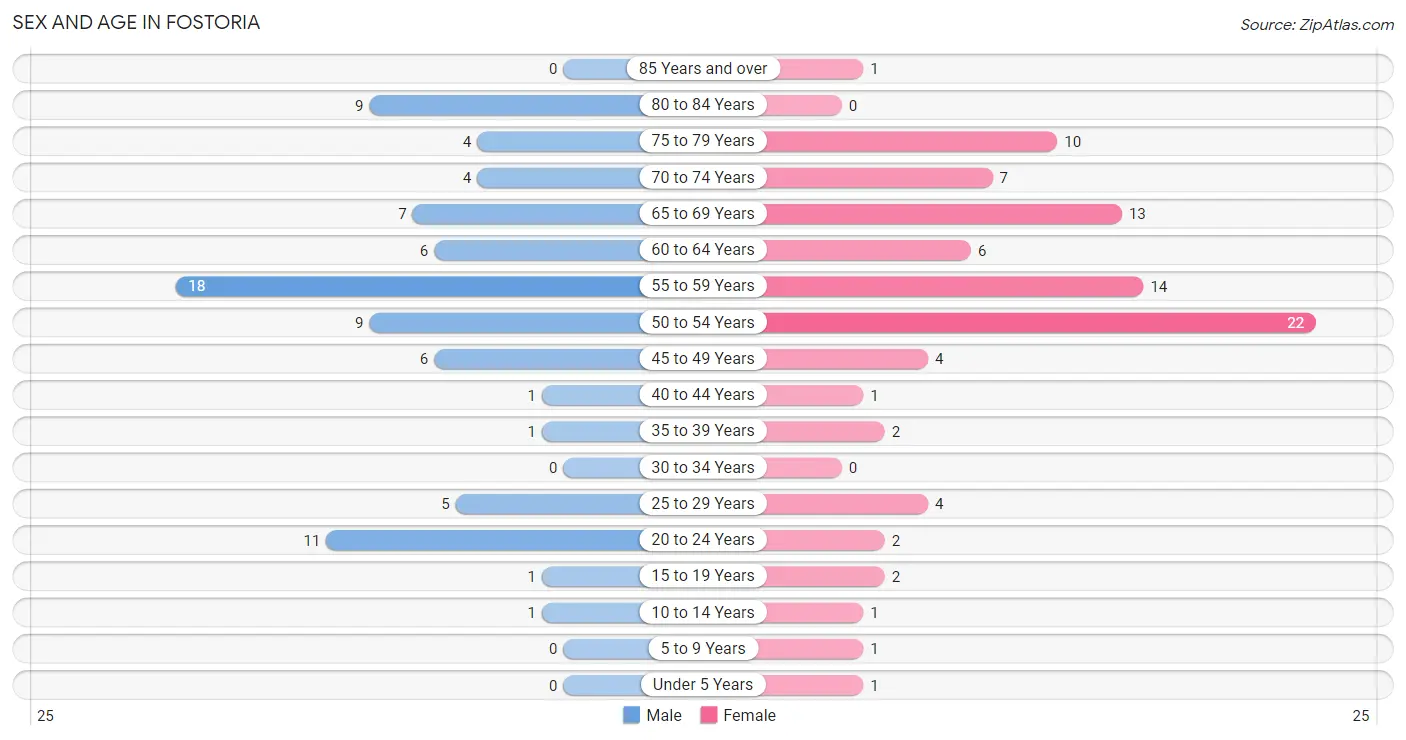
Sex and Age in Fostoria
Sex and Age in Fostoria
The most populous age groups in Fostoria are 55 to 59 Years (18 | 21.7%) for men and 50 to 54 Years (22 | 24.2%) for women.
| Age Bracket | Male | Female |
| Under 5 Years | 0 (0.0%) | 1 (1.1%) |
| 5 to 9 Years | 0 (0.0%) | 1 (1.1%) |
| 10 to 14 Years | 1 (1.2%) | 1 (1.1%) |
| 15 to 19 Years | 1 (1.2%) | 2 (2.2%) |
| 20 to 24 Years | 11 (13.3%) | 2 (2.2%) |
| 25 to 29 Years | 5 (6.0%) | 4 (4.4%) |
| 30 to 34 Years | 0 (0.0%) | 0 (0.0%) |
| 35 to 39 Years | 1 (1.2%) | 2 (2.2%) |
| 40 to 44 Years | 1 (1.2%) | 1 (1.1%) |
| 45 to 49 Years | 6 (7.2%) | 4 (4.4%) |
| 50 to 54 Years | 9 (10.8%) | 22 (24.2%) |
| 55 to 59 Years | 18 (21.7%) | 14 (15.4%) |
| 60 to 64 Years | 6 (7.2%) | 6 (6.6%) |
| 65 to 69 Years | 7 (8.4%) | 13 (14.3%) |
| 70 to 74 Years | 4 (4.8%) | 7 (7.7%) |
| 75 to 79 Years | 4 (4.8%) | 10 (11.0%) |
| 80 to 84 Years | 9 (10.8%) | 0 (0.0%) |
| 85 Years and over | 0 (0.0%) | 1 (1.1%) |
| Total | 83 (100.0%) | 91 (100.0%) |
Families and Households in Fostoria
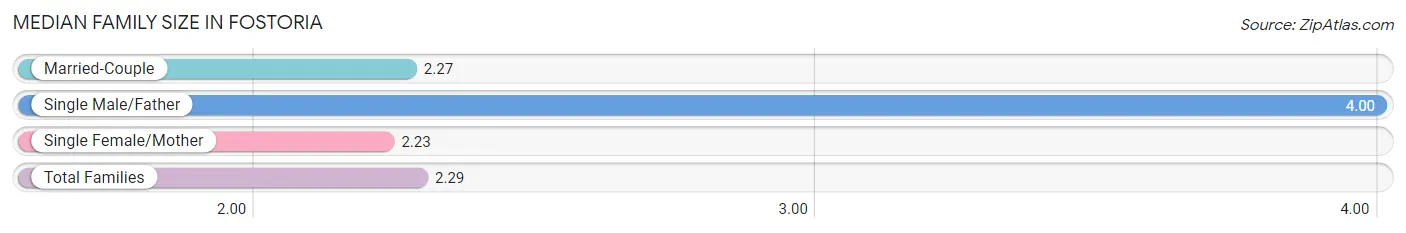
Median Family Size in Fostoria
The median family size in Fostoria is 2.29 persons per family, with single male/father families (1 | 1.8%) accounting for the largest median family size of 4 persons per family. On the other hand, single female/mother families (13 | 23.6%) represent the smallest median family size with 2.23 persons per family.
| Family Type | # Families | Family Size |
| Married-Couple | 41 (74.6%) | 2.27 |
| Single Male/Father | 1 (1.8%) | 4.00 |
| Single Female/Mother | 13 (23.6%) | 2.23 |
| Total Families | 55 (100.0%) | 2.29 |
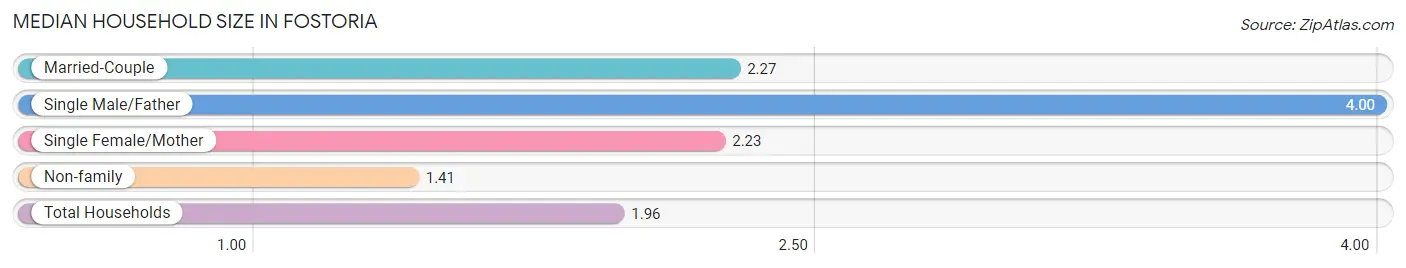
Median Household Size in Fostoria
The median household size in Fostoria is 1.96 persons per household, with single male/father households (1 | 1.1%) accounting for the largest median household size of 4 persons per household. non-family households (34 | 38.2%) represent the smallest median household size with 1.41 persons per household.
| Household Type | # Households | Household Size |
| Married-Couple | 41 (46.1%) | 2.27 |
| Single Male/Father | 1 (1.1%) | 4.00 |
| Single Female/Mother | 13 (14.6%) | 2.23 |
| Non-family | 34 (38.2%) | 1.41 |
| Total Households | 89 (100.0%) | 1.96 |
Household Size by Marriage Status in Fostoria
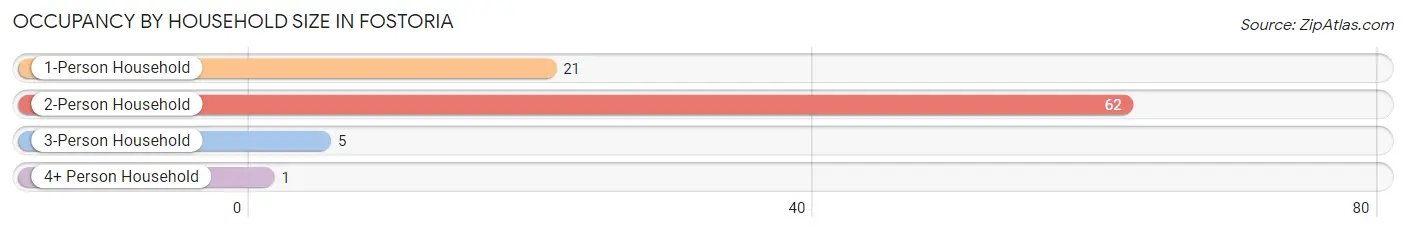
Out of a total of 89 households in Fostoria, 55 (61.8%) are family households, while 34 (38.2%) are nonfamily households. The most numerous type of family households are 2-person households, comprising 49, and the most common type of nonfamily households are 1-person households, comprising 21.
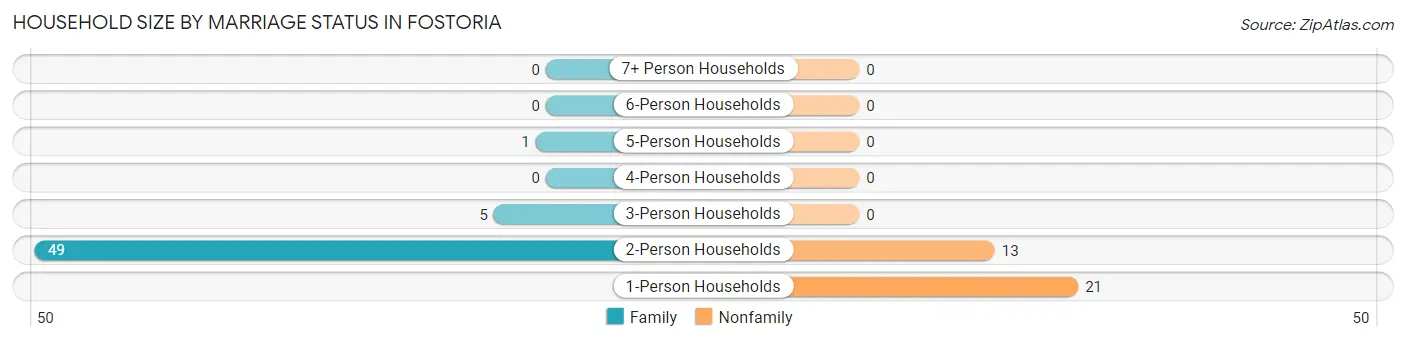
| Household Size | Family Households | Nonfamily Households |
| 1-Person Households | - | 21 (23.6%) |
| 2-Person Households | 49 (55.1%) | 13 (14.6%) |
| 3-Person Households | 5 (5.6%) | 0 (0.0%) |
| 4-Person Households | 0 (0.0%) | 0 (0.0%) |
| 5-Person Households | 1 (1.1%) | 0 (0.0%) |
| 6-Person Households | 0 (0.0%) | 0 (0.0%) |
| 7+ Person Households | 0 (0.0%) | 0 (0.0%) |
| Total | 55 (61.8%) | 34 (38.2%) |
Female Fertility in Fostoria
Fertility by Age in Fostoria
| Age Bracket | Women with Births | Births / 1,000 Women |
| 15 to 19 years | 0 (0.0%) | 0.0 |
| 20 to 34 years | 0 (0.0%) | 0.0 |
| 35 to 50 years | 0 (0.0%) | 0.0 |
| Total | 0 (0.0%) | 0.0 |
Fertility by Age by Marriage Status in Fostoria
| Age Bracket | Married | Unmarried |
| 15 to 19 years | 0 (0.0%) | 0 (0.0%) |
| 20 to 34 years | 0 (0.0%) | 0 (0.0%) |
| 35 to 50 years | 0 (0.0%) | 0 (0.0%) |
| Total | 0 (0.0%) | 0 (0.0%) |
Fertility by Education in Fostoria
| Educational Attainment | Women with Births | Births / 1,000 Women |
| Less than High School | 0 (0.0%) | 0.0 |
| High School Diploma | 0 (0.0%) | 0.0 |
| College or Associate's Degree | 0 (0.0%) | 0.0 |
| Bachelor's Degree | 0 (0.0%) | 0.0 |
| Graduate Degree | 0 (0.0%) | 0.0 |
| Total | 0 (0.0%) | 0.0 |
Fertility by Education by Marriage Status in Fostoria
| Educational Attainment | Married | Unmarried |
| Less than High School | 0 (0.0%) | 0 (0.0%) |
| High School Diploma | 0 (0.0%) | 0 (0.0%) |
| College or Associate's Degree | 0 (0.0%) | 0 (0.0%) |
| Bachelor's Degree | 0 (0.0%) | 0 (0.0%) |
| Graduate Degree | 0 (0.0%) | 0 (0.0%) |
| Total | 0 (0.0%) | 0 (0.0%) |
Employment Characteristics in Fostoria
Employment by Class of Employer in Fostoria
Among the 115 employed individuals in Fostoria, private company employees (74 | 64.3%), state government employees (11 | 9.6%), and self-employed (incorporated) (10 | 8.7%) make up the most common classes of employment.
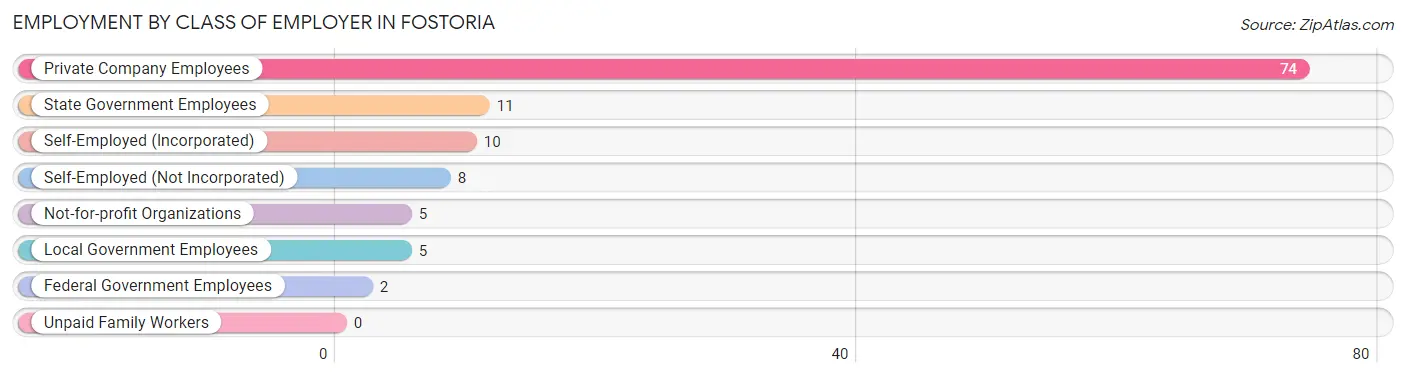
| Employer Class | # Employees | % Employees |
| Private Company Employees | 74 | 64.3% |
| Self-Employed (Incorporated) | 10 | 8.7% |
| Self-Employed (Not Incorporated) | 8 | 7.0% |
| Not-for-profit Organizations | 5 | 4.3% |
| Local Government Employees | 5 | 4.3% |
| State Government Employees | 11 | 9.6% |
| Federal Government Employees | 2 | 1.7% |
| Unpaid Family Workers | 0 | 0.0% |
| Total | 115 | 100.0% |
Employment Status by Age in Fostoria
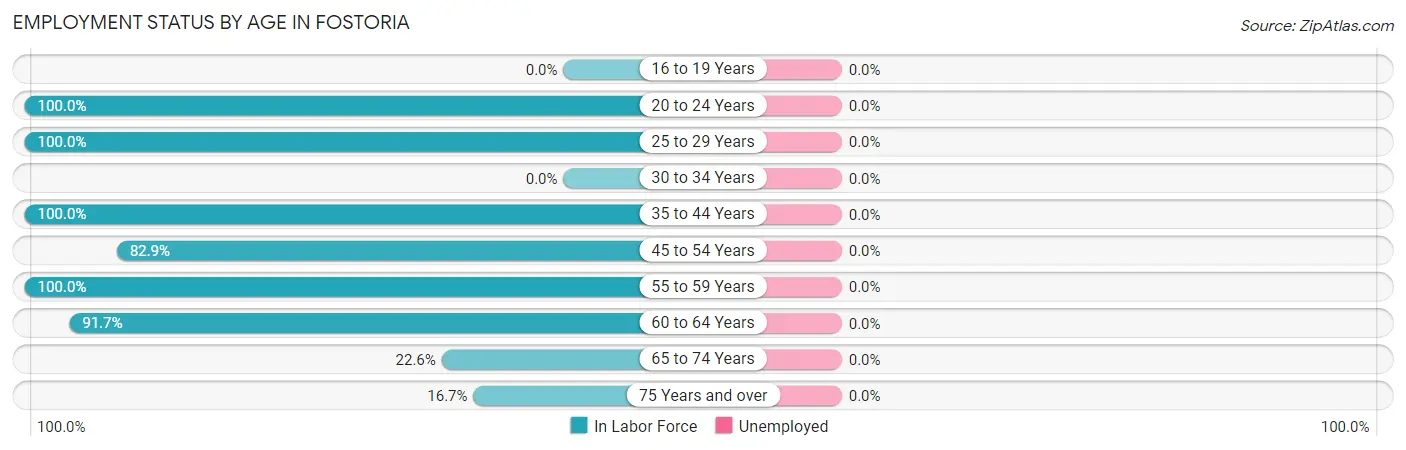
| Age Bracket | In Labor Force | Unemployed |
| 16 to 19 Years | 0 (0.0%) | 0 (0.0%) |
| 20 to 24 Years | 13 (100.0%) | 0 (0.0%) |
| 25 to 29 Years | 9 (100.0%) | 0 (0.0%) |
| 30 to 34 Years | 0 (0.0%) | 0 (0.0%) |
| 35 to 44 Years | 5 (100.0%) | 0 (0.0%) |
| 45 to 54 Years | 34 (82.9%) | 0 (0.0%) |
| 55 to 59 Years | 32 (100.0%) | 0 (0.0%) |
| 60 to 64 Years | 11 (91.7%) | 0 (0.0%) |
| 65 to 74 Years | 7 (22.6%) | 0 (0.0%) |
| 75 Years and over | 4 (16.7%) | 0 (0.0%) |
| Total | 115 (67.6%) | 0 (0.0%) |
Employment Status by Educational Attainment in Fostoria
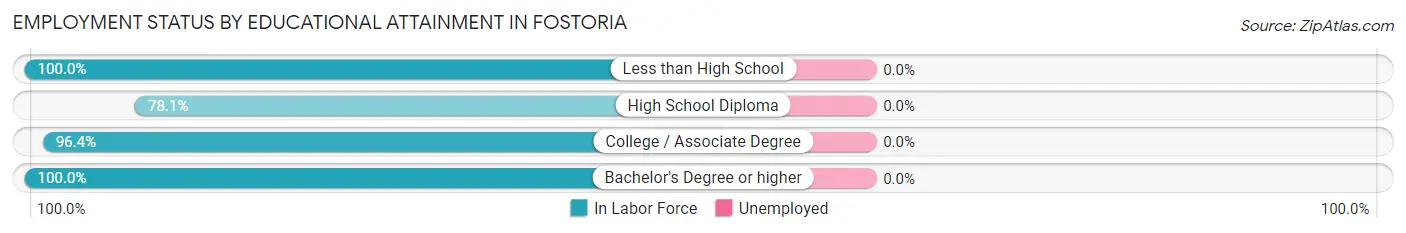
| Educational Attainment | In Labor Force | Unemployed |
| Less than High School | 9 (100.0%) | 0 (0.0%) |
| High School Diploma | 25 (78.1%) | 0 (0.0%) |
| College / Associate Degree | 27 (96.4%) | 0 (0.0%) |
| Bachelor's Degree or higher | 30 (100.0%) | 0 (0.0%) |
| Total | 91 (91.9%) | 0 (0.0%) |
Employment Occupations by Sex in Fostoria
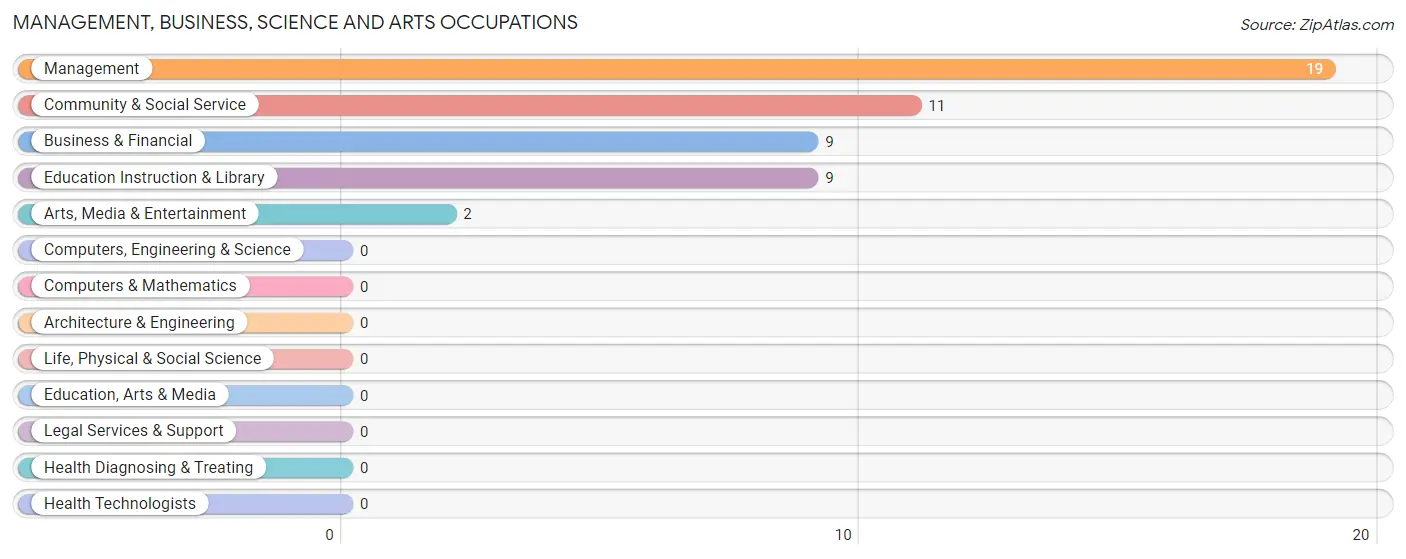
Management, Business, Science and Arts Occupations
The most common Management, Business, Science and Arts occupations in Fostoria are Management (19 | 16.5%), Community & Social Service (11 | 9.6%), Business & Financial (9 | 7.8%), Education Instruction & Library (9 | 7.8%), and Arts, Media & Entertainment (2 | 1.7%).
Management, Business, Science and Arts Occupations by Sex
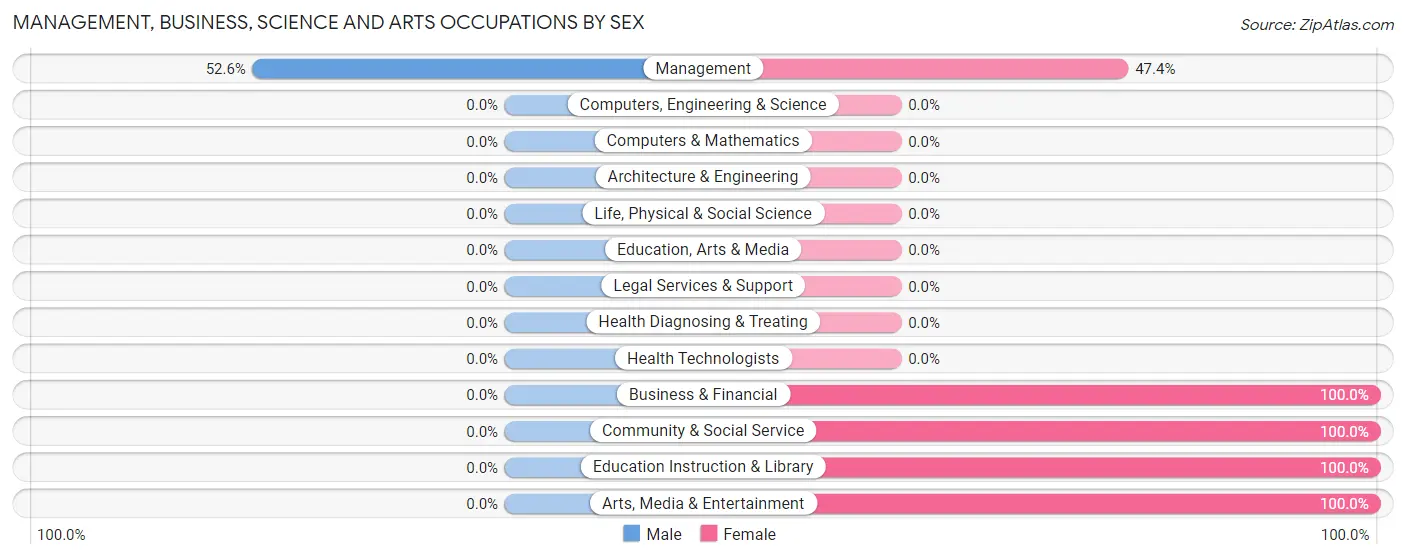
| Occupation | Male | Female |
| Management | 10 (52.6%) | 9 (47.4%) |
| Business & Financial | 0 (0.0%) | 9 (100.0%) |
| Computers, Engineering & Science | 0 (0.0%) | 0 (0.0%) |
| Computers & Mathematics | 0 (0.0%) | 0 (0.0%) |
| Architecture & Engineering | 0 (0.0%) | 0 (0.0%) |
| Life, Physical & Social Science | 0 (0.0%) | 0 (0.0%) |
| Community & Social Service | 0 (0.0%) | 11 (100.0%) |
| Education, Arts & Media | 0 (0.0%) | 0 (0.0%) |
| Legal Services & Support | 0 (0.0%) | 0 (0.0%) |
| Education Instruction & Library | 0 (0.0%) | 9 (100.0%) |
| Arts, Media & Entertainment | 0 (0.0%) | 2 (100.0%) |
| Health Diagnosing & Treating | 0 (0.0%) | 0 (0.0%) |
| Health Technologists | 0 (0.0%) | 0 (0.0%) |
| Total (Category) | 10 (25.6%) | 29 (74.4%) |
| Total (Overall) | 56 (48.7%) | 59 (51.3%) |
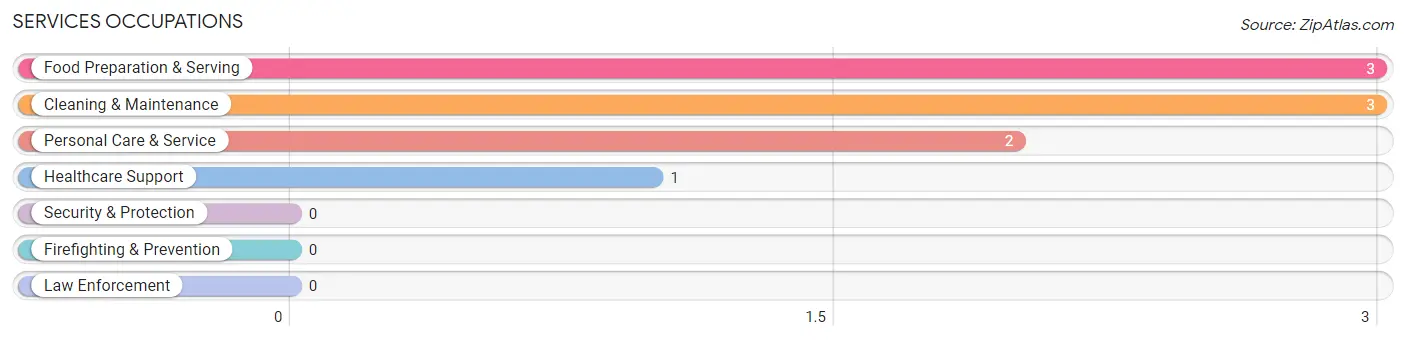
Services Occupations
The most common Services occupations in Fostoria are Food Preparation & Serving (3 | 2.6%), Cleaning & Maintenance (3 | 2.6%), Personal Care & Service (2 | 1.7%), and Healthcare Support (1 | 0.9%).
Services Occupations by Sex
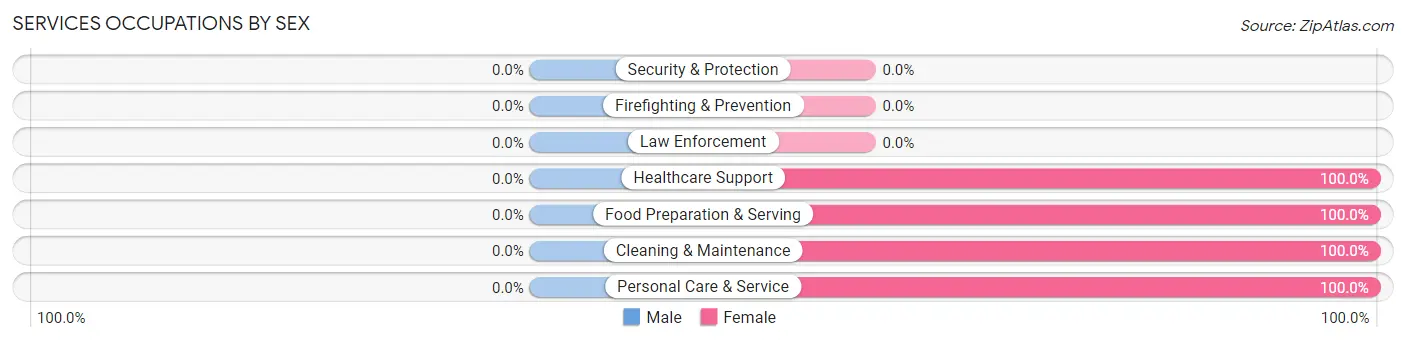
| Occupation | Male | Female |
| Healthcare Support | 0 (0.0%) | 1 (100.0%) |
| Security & Protection | 0 (0.0%) | 0 (0.0%) |
| Firefighting & Prevention | 0 (0.0%) | 0 (0.0%) |
| Law Enforcement | 0 (0.0%) | 0 (0.0%) |
| Food Preparation & Serving | 0 (0.0%) | 3 (100.0%) |
| Cleaning & Maintenance | 0 (0.0%) | 3 (100.0%) |
| Personal Care & Service | 0 (0.0%) | 2 (100.0%) |
| Total (Category) | 0 (0.0%) | 9 (100.0%) |
| Total (Overall) | 56 (48.7%) | 59 (51.3%) |
Sales and Office Occupations
The most common Sales and Office occupations in Fostoria are Office & Administration (11 | 9.6%), and Sales & Related (4 | 3.5%).
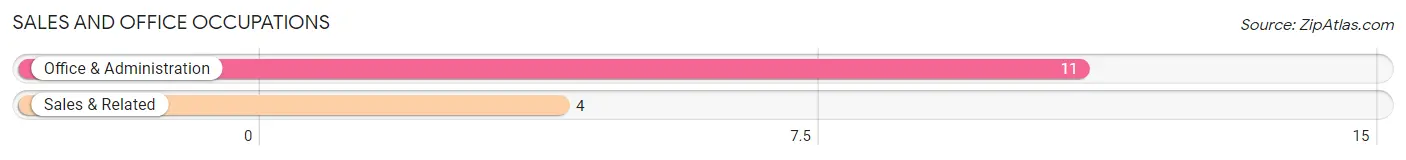
Sales and Office Occupations by Sex
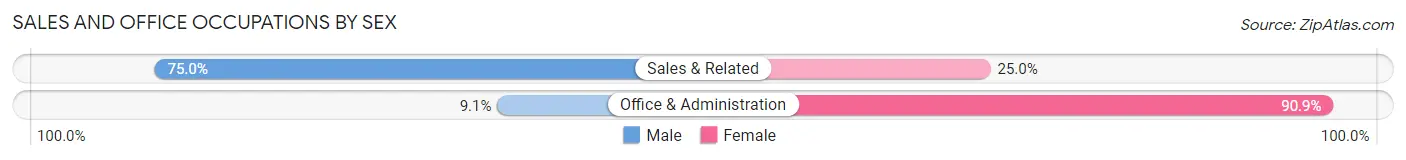
| Occupation | Male | Female |
| Sales & Related | 3 (75.0%) | 1 (25.0%) |
| Office & Administration | 1 (9.1%) | 10 (90.9%) |
| Total (Category) | 4 (26.7%) | 11 (73.3%) |
| Total (Overall) | 56 (48.7%) | 59 (51.3%) |
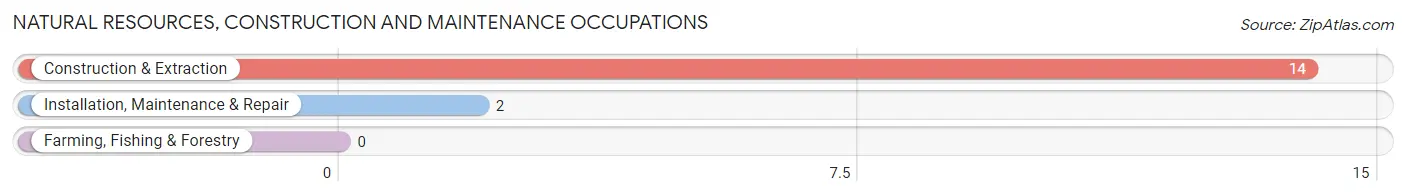
Natural Resources, Construction and Maintenance Occupations
The most common Natural Resources, Construction and Maintenance occupations in Fostoria are Construction & Extraction (14 | 12.2%), and Installation, Maintenance & Repair (2 | 1.7%).
Natural Resources, Construction and Maintenance Occupations by Sex
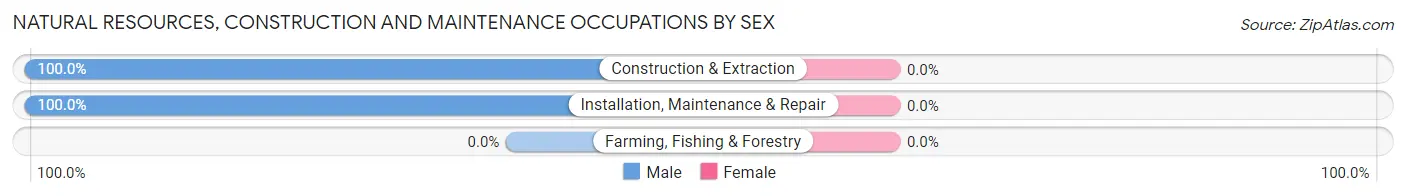
| Occupation | Male | Female |
| Farming, Fishing & Forestry | 0 (0.0%) | 0 (0.0%) |
| Construction & Extraction | 14 (100.0%) | 0 (0.0%) |
| Installation, Maintenance & Repair | 2 (100.0%) | 0 (0.0%) |
| Total (Category) | 16 (100.0%) | 0 (0.0%) |
| Total (Overall) | 56 (48.7%) | 59 (51.3%) |
Production, Transportation and Moving Occupations
The most common Production, Transportation and Moving occupations in Fostoria are Production (20 | 17.4%), Material Moving (9 | 7.8%), and Transportation (7 | 6.1%).
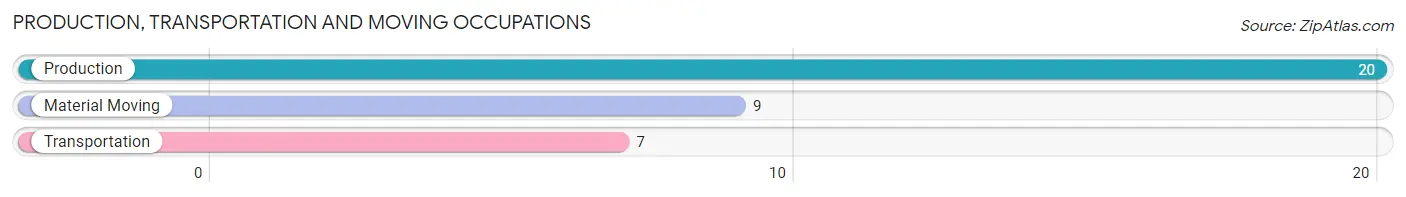
Production, Transportation and Moving Occupations by Sex
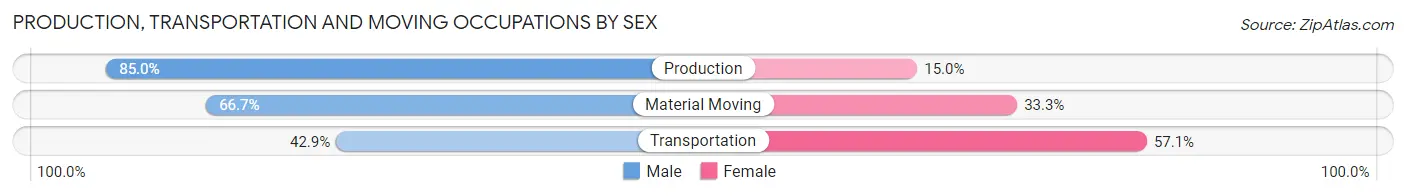
| Occupation | Male | Female |
| Production | 17 (85.0%) | 3 (15.0%) |
| Transportation | 3 (42.9%) | 4 (57.1%) |
| Material Moving | 6 (66.7%) | 3 (33.3%) |
| Total (Category) | 26 (72.2%) | 10 (27.8%) |
| Total (Overall) | 56 (48.7%) | 59 (51.3%) |
Employment Industries by Sex in Fostoria
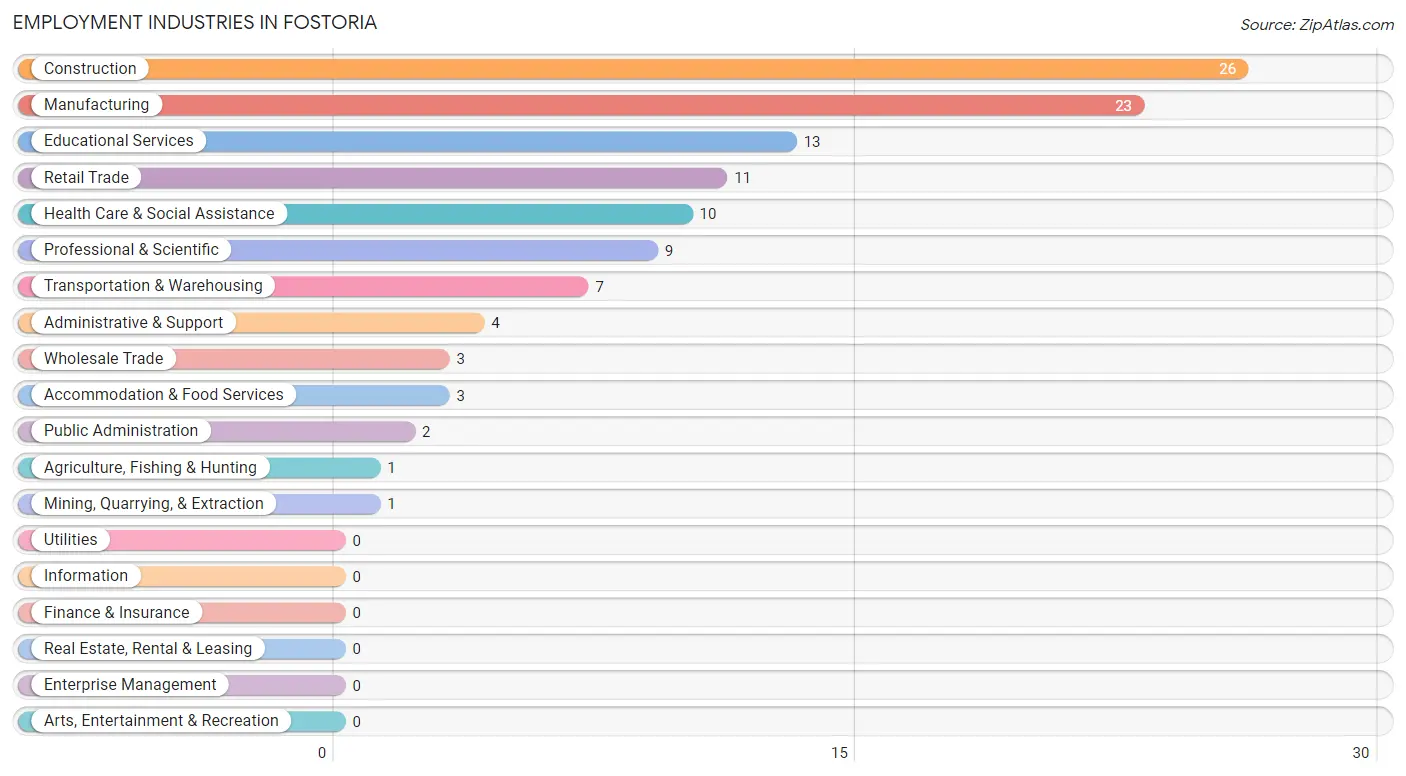
Employment Industries in Fostoria
The major employment industries in Fostoria include Construction (26 | 22.6%), Manufacturing (23 | 20.0%), Educational Services (13 | 11.3%), Retail Trade (11 | 9.6%), and Health Care & Social Assistance (10 | 8.7%).
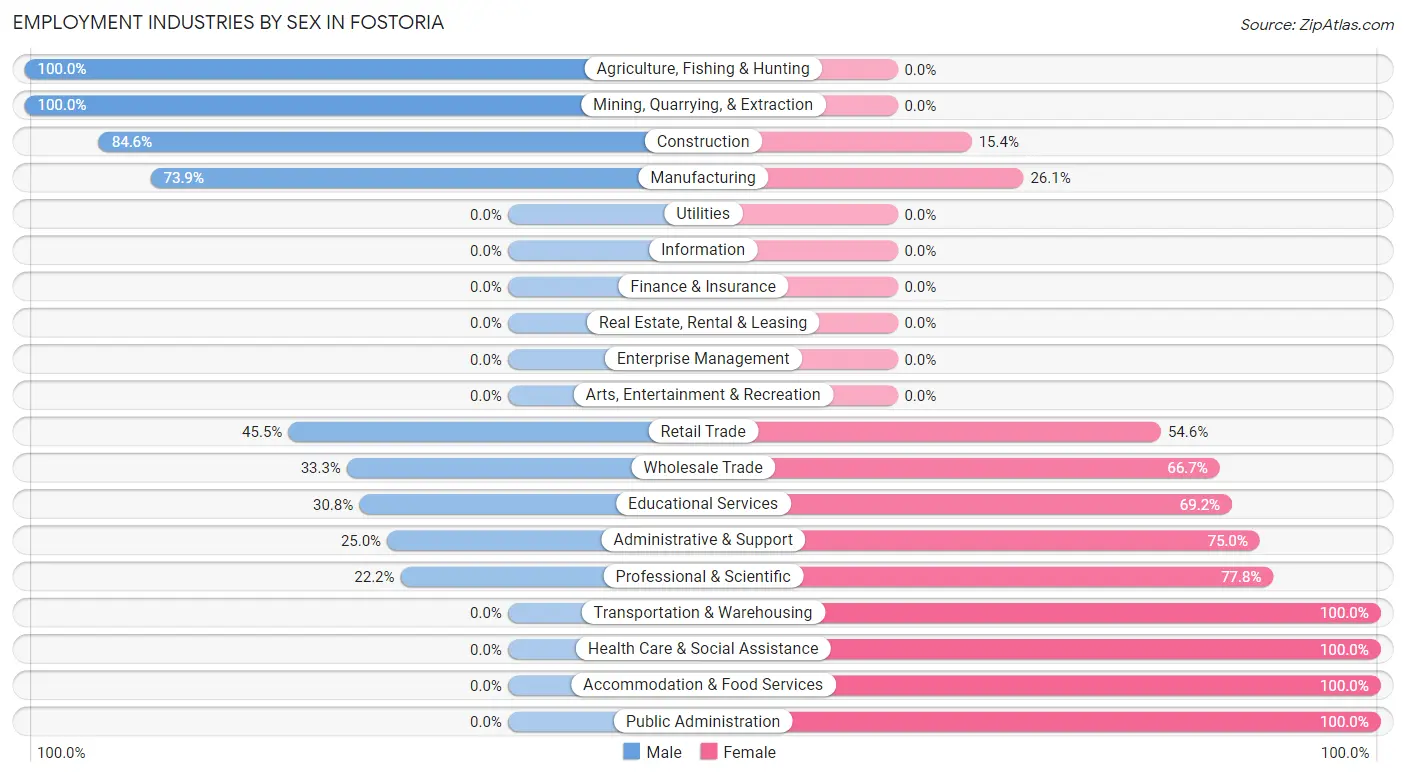
Employment Industries by Sex in Fostoria
The Fostoria industries that see more men than women are Agriculture, Fishing & Hunting (100.0%), Mining, Quarrying, & Extraction (100.0%), and Construction (84.6%), whereas the industries that tend to have a higher number of women are Transportation & Warehousing (100.0%), Health Care & Social Assistance (100.0%), and Accommodation & Food Services (100.0%).
| Industry | Male | Female |
| Agriculture, Fishing & Hunting | 1 (100.0%) | 0 (0.0%) |
| Mining, Quarrying, & Extraction | 1 (100.0%) | 0 (0.0%) |
| Construction | 22 (84.6%) | 4 (15.4%) |
| Manufacturing | 17 (73.9%) | 6 (26.1%) |
| Wholesale Trade | 1 (33.3%) | 2 (66.7%) |
| Retail Trade | 5 (45.5%) | 6 (54.5%) |
| Transportation & Warehousing | 0 (0.0%) | 7 (100.0%) |
| Utilities | 0 (0.0%) | 0 (0.0%) |
| Information | 0 (0.0%) | 0 (0.0%) |
| Finance & Insurance | 0 (0.0%) | 0 (0.0%) |
| Real Estate, Rental & Leasing | 0 (0.0%) | 0 (0.0%) |
| Professional & Scientific | 2 (22.2%) | 7 (77.8%) |
| Enterprise Management | 0 (0.0%) | 0 (0.0%) |
| Administrative & Support | 1 (25.0%) | 3 (75.0%) |
| Educational Services | 4 (30.8%) | 9 (69.2%) |
| Health Care & Social Assistance | 0 (0.0%) | 10 (100.0%) |
| Arts, Entertainment & Recreation | 0 (0.0%) | 0 (0.0%) |
| Accommodation & Food Services | 0 (0.0%) | 3 (100.0%) |
| Public Administration | 0 (0.0%) | 2 (100.0%) |
| Total | 56 (48.7%) | 59 (51.3%) |
Education in Fostoria
School Enrollment in Fostoria
The most common levels of schooling among the 6 students in Fostoria are elementary school (3 | 50.0%), and high school (3 | 50.0%).
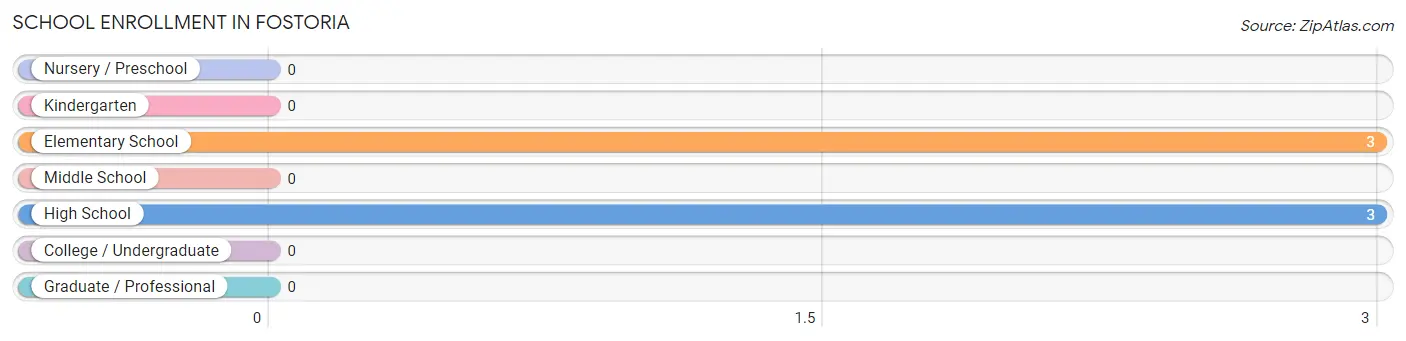
| School Level | # Students | % Students |
| Nursery / Preschool | 0 | 0.0% |
| Kindergarten | 0 | 0.0% |
| Elementary School | 3 | 50.0% |
| Middle School | 0 | 0.0% |
| High School | 3 | 50.0% |
| College / Undergraduate | 0 | 0.0% |
| Graduate / Professional | 0 | 0.0% |
| Total | 6 | 100.0% |
School Enrollment by Age by Funding Source in Fostoria
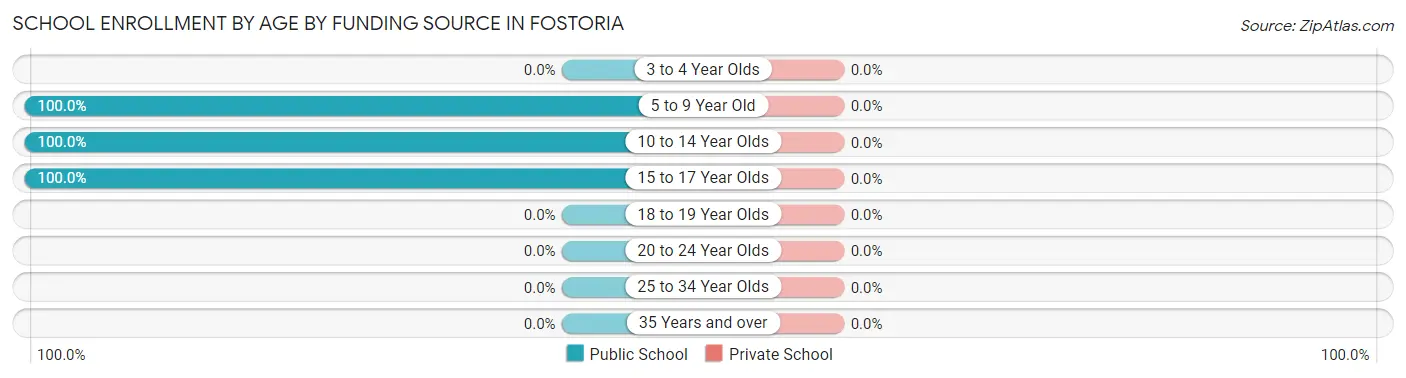
| Age Bracket | Public School | Private School |
| 3 to 4 Year Olds | 0 (0.0%) | 0 (0.0%) |
| 5 to 9 Year Old | 1 (100.0%) | 0 (0.0%) |
| 10 to 14 Year Olds | 2 (100.0%) | 0 (0.0%) |
| 15 to 17 Year Olds | 3 (100.0%) | 0 (0.0%) |
| 18 to 19 Year Olds | 0 (0.0%) | 0 (0.0%) |
| 20 to 24 Year Olds | 0 (0.0%) | 0 (0.0%) |
| 25 to 34 Year Olds | 0 (0.0%) | 0 (0.0%) |
| 35 Years and over | 0 (0.0%) | 0 (0.0%) |
| Total | 6 (100.0%) | 0 (0.0%) |
Educational Attainment by Field of Study in Fostoria
Business (10 | 23.3%), education (7 | 16.3%), social sciences (6 | 14.0%), liberal arts & history (6 | 14.0%), and science & technology (4 | 9.3%) are the most common fields of study among 43 individuals in Fostoria who have obtained a bachelor's degree or higher.
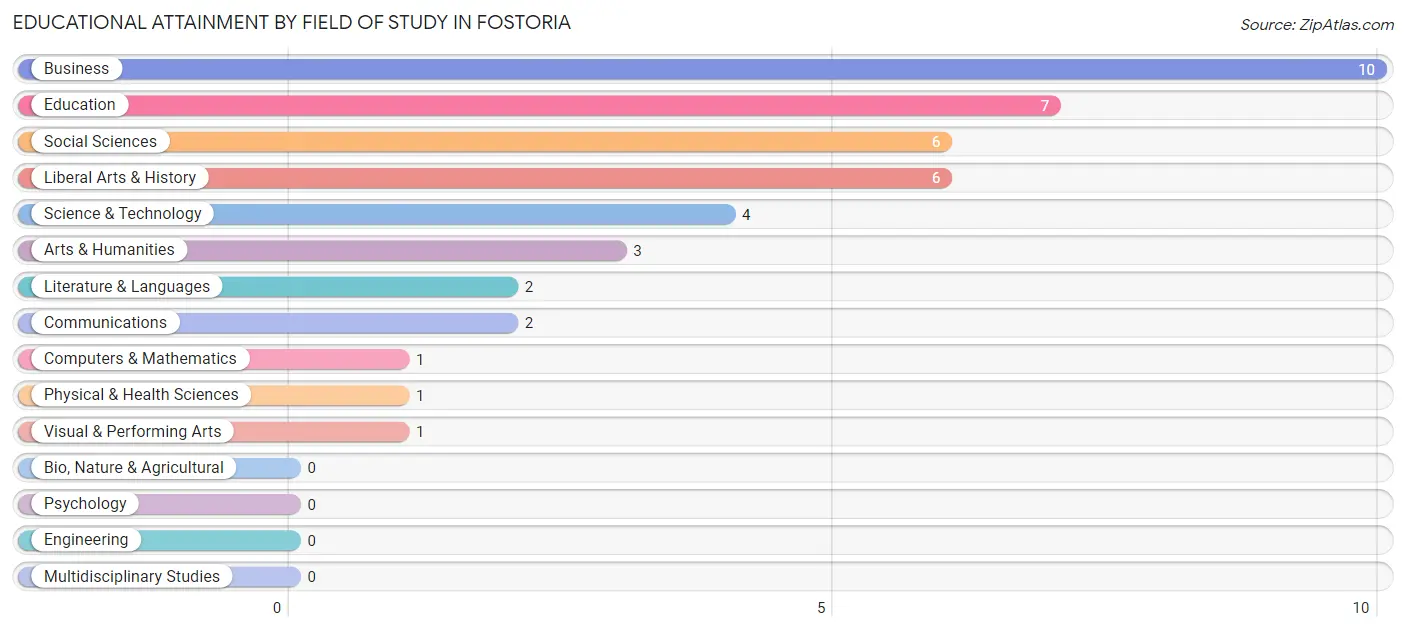
| Field of Study | # Graduates | % Graduates |
| Computers & Mathematics | 1 | 2.3% |
| Bio, Nature & Agricultural | 0 | 0.0% |
| Physical & Health Sciences | 1 | 2.3% |
| Psychology | 0 | 0.0% |
| Social Sciences | 6 | 14.0% |
| Engineering | 0 | 0.0% |
| Multidisciplinary Studies | 0 | 0.0% |
| Science & Technology | 4 | 9.3% |
| Business | 10 | 23.3% |
| Education | 7 | 16.3% |
| Literature & Languages | 2 | 4.6% |
| Liberal Arts & History | 6 | 14.0% |
| Visual & Performing Arts | 1 | 2.3% |
| Communications | 2 | 4.6% |
| Arts & Humanities | 3 | 7.0% |
| Total | 43 | 100.0% |
Transportation & Commute in Fostoria
Vehicle Availability by Sex in Fostoria
The most prevalent vehicle ownership categories in Fostoria are males with 2 vehicles (26, accounting for 46.4%) and females with 2 vehicles (24, making up 44.1%).
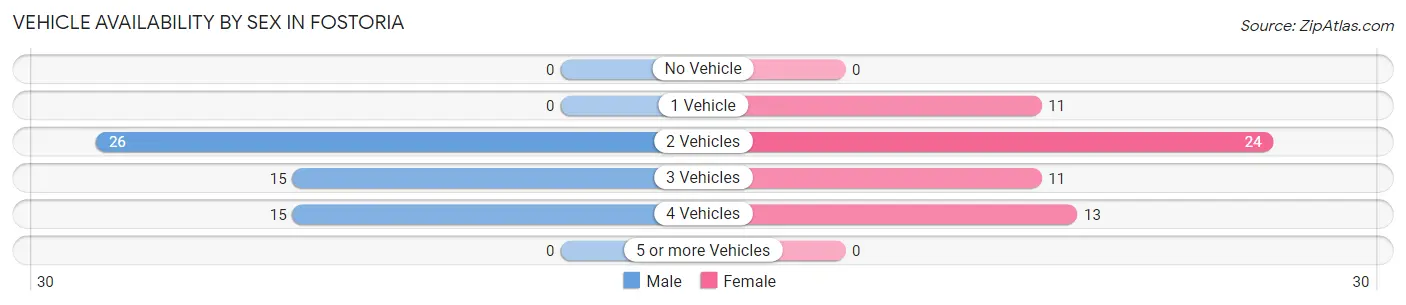
| Vehicles Available | Male | Female |
| No Vehicle | 0 (0.0%) | 0 (0.0%) |
| 1 Vehicle | 0 (0.0%) | 11 (18.6%) |
| 2 Vehicles | 26 (46.4%) | 24 (40.7%) |
| 3 Vehicles | 15 (26.8%) | 11 (18.6%) |
| 4 Vehicles | 15 (26.8%) | 13 (22.0%) |
| 5 or more Vehicles | 0 (0.0%) | 0 (0.0%) |
| Total | 56 (100.0%) | 59 (100.0%) |
Commute Time in Fostoria
The most frequently occuring commute durations in Fostoria are 15 to 19 minutes (29 commuters, 26.9%), 10 to 14 minutes (26 commuters, 24.1%), and 30 to 34 minutes (15 commuters, 13.9%).
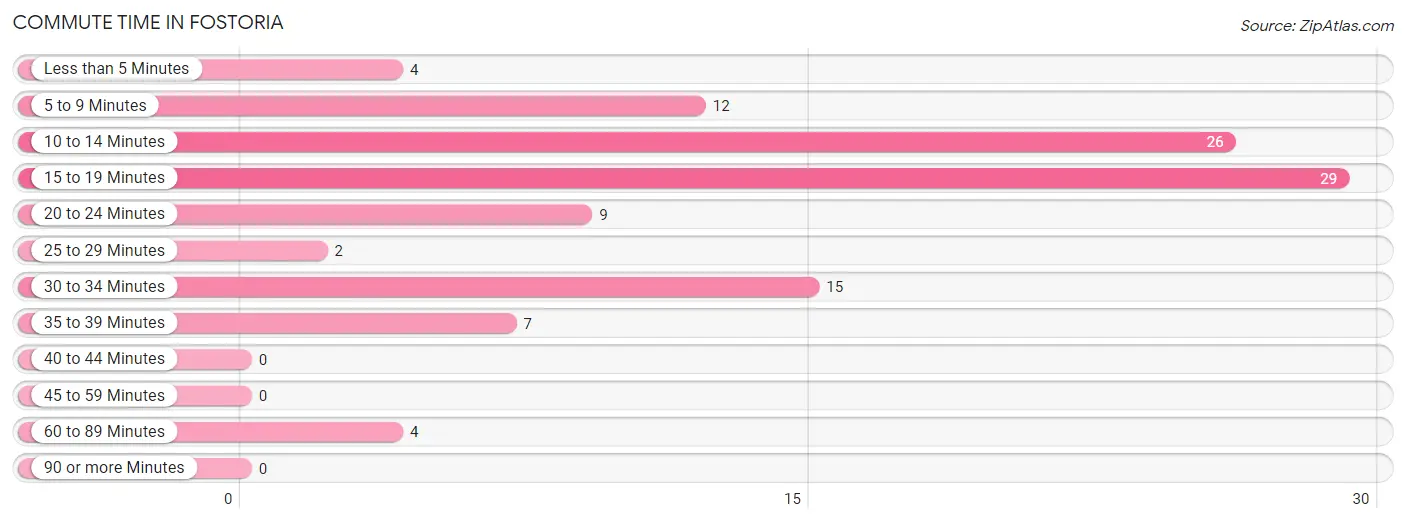
| Commute Time | # Commuters | % Commuters |
| Less than 5 Minutes | 4 | 3.7% |
| 5 to 9 Minutes | 12 | 11.1% |
| 10 to 14 Minutes | 26 | 24.1% |
| 15 to 19 Minutes | 29 | 26.9% |
| 20 to 24 Minutes | 9 | 8.3% |
| 25 to 29 Minutes | 2 | 1.8% |
| 30 to 34 Minutes | 15 | 13.9% |
| 35 to 39 Minutes | 7 | 6.5% |
| 40 to 44 Minutes | 0 | 0.0% |
| 45 to 59 Minutes | 0 | 0.0% |
| 60 to 89 Minutes | 4 | 3.7% |
| 90 or more Minutes | 0 | 0.0% |
Commute Time by Sex in Fostoria
The most common commute times in Fostoria are 10 to 14 minutes (20 commuters, 35.7%) for males and 15 to 19 minutes (14 commuters, 26.9%) for females.
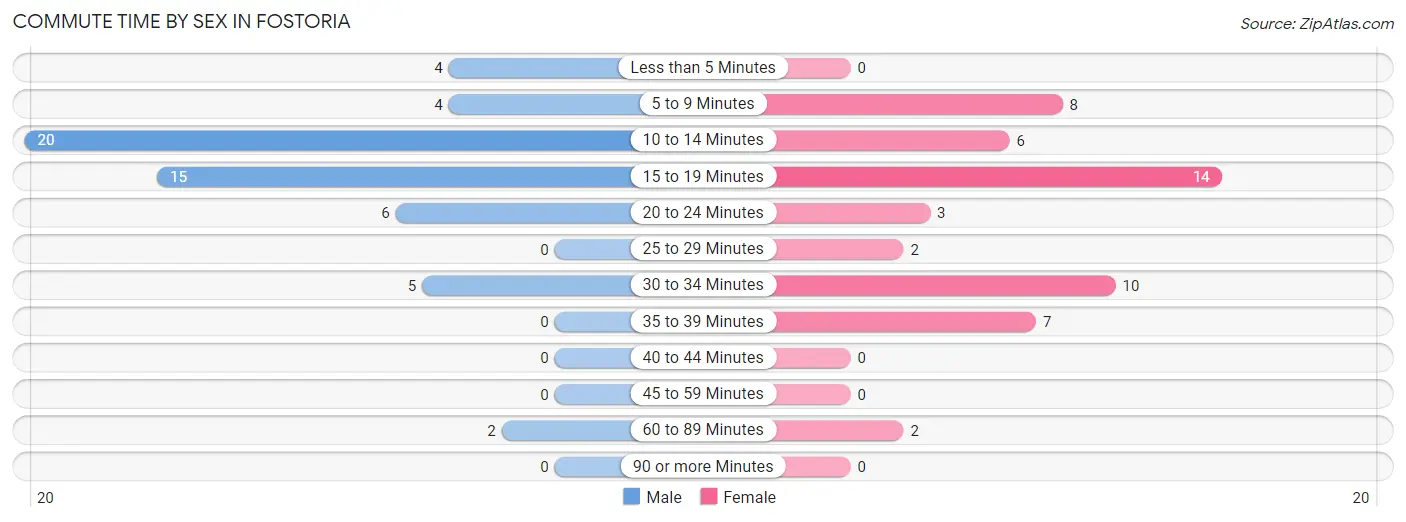
| Commute Time | Male | Female |
| Less than 5 Minutes | 4 (7.1%) | 0 (0.0%) |
| 5 to 9 Minutes | 4 (7.1%) | 8 (15.4%) |
| 10 to 14 Minutes | 20 (35.7%) | 6 (11.5%) |
| 15 to 19 Minutes | 15 (26.8%) | 14 (26.9%) |
| 20 to 24 Minutes | 6 (10.7%) | 3 (5.8%) |
| 25 to 29 Minutes | 0 (0.0%) | 2 (3.8%) |
| 30 to 34 Minutes | 5 (8.9%) | 10 (19.2%) |
| 35 to 39 Minutes | 0 (0.0%) | 7 (13.5%) |
| 40 to 44 Minutes | 0 (0.0%) | 0 (0.0%) |
| 45 to 59 Minutes | 0 (0.0%) | 0 (0.0%) |
| 60 to 89 Minutes | 2 (3.6%) | 2 (3.8%) |
| 90 or more Minutes | 0 (0.0%) | 0 (0.0%) |
Time of Departure to Work by Sex in Fostoria
The most frequent times of departure to work in Fostoria are 7:00 AM to 7:29 AM (17, 30.4%) for males and 7:30 AM to 7:59 AM (13, 25.0%) for females.
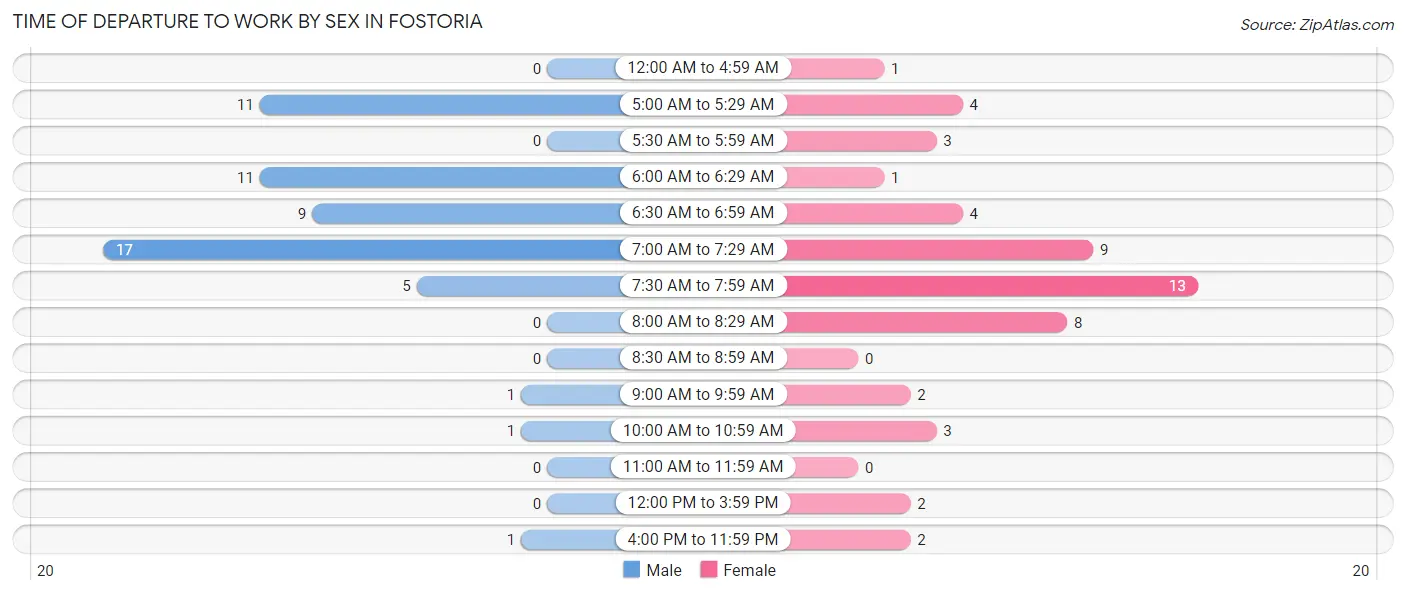
| Time of Departure | Male | Female |
| 12:00 AM to 4:59 AM | 0 (0.0%) | 1 (1.9%) |
| 5:00 AM to 5:29 AM | 11 (19.6%) | 4 (7.7%) |
| 5:30 AM to 5:59 AM | 0 (0.0%) | 3 (5.8%) |
| 6:00 AM to 6:29 AM | 11 (19.6%) | 1 (1.9%) |
| 6:30 AM to 6:59 AM | 9 (16.1%) | 4 (7.7%) |
| 7:00 AM to 7:29 AM | 17 (30.4%) | 9 (17.3%) |
| 7:30 AM to 7:59 AM | 5 (8.9%) | 13 (25.0%) |
| 8:00 AM to 8:29 AM | 0 (0.0%) | 8 (15.4%) |
| 8:30 AM to 8:59 AM | 0 (0.0%) | 0 (0.0%) |
| 9:00 AM to 9:59 AM | 1 (1.8%) | 2 (3.8%) |
| 10:00 AM to 10:59 AM | 1 (1.8%) | 3 (5.8%) |
| 11:00 AM to 11:59 AM | 0 (0.0%) | 0 (0.0%) |
| 12:00 PM to 3:59 PM | 0 (0.0%) | 2 (3.8%) |
| 4:00 PM to 11:59 PM | 1 (1.8%) | 2 (3.8%) |
| Total | 56 (100.0%) | 52 (100.0%) |
Housing Occupancy in Fostoria
Occupancy by Ownership in Fostoria
Of the total 89 dwellings in Fostoria, owner-occupied units account for 80 (89.9%), while renter-occupied units make up 9 (10.1%).
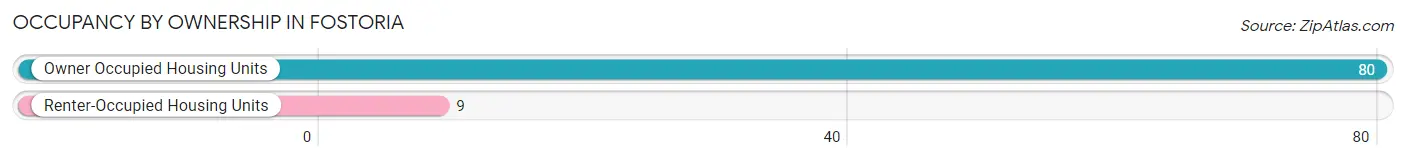
| Occupancy | # Housing Units | % Housing Units |
| Owner Occupied Housing Units | 80 | 89.9% |
| Renter-Occupied Housing Units | 9 | 10.1% |
| Total Occupied Housing Units | 89 | 100.0% |
Occupancy by Household Size in Fostoria
| Household Size | # Housing Units | % Housing Units |
| 1-Person Household | 21 | 23.6% |
| 2-Person Household | 62 | 69.7% |
| 3-Person Household | 5 | 5.6% |
| 4+ Person Household | 1 | 1.1% |
| Total Housing Units | 89 | 100.0% |
Occupancy by Ownership by Household Size in Fostoria
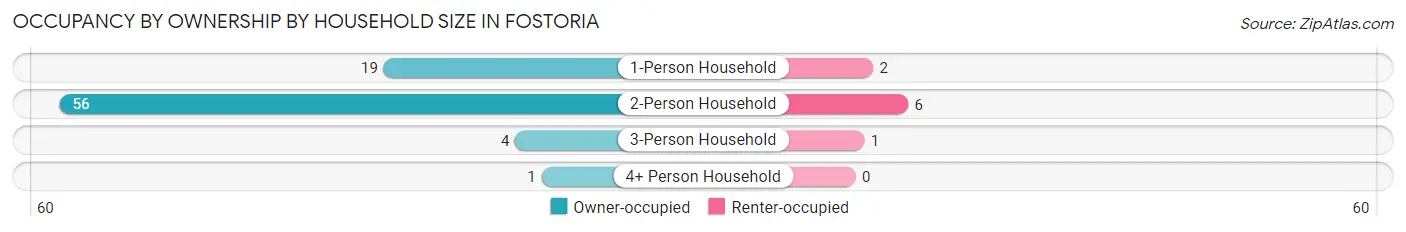
| Household Size | Owner-occupied | Renter-occupied |
| 1-Person Household | 19 (90.5%) | 2 (9.5%) |
| 2-Person Household | 56 (90.3%) | 6 (9.7%) |
| 3-Person Household | 4 (80.0%) | 1 (20.0%) |
| 4+ Person Household | 1 (100.0%) | 0 (0.0%) |
| Total Housing Units | 80 (89.9%) | 9 (10.1%) |
Occupancy by Educational Attainment in Fostoria
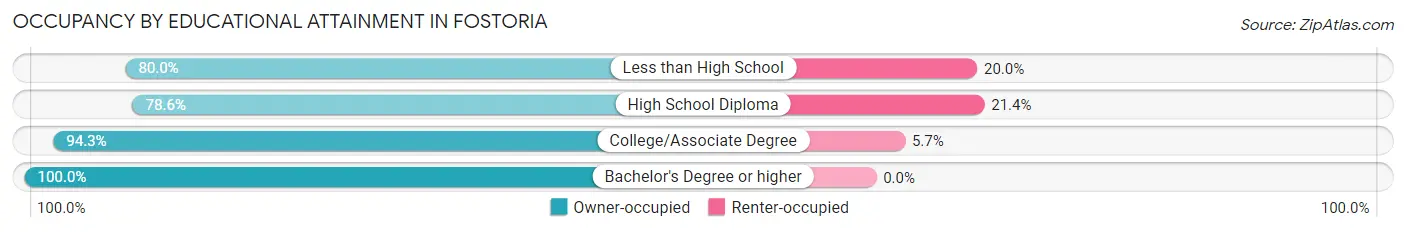
| Household Size | Owner-occupied | Renter-occupied |
| Less than High School | 4 (80.0%) | 1 (20.0%) |
| High School Diploma | 22 (78.6%) | 6 (21.4%) |
| College/Associate Degree | 33 (94.3%) | 2 (5.7%) |
| Bachelor's Degree or higher | 21 (100.0%) | 0 (0.0%) |
Occupancy by Age of Householder in Fostoria
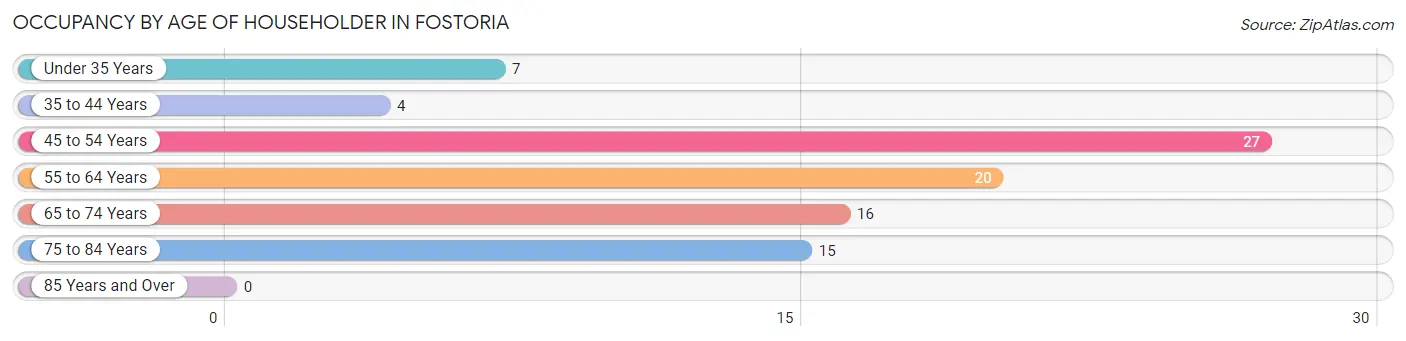
| Age Bracket | # Households | % Households |
| Under 35 Years | 7 | 7.9% |
| 35 to 44 Years | 4 | 4.5% |
| 45 to 54 Years | 27 | 30.3% |
| 55 to 64 Years | 20 | 22.5% |
| 65 to 74 Years | 16 | 18.0% |
| 75 to 84 Years | 15 | 16.9% |
| 85 Years and Over | 0 | 0.0% |
| Total | 89 | 100.0% |
Housing Finances in Fostoria
Median Income by Occupancy in Fostoria
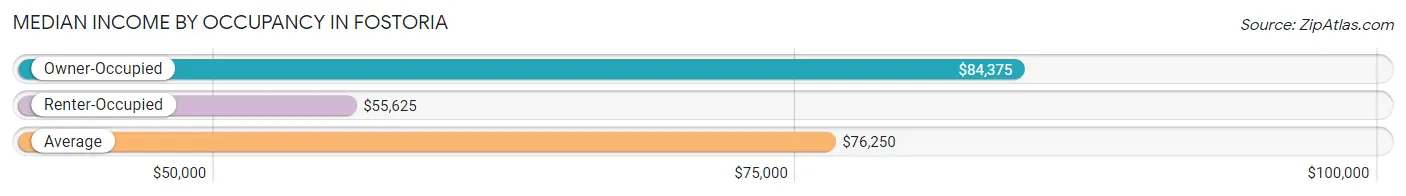
| Occupancy Type | # Households | Median Income |
| Owner-Occupied | 80 (89.9%) | $84,375 |
| Renter-Occupied | 9 (10.1%) | $55,625 |
| Average | 89 (100.0%) | $76,250 |
Occupancy by Householder Income Bracket in Fostoria
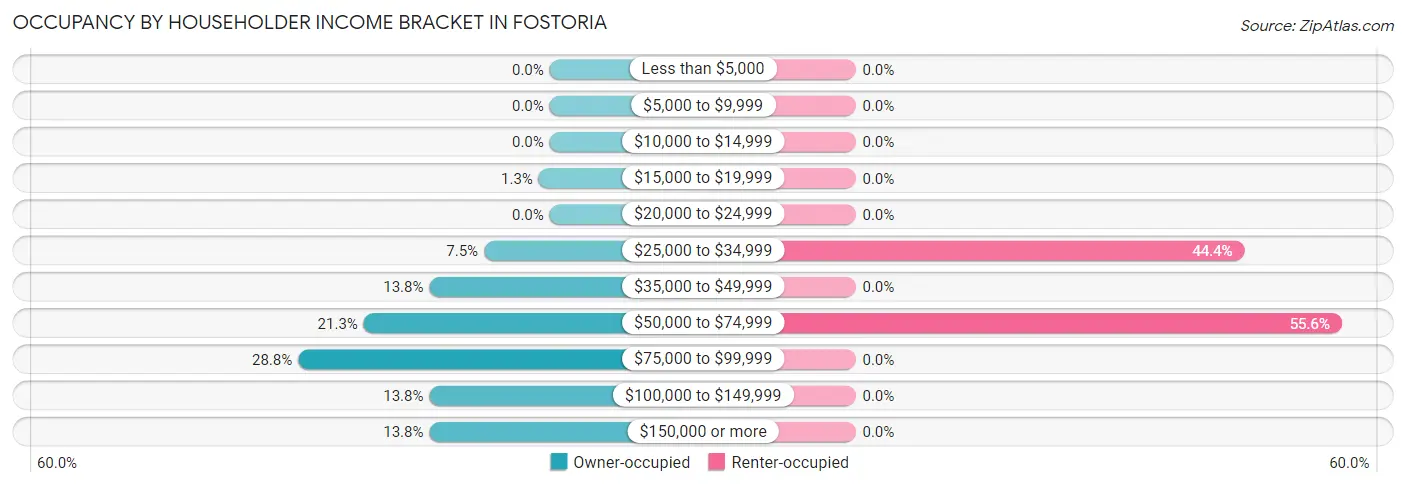
| Income Bracket | Owner-occupied | Renter-occupied |
| Less than $5,000 | 0 (0.0%) | 0 (0.0%) |
| $5,000 to $9,999 | 0 (0.0%) | 0 (0.0%) |
| $10,000 to $14,999 | 0 (0.0%) | 0 (0.0%) |
| $15,000 to $19,999 | 1 (1.3%) | 0 (0.0%) |
| $20,000 to $24,999 | 0 (0.0%) | 0 (0.0%) |
| $25,000 to $34,999 | 6 (7.5%) | 4 (44.4%) |
| $35,000 to $49,999 | 11 (13.8%) | 0 (0.0%) |
| $50,000 to $74,999 | 17 (21.2%) | 5 (55.6%) |
| $75,000 to $99,999 | 23 (28.7%) | 0 (0.0%) |
| $100,000 to $149,999 | 11 (13.8%) | 0 (0.0%) |
| $150,000 or more | 11 (13.8%) | 0 (0.0%) |
| Total | 80 (100.0%) | 9 (100.0%) |
Monthly Housing Cost Tiers in Fostoria
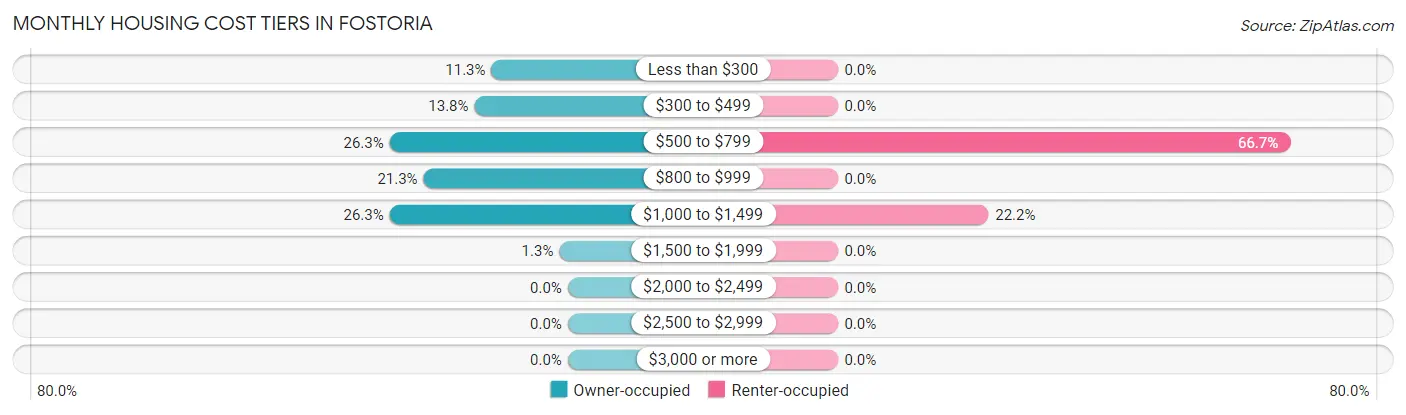
| Monthly Cost | Owner-occupied | Renter-occupied |
| Less than $300 | 9 (11.3%) | 0 (0.0%) |
| $300 to $499 | 11 (13.8%) | 0 (0.0%) |
| $500 to $799 | 21 (26.3%) | 6 (66.7%) |
| $800 to $999 | 17 (21.2%) | 0 (0.0%) |
| $1,000 to $1,499 | 21 (26.3%) | 2 (22.2%) |
| $1,500 to $1,999 | 1 (1.3%) | 0 (0.0%) |
| $2,000 to $2,499 | 0 (0.0%) | 0 (0.0%) |
| $2,500 to $2,999 | 0 (0.0%) | 0 (0.0%) |
| $3,000 or more | 0 (0.0%) | 0 (0.0%) |
| Total | 80 (100.0%) | 9 (100.0%) |
Physical Housing Characteristics in Fostoria
Housing Structures in Fostoria
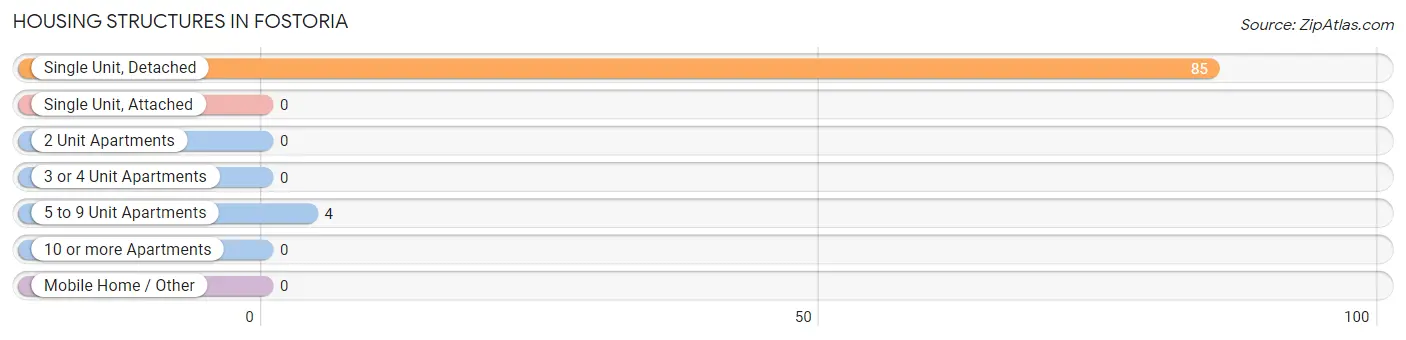
| Structure Type | # Housing Units | % Housing Units |
| Single Unit, Detached | 85 | 95.5% |
| Single Unit, Attached | 0 | 0.0% |
| 2 Unit Apartments | 0 | 0.0% |
| 3 or 4 Unit Apartments | 0 | 0.0% |
| 5 to 9 Unit Apartments | 4 | 4.5% |
| 10 or more Apartments | 0 | 0.0% |
| Mobile Home / Other | 0 | 0.0% |
| Total | 89 | 100.0% |
Housing Structures by Occupancy in Fostoria
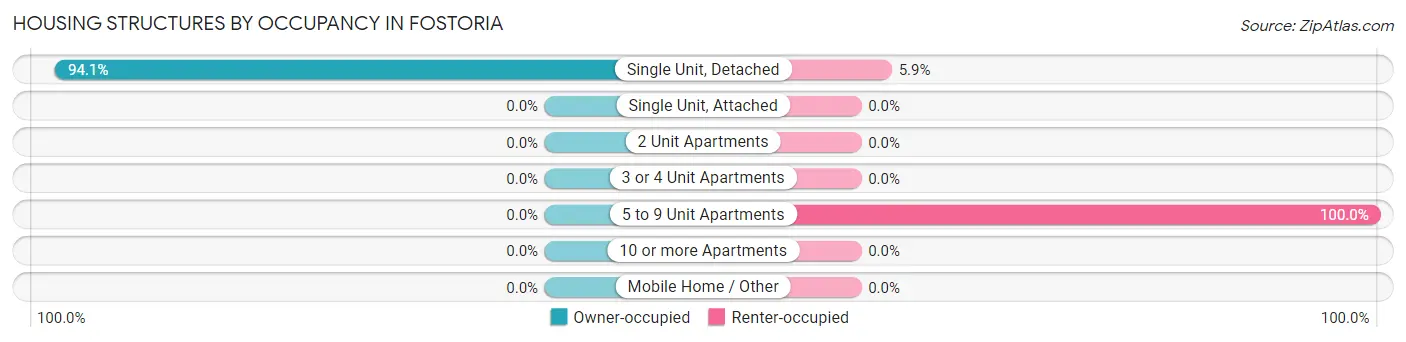
| Structure Type | Owner-occupied | Renter-occupied |
| Single Unit, Detached | 80 (94.1%) | 5 (5.9%) |
| Single Unit, Attached | 0 (0.0%) | 0 (0.0%) |
| 2 Unit Apartments | 0 (0.0%) | 0 (0.0%) |
| 3 or 4 Unit Apartments | 0 (0.0%) | 0 (0.0%) |
| 5 to 9 Unit Apartments | 0 (0.0%) | 4 (100.0%) |
| 10 or more Apartments | 0 (0.0%) | 0 (0.0%) |
| Mobile Home / Other | 0 (0.0%) | 0 (0.0%) |
| Total | 80 (89.9%) | 9 (10.1%) |
Housing Structures by Number of Rooms in Fostoria
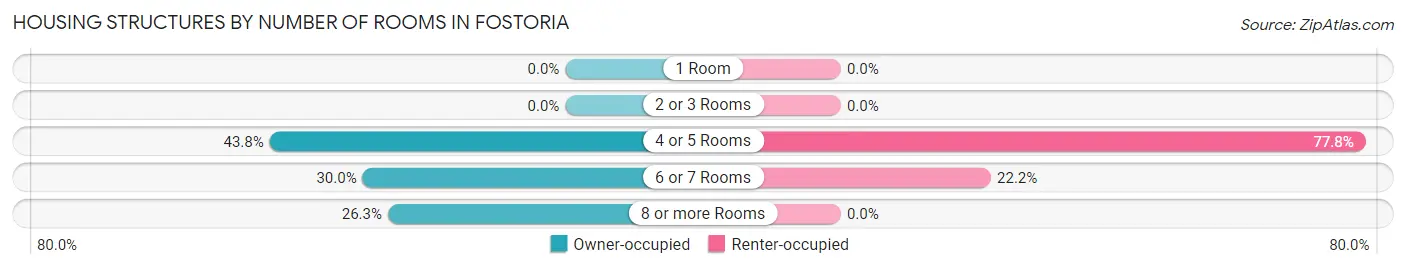
| Number of Rooms | Owner-occupied | Renter-occupied |
| 1 Room | 0 (0.0%) | 0 (0.0%) |
| 2 or 3 Rooms | 0 (0.0%) | 0 (0.0%) |
| 4 or 5 Rooms | 35 (43.8%) | 7 (77.8%) |
| 6 or 7 Rooms | 24 (30.0%) | 2 (22.2%) |
| 8 or more Rooms | 21 (26.3%) | 0 (0.0%) |
| Total | 80 (100.0%) | 9 (100.0%) |
Housing Structure by Heating Type in Fostoria
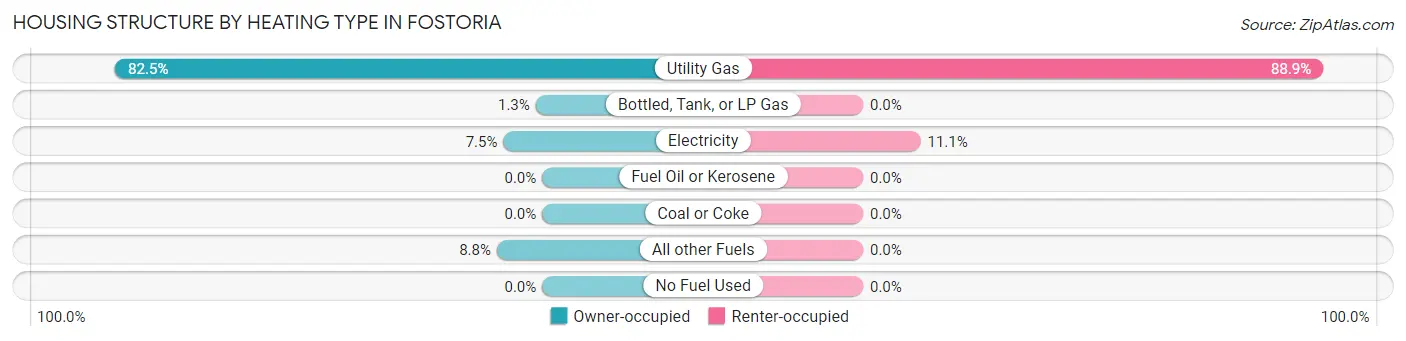
| Heating Type | Owner-occupied | Renter-occupied |
| Utility Gas | 66 (82.5%) | 8 (88.9%) |
| Bottled, Tank, or LP Gas | 1 (1.3%) | 0 (0.0%) |
| Electricity | 6 (7.5%) | 1 (11.1%) |
| Fuel Oil or Kerosene | 0 (0.0%) | 0 (0.0%) |
| Coal or Coke | 0 (0.0%) | 0 (0.0%) |
| All other Fuels | 7 (8.7%) | 0 (0.0%) |
| No Fuel Used | 0 (0.0%) | 0 (0.0%) |
| Total | 80 (100.0%) | 9 (100.0%) |
Household Vehicle Usage in Fostoria
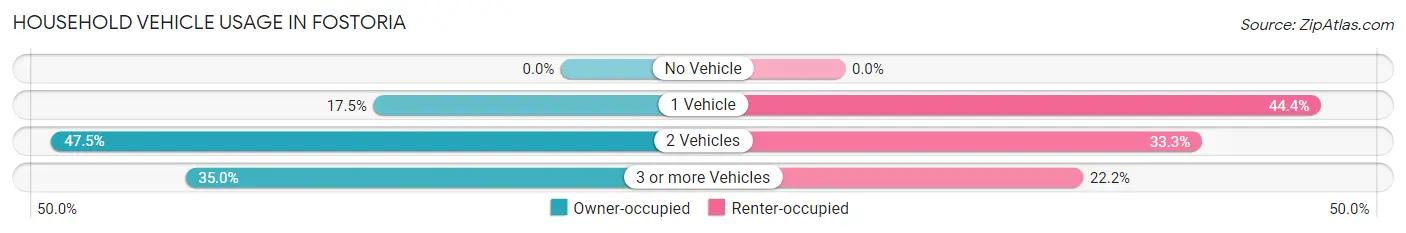
| Vehicles per Household | Owner-occupied | Renter-occupied |
| No Vehicle | 0 (0.0%) | 0 (0.0%) |
| 1 Vehicle | 14 (17.5%) | 4 (44.4%) |
| 2 Vehicles | 38 (47.5%) | 3 (33.3%) |
| 3 or more Vehicles | 28 (35.0%) | 2 (22.2%) |
| Total | 80 (100.0%) | 9 (100.0%) |
Real Estate & Mortgages in Fostoria
Real Estate and Mortgage Overview in Fostoria
| Characteristic | Without Mortgage | With Mortgage |
| Housing Units | 36 | 44 |
| Median Property Value | $110,000 | $150,000 |
| Median Household Income | $70,000 | $10 |
| Monthly Housing Costs | $475 | $0 |
| Real Estate Taxes | $1,325 | $0 |
Property Value by Mortgage Status in Fostoria
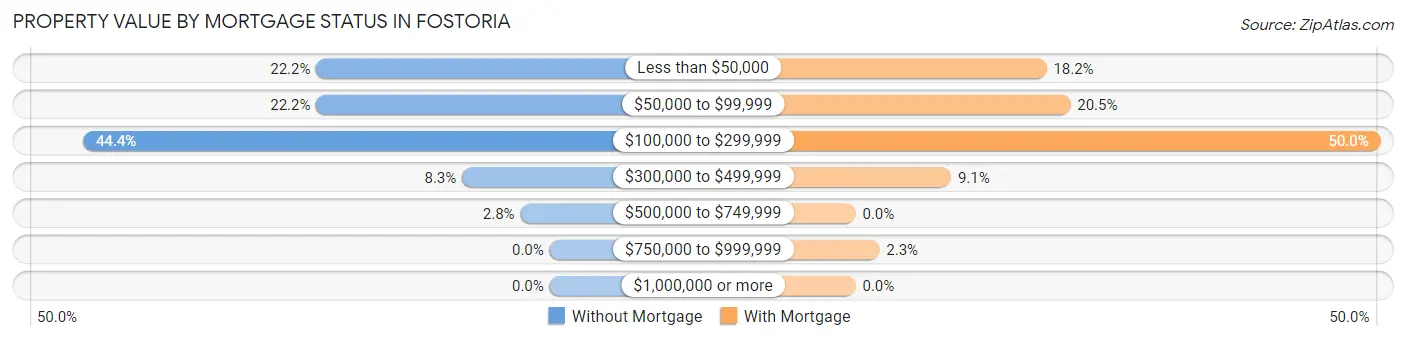
| Property Value | Without Mortgage | With Mortgage |
| Less than $50,000 | 8 (22.2%) | 8 (18.2%) |
| $50,000 to $99,999 | 8 (22.2%) | 9 (20.4%) |
| $100,000 to $299,999 | 16 (44.4%) | 22 (50.0%) |
| $300,000 to $499,999 | 3 (8.3%) | 4 (9.1%) |
| $500,000 to $749,999 | 1 (2.8%) | 0 (0.0%) |
| $750,000 to $999,999 | 0 (0.0%) | 1 (2.3%) |
| $1,000,000 or more | 0 (0.0%) | 0 (0.0%) |
| Total | 36 (100.0%) | 44 (100.0%) |
Household Income by Mortgage Status in Fostoria
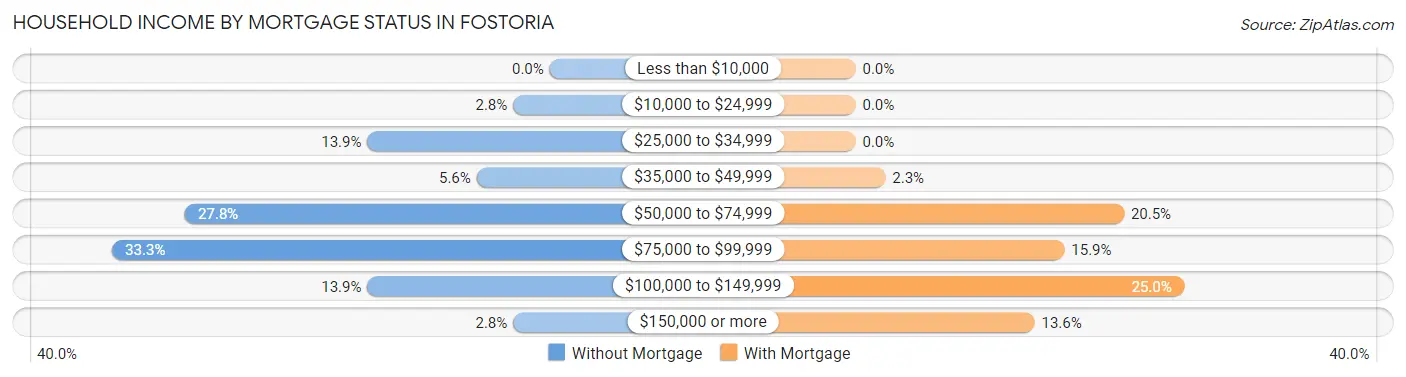
| Household Income | Without Mortgage | With Mortgage |
| Less than $10,000 | 0 (0.0%) | 0 (0.0%) |
| $10,000 to $24,999 | 1 (2.8%) | 0 (0.0%) |
| $25,000 to $34,999 | 5 (13.9%) | 0 (0.0%) |
| $35,000 to $49,999 | 2 (5.6%) | 1 (2.3%) |
| $50,000 to $74,999 | 10 (27.8%) | 9 (20.4%) |
| $75,000 to $99,999 | 12 (33.3%) | 7 (15.9%) |
| $100,000 to $149,999 | 5 (13.9%) | 11 (25.0%) |
| $150,000 or more | 1 (2.8%) | 6 (13.6%) |
| Total | 36 (100.0%) | 44 (100.0%) |
Property Value to Household Income Ratio in Fostoria
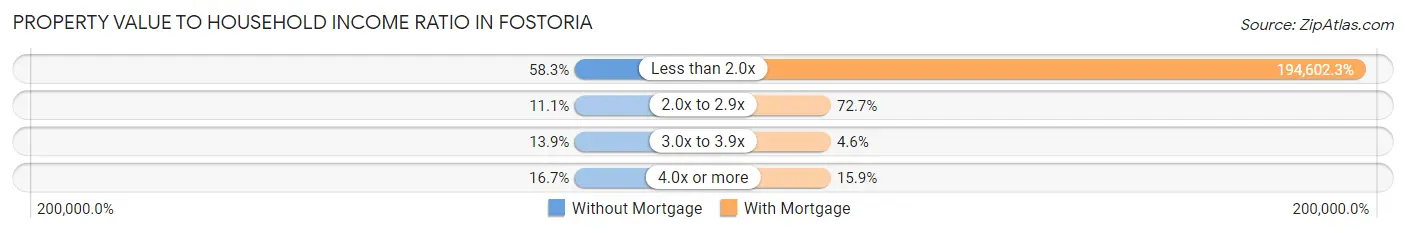
| Value-to-Income Ratio | Without Mortgage | With Mortgage |
| Less than 2.0x | 21 (58.3%) | 85,625 (194,602.3%) |
| 2.0x to 2.9x | 4 (11.1%) | 32 (72.7%) |
| 3.0x to 3.9x | 5 (13.9%) | 2 (4.5%) |
| 4.0x or more | 6 (16.7%) | 7 (15.9%) |
| Total | 36 (100.0%) | 44 (100.0%) |
Real Estate Taxes by Mortgage Status in Fostoria
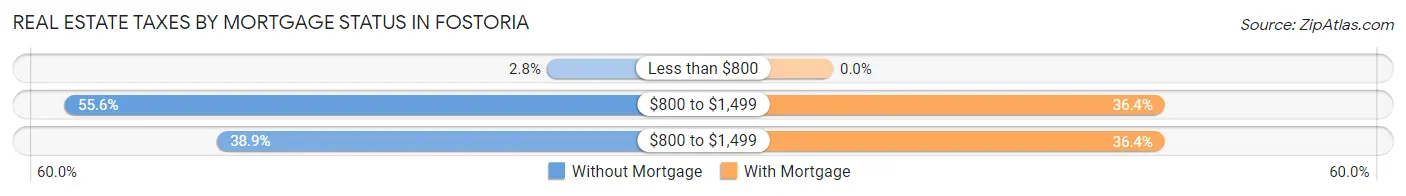
| Property Taxes | Without Mortgage | With Mortgage |
| Less than $800 | 1 (2.8%) | 0 (0.0%) |
| $800 to $1,499 | 20 (55.6%) | 16 (36.4%) |
| $800 to $1,499 | 14 (38.9%) | 16 (36.4%) |
| Total | 36 (100.0%) | 44 (100.0%) |
Health & Disability in Fostoria
Health Insurance Coverage by Age in Fostoria
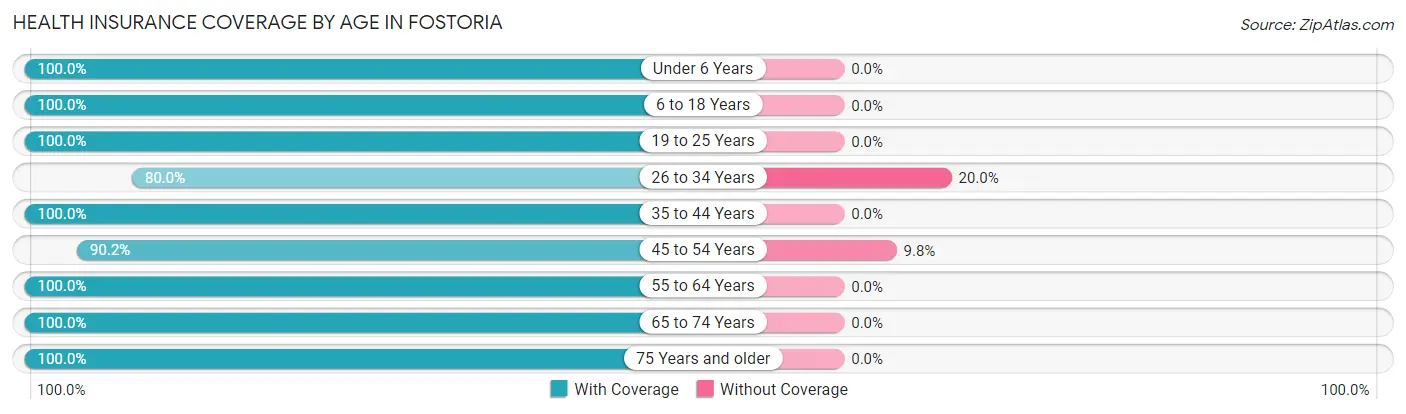
| Age Bracket | With Coverage | Without Coverage |
| Under 6 Years | 1 (100.0%) | 0 (0.0%) |
| 6 to 18 Years | 6 (100.0%) | 0 (0.0%) |
| 19 to 25 Years | 17 (100.0%) | 0 (0.0%) |
| 26 to 34 Years | 4 (80.0%) | 1 (20.0%) |
| 35 to 44 Years | 5 (100.0%) | 0 (0.0%) |
| 45 to 54 Years | 37 (90.2%) | 4 (9.8%) |
| 55 to 64 Years | 44 (100.0%) | 0 (0.0%) |
| 65 to 74 Years | 31 (100.0%) | 0 (0.0%) |
| 75 Years and older | 24 (100.0%) | 0 (0.0%) |
| Total | 169 (97.1%) | 5 (2.9%) |
Health Insurance Coverage by Citizenship Status in Fostoria
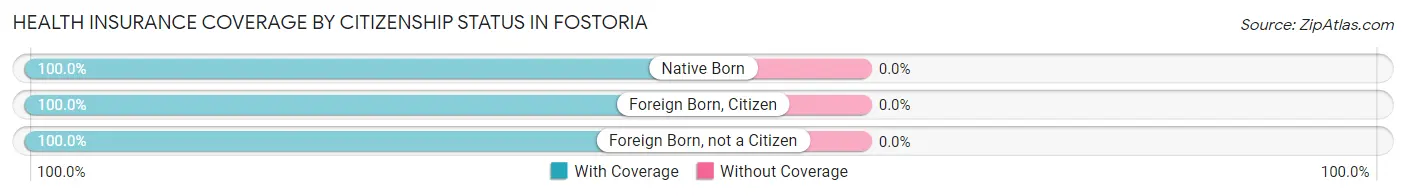
| Citizenship Status | With Coverage | Without Coverage |
| Native Born | 1 (100.0%) | 0 (0.0%) |
| Foreign Born, Citizen | 6 (100.0%) | 0 (0.0%) |
| Foreign Born, not a Citizen | 17 (100.0%) | 0 (0.0%) |
Health Insurance Coverage by Household Income in Fostoria
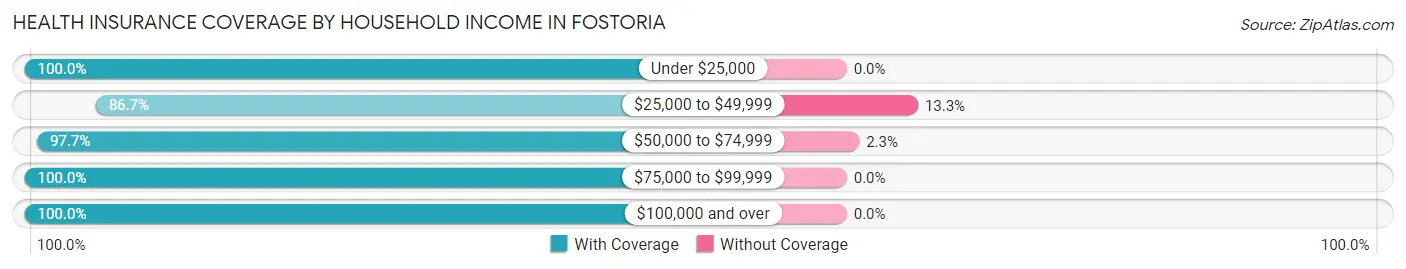
| Household Income | With Coverage | Without Coverage |
| Under $25,000 | 1 (100.0%) | 0 (0.0%) |
| $25,000 to $49,999 | 26 (86.7%) | 4 (13.3%) |
| $50,000 to $74,999 | 42 (97.7%) | 1 (2.3%) |
| $75,000 to $99,999 | 48 (100.0%) | 0 (0.0%) |
| $100,000 and over | 52 (100.0%) | 0 (0.0%) |
Public vs Private Health Insurance Coverage by Age in Fostoria
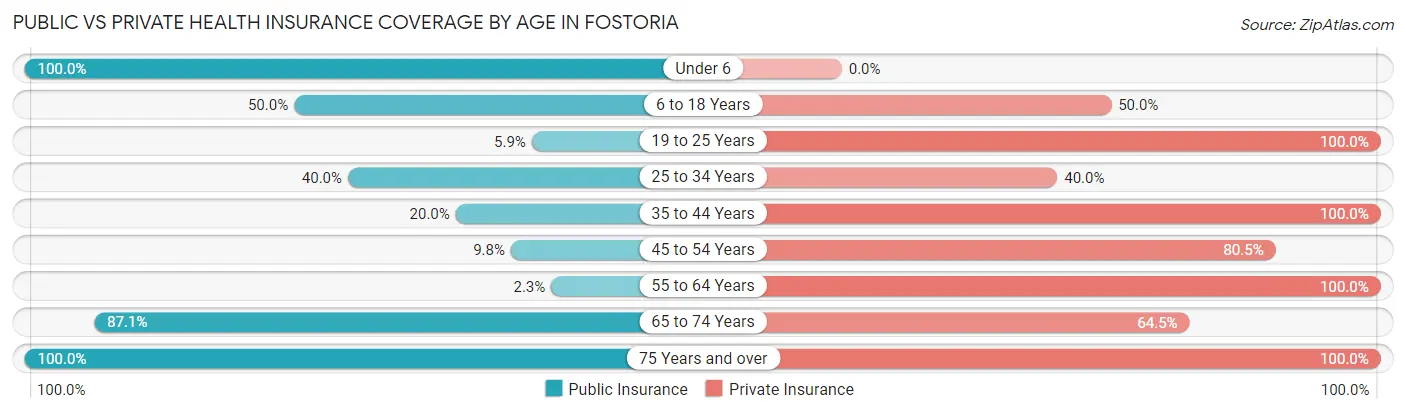
| Age Bracket | Public Insurance | Private Insurance |
| Under 6 | 1 (100.0%) | 0 (0.0%) |
| 6 to 18 Years | 3 (50.0%) | 3 (50.0%) |
| 19 to 25 Years | 1 (5.9%) | 17 (100.0%) |
| 25 to 34 Years | 2 (40.0%) | 2 (40.0%) |
| 35 to 44 Years | 1 (20.0%) | 5 (100.0%) |
| 45 to 54 Years | 4 (9.8%) | 33 (80.5%) |
| 55 to 64 Years | 1 (2.3%) | 44 (100.0%) |
| 65 to 74 Years | 27 (87.1%) | 20 (64.5%) |
| 75 Years and over | 24 (100.0%) | 24 (100.0%) |
| Total | 64 (36.8%) | 148 (85.1%) |
Disability Status by Sex by Age in Fostoria
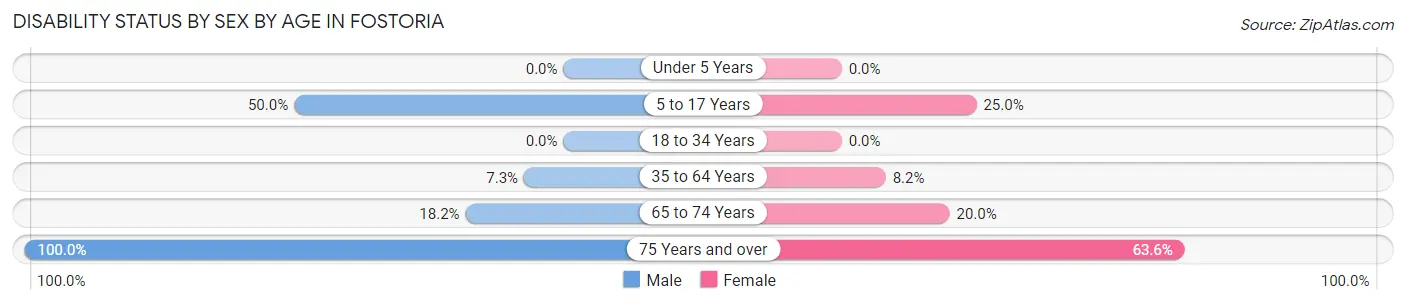
| Age Bracket | Male | Female |
| Under 5 Years | 0 (0.0%) | 0 (0.0%) |
| 5 to 17 Years | 1 (50.0%) | 1 (25.0%) |
| 18 to 34 Years | 0 (0.0%) | 0 (0.0%) |
| 35 to 64 Years | 3 (7.3%) | 4 (8.2%) |
| 65 to 74 Years | 2 (18.2%) | 4 (20.0%) |
| 75 Years and over | 13 (100.0%) | 7 (63.6%) |
Disability Class by Sex by Age in Fostoria
Disability Class: Hearing Difficulty
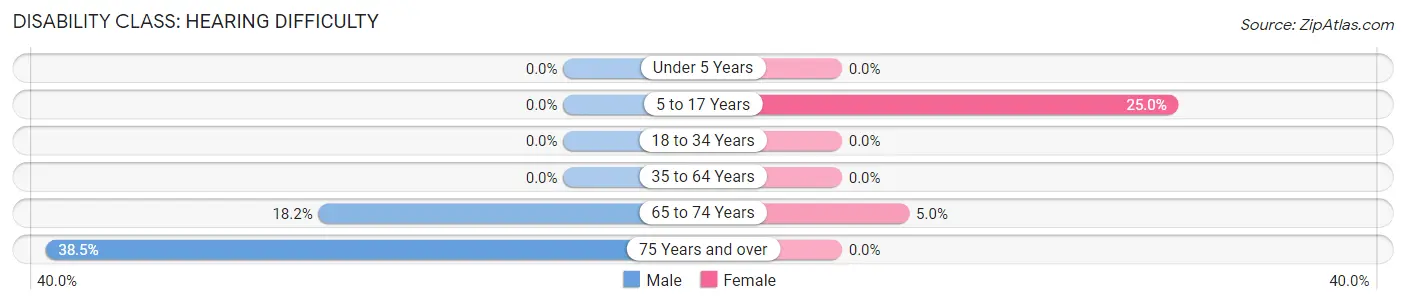
| Age Bracket | Male | Female |
| Under 5 Years | 0 (0.0%) | 0 (0.0%) |
| 5 to 17 Years | 0 (0.0%) | 1 (25.0%) |
| 18 to 34 Years | 0 (0.0%) | 0 (0.0%) |
| 35 to 64 Years | 0 (0.0%) | 0 (0.0%) |
| 65 to 74 Years | 2 (18.2%) | 1 (5.0%) |
| 75 Years and over | 5 (38.5%) | 0 (0.0%) |
Disability Class: Vision Difficulty
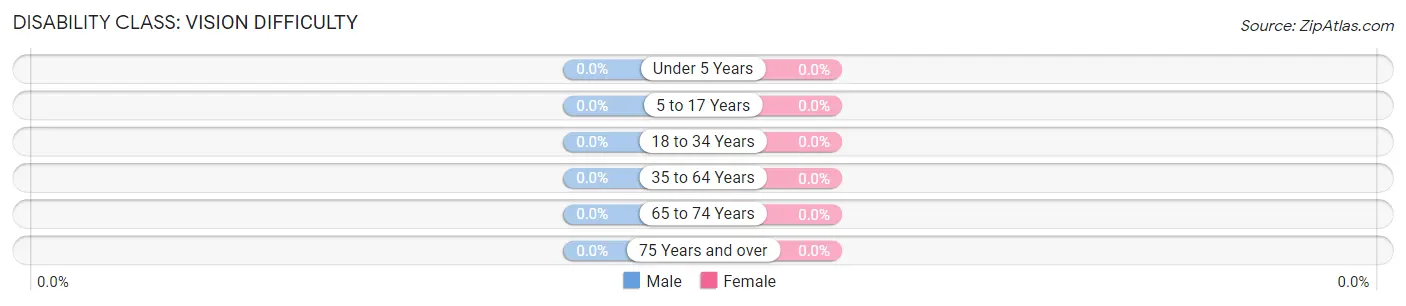
| Age Bracket | Male | Female |
| Under 5 Years | 0 (0.0%) | 0 (0.0%) |
| 5 to 17 Years | 0 (0.0%) | 0 (0.0%) |
| 18 to 34 Years | 0 (0.0%) | 0 (0.0%) |
| 35 to 64 Years | 0 (0.0%) | 0 (0.0%) |
| 65 to 74 Years | 0 (0.0%) | 0 (0.0%) |
| 75 Years and over | 0 (0.0%) | 0 (0.0%) |
Disability Class: Cognitive Difficulty
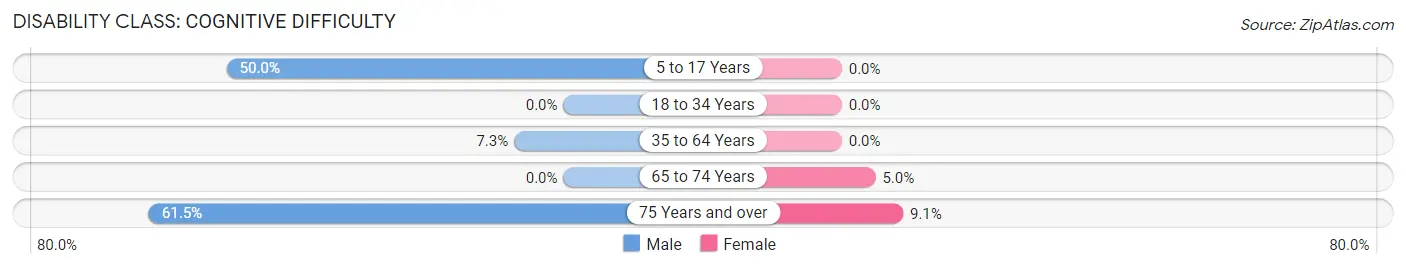
| Age Bracket | Male | Female |
| 5 to 17 Years | 1 (50.0%) | 0 (0.0%) |
| 18 to 34 Years | 0 (0.0%) | 0 (0.0%) |
| 35 to 64 Years | 3 (7.3%) | 0 (0.0%) |
| 65 to 74 Years | 0 (0.0%) | 1 (5.0%) |
| 75 Years and over | 8 (61.5%) | 1 (9.1%) |
Disability Class: Ambulatory Difficulty
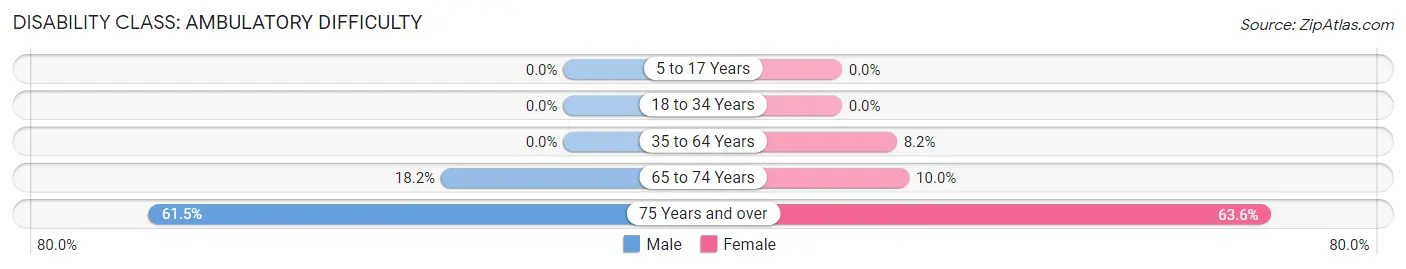
| Age Bracket | Male | Female |
| 5 to 17 Years | 0 (0.0%) | 0 (0.0%) |
| 18 to 34 Years | 0 (0.0%) | 0 (0.0%) |
| 35 to 64 Years | 0 (0.0%) | 4 (8.2%) |
| 65 to 74 Years | 2 (18.2%) | 2 (10.0%) |
| 75 Years and over | 8 (61.5%) | 7 (63.6%) |
Disability Class: Self-Care Difficulty
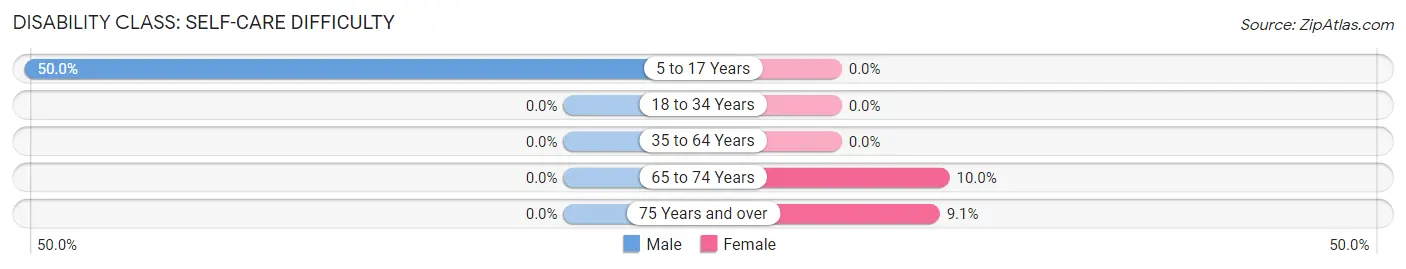
| Age Bracket | Male | Female |
| 5 to 17 Years | 1 (50.0%) | 0 (0.0%) |
| 18 to 34 Years | 0 (0.0%) | 0 (0.0%) |
| 35 to 64 Years | 0 (0.0%) | 0 (0.0%) |
| 65 to 74 Years | 0 (0.0%) | 2 (10.0%) |
| 75 Years and over | 0 (0.0%) | 1 (9.1%) |
Technology Access in Fostoria
Computing Device Access in Fostoria
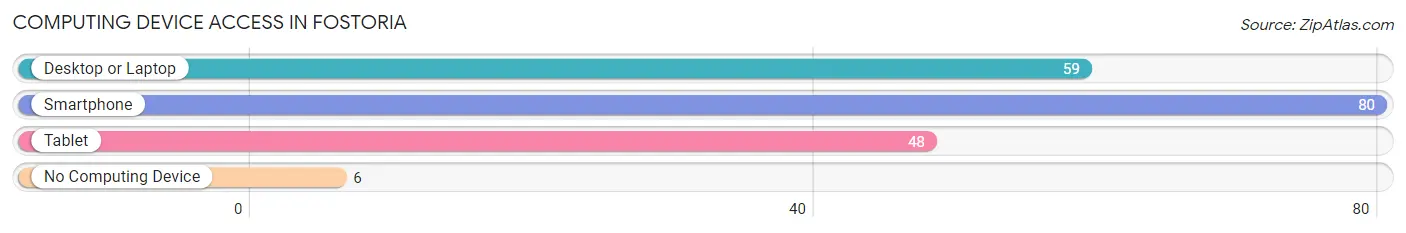
| Device Type | # Households | % Households |
| Desktop or Laptop | 59 | 66.3% |
| Smartphone | 80 | 89.9% |
| Tablet | 48 | 53.9% |
| No Computing Device | 6 | 6.7% |
| Total | 89 | 100.0% |
Internet Access in Fostoria
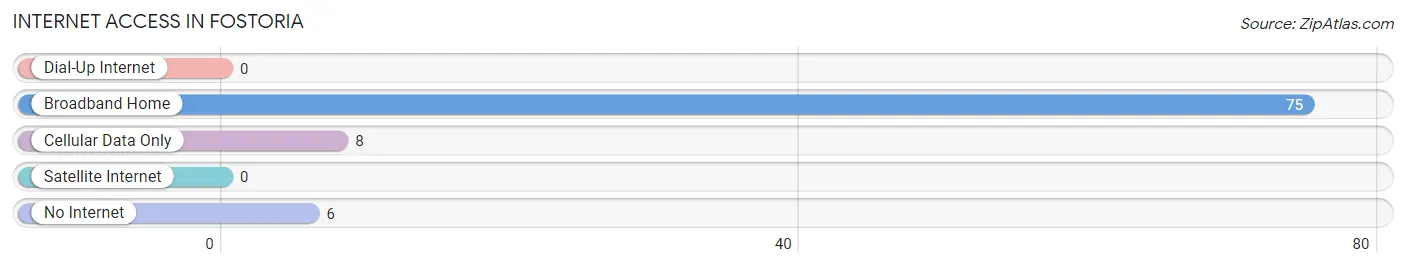
| Internet Type | # Households | % Households |
| Dial-Up Internet | 0 | 0.0% |
| Broadband Home | 75 | 84.3% |
| Cellular Data Only | 8 | 9.0% |
| Satellite Internet | 0 | 0.0% |
| No Internet | 6 | 6.7% |
| Total | 89 | 100.0% |
Fostoria Summary
Fostoria is a small city located in the state of Iowa, in the United States. It is situated in the northwest corner of the state, in the county of Hancock. The city has a population of approximately 1,000 people, and is part of the Mason City Micropolitan Statistical Area.
History
Fostoria was founded in 1856 by a group of settlers from Ohio. The city was named after the founder, John Fostor, who was a prominent businessman in the area. The city was incorporated in 1872, and the first mayor was elected in 1873.
The city grew rapidly in the late 19th century, and by the early 20th century, it had become a major agricultural center. The city was also home to several manufacturing plants, including a flour mill, a brickyard, and a furniture factory.
In the 1950s, the city experienced a period of decline, as many of the factories closed and the population began to decline. However, in the late 1970s, the city began to experience a resurgence, as new businesses began to move into the area.
Geography
Fostoria is located in the northwest corner of Iowa, in the county of Hancock. The city is situated on the banks of the Shell Rock River, and is surrounded by rolling hills and farmland. The city is located approximately 30 miles north of Mason City, and is about an hour and a half drive from Des Moines.
The city has a total area of 1.2 square miles, all of which is land. The climate in Fostoria is classified as humid continental, with hot summers and cold winters. The average annual temperature is around 50 degrees Fahrenheit, and the average annual precipitation is around 30 inches.
Economy
The economy of Fostoria is largely based on agriculture and manufacturing. The city is home to several large farms, which produce a variety of crops, including corn, soybeans, and hay. The city is also home to several manufacturing plants, including a furniture factory, a flour mill, and a brickyard.
The city is also home to several small businesses, including restaurants, retail stores, and service providers. The city is also home to a number of tourist attractions, including the Fostoria Historical Museum and the Fostoria Railroad Museum.
Demographics
As of the 2010 census, the population of Fostoria was 1,000 people. The racial makeup of the city was 97.2% White, 0.7% African American, 0.2% Native American, 0.2% Asian, 0.2% from other races, and 1.7% from two or more races. Hispanic or Latino of any race were 1.2% of the population.
The median income for a household in the city was $37,500, and the median income for a family was $45,000. The per capita income for the city was $18,000. About 10.2% of families and 12.2% of the population were below the poverty line, including 16.7% of those under the age of 18 and 8.3% of those 65 and older.
Fostoria is a small city with a rich history and a bright future. The city is home to a diverse population, and is a great place to live, work, and play. The city is home to a variety of businesses, and is a great place to start or grow a business. The city is also home to a number of tourist attractions, and is a great place to visit.
Common Questions
What is Per Capita Income in Fostoria?
Per Capita income in Fostoria is $45,840.
What is the Median Family Income in Fostoria?
Median Family Income in Fostoria is $95,795.
What is the Median Household income in Fostoria?
Median Household Income in Fostoria is $76,250.
What is Income or Wage Gap in Fostoria?
Income or Wage Gap in Fostoria is 29.9%.
Women in Fostoria earn 70.1 cents for every dollar earned by a man.
What is Inequality or Gini Index in Fostoria?
Inequality or Gini Index in Fostoria is 0.30.
What is the Total Population of Fostoria?
Total Population of Fostoria is 174.
What is the Total Male Population of Fostoria?
Total Male Population of Fostoria is 83.
What is the Total Female Population of Fostoria?
Total Female Population of Fostoria is 91.
What is the Ratio of Males per 100 Females in Fostoria?
There are 91.21 Males per 100 Females in Fostoria.
What is the Ratio of Females per 100 Males in Fostoria?
There are 109.64 Females per 100 Males in Fostoria.
What is the Median Population Age in Fostoria?
Median Population Age in Fostoria is 56.8 Years.
What is the Average Family Size in Fostoria
Average Family Size in Fostoria is 2.3 People.
What is the Average Household Size in Fostoria
Average Household Size in Fostoria is 2.0 People.
How Large is the Labor Force in Fostoria?
There are 115 People in the Labor Forcein in Fostoria.
What is the Percentage of People in the Labor Force in Fostoria?
67.6% of People are in the Labor Force in Fostoria.