Flovilla, GA Map & Demographics
Flovilla Map
Flovilla Overview
$25,802
PER CAPITA INCOME
$72,128
AVG FAMILY INCOME
25.8%
WAGE / INCOME GAP [ % ]
74.2¢/ $1
WAGE / INCOME GAP [ $ ]
$19,603
FAMILY INCOME DEFICIT
0.36
INEQUALITY / GINI INDEX
1,165
TOTAL POPULATION
660
MALE POPULATION
505
FEMALE POPULATION
130.69
MALES / 100 FEMALES
76.52
FEMALES / 100 MALES
45.6
MEDIAN AGE
3.7
AVG FAMILY SIZE
2.5
AVG HOUSEHOLD SIZE
494
LABOR FORCE [ PEOPLE ]
47.7%
PERCENT IN LABOR FORCE
10.8%
UNEMPLOYMENT RATE
Flovilla Zip Codes
Flovilla Area Codes
Income in Flovilla
Income Overview in Flovilla
| Characteristic | Number | Measure |
| Per Capita Income | 1,165 | $25,802 |
| Median Family Income | 247 | $72,128 |
| Mean Family Income | 247 | $85,291 |
| Median Household Income | 475 | $0 |
| Mean Household Income | 475 | $61,767 |
| Income Deficit | 247 | $19,603 |
| Wage / Income Gap (%) | 1,165 | 25.76% |
| Wage / Income Gap ($) | 1,165 | 74.24¢ per $1 |
| Gini / Inequality Index | 1,165 | 0.36 |
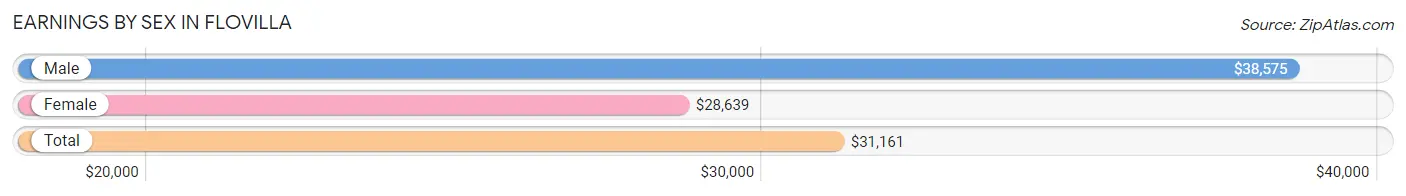
Earnings by Sex in Flovilla
Average Earnings in Flovilla are $31,161, $38,575 for men and $28,639 for women, a difference of 25.8%.
| Sex | Number | Average Earnings |
| Male | 297 (62.4%) | $38,575 |
| Female | 179 (37.6%) | $28,639 |
| Total | 476 (100.0%) | $31,161 |
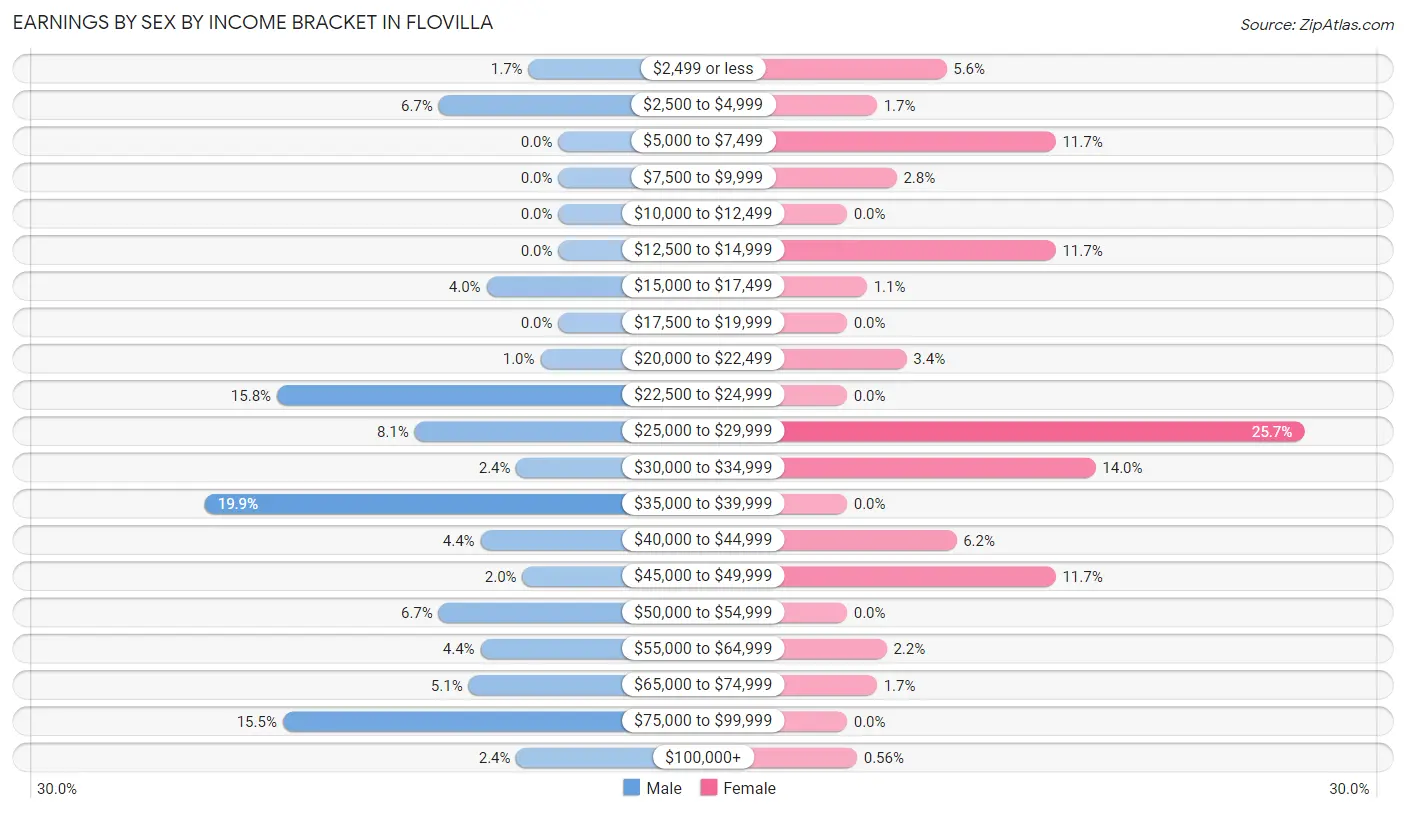
Earnings by Sex by Income Bracket in Flovilla
The most common earnings brackets in Flovilla are $35,000 to $39,999 for men (59 | 19.9%) and $25,000 to $29,999 for women (46 | 25.7%).
| Income | Male | Female |
| $2,499 or less | 5 (1.7%) | 10 (5.6%) |
| $2,500 to $4,999 | 20 (6.7%) | 3 (1.7%) |
| $5,000 to $7,499 | 0 (0.0%) | 21 (11.7%) |
| $7,500 to $9,999 | 0 (0.0%) | 5 (2.8%) |
| $10,000 to $12,499 | 0 (0.0%) | 0 (0.0%) |
| $12,500 to $14,999 | 0 (0.0%) | 21 (11.7%) |
| $15,000 to $17,499 | 12 (4.0%) | 2 (1.1%) |
| $17,500 to $19,999 | 0 (0.0%) | 0 (0.0%) |
| $20,000 to $22,499 | 3 (1.0%) | 6 (3.4%) |
| $22,500 to $24,999 | 47 (15.8%) | 0 (0.0%) |
| $25,000 to $29,999 | 24 (8.1%) | 46 (25.7%) |
| $30,000 to $34,999 | 7 (2.4%) | 25 (14.0%) |
| $35,000 to $39,999 | 59 (19.9%) | 0 (0.0%) |
| $40,000 to $44,999 | 13 (4.4%) | 11 (6.1%) |
| $45,000 to $49,999 | 6 (2.0%) | 21 (11.7%) |
| $50,000 to $54,999 | 20 (6.7%) | 0 (0.0%) |
| $55,000 to $64,999 | 13 (4.4%) | 4 (2.2%) |
| $65,000 to $74,999 | 15 (5.1%) | 3 (1.7%) |
| $75,000 to $99,999 | 46 (15.5%) | 0 (0.0%) |
| $100,000+ | 7 (2.4%) | 1 (0.6%) |
| Total | 297 (100.0%) | 179 (100.0%) |
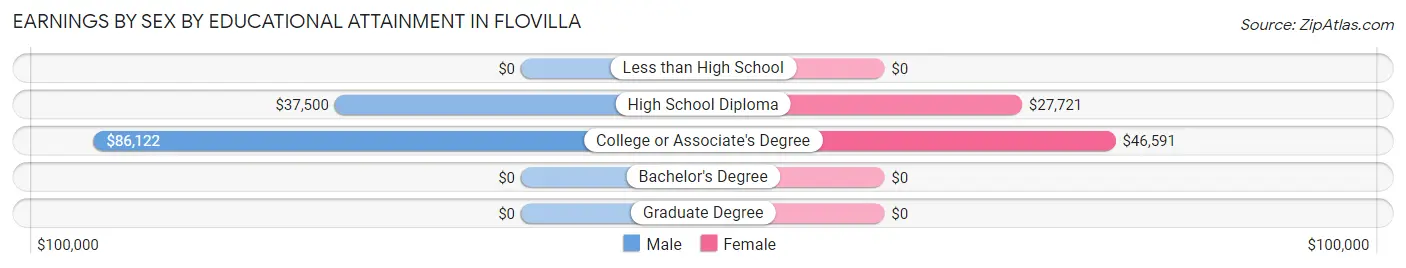
Earnings by Sex by Educational Attainment in Flovilla
Average earnings in Flovilla are $45,000 for men and $29,053 for women, a difference of 35.4%. Men with an educational attainment of college or associate's degree enjoy the highest average annual earnings of $86,122, while those with high school diploma education earn the least with $37,500. Women with an educational attainment of college or associate's degree earn the most with the average annual earnings of $46,591, while those with high school diploma education have the smallest earnings of $27,721.
| Educational Attainment | Male Income | Female Income |
| Less than High School | - | - |
| High School Diploma | $37,500 | $27,721 |
| College or Associate's Degree | $86,122 | $46,591 |
| Bachelor's Degree | - | - |
| Graduate Degree | - | - |
| Total | $45,000 | $29,053 |
Family Income in Flovilla
Family Income Brackets in Flovilla
According to the Flovilla family income data, there are 73 families falling into the $100,000 to $149,999 income range, which is the most common income bracket and makes up 29.5% of all families.
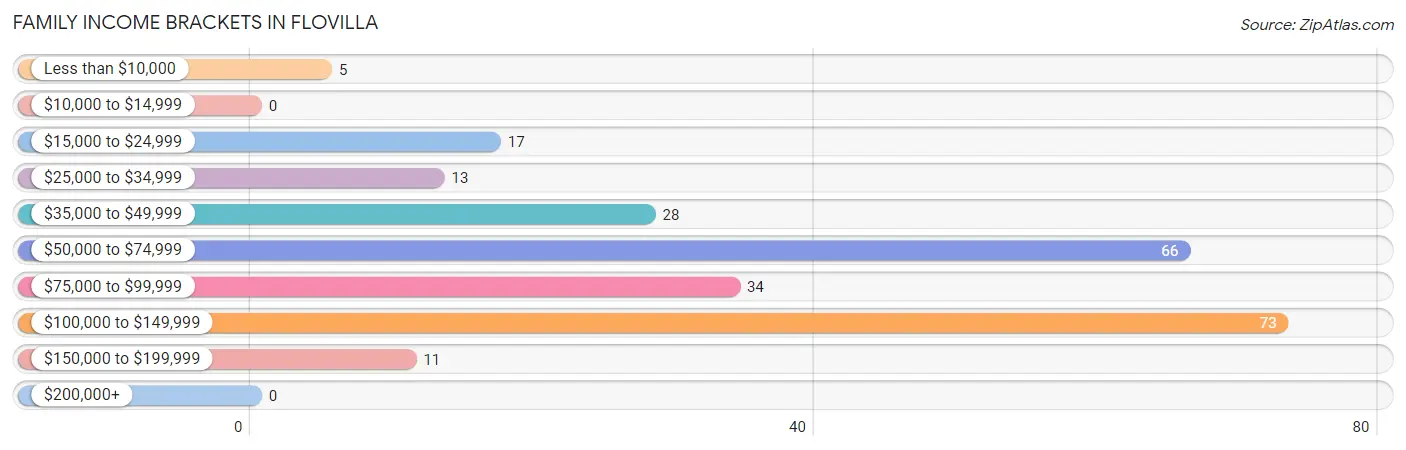
| Income Bracket | # Families | % Families |
| Less than $10,000 | 5 | 2.0% |
| $10,000 to $14,999 | 0 | 0.0% |
| $15,000 to $24,999 | 17 | 6.9% |
| $25,000 to $34,999 | 13 | 5.3% |
| $35,000 to $49,999 | 28 | 11.3% |
| $50,000 to $74,999 | 66 | 26.7% |
| $75,000 to $99,999 | 34 | 13.8% |
| $100,000 to $149,999 | 73 | 29.6% |
| $150,000 to $199,999 | 11 | 4.5% |
| $200,000+ | 0 | 0.0% |
Family Income by Famaliy Size in Flovilla
3-person families (76 | 30.8%) account for the highest median family income in Flovilla with $121,136 per family, while 3-person families (76 | 30.8%) have the highest median income of $40,379 per family member.
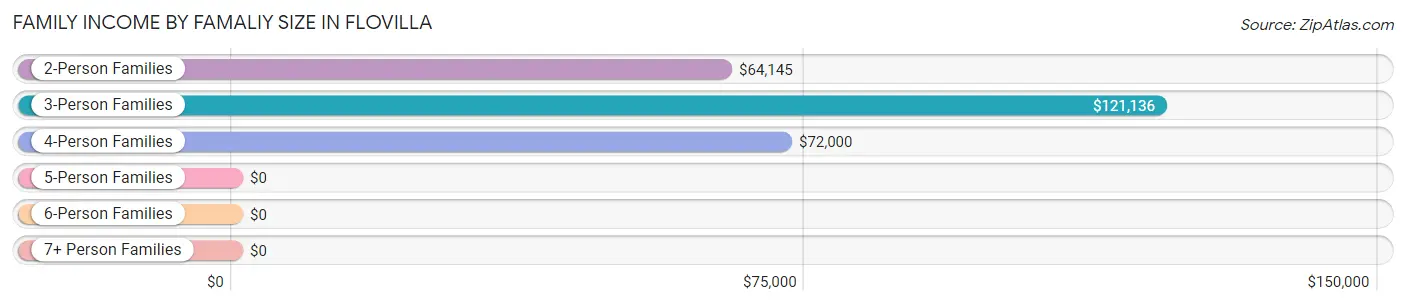
| Income Bracket | # Families | Median Income |
| 2-Person Families | 85 (34.4%) | $64,145 |
| 3-Person Families | 76 (30.8%) | $121,136 |
| 4-Person Families | 40 (16.2%) | $72,000 |
| 5-Person Families | 26 (10.5%) | $0 |
| 6-Person Families | 15 (6.1%) | $0 |
| 7+ Person Families | 5 (2.0%) | $0 |
| Total | 247 (100.0%) | $72,128 |
Family Income by Number of Earners in Flovilla
The median family income in Flovilla is $72,128, with families comprising 3+ earners (61) having the highest median family income of $147,617, while families with 1 earner (53) have the lowest median family income of $32,159, accounting for 24.7% and 21.5% of families, respectively.
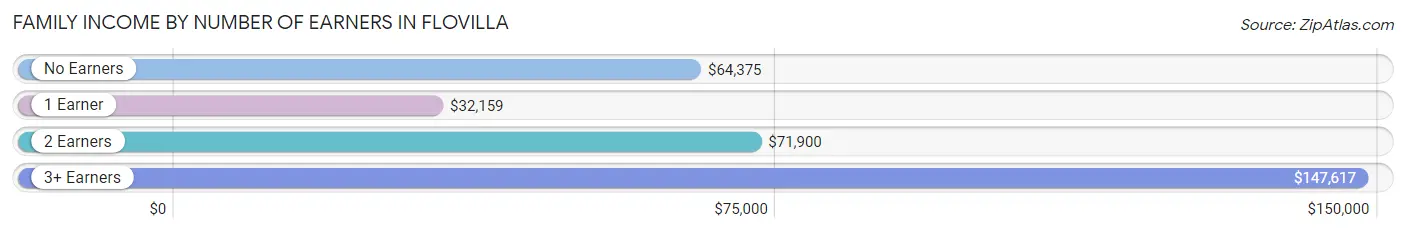
| Number of Earners | # Families | Median Income |
| No Earners | 53 (21.5%) | $64,375 |
| 1 Earner | 53 (21.5%) | $32,159 |
| 2 Earners | 80 (32.4%) | $71,900 |
| 3+ Earners | 61 (24.7%) | $147,617 |
| Total | 247 (100.0%) | $72,128 |
Household Income in Flovilla
Household Income Brackets in Flovilla
With 207 households falling in the category, the $35,000 to $49,999 income range is the most frequent in Flovilla, accounting for 43.6% of all households.
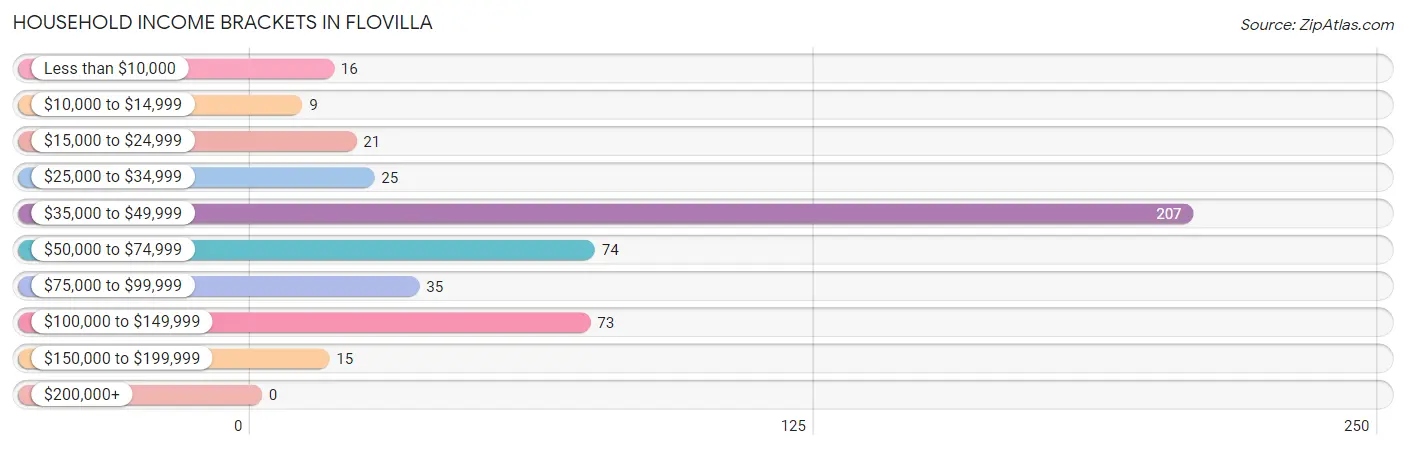
| Income Bracket | # Households | % Households |
| Less than $10,000 | 16 | 3.4% |
| $10,000 to $14,999 | 9 | 1.9% |
| $15,000 to $24,999 | 21 | 4.4% |
| $25,000 to $34,999 | 25 | 5.3% |
| $35,000 to $49,999 | 207 | 43.6% |
| $50,000 to $74,999 | 74 | 15.6% |
| $75,000 to $99,999 | 35 | 7.4% |
| $100,000 to $149,999 | 73 | 15.4% |
| $150,000 to $199,999 | 15 | 3.2% |
| $200,000+ | 0 | 0.0% |
Household Income by Householder Age in Flovilla
The median household income in Flovilla is $0, with the highest median household income of $72,400 found in the 45 to 64 years age bracket for the primary householder. A total of 142 households (29.9%) fall into this category. Meanwhile, the 15 to 24 years age bracket for the primary householder has the lowest median household income of $0, with 9 households (1.9%) in this group.
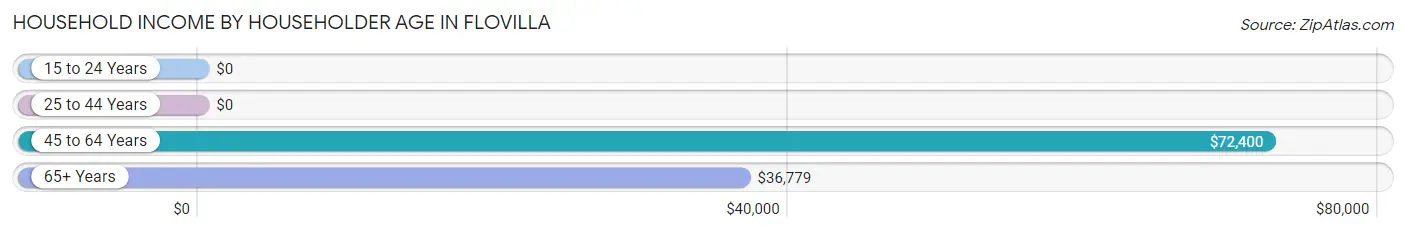
| Income Bracket | # Households | Median Income |
| 15 to 24 Years | 9 (1.9%) | $0 |
| 25 to 44 Years | 68 (14.3%) | $0 |
| 45 to 64 Years | 142 (29.9%) | $72,400 |
| 65+ Years | 256 (53.9%) | $36,779 |
| Total | 475 (100.0%) | $0 |
Poverty in Flovilla
Income Below Poverty by Sex and Age in Flovilla
With 14.8% poverty level for males and 20.4% for females among the residents of Flovilla, 16 and 17 year old males and 6 to 11 year old females are the most vulnerable to poverty, with 6 males (100.0%) and 27 females (100.0%) in their respective age groups living below the poverty level.
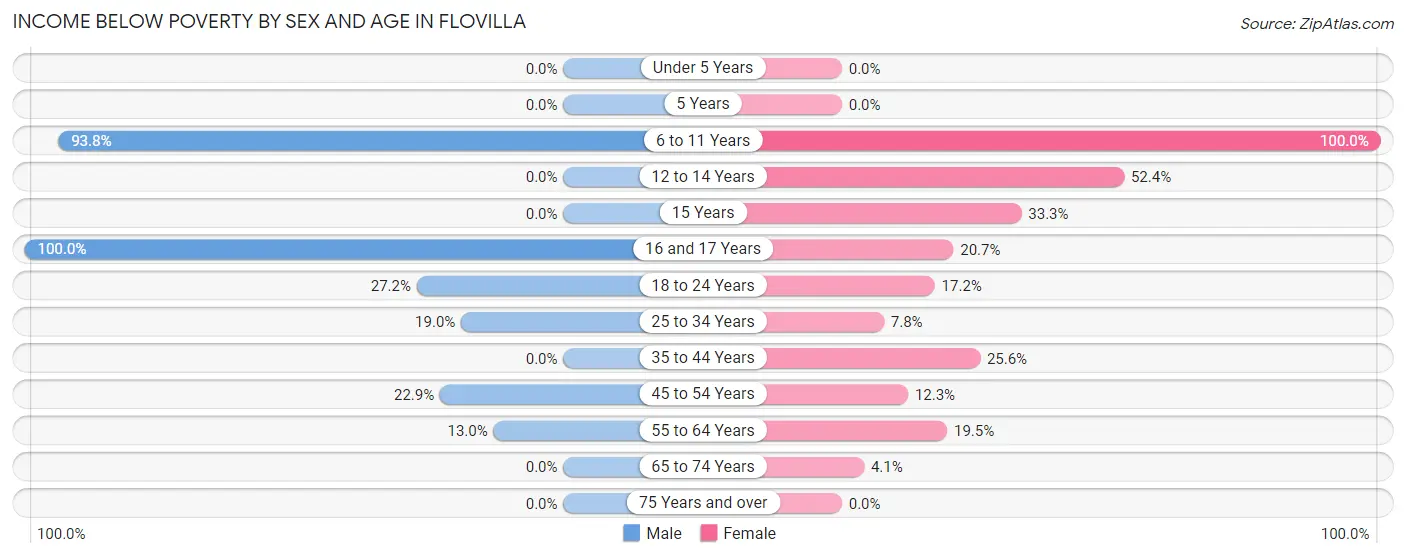
| Age Bracket | Male | Female |
| Under 5 Years | 0 (0.0%) | 0 (0.0%) |
| 5 Years | 0 (0.0%) | 0 (0.0%) |
| 6 to 11 Years | 15 (93.8%) | 27 (100.0%) |
| 12 to 14 Years | 0 (0.0%) | 11 (52.4%) |
| 15 Years | 0 (0.0%) | 7 (33.3%) |
| 16 and 17 Years | 6 (100.0%) | 6 (20.7%) |
| 18 to 24 Years | 40 (27.2%) | 10 (17.2%) |
| 25 to 34 Years | 11 (19.0%) | 5 (7.8%) |
| 35 to 44 Years | 0 (0.0%) | 10 (25.6%) |
| 45 to 54 Years | 19 (22.9%) | 7 (12.3%) |
| 55 to 64 Years | 7 (13.0%) | 17 (19.5%) |
| 65 to 74 Years | 0 (0.0%) | 3 (4.1%) |
| 75 Years and over | 0 (0.0%) | 0 (0.0%) |
| Total | 98 (14.8%) | 103 (20.4%) |
Income Above Poverty by Sex and Age in Flovilla
According to the poverty statistics in Flovilla, males aged under 5 years and females aged under 5 years are the age groups that are most secure financially, with 100.0% of males and 100.0% of females in these age groups living above the poverty line.
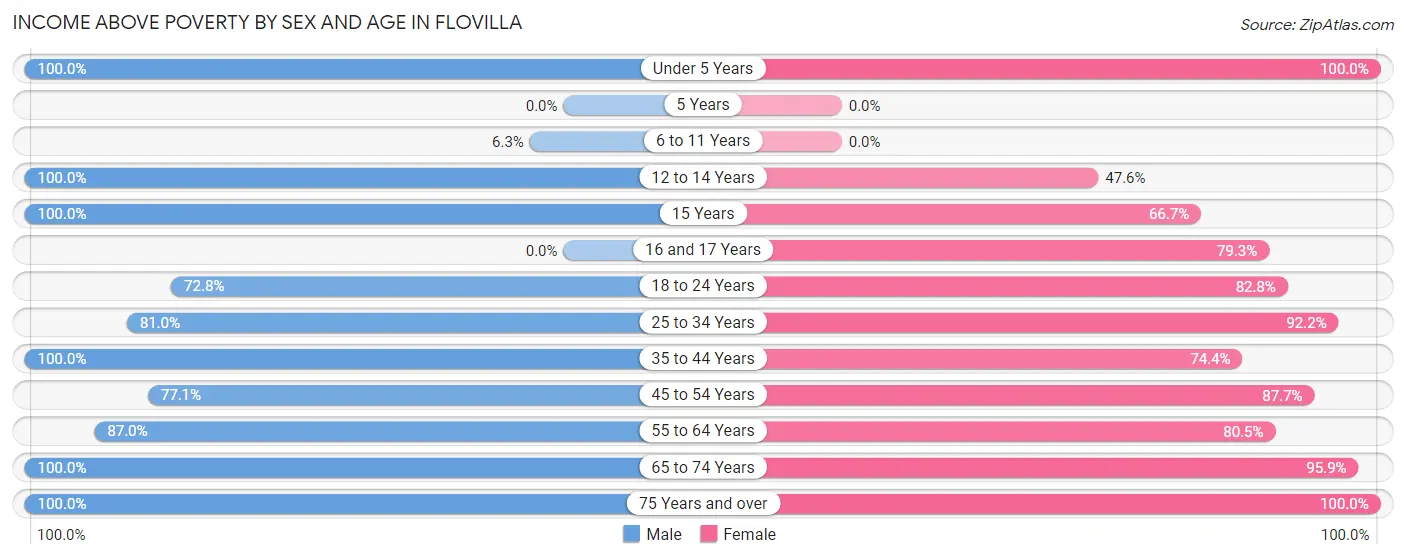
| Age Bracket | Male | Female |
| Under 5 Years | 19 (100.0%) | 10 (100.0%) |
| 5 Years | 0 (0.0%) | 0 (0.0%) |
| 6 to 11 Years | 1 (6.2%) | 0 (0.0%) |
| 12 to 14 Years | 2 (100.0%) | 10 (47.6%) |
| 15 Years | 14 (100.0%) | 14 (66.7%) |
| 16 and 17 Years | 0 (0.0%) | 23 (79.3%) |
| 18 to 24 Years | 107 (72.8%) | 48 (82.8%) |
| 25 to 34 Years | 47 (81.0%) | 59 (92.2%) |
| 35 to 44 Years | 28 (100.0%) | 29 (74.4%) |
| 45 to 54 Years | 64 (77.1%) | 50 (87.7%) |
| 55 to 64 Years | 47 (87.0%) | 70 (80.5%) |
| 65 to 74 Years | 218 (100.0%) | 70 (95.9%) |
| 75 Years and over | 15 (100.0%) | 19 (100.0%) |
| Total | 562 (85.2%) | 402 (79.6%) |
Income Below Poverty Among Married-Couple Families in Flovilla
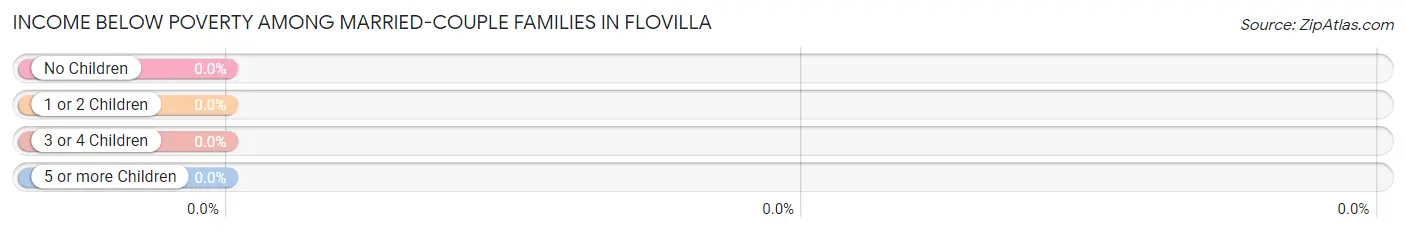
| Children | Above Poverty | Below Poverty |
| No Children | 115 (100.0%) | 0 (0.0%) |
| 1 or 2 Children | 45 (100.0%) | 0 (0.0%) |
| 3 or 4 Children | 2 (100.0%) | 0 (0.0%) |
| 5 or more Children | 0 (0.0%) | 0 (0.0%) |
| Total | 162 (100.0%) | 0 (0.0%) |
Income Below Poverty Among Single-Parent Households in Flovilla
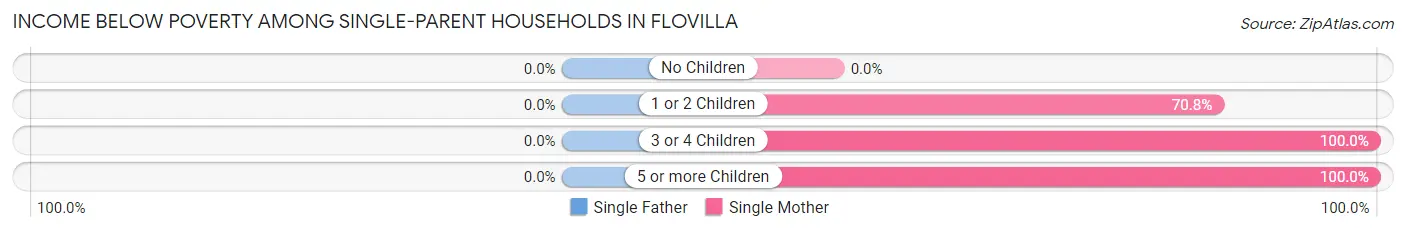
| Children | Single Father | Single Mother |
| No Children | 0 (0.0%) | 0 (0.0%) |
| 1 or 2 Children | 0 (0.0%) | 17 (70.8%) |
| 3 or 4 Children | 0 (0.0%) | 7 (100.0%) |
| 5 or more Children | 0 (0.0%) | 5 (100.0%) |
| Total | 0 (0.0%) | 29 (76.3%) |
Income Below Poverty Among Married-Couple vs Single-Parent Households in Flovilla
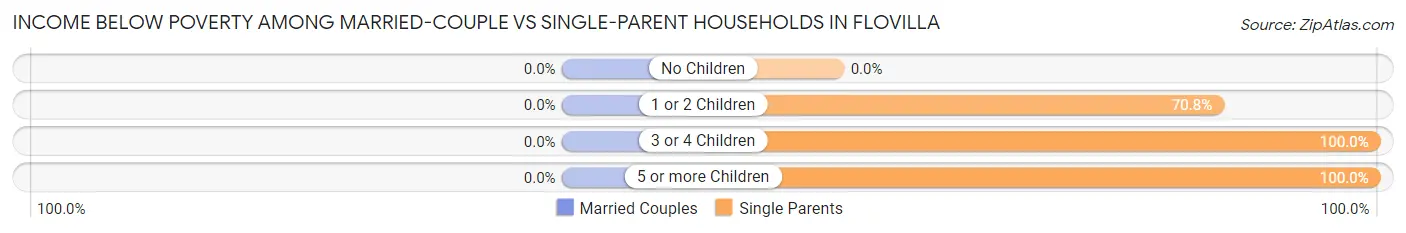
| Children | Married-Couple Families | Single-Parent Households |
| No Children | 0 (0.0%) | 0 (0.0%) |
| 1 or 2 Children | 0 (0.0%) | 17 (70.8%) |
| 3 or 4 Children | 0 (0.0%) | 7 (100.0%) |
| 5 or more Children | 0 (0.0%) | 5 (100.0%) |
| Total | 0 (0.0%) | 29 (34.1%) |
Race in Flovilla
The most populous races in Flovilla are Black / African American (431 | 37.0%), White / Caucasian (390 | 33.5%), and Two or more Races (220 | 18.9%).
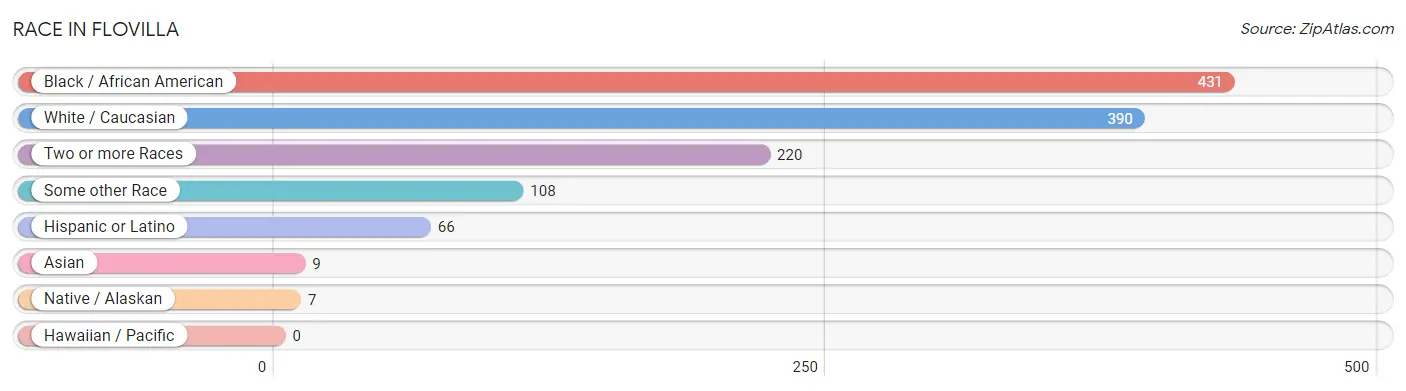
| Race | # Population | % Population |
| Asian | 9 | 0.8% |
| Black / African American | 431 | 37.0% |
| Hawaiian / Pacific | 0 | 0.0% |
| Hispanic or Latino | 66 | 5.7% |
| Native / Alaskan | 7 | 0.6% |
| White / Caucasian | 390 | 33.5% |
| Two or more Races | 220 | 18.9% |
| Some other Race | 108 | 9.3% |
| Total | 1,165 | 100.0% |
Ancestry in Flovilla
The most populous ancestries reported in Flovilla are American (343 | 29.4%), Irish (38 | 3.3%), Spanish (32 | 2.8%), English (31 | 2.7%), and Mexican (24 | 2.1%), together accounting for 40.2% of all Flovilla residents.
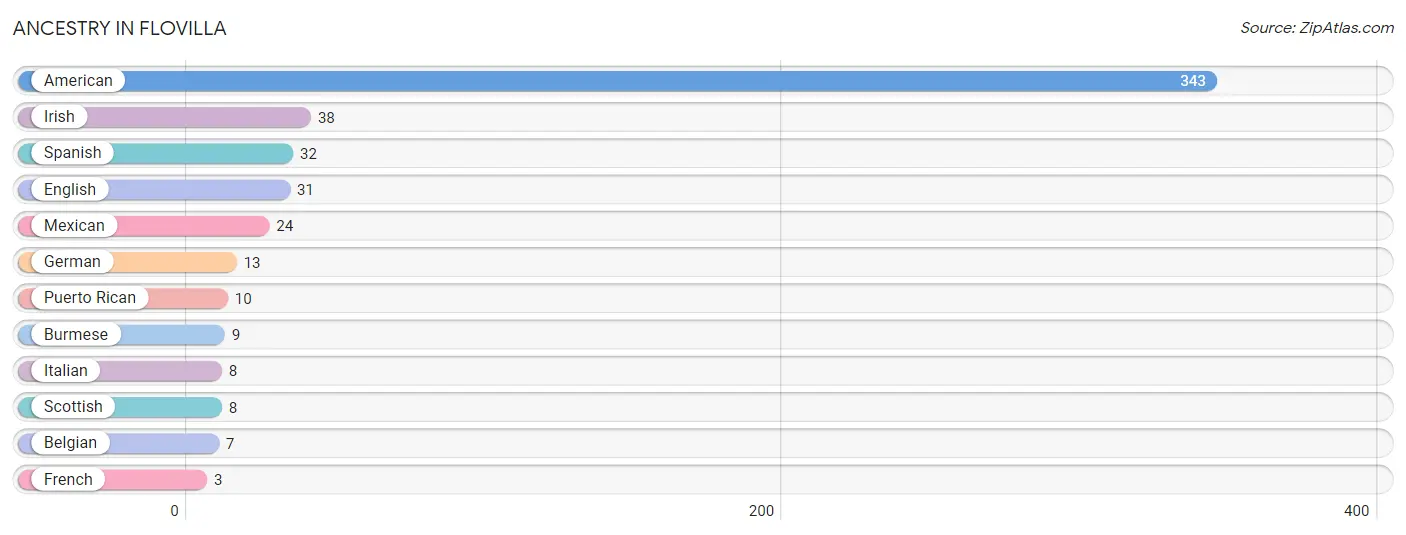
| Ancestry | # Population | % Population |
| American | 343 | 29.4% |
| Belgian | 7 | 0.6% |
| Burmese | 9 | 0.8% |
| English | 31 | 2.7% |
| French | 3 | 0.3% |
| German | 13 | 1.1% |
| Irish | 38 | 3.3% |
| Italian | 8 | 0.7% |
| Mexican | 24 | 2.1% |
| Puerto Rican | 10 | 0.9% |
| Scottish | 8 | 0.7% |
| Spanish | 32 | 2.8% | View All 12 Rows |
Immigrants in Flovilla
The most numerous immigrant groups reported in Flovilla came from Asia (9 | 0.8%), Eastern Asia (9 | 0.8%), and Korea (9 | 0.8%), together accounting for 2.3% of all Flovilla residents.
| Immigration Origin | # Population | % Population |
| Asia | 9 | 0.8% |
| Eastern Asia | 9 | 0.8% |
| Korea | 9 | 0.8% | View All 3 Rows |
Sex and Age in Flovilla
Sex and Age in Flovilla
The most populous age groups in Flovilla are 70 to 74 Years (203 | 30.8%) for men and 15 to 19 Years (65 | 12.9%) for women.
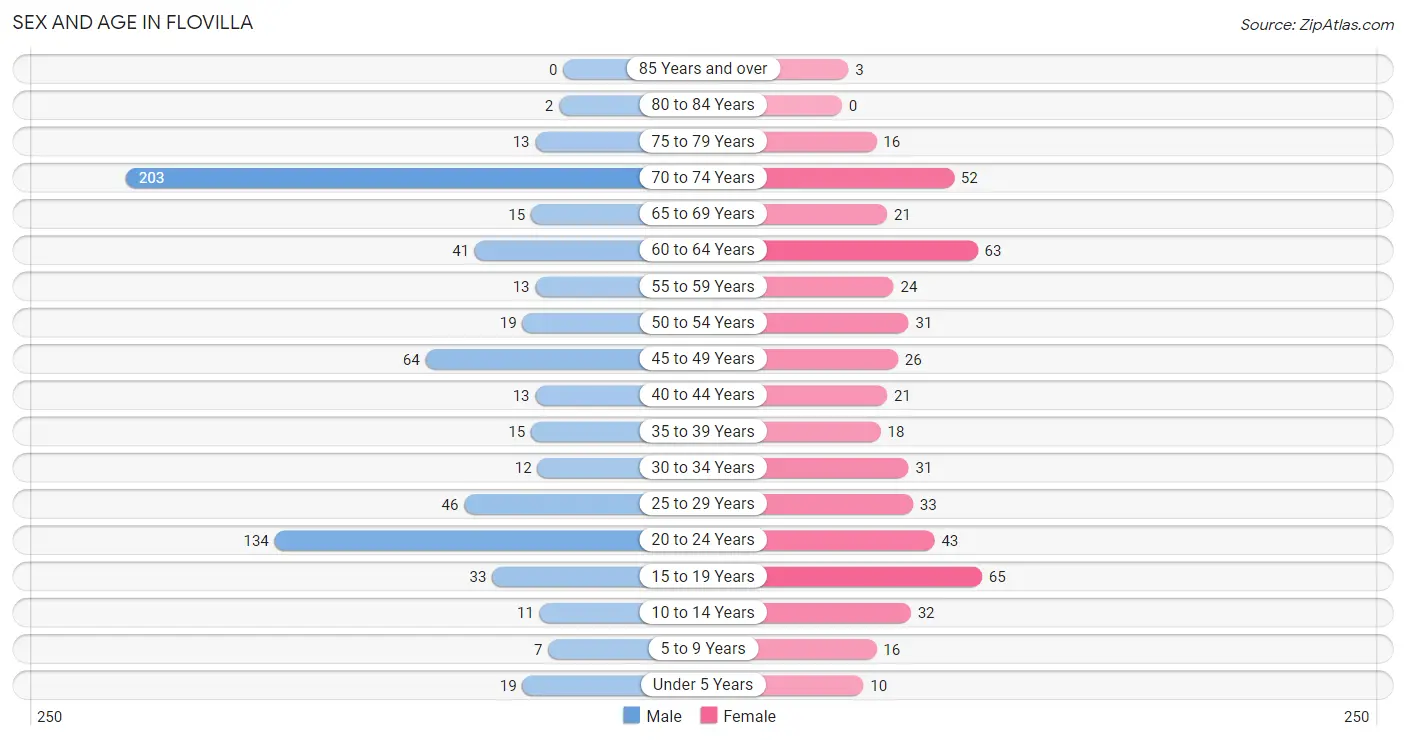
| Age Bracket | Male | Female |
| Under 5 Years | 19 (2.9%) | 10 (2.0%) |
| 5 to 9 Years | 7 (1.1%) | 16 (3.2%) |
| 10 to 14 Years | 11 (1.7%) | 32 (6.3%) |
| 15 to 19 Years | 33 (5.0%) | 65 (12.9%) |
| 20 to 24 Years | 134 (20.3%) | 43 (8.5%) |
| 25 to 29 Years | 46 (7.0%) | 33 (6.5%) |
| 30 to 34 Years | 12 (1.8%) | 31 (6.1%) |
| 35 to 39 Years | 15 (2.3%) | 18 (3.6%) |
| 40 to 44 Years | 13 (2.0%) | 21 (4.2%) |
| 45 to 49 Years | 64 (9.7%) | 26 (5.1%) |
| 50 to 54 Years | 19 (2.9%) | 31 (6.1%) |
| 55 to 59 Years | 13 (2.0%) | 24 (4.8%) |
| 60 to 64 Years | 41 (6.2%) | 63 (12.5%) |
| 65 to 69 Years | 15 (2.3%) | 21 (4.2%) |
| 70 to 74 Years | 203 (30.8%) | 52 (10.3%) |
| 75 to 79 Years | 13 (2.0%) | 16 (3.2%) |
| 80 to 84 Years | 2 (0.3%) | 0 (0.0%) |
| 85 Years and over | 0 (0.0%) | 3 (0.6%) |
| Total | 660 (100.0%) | 505 (100.0%) |
Families and Households in Flovilla
Median Family Size in Flovilla
The median family size in Flovilla is 3.70 persons per family, with single female/mother families (38 | 15.4%) accounting for the largest median family size of 5.63 persons per family. On the other hand, single male/father families (47 | 19.0%) represent the smallest median family size with 3.34 persons per family.
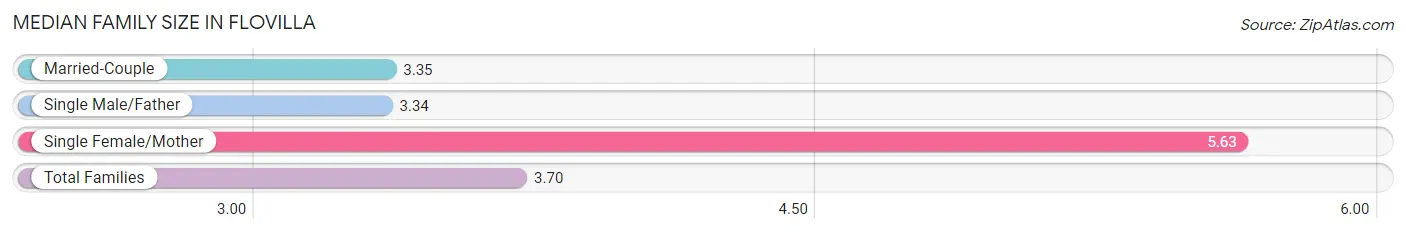
| Family Type | # Families | Family Size |
| Married-Couple | 162 (65.6%) | 3.35 |
| Single Male/Father | 47 (19.0%) | 3.34 |
| Single Female/Mother | 38 (15.4%) | 5.63 |
| Total Families | 247 (100.0%) | 3.70 |
Median Household Size in Flovilla
The median household size in Flovilla is 2.45 persons per household, with single female/mother households (38 | 8.0%) accounting for the largest median household size of 5.82 persons per household. non-family households (228 | 48.0%) represent the smallest median household size with 1.07 persons per household.
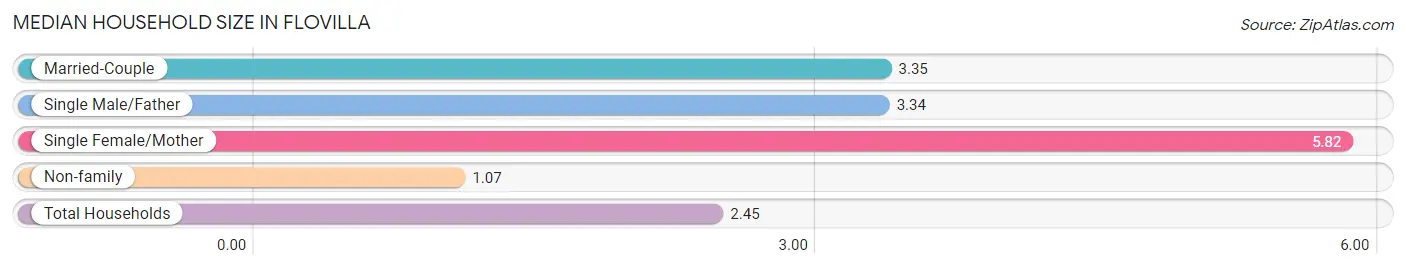
| Household Type | # Households | Household Size |
| Married-Couple | 162 (34.1%) | 3.35 |
| Single Male/Father | 47 (9.9%) | 3.34 |
| Single Female/Mother | 38 (8.0%) | 5.82 |
| Non-family | 228 (48.0%) | 1.07 |
| Total Households | 475 (100.0%) | 2.45 |
Household Size by Marriage Status in Flovilla
Out of a total of 475 households in Flovilla, 247 (52.0%) are family households, while 228 (48.0%) are nonfamily households. The most numerous type of family households are 2-person households, comprising 85, and the most common type of nonfamily households are 1-person households, comprising 218.
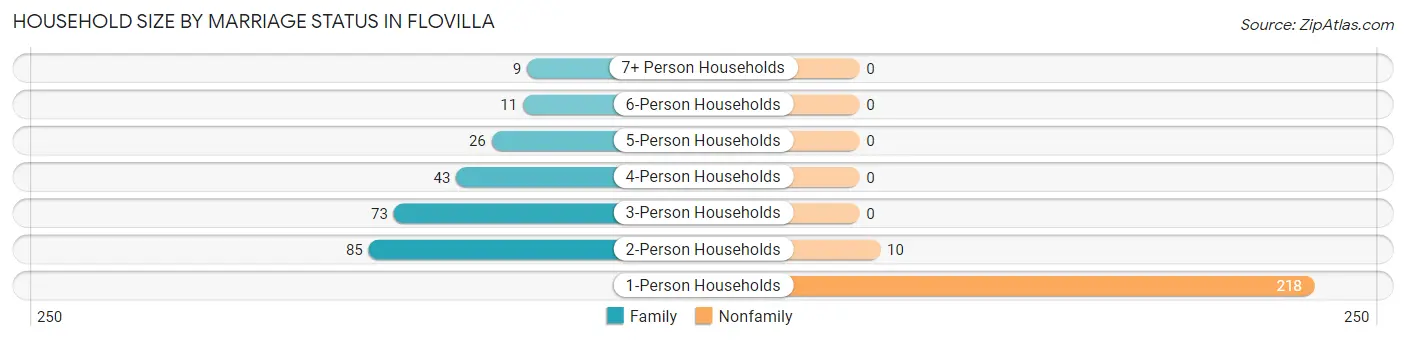
| Household Size | Family Households | Nonfamily Households |
| 1-Person Households | - | 218 (45.9%) |
| 2-Person Households | 85 (17.9%) | 10 (2.1%) |
| 3-Person Households | 73 (15.4%) | 0 (0.0%) |
| 4-Person Households | 43 (9.0%) | 0 (0.0%) |
| 5-Person Households | 26 (5.5%) | 0 (0.0%) |
| 6-Person Households | 11 (2.3%) | 0 (0.0%) |
| 7+ Person Households | 9 (1.9%) | 0 (0.0%) |
| Total | 247 (52.0%) | 228 (48.0%) |
Female Fertility in Flovilla
Fertility by Age in Flovilla
Average fertility rate in Flovilla is 107.0 births per 1,000 women. Women in the age bracket of 20 to 34 years have the highest fertility rate with 243.0 births per 1,000 women. Women in the age bracket of 20 to 34 years acount for 100.0% of all women with births.
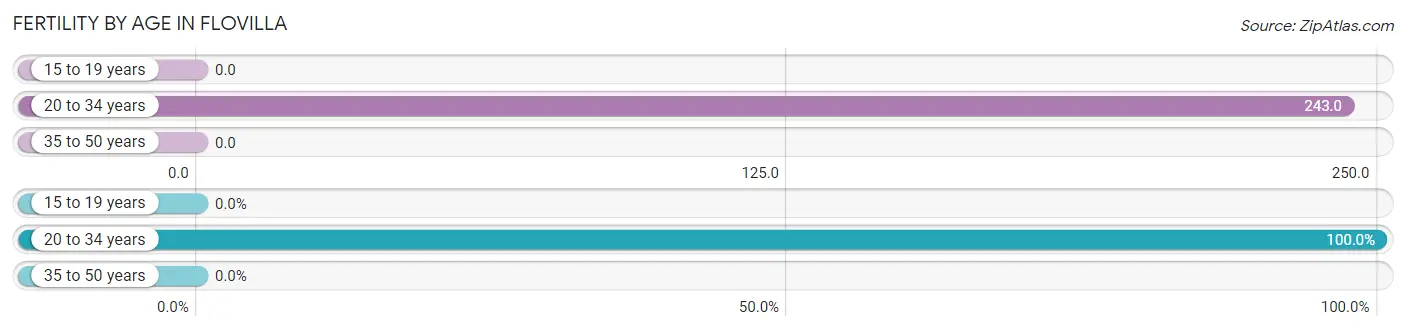
| Age Bracket | Women with Births | Births / 1,000 Women |
| 15 to 19 years | 0 (0.0%) | 0.0 |
| 20 to 34 years | 26 (100.0%) | 243.0 |
| 35 to 50 years | 0 (0.0%) | 0.0 |
| Total | 26 (100.0%) | 107.0 |
Fertility by Age by Marriage Status in Flovilla
46.2% of women with births (26) in Flovilla are married. The highest percentage of unmarried women with births falls into 20 to 34 years age bracket with 53.8% of them unmarried at the time of birth, while the lowest percentage of unmarried women with births belong to 20 to 34 years age bracket with 53.8% of them unmarried.
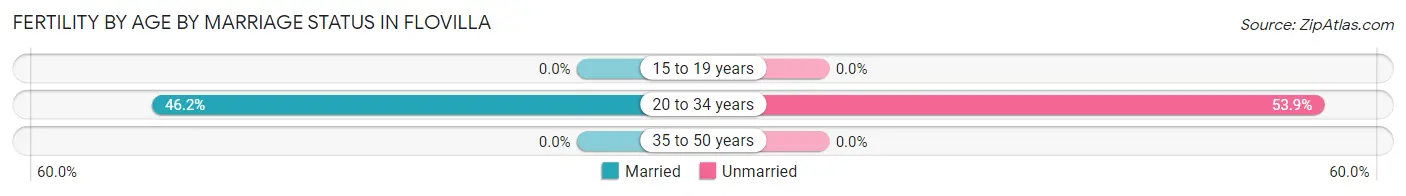
| Age Bracket | Married | Unmarried |
| 15 to 19 years | 0 (0.0%) | 0 (0.0%) |
| 20 to 34 years | 12 (46.2%) | 14 (53.8%) |
| 35 to 50 years | 0 (0.0%) | 0 (0.0%) |
| Total | 12 (46.2%) | 14 (53.8%) |
Fertility by Education in Flovilla
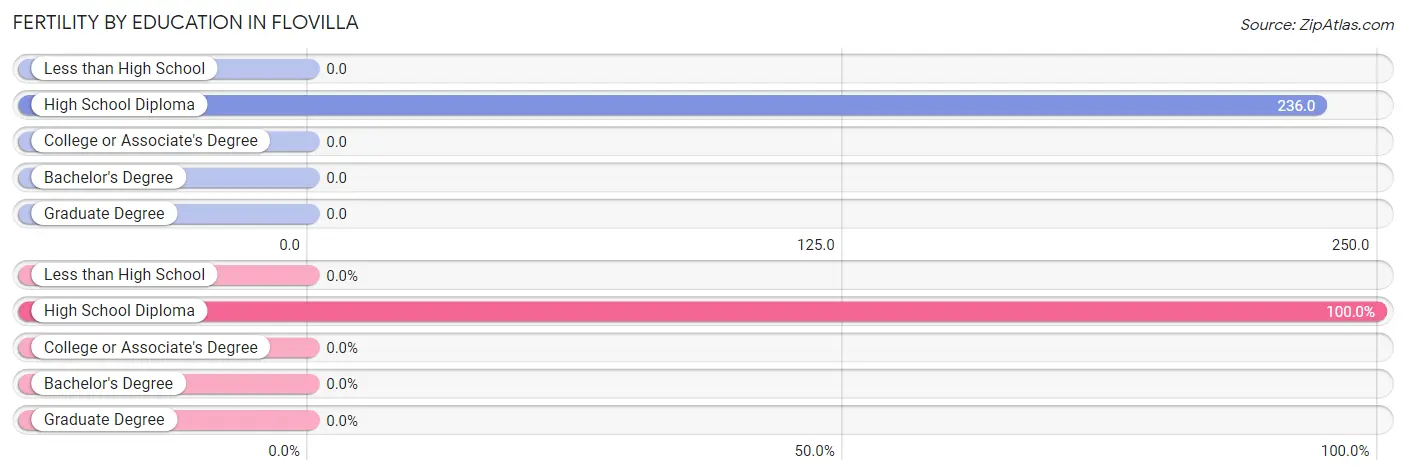
| Educational Attainment | Women with Births | Births / 1,000 Women |
| Less than High School | 0 (0.0%) | 0.0 |
| High School Diploma | 26 (100.0%) | 236.0 |
| College or Associate's Degree | 0 (0.0%) | 0.0 |
| Bachelor's Degree | 0 (0.0%) | 0.0 |
| Graduate Degree | 0 (0.0%) | 0.0 |
| Total | 26 (100.0%) | 107.0 |
Fertility by Education by Marriage Status in Flovilla
53.8% of women with births in Flovilla are unmarried. Women with the educational attainment of high school diploma are most likely to be married with 46.2% of them married at childbirth, while women with the educational attainment of high school diploma are least likely to be married with 53.8% of them unmarried at childbirth.
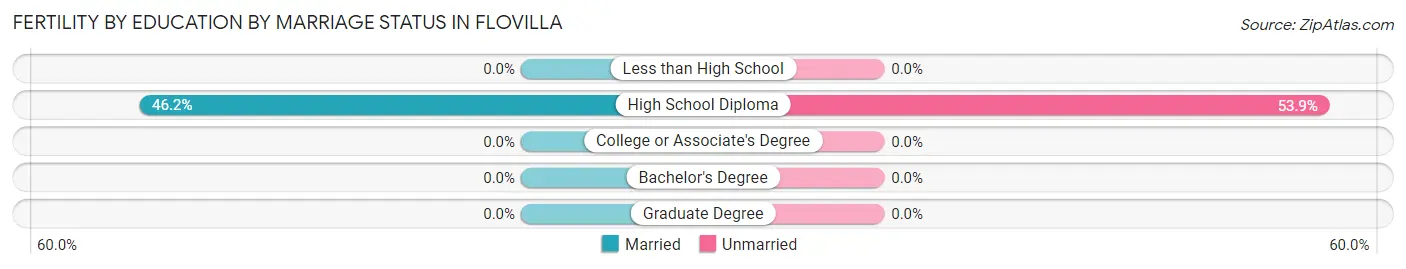
| Educational Attainment | Married | Unmarried |
| Less than High School | 0 (0.0%) | 0 (0.0%) |
| High School Diploma | 12 (46.2%) | 14 (53.8%) |
| College or Associate's Degree | 0 (0.0%) | 0 (0.0%) |
| Bachelor's Degree | 0 (0.0%) | 0 (0.0%) |
| Graduate Degree | 0 (0.0%) | 0 (0.0%) |
| Total | 12 (46.2%) | 14 (53.8%) |
Employment Characteristics in Flovilla
Employment by Class of Employer in Flovilla
Among the 429 employed individuals in Flovilla, private company employees (349 | 81.4%), local government employees (43 | 10.0%), and self-employed (incorporated) (13 | 3.0%) make up the most common classes of employment.
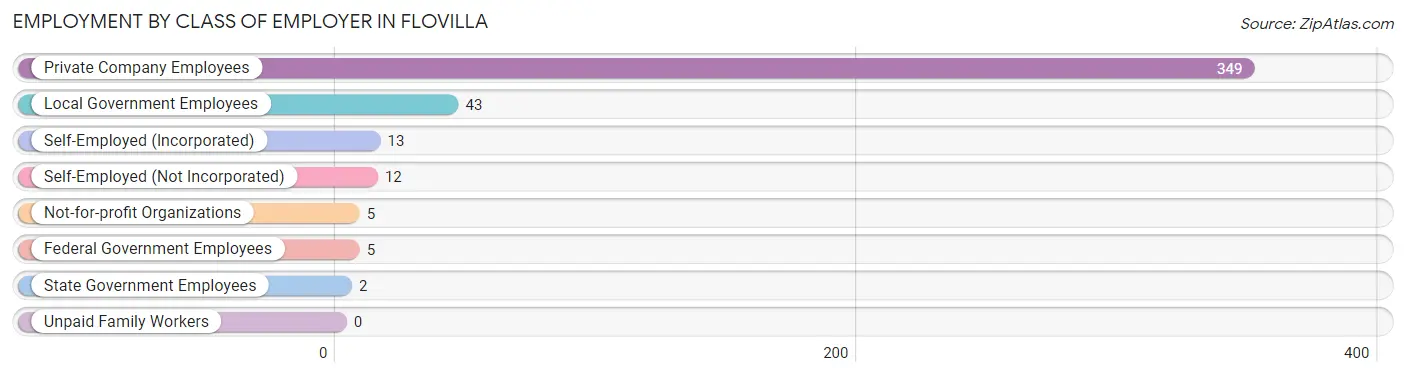
| Employer Class | # Employees | % Employees |
| Private Company Employees | 349 | 81.4% |
| Self-Employed (Incorporated) | 13 | 3.0% |
| Self-Employed (Not Incorporated) | 12 | 2.8% |
| Not-for-profit Organizations | 5 | 1.2% |
| Local Government Employees | 43 | 10.0% |
| State Government Employees | 2 | 0.5% |
| Federal Government Employees | 5 | 1.2% |
| Unpaid Family Workers | 0 | 0.0% |
| Total | 429 | 100.0% |
Employment Status by Age in Flovilla
According to the labor force statistics for Flovilla, out of the total population over 16 years of age (1,035), 47.7% or 494 individuals are in the labor force, with 10.8% or 53 of them unemployed. The age group with the highest labor force participation rate is 30 to 34 years, with 88.4% or 38 individuals in the labor force. Within the labor force, the 30 to 34 years age range has the highest percentage of unemployed individuals, with 68.4% or 26 of them being unemployed.
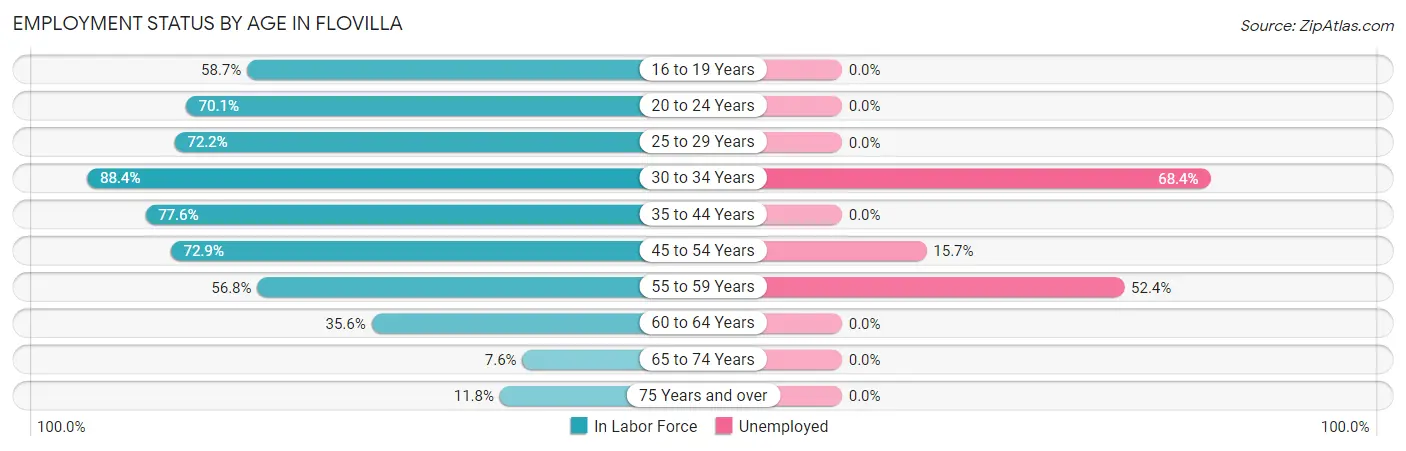
| Age Bracket | In Labor Force | Unemployed |
| 16 to 19 Years | 37 (58.7%) | 0 (0.0%) |
| 20 to 24 Years | 124 (70.1%) | 0 (0.0%) |
| 25 to 29 Years | 57 (72.2%) | 0 (0.0%) |
| 30 to 34 Years | 38 (88.4%) | 26 (68.4%) |
| 35 to 44 Years | 52 (77.6%) | 0 (0.0%) |
| 45 to 54 Years | 102 (72.9%) | 16 (15.7%) |
| 55 to 59 Years | 21 (56.8%) | 11 (52.4%) |
| 60 to 64 Years | 37 (35.6%) | 0 (0.0%) |
| 65 to 74 Years | 22 (7.6%) | 0 (0.0%) |
| 75 Years and over | 4 (11.8%) | 0 (0.0%) |
| Total | 494 (47.7%) | 53 (10.8%) |
Employment Status by Educational Attainment in Flovilla
According to labor force statistics for Flovilla, 65.3% of individuals (307) out of the total population between 25 and 64 years of age (470) are in the labor force, with 17.4% or 53 of them being unemployed. The group with the highest labor force participation rate are those with the educational attainment of bachelor's degree or higher, with 96.4% or 53 individuals in the labor force. Within the labor force, individuals with bachelor's degree or higher education have the highest percentage of unemployment, with 49.1% or 26 of them being unemployed.

| Educational Attainment | In Labor Force | Unemployed |
| Less than High School | 29 (30.5%) | 13 (13.8%) |
| High School Diploma | 164 (68.6%) | 33 (14.0%) |
| College / Associate Degree | 61 (75.3%) | 0 (0.0%) |
| Bachelor's Degree or higher | 53 (96.4%) | 27 (49.1%) |
| Total | 307 (65.3%) | 82 (17.4%) |
Employment Occupations by Sex in Flovilla
Management, Business, Science and Arts Occupations
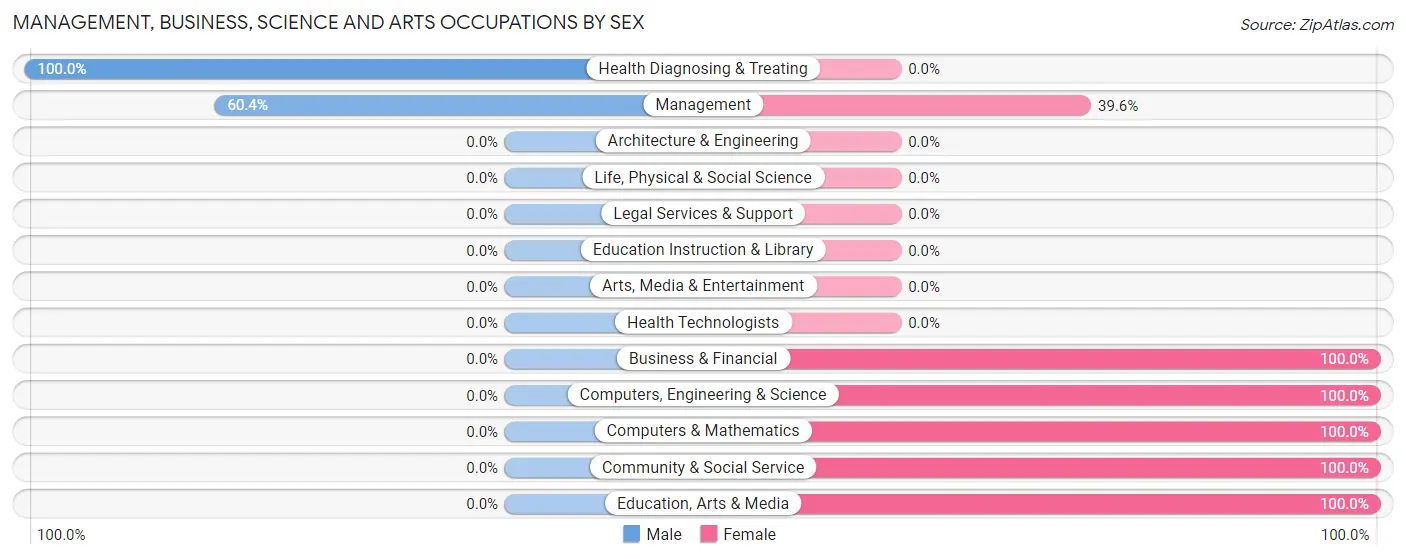
The most common Management, Business, Science and Arts occupations in Flovilla are Management (53 | 12.1%), Business & Financial (27 | 6.2%), Computers, Engineering & Science (12 | 2.7%), Computers & Mathematics (12 | 2.7%), and Community & Social Service (5 | 1.1%).
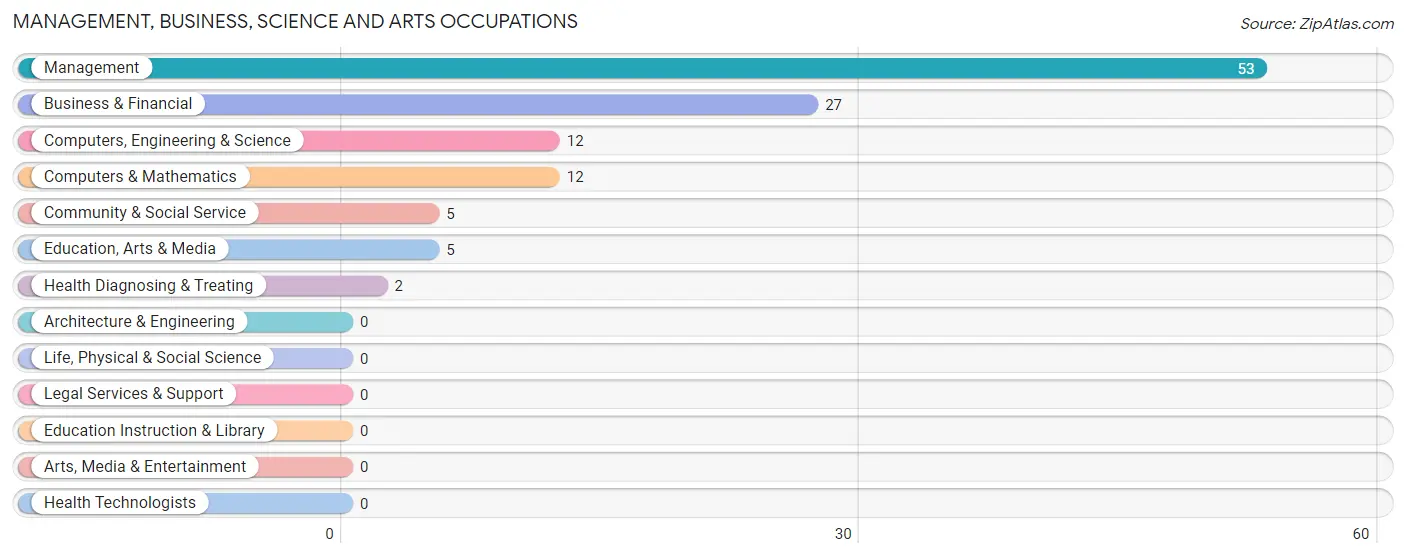
Management, Business, Science and Arts Occupations by Sex
Within the Management, Business, Science and Arts occupations in Flovilla, the most male-oriented occupations are Health Diagnosing & Treating (100.0%), and Management (60.4%), while the most female-oriented occupations are Business & Financial (100.0%), Computers, Engineering & Science (100.0%), and Computers & Mathematics (100.0%).
| Occupation | Male | Female |
| Management | 32 (60.4%) | 21 (39.6%) |
| Business & Financial | 0 (0.0%) | 27 (100.0%) |
| Computers, Engineering & Science | 0 (0.0%) | 12 (100.0%) |
| Computers & Mathematics | 0 (0.0%) | 12 (100.0%) |
| Architecture & Engineering | 0 (0.0%) | 0 (0.0%) |
| Life, Physical & Social Science | 0 (0.0%) | 0 (0.0%) |
| Community & Social Service | 0 (0.0%) | 5 (100.0%) |
| Education, Arts & Media | 0 (0.0%) | 5 (100.0%) |
| Legal Services & Support | 0 (0.0%) | 0 (0.0%) |
| Education Instruction & Library | 0 (0.0%) | 0 (0.0%) |
| Arts, Media & Entertainment | 0 (0.0%) | 0 (0.0%) |
| Health Diagnosing & Treating | 2 (100.0%) | 0 (0.0%) |
| Health Technologists | 0 (0.0%) | 0 (0.0%) |
| Total (Category) | 34 (34.3%) | 65 (65.7%) |
| Total (Overall) | 281 (64.2%) | 157 (35.8%) |
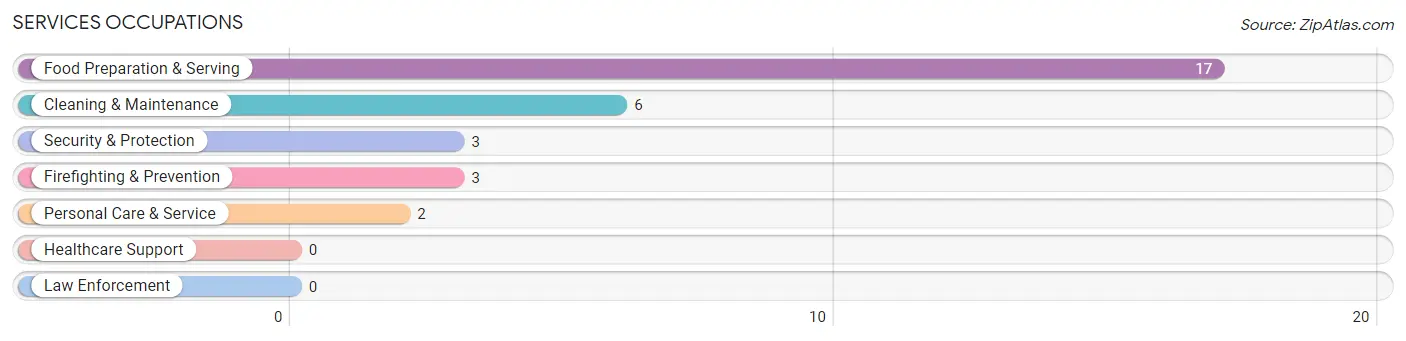
Services Occupations
The most common Services occupations in Flovilla are Food Preparation & Serving (17 | 3.9%), Cleaning & Maintenance (6 | 1.4%), Security & Protection (3 | 0.7%), Firefighting & Prevention (3 | 0.7%), and Personal Care & Service (2 | 0.5%).
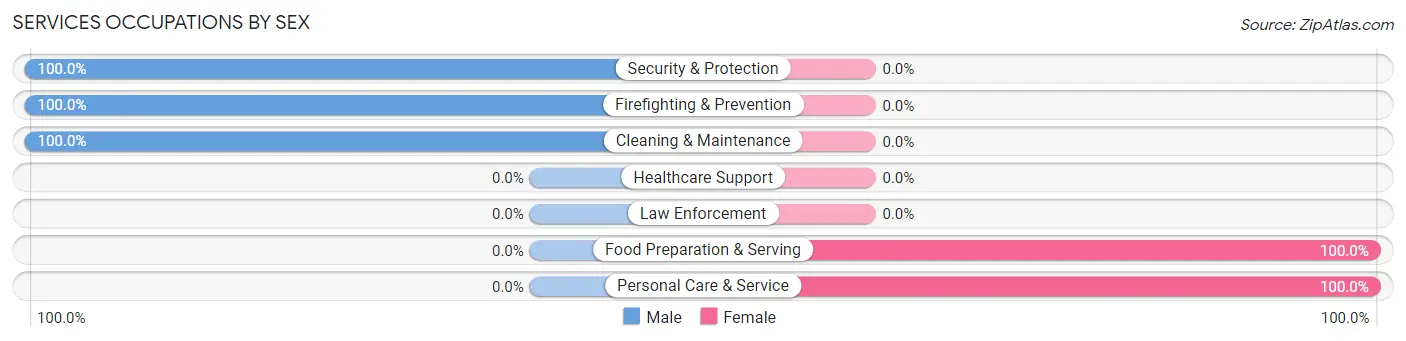
Services Occupations by Sex
Within the Services occupations in Flovilla, the most male-oriented occupations are Security & Protection (100.0%), Firefighting & Prevention (100.0%), and Cleaning & Maintenance (100.0%), while the most female-oriented occupations are Food Preparation & Serving (100.0%), and Personal Care & Service (100.0%).
| Occupation | Male | Female |
| Healthcare Support | 0 (0.0%) | 0 (0.0%) |
| Security & Protection | 3 (100.0%) | 0 (0.0%) |
| Firefighting & Prevention | 3 (100.0%) | 0 (0.0%) |
| Law Enforcement | 0 (0.0%) | 0 (0.0%) |
| Food Preparation & Serving | 0 (0.0%) | 17 (100.0%) |
| Cleaning & Maintenance | 6 (100.0%) | 0 (0.0%) |
| Personal Care & Service | 0 (0.0%) | 2 (100.0%) |
| Total (Category) | 9 (32.1%) | 19 (67.9%) |
| Total (Overall) | 281 (64.2%) | 157 (35.8%) |
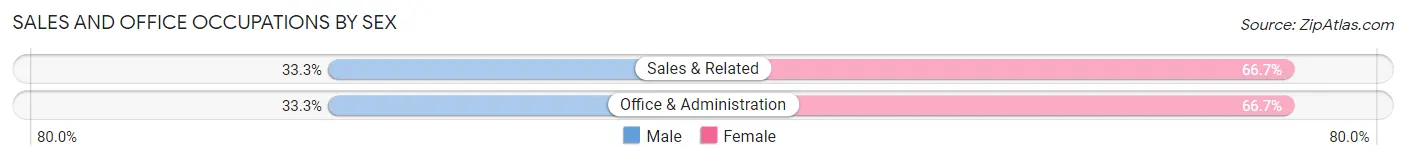
Sales and Office Occupations
The most common Sales and Office occupations in Flovilla are Office & Administration (60 | 13.7%), and Sales & Related (18 | 4.1%).

Sales and Office Occupations by Sex
| Occupation | Male | Female |
| Sales & Related | 6 (33.3%) | 12 (66.7%) |
| Office & Administration | 20 (33.3%) | 40 (66.7%) |
| Total (Category) | 26 (33.3%) | 52 (66.7%) |
| Total (Overall) | 281 (64.2%) | 157 (35.8%) |
Natural Resources, Construction and Maintenance Occupations
The most common Natural Resources, Construction and Maintenance occupations in Flovilla are Construction & Extraction (99 | 22.6%), and Installation, Maintenance & Repair (24 | 5.5%).
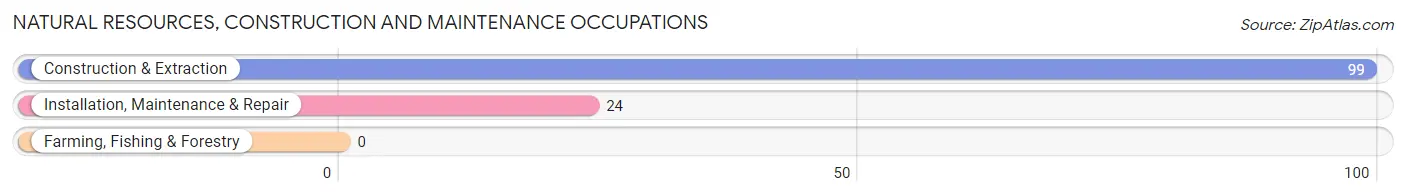
Natural Resources, Construction and Maintenance Occupations by Sex

| Occupation | Male | Female |
| Farming, Fishing & Forestry | 0 (0.0%) | 0 (0.0%) |
| Construction & Extraction | 99 (100.0%) | 0 (0.0%) |
| Installation, Maintenance & Repair | 20 (83.3%) | 4 (16.7%) |
| Total (Category) | 119 (96.8%) | 4 (3.3%) |
| Total (Overall) | 281 (64.2%) | 157 (35.8%) |
Production, Transportation and Moving Occupations
The most common Production, Transportation and Moving occupations in Flovilla are Transportation (60 | 13.7%), Production (28 | 6.4%), and Material Moving (22 | 5.0%).
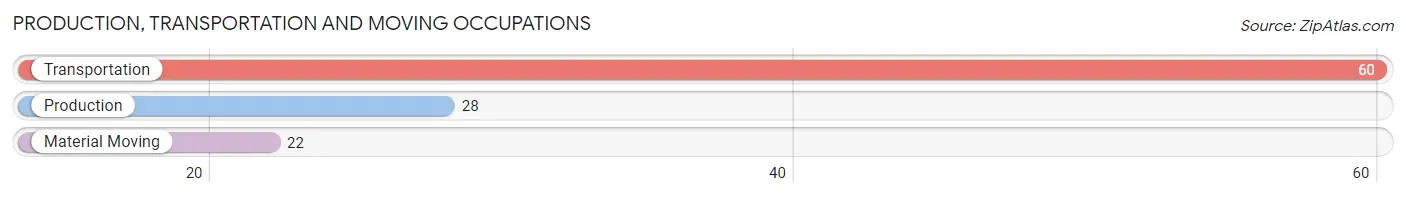
Production, Transportation and Moving Occupations by Sex
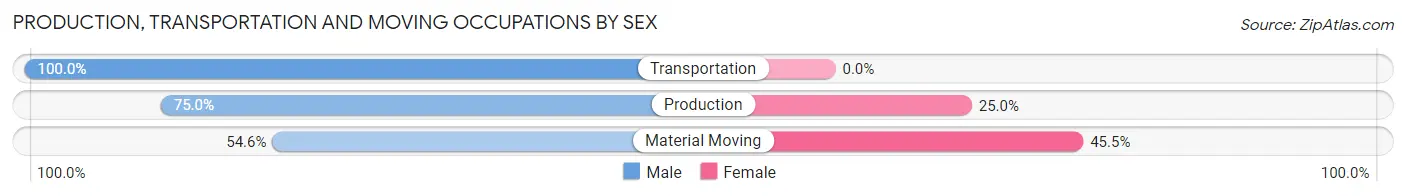
| Occupation | Male | Female |
| Production | 21 (75.0%) | 7 (25.0%) |
| Transportation | 60 (100.0%) | 0 (0.0%) |
| Material Moving | 12 (54.5%) | 10 (45.5%) |
| Total (Category) | 93 (84.6%) | 17 (15.4%) |
| Total (Overall) | 281 (64.2%) | 157 (35.8%) |
Employment Industries by Sex in Flovilla
Employment Industries in Flovilla
The major employment industries in Flovilla include Construction (156 | 35.6%), Transportation & Warehousing (54 | 12.3%), Manufacturing (51 | 11.6%), Health Care & Social Assistance (43 | 9.8%), and Accommodation & Food Services (23 | 5.2%).
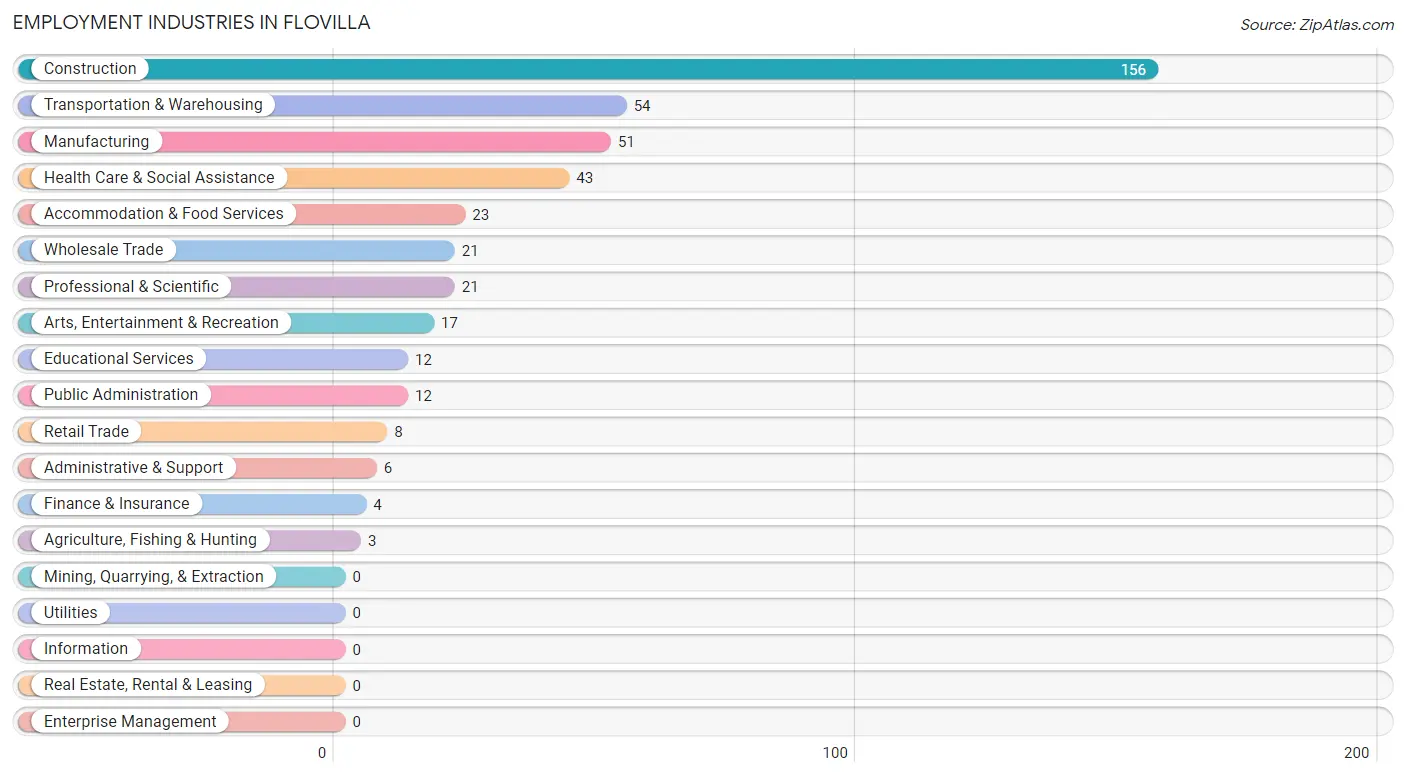
Employment Industries by Sex in Flovilla
The Flovilla industries that see more men than women are Agriculture, Fishing & Hunting (100.0%), Administrative & Support (100.0%), and Educational Services (100.0%), whereas the industries that tend to have a higher number of women are Finance & Insurance (100.0%), Arts, Entertainment & Recreation (100.0%), and Health Care & Social Assistance (95.4%).
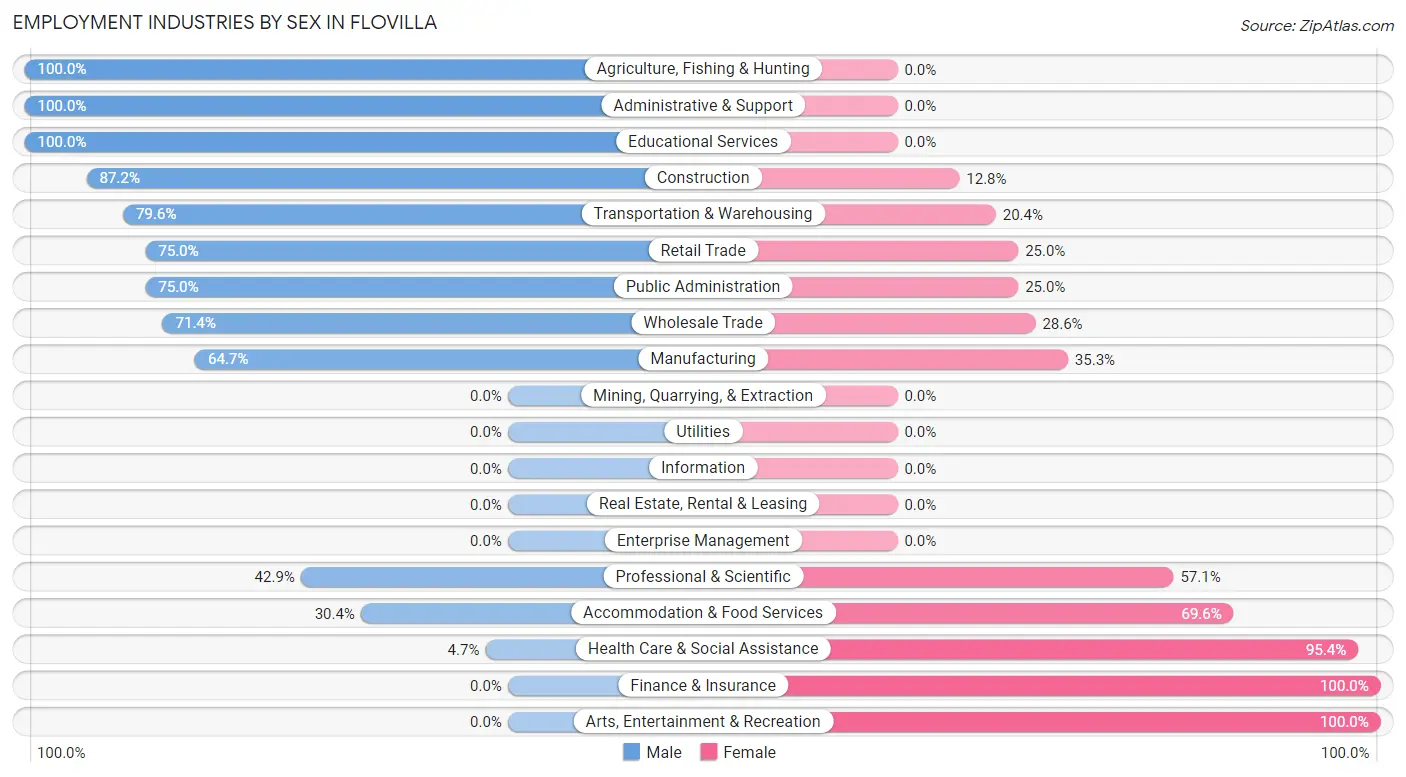
| Industry | Male | Female |
| Agriculture, Fishing & Hunting | 3 (100.0%) | 0 (0.0%) |
| Mining, Quarrying, & Extraction | 0 (0.0%) | 0 (0.0%) |
| Construction | 136 (87.2%) | 20 (12.8%) |
| Manufacturing | 33 (64.7%) | 18 (35.3%) |
| Wholesale Trade | 15 (71.4%) | 6 (28.6%) |
| Retail Trade | 6 (75.0%) | 2 (25.0%) |
| Transportation & Warehousing | 43 (79.6%) | 11 (20.4%) |
| Utilities | 0 (0.0%) | 0 (0.0%) |
| Information | 0 (0.0%) | 0 (0.0%) |
| Finance & Insurance | 0 (0.0%) | 4 (100.0%) |
| Real Estate, Rental & Leasing | 0 (0.0%) | 0 (0.0%) |
| Professional & Scientific | 9 (42.9%) | 12 (57.1%) |
| Enterprise Management | 0 (0.0%) | 0 (0.0%) |
| Administrative & Support | 6 (100.0%) | 0 (0.0%) |
| Educational Services | 12 (100.0%) | 0 (0.0%) |
| Health Care & Social Assistance | 2 (4.6%) | 41 (95.4%) |
| Arts, Entertainment & Recreation | 0 (0.0%) | 17 (100.0%) |
| Accommodation & Food Services | 7 (30.4%) | 16 (69.6%) |
| Public Administration | 9 (75.0%) | 3 (25.0%) |
| Total | 281 (64.2%) | 157 (35.8%) |
Education in Flovilla
School Enrollment in Flovilla
The most common levels of schooling among the 152 students in Flovilla are high school (73 | 48.0%), elementary school (37 | 24.3%), and middle school (29 | 19.1%).
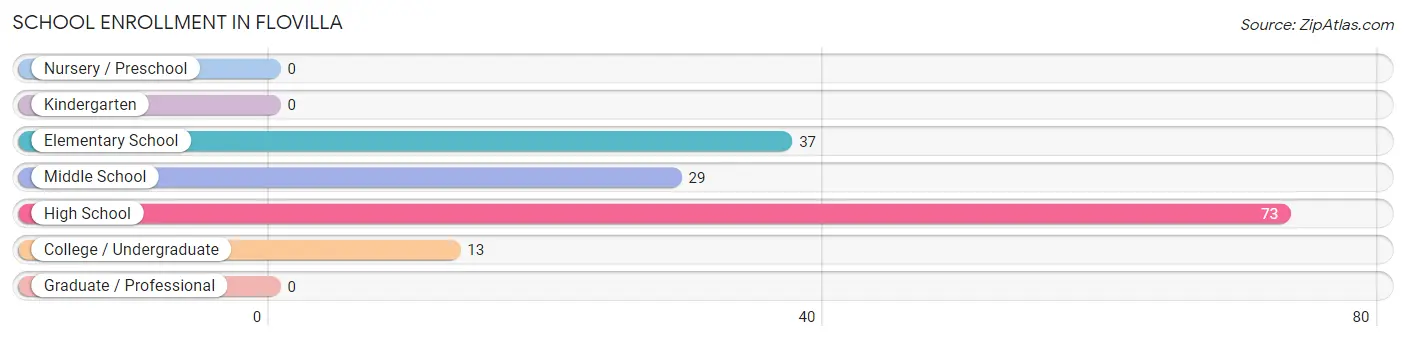
| School Level | # Students | % Students |
| Nursery / Preschool | 0 | 0.0% |
| Kindergarten | 0 | 0.0% |
| Elementary School | 37 | 24.3% |
| Middle School | 29 | 19.1% |
| High School | 73 | 48.0% |
| College / Undergraduate | 13 | 8.6% |
| Graduate / Professional | 0 | 0.0% |
| Total | 152 | 100.0% |
School Enrollment by Age by Funding Source in Flovilla
Out of a total of 152 students who are enrolled in schools in Flovilla, 13 (8.6%) attend a private institution, while the remaining 139 (91.4%) are enrolled in public schools. The age group of 35 years and over has the highest likelihood of being enrolled in private schools, with 6 (100.0% in the age bracket) enrolled. Conversely, the age group of 5 to 9 year old has the lowest likelihood of being enrolled in a private school, with 23 (100.0% in the age bracket) attending a public institution.
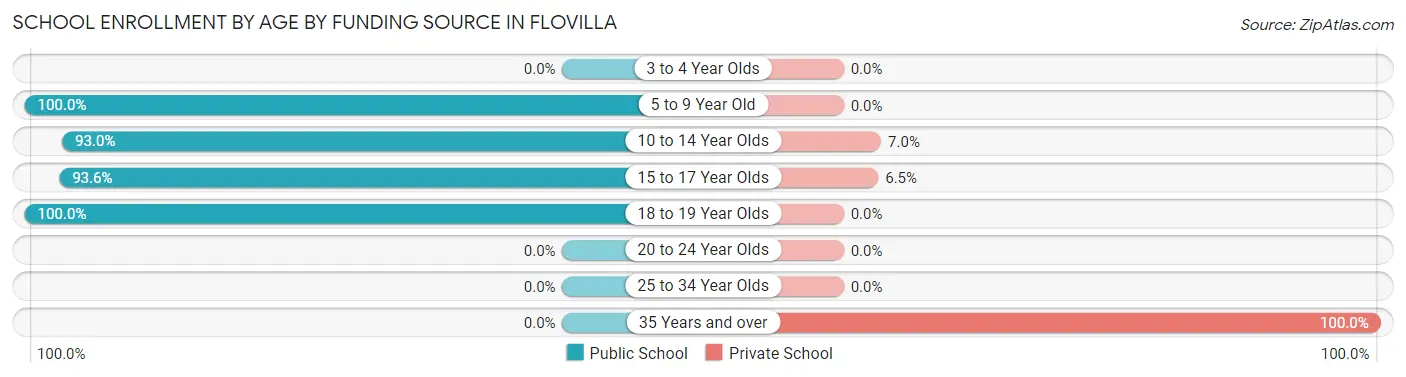
| Age Bracket | Public School | Private School |
| 3 to 4 Year Olds | 0 (0.0%) | 0 (0.0%) |
| 5 to 9 Year Old | 23 (100.0%) | 0 (0.0%) |
| 10 to 14 Year Olds | 40 (93.0%) | 3 (7.0%) |
| 15 to 17 Year Olds | 58 (93.5%) | 4 (6.5%) |
| 18 to 19 Year Olds | 18 (100.0%) | 0 (0.0%) |
| 20 to 24 Year Olds | 0 (0.0%) | 0 (0.0%) |
| 25 to 34 Year Olds | 0 (0.0%) | 0 (0.0%) |
| 35 Years and over | 0 (0.0%) | 6 (100.0%) |
| Total | 139 (91.4%) | 13 (8.6%) |
Educational Attainment by Field of Study in Flovilla
Computers & mathematics (26 | 40.6%), bio, nature & agricultural (16 | 25.0%), education (12 | 18.8%), visual & performing arts (7 | 10.9%), and liberal arts & history (3 | 4.7%) are the most common fields of study among 64 individuals in Flovilla who have obtained a bachelor's degree or higher.
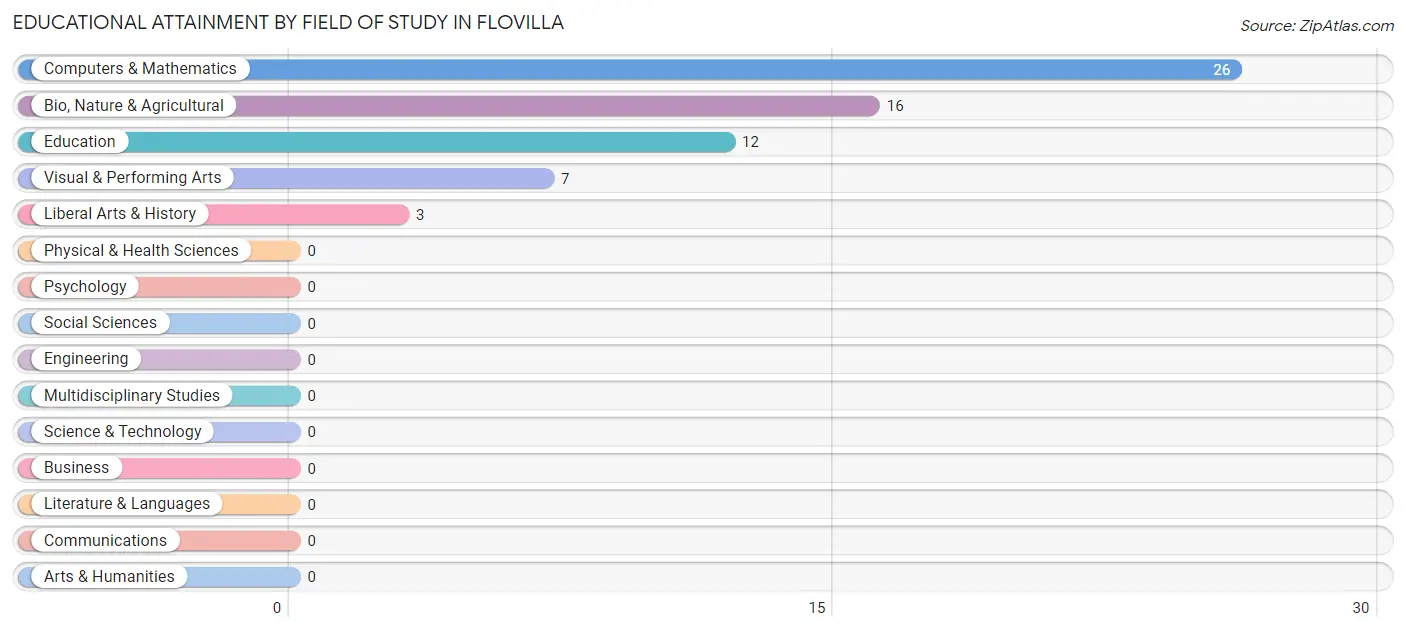
| Field of Study | # Graduates | % Graduates |
| Computers & Mathematics | 26 | 40.6% |
| Bio, Nature & Agricultural | 16 | 25.0% |
| Physical & Health Sciences | 0 | 0.0% |
| Psychology | 0 | 0.0% |
| Social Sciences | 0 | 0.0% |
| Engineering | 0 | 0.0% |
| Multidisciplinary Studies | 0 | 0.0% |
| Science & Technology | 0 | 0.0% |
| Business | 0 | 0.0% |
| Education | 12 | 18.8% |
| Literature & Languages | 0 | 0.0% |
| Liberal Arts & History | 3 | 4.7% |
| Visual & Performing Arts | 7 | 10.9% |
| Communications | 0 | 0.0% |
| Arts & Humanities | 0 | 0.0% |
| Total | 64 | 100.0% |
Transportation & Commute in Flovilla
Vehicle Availability by Sex in Flovilla
The most prevalent vehicle ownership categories in Flovilla are males with 4 vehicles (134, accounting for 48.7%) and females with 4 vehicles (39, making up 87.0%).
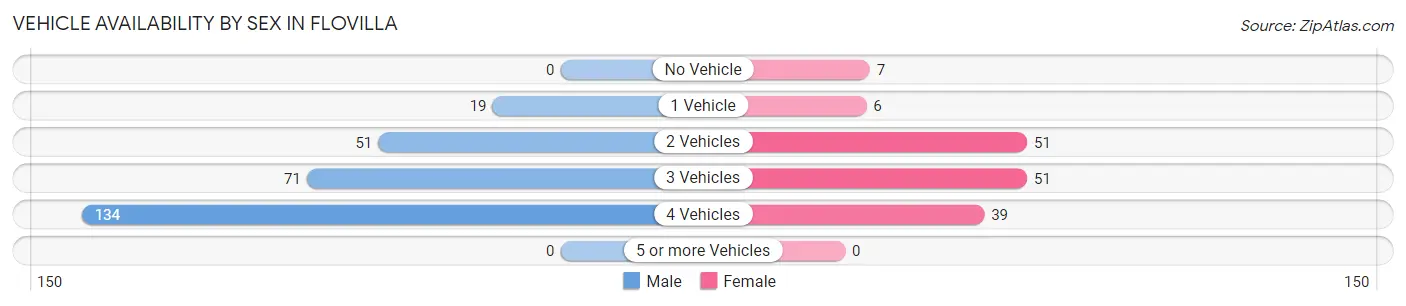
| Vehicles Available | Male | Female |
| No Vehicle | 0 (0.0%) | 7 (4.5%) |
| 1 Vehicle | 19 (6.9%) | 6 (3.9%) |
| 2 Vehicles | 51 (18.5%) | 51 (33.1%) |
| 3 Vehicles | 71 (25.8%) | 51 (33.1%) |
| 4 Vehicles | 134 (48.7%) | 39 (25.3%) |
| 5 or more Vehicles | 0 (0.0%) | 0 (0.0%) |
| Total | 275 (100.0%) | 154 (100.0%) |
Commute Time in Flovilla
The most frequently occuring commute durations in Flovilla are 15 to 19 minutes (101 commuters, 25.0%), 60 to 89 minutes (84 commuters, 20.8%), and 40 to 44 minutes (43 commuters, 10.6%).
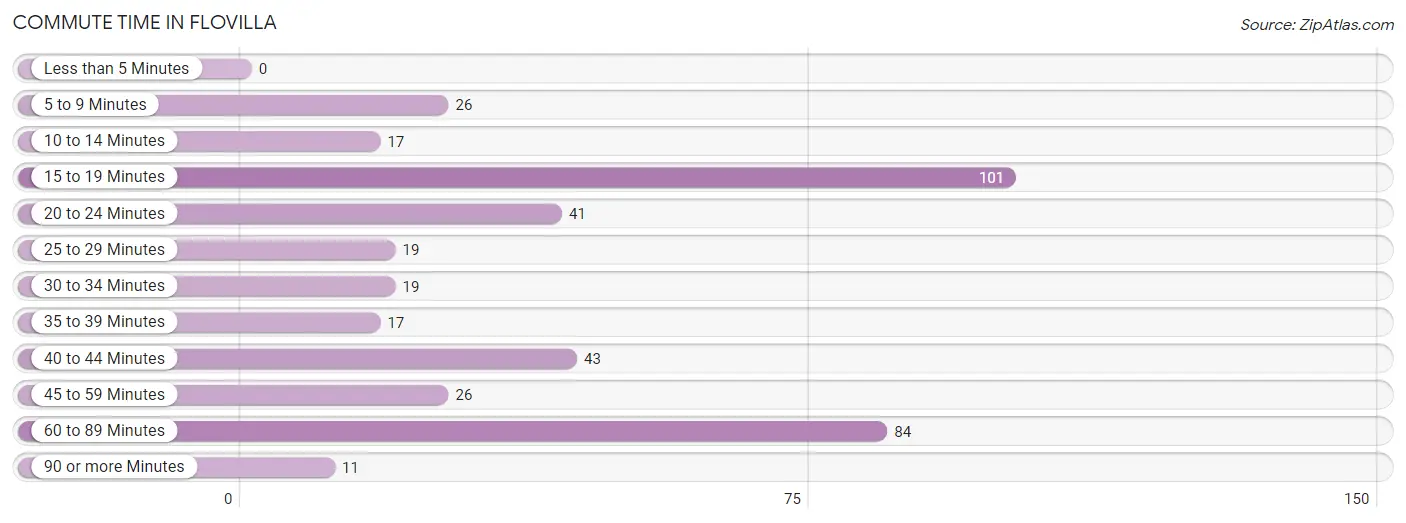
| Commute Time | # Commuters | % Commuters |
| Less than 5 Minutes | 0 | 0.0% |
| 5 to 9 Minutes | 26 | 6.4% |
| 10 to 14 Minutes | 17 | 4.2% |
| 15 to 19 Minutes | 101 | 25.0% |
| 20 to 24 Minutes | 41 | 10.2% |
| 25 to 29 Minutes | 19 | 4.7% |
| 30 to 34 Minutes | 19 | 4.7% |
| 35 to 39 Minutes | 17 | 4.2% |
| 40 to 44 Minutes | 43 | 10.6% |
| 45 to 59 Minutes | 26 | 6.4% |
| 60 to 89 Minutes | 84 | 20.8% |
| 90 or more Minutes | 11 | 2.7% |
Commute Time by Sex in Flovilla
The most common commute times in Flovilla are 15 to 19 minutes (86 commuters, 32.6%) for males and 20 to 24 minutes (29 commuters, 20.7%) for females.
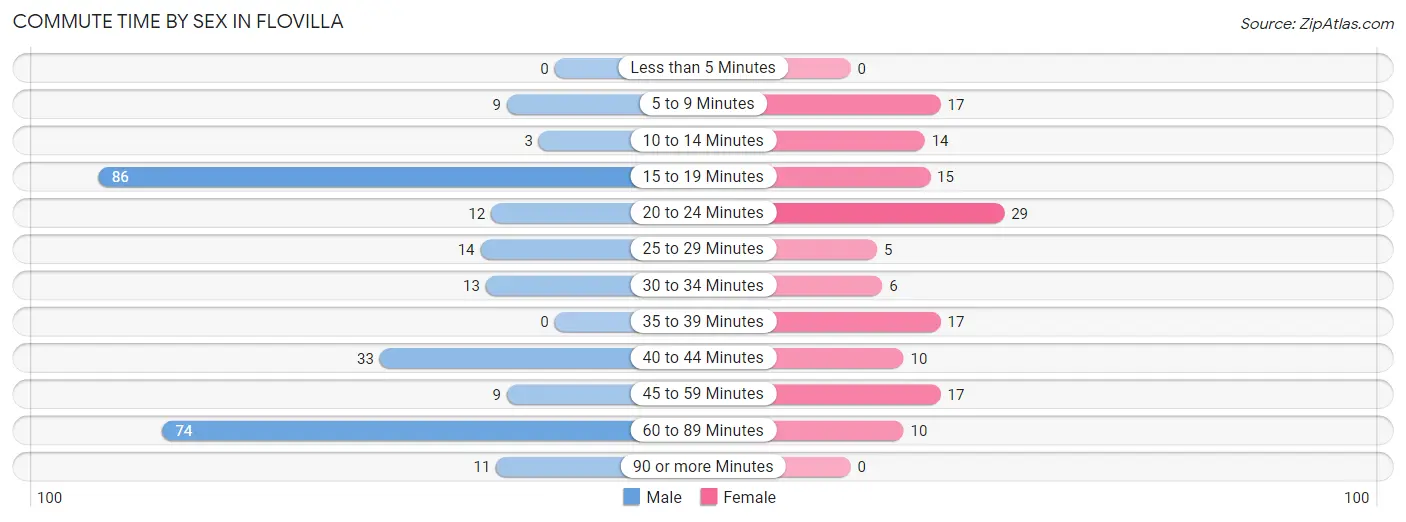
| Commute Time | Male | Female |
| Less than 5 Minutes | 0 (0.0%) | 0 (0.0%) |
| 5 to 9 Minutes | 9 (3.4%) | 17 (12.1%) |
| 10 to 14 Minutes | 3 (1.1%) | 14 (10.0%) |
| 15 to 19 Minutes | 86 (32.6%) | 15 (10.7%) |
| 20 to 24 Minutes | 12 (4.5%) | 29 (20.7%) |
| 25 to 29 Minutes | 14 (5.3%) | 5 (3.6%) |
| 30 to 34 Minutes | 13 (4.9%) | 6 (4.3%) |
| 35 to 39 Minutes | 0 (0.0%) | 17 (12.1%) |
| 40 to 44 Minutes | 33 (12.5%) | 10 (7.1%) |
| 45 to 59 Minutes | 9 (3.4%) | 17 (12.1%) |
| 60 to 89 Minutes | 74 (28.0%) | 10 (7.1%) |
| 90 or more Minutes | 11 (4.2%) | 0 (0.0%) |
Time of Departure to Work by Sex in Flovilla
The most frequent times of departure to work in Flovilla are 8:00 AM to 8:29 AM (49, 18.6%) for males and 7:00 AM to 7:29 AM (31, 22.1%) for females.
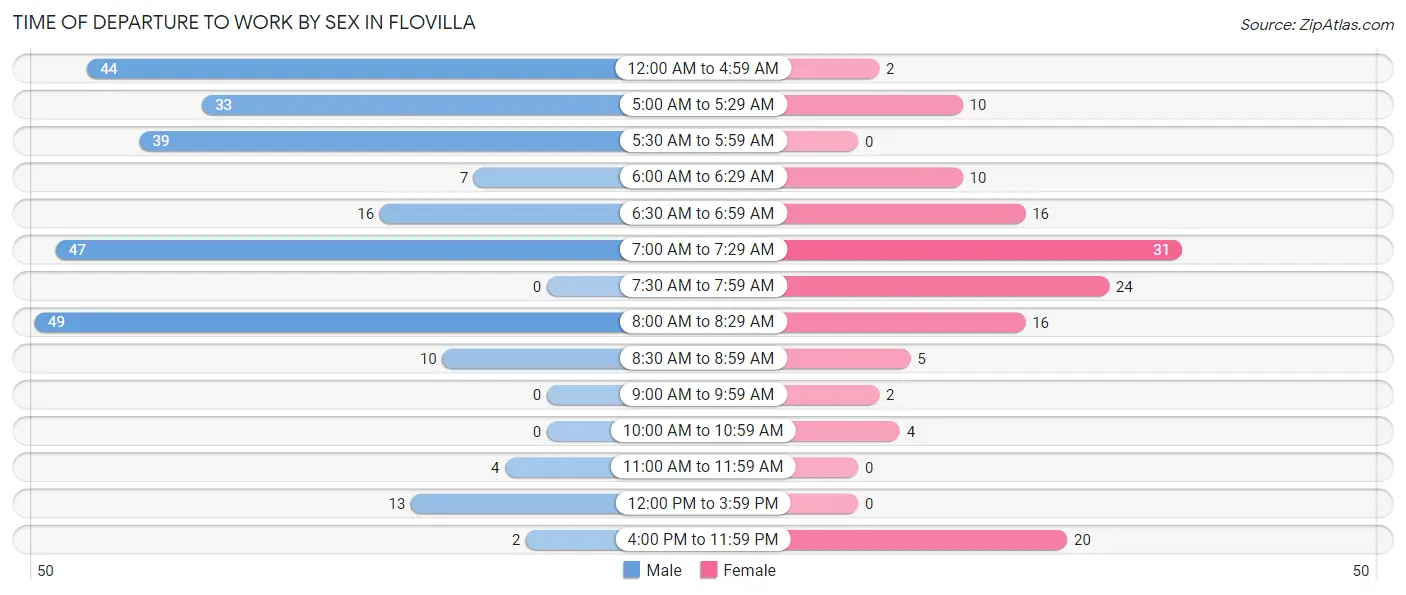
| Time of Departure | Male | Female |
| 12:00 AM to 4:59 AM | 44 (16.7%) | 2 (1.4%) |
| 5:00 AM to 5:29 AM | 33 (12.5%) | 10 (7.1%) |
| 5:30 AM to 5:59 AM | 39 (14.8%) | 0 (0.0%) |
| 6:00 AM to 6:29 AM | 7 (2.6%) | 10 (7.1%) |
| 6:30 AM to 6:59 AM | 16 (6.1%) | 16 (11.4%) |
| 7:00 AM to 7:29 AM | 47 (17.8%) | 31 (22.1%) |
| 7:30 AM to 7:59 AM | 0 (0.0%) | 24 (17.1%) |
| 8:00 AM to 8:29 AM | 49 (18.6%) | 16 (11.4%) |
| 8:30 AM to 8:59 AM | 10 (3.8%) | 5 (3.6%) |
| 9:00 AM to 9:59 AM | 0 (0.0%) | 2 (1.4%) |
| 10:00 AM to 10:59 AM | 0 (0.0%) | 4 (2.9%) |
| 11:00 AM to 11:59 AM | 4 (1.5%) | 0 (0.0%) |
| 12:00 PM to 3:59 PM | 13 (4.9%) | 0 (0.0%) |
| 4:00 PM to 11:59 PM | 2 (0.8%) | 20 (14.3%) |
| Total | 264 (100.0%) | 140 (100.0%) |
Housing Occupancy in Flovilla
Occupancy by Ownership in Flovilla
Of the total 475 dwellings in Flovilla, owner-occupied units account for 412 (86.7%), while renter-occupied units make up 63 (13.3%).
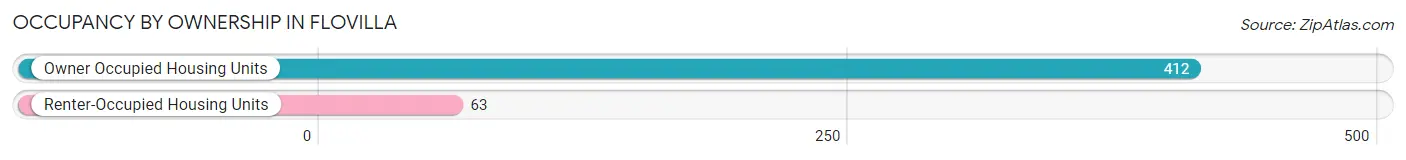
| Occupancy | # Housing Units | % Housing Units |
| Owner Occupied Housing Units | 412 | 86.7% |
| Renter-Occupied Housing Units | 63 | 13.3% |
| Total Occupied Housing Units | 475 | 100.0% |
Occupancy by Household Size in Flovilla
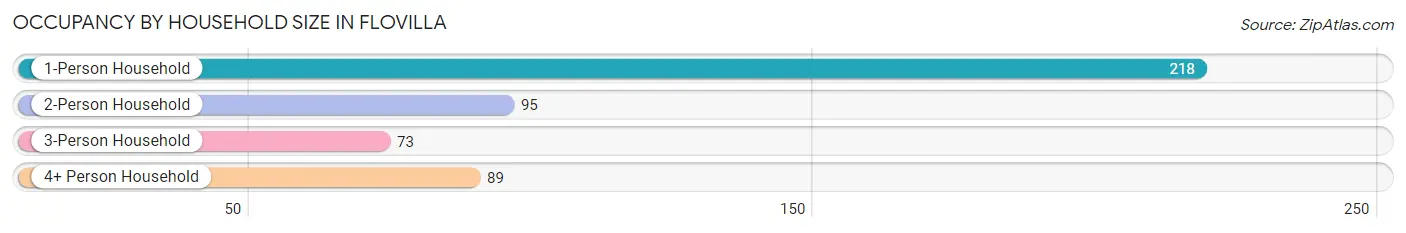
| Household Size | # Housing Units | % Housing Units |
| 1-Person Household | 218 | 45.9% |
| 2-Person Household | 95 | 20.0% |
| 3-Person Household | 73 | 15.4% |
| 4+ Person Household | 89 | 18.7% |
| Total Housing Units | 475 | 100.0% |
Occupancy by Ownership by Household Size in Flovilla
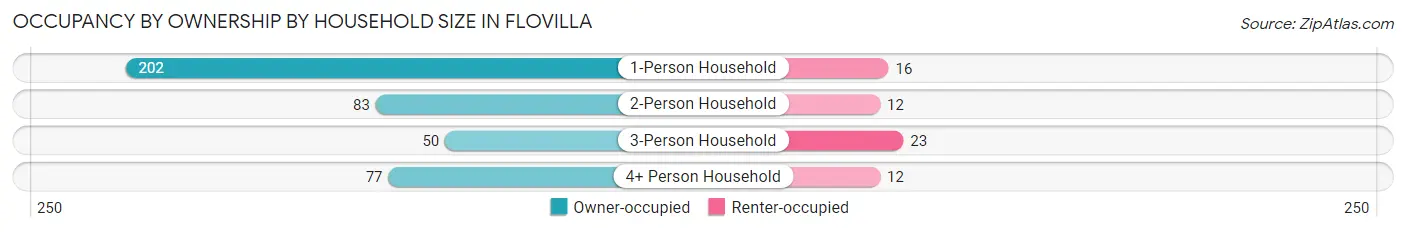
| Household Size | Owner-occupied | Renter-occupied |
| 1-Person Household | 202 (92.7%) | 16 (7.3%) |
| 2-Person Household | 83 (87.4%) | 12 (12.6%) |
| 3-Person Household | 50 (68.5%) | 23 (31.5%) |
| 4+ Person Household | 77 (86.5%) | 12 (13.5%) |
| Total Housing Units | 412 (86.7%) | 63 (13.3%) |
Occupancy by Educational Attainment in Flovilla
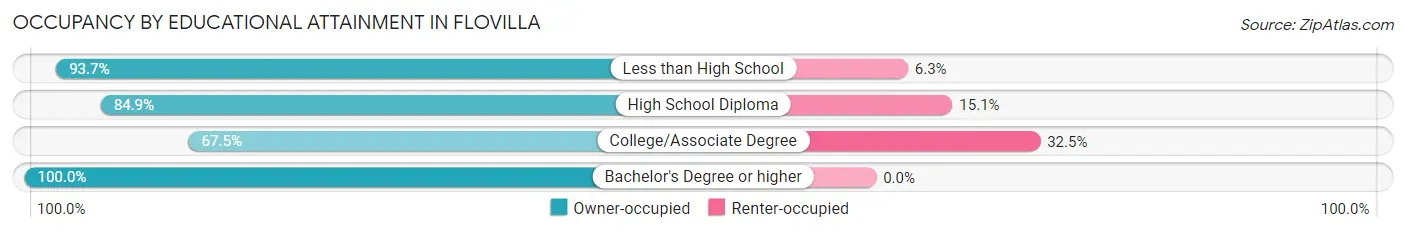
| Household Size | Owner-occupied | Renter-occupied |
| Less than High School | 224 (93.7%) | 15 (6.3%) |
| High School Diploma | 118 (84.9%) | 21 (15.1%) |
| College/Associate Degree | 56 (67.5%) | 27 (32.5%) |
| Bachelor's Degree or higher | 14 (100.0%) | 0 (0.0%) |
Occupancy by Age of Householder in Flovilla
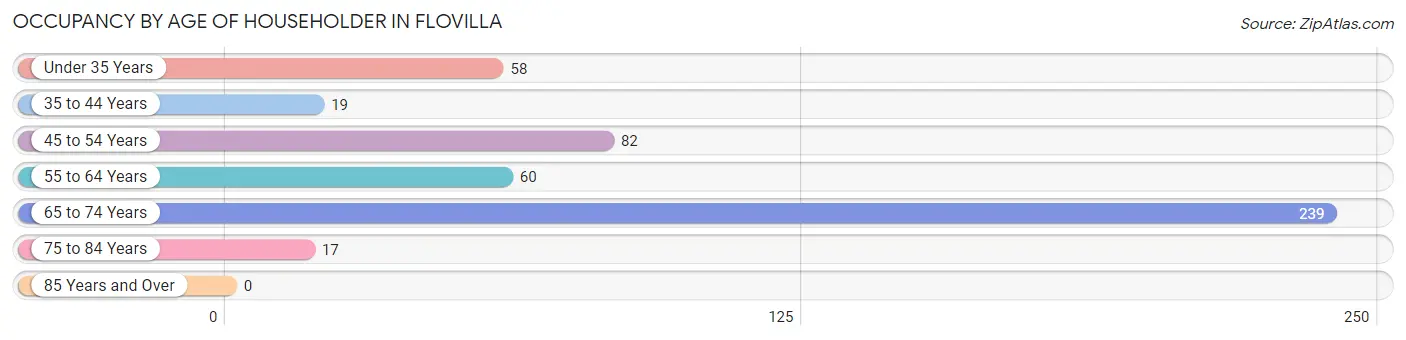
| Age Bracket | # Households | % Households |
| Under 35 Years | 58 | 12.2% |
| 35 to 44 Years | 19 | 4.0% |
| 45 to 54 Years | 82 | 17.3% |
| 55 to 64 Years | 60 | 12.6% |
| 65 to 74 Years | 239 | 50.3% |
| 75 to 84 Years | 17 | 3.6% |
| 85 Years and Over | 0 | 0.0% |
| Total | 475 | 100.0% |
Housing Finances in Flovilla
Median Income by Occupancy in Flovilla
| Occupancy Type | # Households | Median Income |
| Owner-Occupied | 412 (86.7%) | $0 |
| Renter-Occupied | 63 (13.3%) | $0 |
| Average | 475 (100.0%) | $0 |
Occupancy by Householder Income Bracket in Flovilla
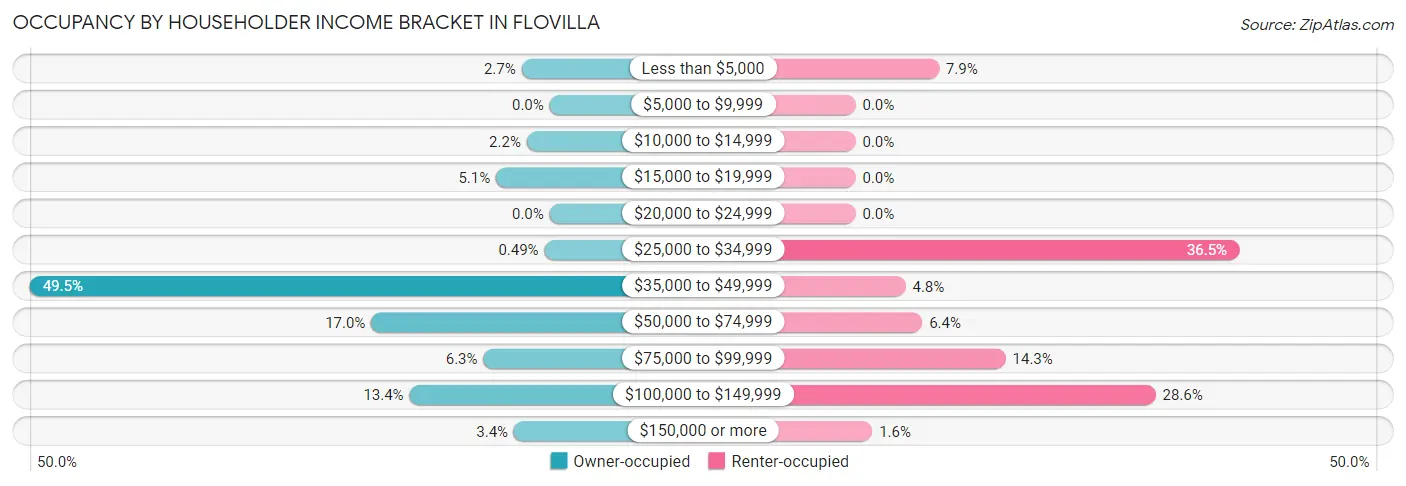
| Income Bracket | Owner-occupied | Renter-occupied |
| Less than $5,000 | 11 (2.7%) | 5 (7.9%) |
| $5,000 to $9,999 | 0 (0.0%) | 0 (0.0%) |
| $10,000 to $14,999 | 9 (2.2%) | 0 (0.0%) |
| $15,000 to $19,999 | 21 (5.1%) | 0 (0.0%) |
| $20,000 to $24,999 | 0 (0.0%) | 0 (0.0%) |
| $25,000 to $34,999 | 2 (0.5%) | 23 (36.5%) |
| $35,000 to $49,999 | 204 (49.5%) | 3 (4.8%) |
| $50,000 to $74,999 | 70 (17.0%) | 4 (6.4%) |
| $75,000 to $99,999 | 26 (6.3%) | 9 (14.3%) |
| $100,000 to $149,999 | 55 (13.4%) | 18 (28.6%) |
| $150,000 or more | 14 (3.4%) | 1 (1.6%) |
| Total | 412 (100.0%) | 63 (100.0%) |
Monthly Housing Cost Tiers in Flovilla
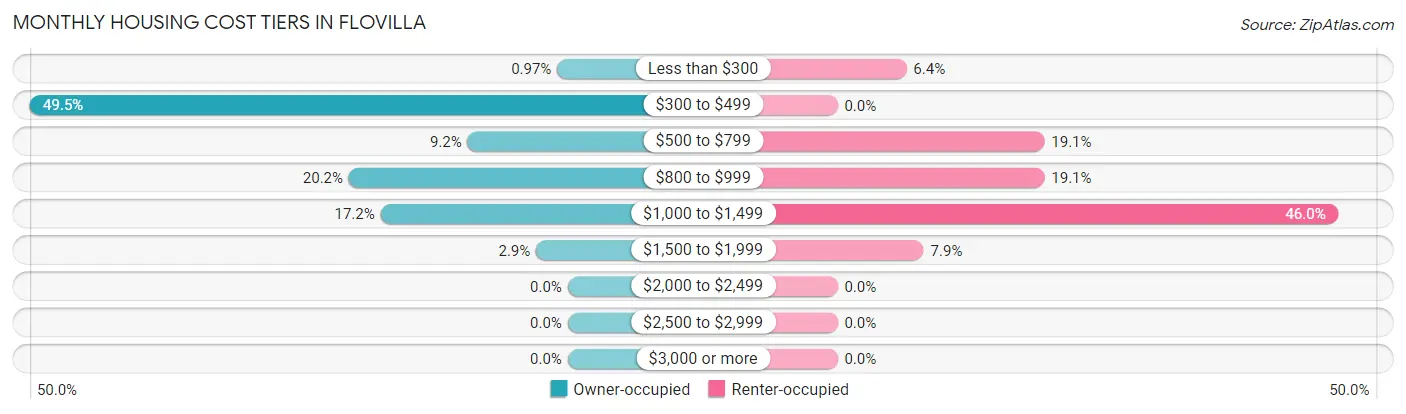
| Monthly Cost | Owner-occupied | Renter-occupied |
| Less than $300 | 4 (1.0%) | 4 (6.4%) |
| $300 to $499 | 204 (49.5%) | 0 (0.0%) |
| $500 to $799 | 38 (9.2%) | 12 (19.1%) |
| $800 to $999 | 83 (20.2%) | 12 (19.1%) |
| $1,000 to $1,499 | 71 (17.2%) | 29 (46.0%) |
| $1,500 to $1,999 | 12 (2.9%) | 5 (7.9%) |
| $2,000 to $2,499 | 0 (0.0%) | 0 (0.0%) |
| $2,500 to $2,999 | 0 (0.0%) | 0 (0.0%) |
| $3,000 or more | 0 (0.0%) | 0 (0.0%) |
| Total | 412 (100.0%) | 63 (100.0%) |
Physical Housing Characteristics in Flovilla
Housing Structures in Flovilla
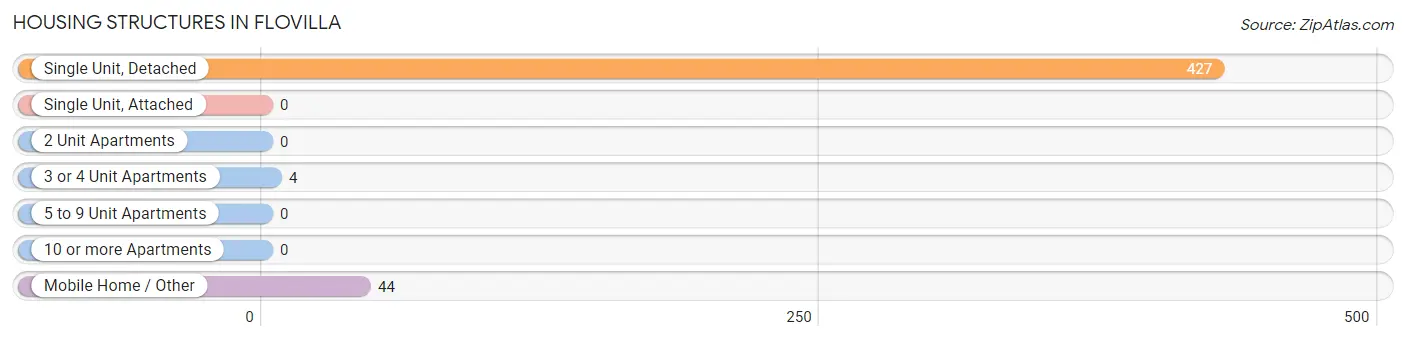
| Structure Type | # Housing Units | % Housing Units |
| Single Unit, Detached | 427 | 89.9% |
| Single Unit, Attached | 0 | 0.0% |
| 2 Unit Apartments | 0 | 0.0% |
| 3 or 4 Unit Apartments | 4 | 0.8% |
| 5 to 9 Unit Apartments | 0 | 0.0% |
| 10 or more Apartments | 0 | 0.0% |
| Mobile Home / Other | 44 | 9.3% |
| Total | 475 | 100.0% |
Housing Structures by Occupancy in Flovilla
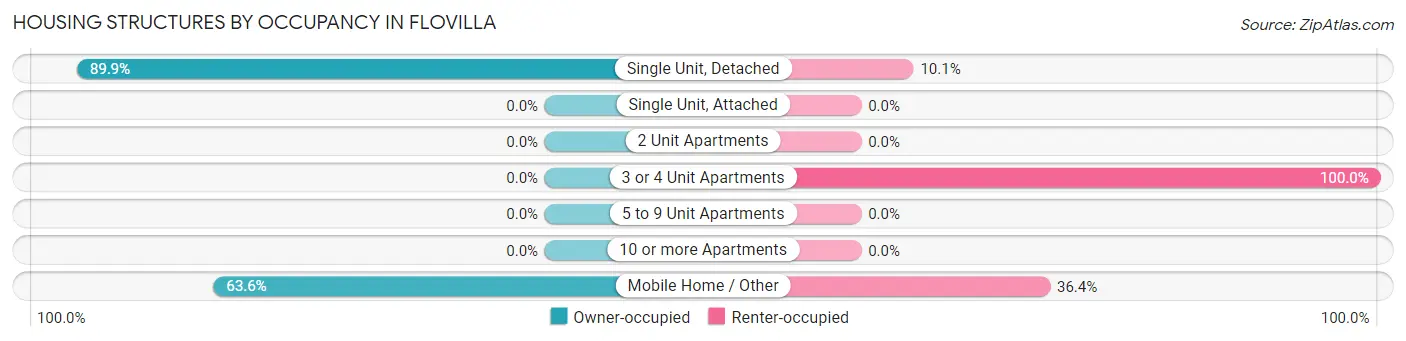
| Structure Type | Owner-occupied | Renter-occupied |
| Single Unit, Detached | 384 (89.9%) | 43 (10.1%) |
| Single Unit, Attached | 0 (0.0%) | 0 (0.0%) |
| 2 Unit Apartments | 0 (0.0%) | 0 (0.0%) |
| 3 or 4 Unit Apartments | 0 (0.0%) | 4 (100.0%) |
| 5 to 9 Unit Apartments | 0 (0.0%) | 0 (0.0%) |
| 10 or more Apartments | 0 (0.0%) | 0 (0.0%) |
| Mobile Home / Other | 28 (63.6%) | 16 (36.4%) |
| Total | 412 (86.7%) | 63 (13.3%) |
Housing Structures by Number of Rooms in Flovilla
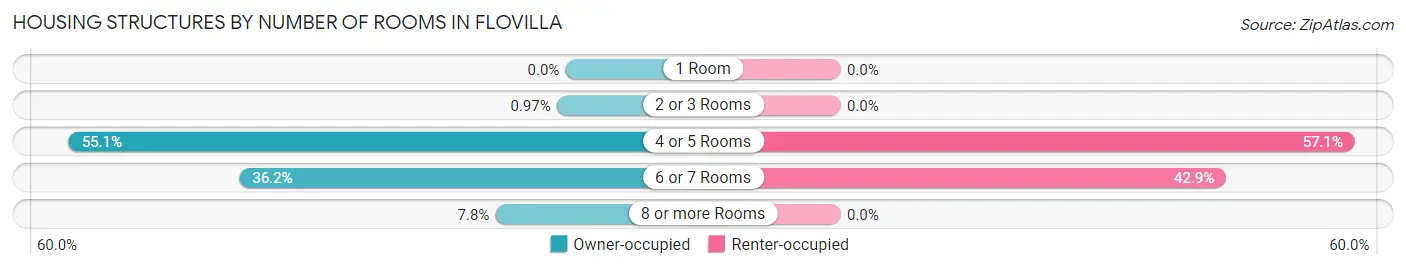
| Number of Rooms | Owner-occupied | Renter-occupied |
| 1 Room | 0 (0.0%) | 0 (0.0%) |
| 2 or 3 Rooms | 4 (1.0%) | 0 (0.0%) |
| 4 or 5 Rooms | 227 (55.1%) | 36 (57.1%) |
| 6 or 7 Rooms | 149 (36.2%) | 27 (42.9%) |
| 8 or more Rooms | 32 (7.8%) | 0 (0.0%) |
| Total | 412 (100.0%) | 63 (100.0%) |
Housing Structure by Heating Type in Flovilla
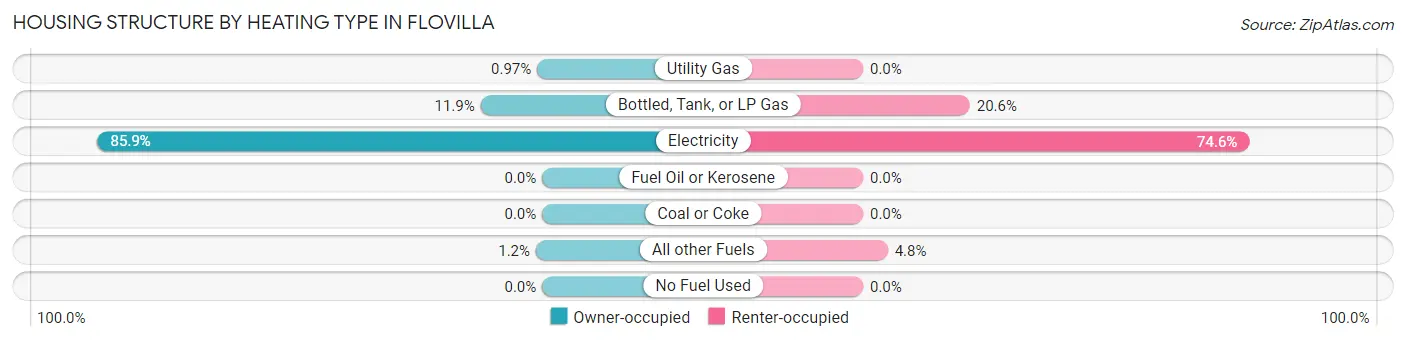
| Heating Type | Owner-occupied | Renter-occupied |
| Utility Gas | 4 (1.0%) | 0 (0.0%) |
| Bottled, Tank, or LP Gas | 49 (11.9%) | 13 (20.6%) |
| Electricity | 354 (85.9%) | 47 (74.6%) |
| Fuel Oil or Kerosene | 0 (0.0%) | 0 (0.0%) |
| Coal or Coke | 0 (0.0%) | 0 (0.0%) |
| All other Fuels | 5 (1.2%) | 3 (4.8%) |
| No Fuel Used | 0 (0.0%) | 0 (0.0%) |
| Total | 412 (100.0%) | 63 (100.0%) |
Household Vehicle Usage in Flovilla
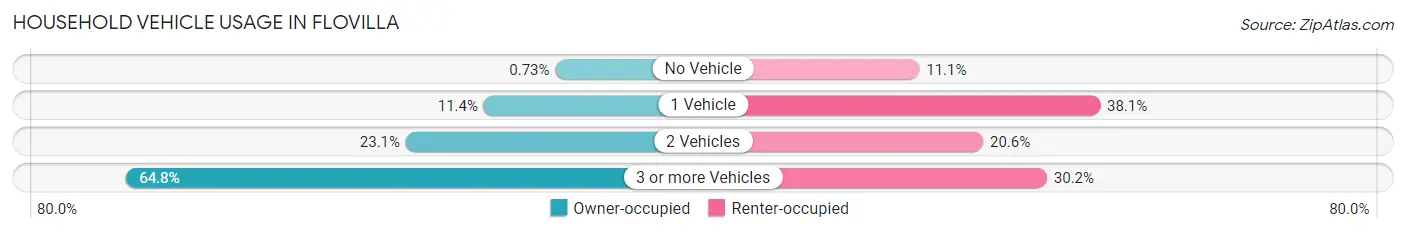
| Vehicles per Household | Owner-occupied | Renter-occupied |
| No Vehicle | 3 (0.7%) | 7 (11.1%) |
| 1 Vehicle | 47 (11.4%) | 24 (38.1%) |
| 2 Vehicles | 95 (23.1%) | 13 (20.6%) |
| 3 or more Vehicles | 267 (64.8%) | 19 (30.2%) |
| Total | 412 (100.0%) | 63 (100.0%) |
Real Estate & Mortgages in Flovilla
Real Estate and Mortgage Overview in Flovilla
| Characteristic | Without Mortgage | With Mortgage |
| Housing Units | 281 | 131 |
| Median Property Value | $211,400 | $140,400 |
| Median Household Income | $36,757 | $4 |
| Monthly Housing Costs | $388 | $0 |
| Real Estate Taxes | $1,679 | $4 |
Property Value by Mortgage Status in Flovilla
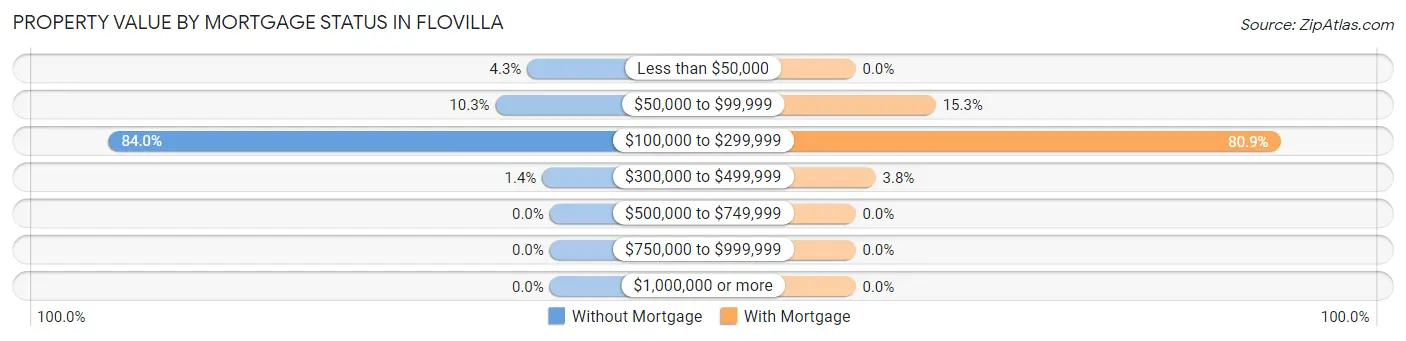
| Property Value | Without Mortgage | With Mortgage |
| Less than $50,000 | 12 (4.3%) | 0 (0.0%) |
| $50,000 to $99,999 | 29 (10.3%) | 20 (15.3%) |
| $100,000 to $299,999 | 236 (84.0%) | 106 (80.9%) |
| $300,000 to $499,999 | 4 (1.4%) | 5 (3.8%) |
| $500,000 to $749,999 | 0 (0.0%) | 0 (0.0%) |
| $750,000 to $999,999 | 0 (0.0%) | 0 (0.0%) |
| $1,000,000 or more | 0 (0.0%) | 0 (0.0%) |
| Total | 281 (100.0%) | 131 (100.0%) |
Household Income by Mortgage Status in Flovilla
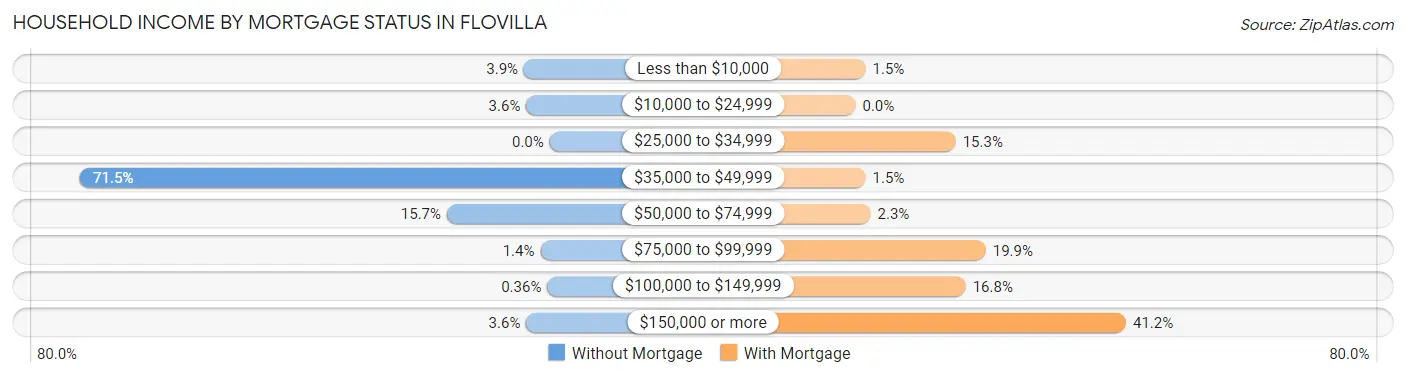
| Household Income | Without Mortgage | With Mortgage |
| Less than $10,000 | 11 (3.9%) | 2 (1.5%) |
| $10,000 to $24,999 | 10 (3.6%) | 0 (0.0%) |
| $25,000 to $34,999 | 0 (0.0%) | 20 (15.3%) |
| $35,000 to $49,999 | 201 (71.5%) | 2 (1.5%) |
| $50,000 to $74,999 | 44 (15.7%) | 3 (2.3%) |
| $75,000 to $99,999 | 4 (1.4%) | 26 (19.9%) |
| $100,000 to $149,999 | 1 (0.4%) | 22 (16.8%) |
| $150,000 or more | 10 (3.6%) | 54 (41.2%) |
| Total | 281 (100.0%) | 131 (100.0%) |
Property Value to Household Income Ratio in Flovilla
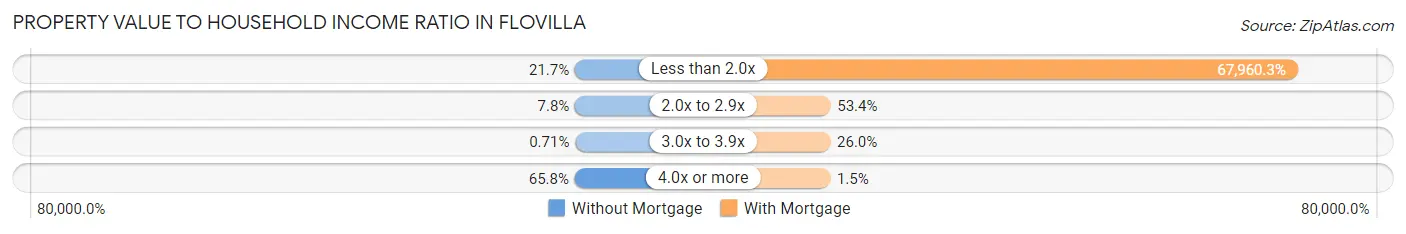
| Value-to-Income Ratio | Without Mortgage | With Mortgage |
| Less than 2.0x | 61 (21.7%) | 89,028 (67,960.3%) |
| 2.0x to 2.9x | 22 (7.8%) | 70 (53.4%) |
| 3.0x to 3.9x | 2 (0.7%) | 34 (26.0%) |
| 4.0x or more | 185 (65.8%) | 2 (1.5%) |
| Total | 281 (100.0%) | 131 (100.0%) |
Real Estate Taxes by Mortgage Status in Flovilla
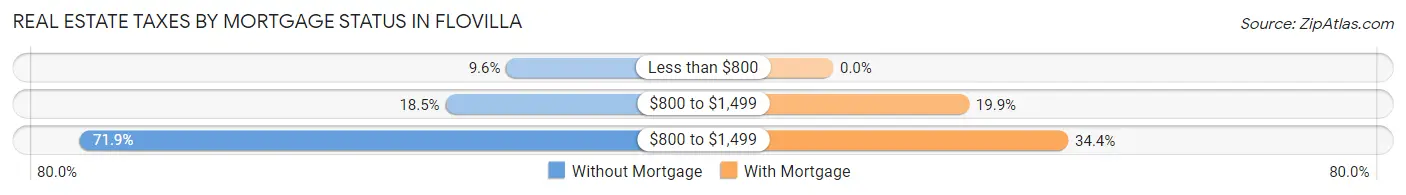
| Property Taxes | Without Mortgage | With Mortgage |
| Less than $800 | 27 (9.6%) | 0 (0.0%) |
| $800 to $1,499 | 52 (18.5%) | 26 (19.9%) |
| $800 to $1,499 | 202 (71.9%) | 45 (34.4%) |
| Total | 281 (100.0%) | 131 (100.0%) |
Health & Disability in Flovilla
Health Insurance Coverage by Age in Flovilla
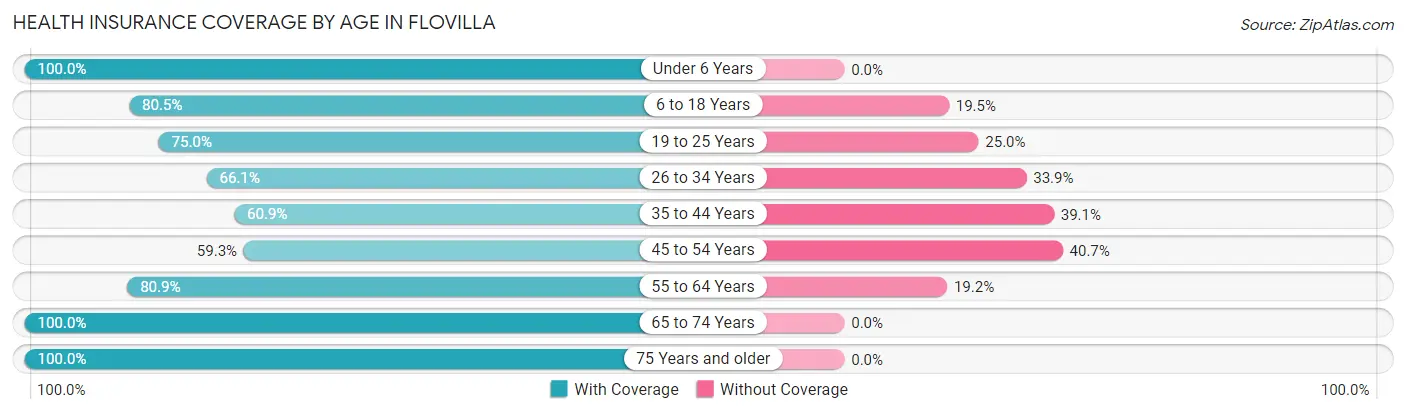
| Age Bracket | With Coverage | Without Coverage |
| Under 6 Years | 29 (100.0%) | 0 (0.0%) |
| 6 to 18 Years | 124 (80.5%) | 30 (19.5%) |
| 19 to 25 Years | 150 (75.0%) | 50 (25.0%) |
| 26 to 34 Years | 72 (66.1%) | 37 (33.9%) |
| 35 to 44 Years | 39 (60.9%) | 25 (39.1%) |
| 45 to 54 Years | 83 (59.3%) | 57 (40.7%) |
| 55 to 64 Years | 114 (80.8%) | 27 (19.2%) |
| 65 to 74 Years | 291 (100.0%) | 0 (0.0%) |
| 75 Years and older | 34 (100.0%) | 0 (0.0%) |
| Total | 936 (80.5%) | 226 (19.5%) |
Health Insurance Coverage by Citizenship Status in Flovilla
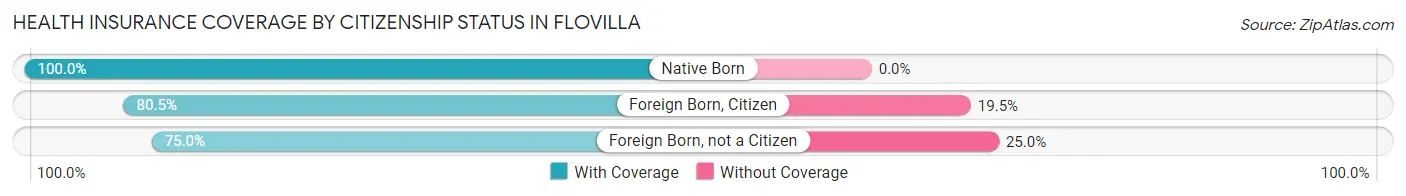
| Citizenship Status | With Coverage | Without Coverage |
| Native Born | 29 (100.0%) | 0 (0.0%) |
| Foreign Born, Citizen | 124 (80.5%) | 30 (19.5%) |
| Foreign Born, not a Citizen | 150 (75.0%) | 50 (25.0%) |
Health Insurance Coverage by Household Income in Flovilla
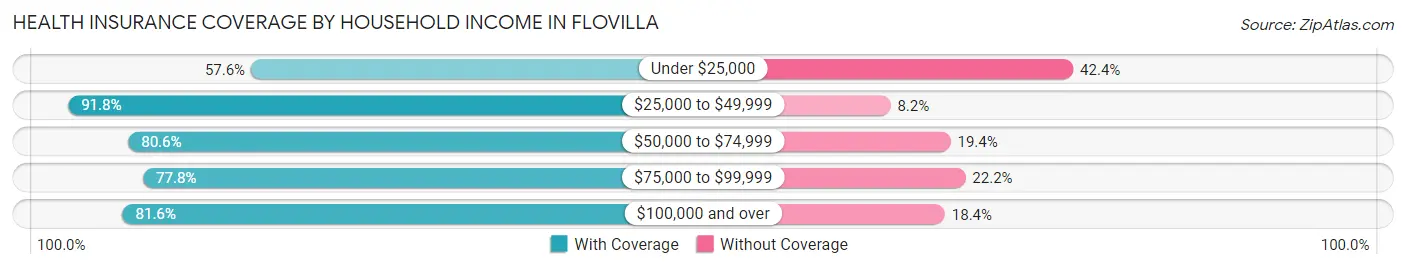
| Household Income | With Coverage | Without Coverage |
| Under $25,000 | 91 (57.6%) | 67 (42.4%) |
| $25,000 to $49,999 | 303 (91.8%) | 27 (8.2%) |
| $50,000 to $74,999 | 145 (80.6%) | 35 (19.4%) |
| $75,000 to $99,999 | 126 (77.8%) | 36 (22.2%) |
| $100,000 and over | 271 (81.6%) | 61 (18.4%) |
Public vs Private Health Insurance Coverage by Age in Flovilla
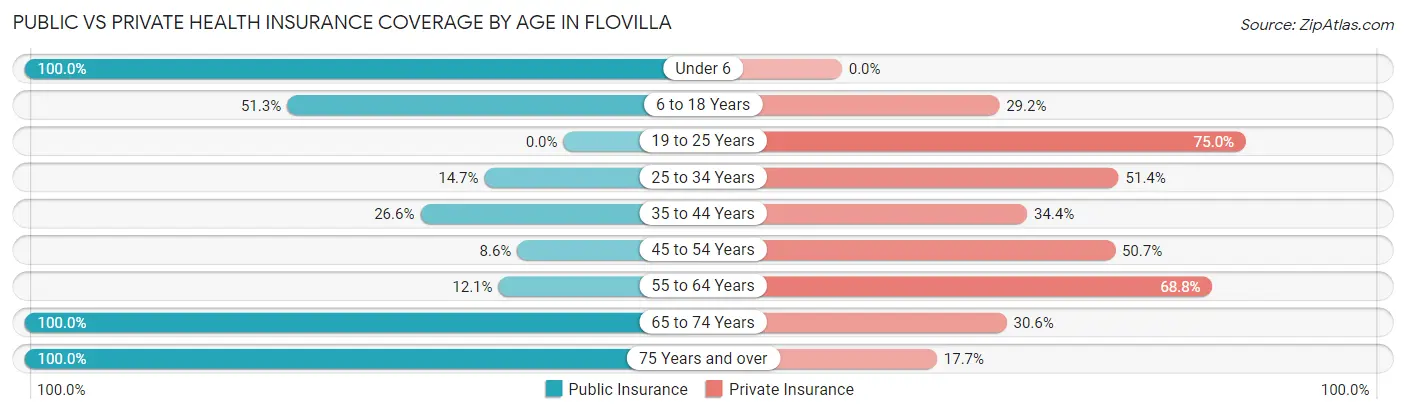
| Age Bracket | Public Insurance | Private Insurance |
| Under 6 | 29 (100.0%) | 0 (0.0%) |
| 6 to 18 Years | 79 (51.3%) | 45 (29.2%) |
| 19 to 25 Years | 0 (0.0%) | 150 (75.0%) |
| 25 to 34 Years | 16 (14.7%) | 56 (51.4%) |
| 35 to 44 Years | 17 (26.6%) | 22 (34.4%) |
| 45 to 54 Years | 12 (8.6%) | 71 (50.7%) |
| 55 to 64 Years | 17 (12.1%) | 97 (68.8%) |
| 65 to 74 Years | 291 (100.0%) | 89 (30.6%) |
| 75 Years and over | 34 (100.0%) | 6 (17.6%) |
| Total | 495 (42.6%) | 536 (46.1%) |
Disability Status by Sex by Age in Flovilla
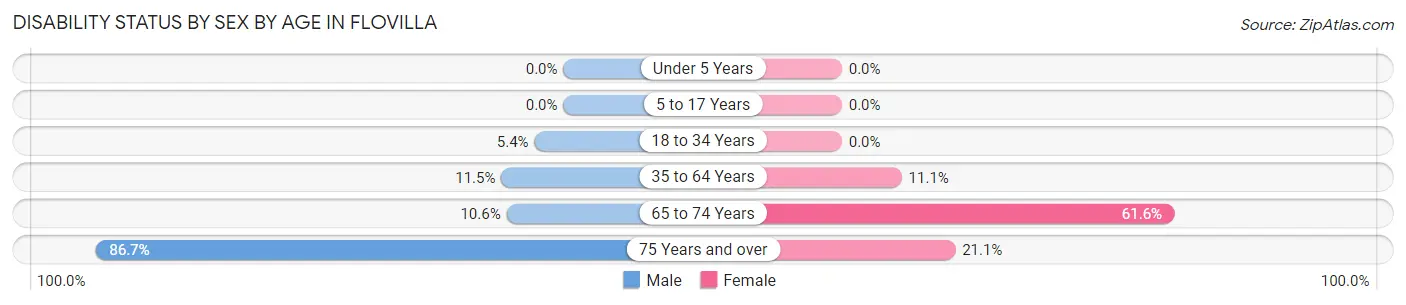
| Age Bracket | Male | Female |
| Under 5 Years | 0 (0.0%) | 0 (0.0%) |
| 5 to 17 Years | 0 (0.0%) | 0 (0.0%) |
| 18 to 34 Years | 11 (5.4%) | 0 (0.0%) |
| 35 to 64 Years | 19 (11.5%) | 20 (11.1%) |
| 65 to 74 Years | 23 (10.5%) | 45 (61.6%) |
| 75 Years and over | 13 (86.7%) | 4 (21.0%) |
Disability Class by Sex by Age in Flovilla
Disability Class: Hearing Difficulty
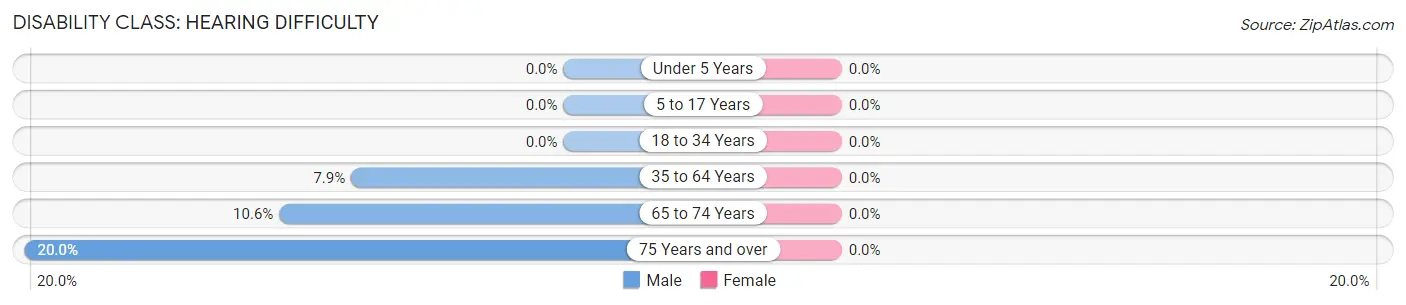
| Age Bracket | Male | Female |
| Under 5 Years | 0 (0.0%) | 0 (0.0%) |
| 5 to 17 Years | 0 (0.0%) | 0 (0.0%) |
| 18 to 34 Years | 0 (0.0%) | 0 (0.0%) |
| 35 to 64 Years | 13 (7.9%) | 0 (0.0%) |
| 65 to 74 Years | 23 (10.5%) | 0 (0.0%) |
| 75 Years and over | 3 (20.0%) | 0 (0.0%) |
Disability Class: Vision Difficulty
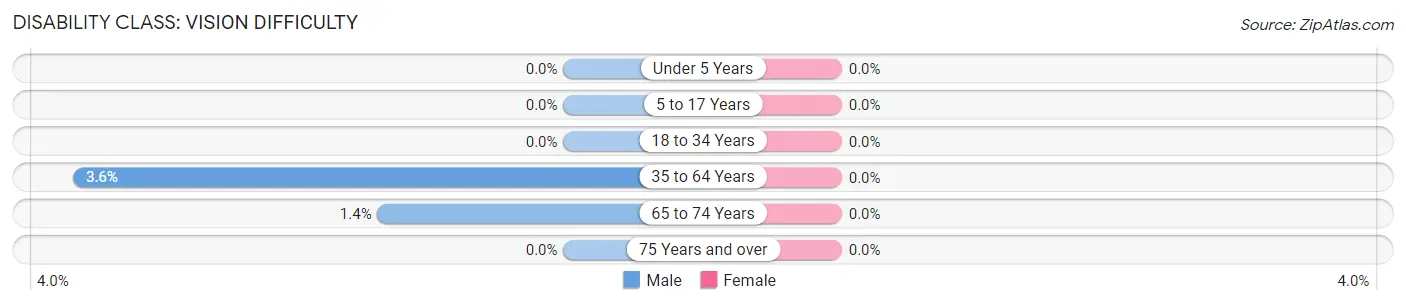
| Age Bracket | Male | Female |
| Under 5 Years | 0 (0.0%) | 0 (0.0%) |
| 5 to 17 Years | 0 (0.0%) | 0 (0.0%) |
| 18 to 34 Years | 0 (0.0%) | 0 (0.0%) |
| 35 to 64 Years | 6 (3.6%) | 0 (0.0%) |
| 65 to 74 Years | 3 (1.4%) | 0 (0.0%) |
| 75 Years and over | 0 (0.0%) | 0 (0.0%) |
Disability Class: Cognitive Difficulty
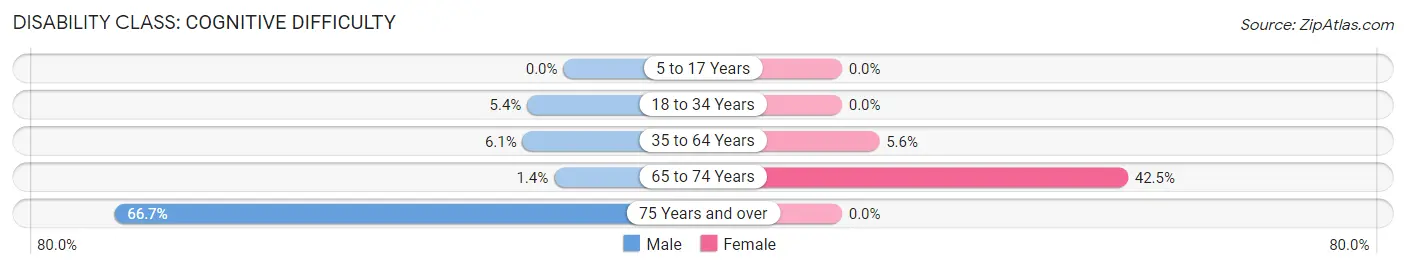
| Age Bracket | Male | Female |
| 5 to 17 Years | 0 (0.0%) | 0 (0.0%) |
| 18 to 34 Years | 11 (5.4%) | 0 (0.0%) |
| 35 to 64 Years | 10 (6.1%) | 10 (5.6%) |
| 65 to 74 Years | 3 (1.4%) | 31 (42.5%) |
| 75 Years and over | 10 (66.7%) | 0 (0.0%) |
Disability Class: Ambulatory Difficulty
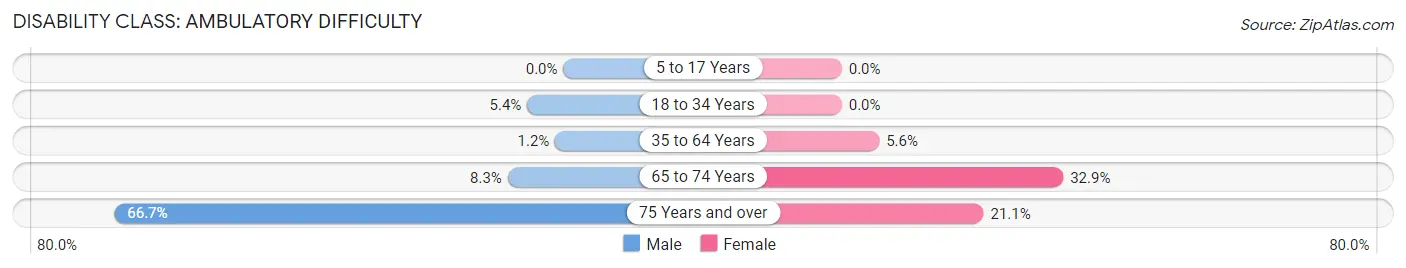
| Age Bracket | Male | Female |
| 5 to 17 Years | 0 (0.0%) | 0 (0.0%) |
| 18 to 34 Years | 11 (5.4%) | 0 (0.0%) |
| 35 to 64 Years | 2 (1.2%) | 10 (5.6%) |
| 65 to 74 Years | 18 (8.3%) | 24 (32.9%) |
| 75 Years and over | 10 (66.7%) | 4 (21.0%) |
Disability Class: Self-Care Difficulty
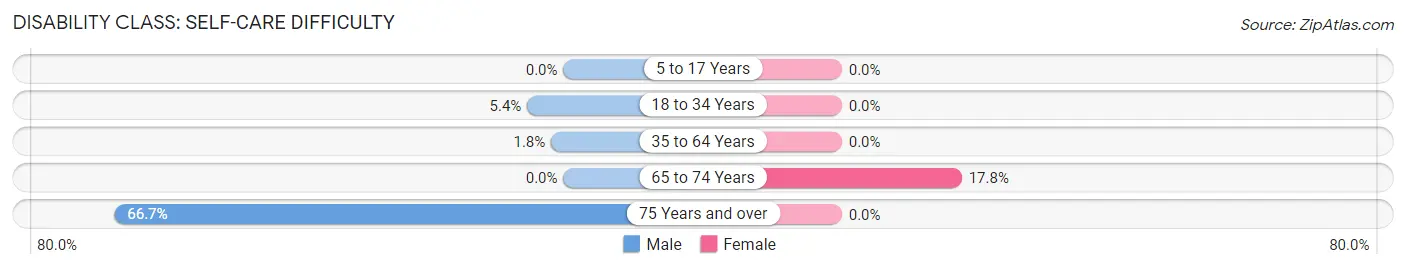
| Age Bracket | Male | Female |
| 5 to 17 Years | 0 (0.0%) | 0 (0.0%) |
| 18 to 34 Years | 11 (5.4%) | 0 (0.0%) |
| 35 to 64 Years | 3 (1.8%) | 0 (0.0%) |
| 65 to 74 Years | 0 (0.0%) | 13 (17.8%) |
| 75 Years and over | 10 (66.7%) | 0 (0.0%) |
Technology Access in Flovilla
Computing Device Access in Flovilla
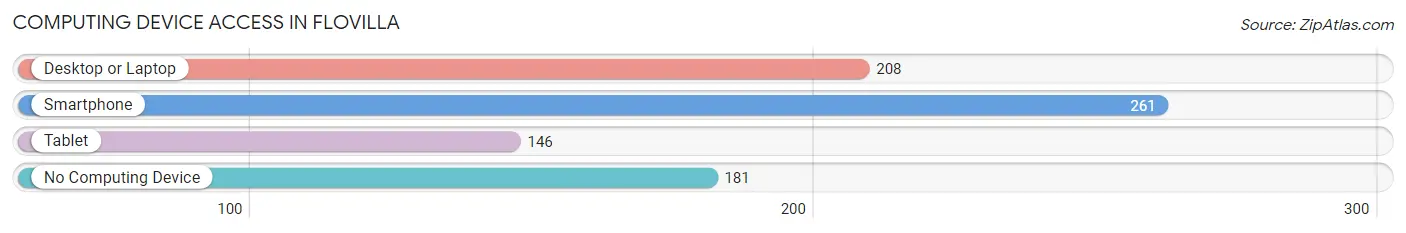
| Device Type | # Households | % Households |
| Desktop or Laptop | 208 | 43.8% |
| Smartphone | 261 | 54.9% |
| Tablet | 146 | 30.7% |
| No Computing Device | 181 | 38.1% |
| Total | 475 | 100.0% |
Internet Access in Flovilla
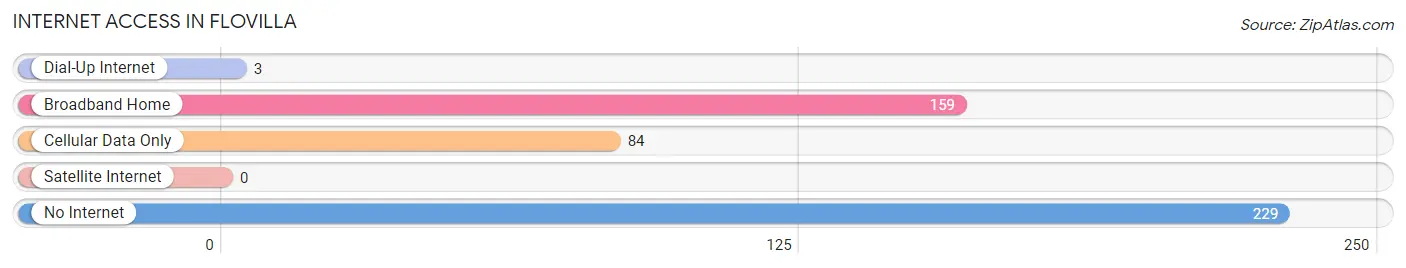
| Internet Type | # Households | % Households |
| Dial-Up Internet | 3 | 0.6% |
| Broadband Home | 159 | 33.5% |
| Cellular Data Only | 84 | 17.7% |
| Satellite Internet | 0 | 0.0% |
| No Internet | 229 | 48.2% |
| Total | 475 | 100.0% |
Flovilla Summary
Flovilla, Georgia is a small town located in Butts County, Georgia, United States. It is situated about 45 miles southeast of Atlanta and is part of the Atlanta metropolitan area. The population of Flovilla was estimated to be 1,093 in 2019.
History
Flovilla was founded in 1825 by a group of settlers from South Carolina. The town was named after the daughter of one of the settlers, Florence Villepigue. The town was incorporated in 1887 and was the county seat of Butts County until the county seat was moved to Jackson in 1906.
Geography
Flovilla is located at 33°30'N 83°59'W (33.500, -83.983). The town has a total area of 1.2 square miles, all of which is land. Flovilla is located in the Piedmont region of Georgia and is surrounded by rolling hills and forests. The town is located near the Ocmulgee River, which is a major tributary of the Altamaha River.
Economy
The economy of Flovilla is largely based on agriculture and forestry. The town is home to several farms and timber companies. The town also has a few small businesses, including a grocery store, a hardware store, and a few restaurants.
Demographics
As of the 2010 census, there were 1,093 people, 431 households, and 287 families residing in Flovilla. The population density was 908.3 people per square mile. The racial makeup of the town was 79.2% White, 17.7% African American, 0.2% Native American, 0.2% Asian, 0.1% Pacific Islander, 1.2% from other races, and 1.6% from two or more races. Hispanic or Latino of any race were 2.7% of the population.
The median income for a household in Flovilla was $35,000, and the median income for a family was $41,000. The per capita income for the town was $17,000. About 17.2% of families and 20.2% of the population were below the poverty line, including 28.3% of those under age 18 and 11.2% of those age 65 or over.
Common Questions
What is Per Capita Income in Flovilla?
Per Capita income in Flovilla is $25,802.
What is the Median Family Income in Flovilla?
Median Family Income in Flovilla is $72,128.
What is Income or Wage Gap in Flovilla?
Income or Wage Gap in Flovilla is 25.8%.
Women in Flovilla earn 74.2 cents for every dollar earned by a man.
What is Family Income Deficit in Flovilla?
Family Income Deficit in Flovilla is $19,603.
Families that are below poverty line in Flovilla earn $19,603 less on average than the poverty threshold level.
What is Inequality or Gini Index in Flovilla?
Inequality or Gini Index in Flovilla is 0.36.
What is the Total Population of Flovilla?
Total Population of Flovilla is 1,165.
What is the Total Male Population of Flovilla?
Total Male Population of Flovilla is 660.
What is the Total Female Population of Flovilla?
Total Female Population of Flovilla is 505.
What is the Ratio of Males per 100 Females in Flovilla?
There are 130.69 Males per 100 Females in Flovilla.
What is the Ratio of Females per 100 Males in Flovilla?
There are 76.52 Females per 100 Males in Flovilla.
What is the Median Population Age in Flovilla?
Median Population Age in Flovilla is 45.6 Years.
What is the Average Family Size in Flovilla
Average Family Size in Flovilla is 3.7 People.
What is the Average Household Size in Flovilla
Average Household Size in Flovilla is 2.5 People.
How Large is the Labor Force in Flovilla?
There are 494 People in the Labor Forcein in Flovilla.
What is the Percentage of People in the Labor Force in Flovilla?
47.7% of People are in the Labor Force in Flovilla.
What is the Unemployment Rate in Flovilla?
Unemployment Rate in Flovilla is 10.8%.