Zip Codes with the Highest Percentage of Population with a Degree in Visual and Performing Arts in Atlanta, GA
RELATED REPORTS & OPTIONS
Visual and Performing Arts
Atlanta
Compare Zip Codes
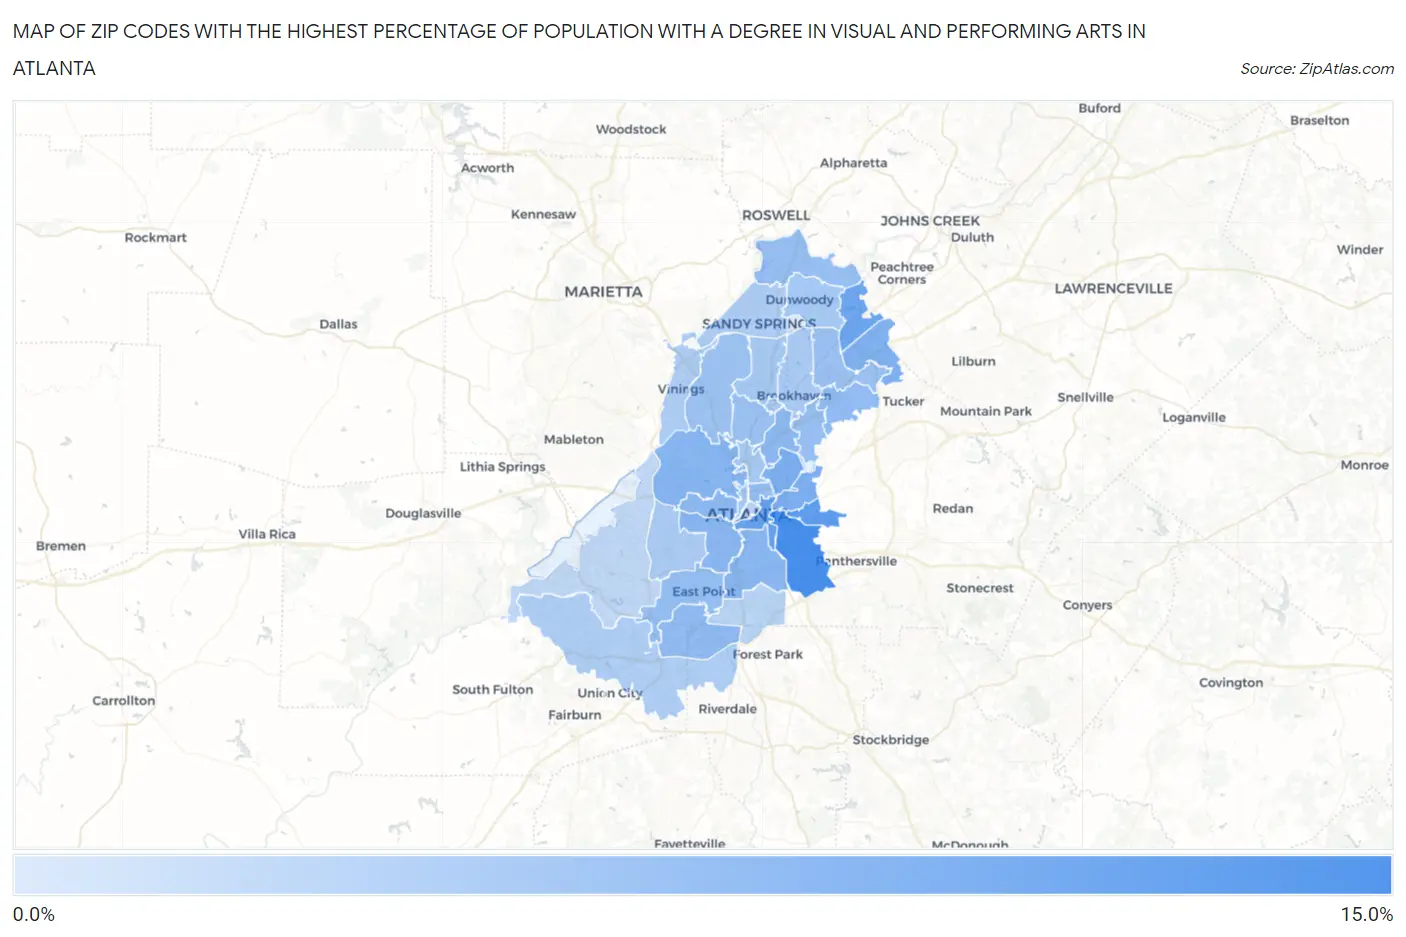
Map of Zip Codes with the Highest Percentage of Population with a Degree in Visual and Performing Arts in Atlanta
0.10%
11.6%
Zip Codes with the Highest Percentage of Population with a Degree in Visual and Performing Arts in Atlanta, GA
| Zip Code | % Graduates | vs State | vs National | |
| 1. | 30316 | 11.6% | 3.8%(+7.82)#21 | 4.3%(+7.36)#1,373 |
| 2. | 30317 | 9.7% | 3.8%(+5.89)#31 | 4.3%(+5.43)#1,950 |
| 3. | 30312 | 9.1% | 3.8%(+5.31)#37 | 4.3%(+4.85)#2,206 |
| 4. | 30360 | 8.5% | 3.8%(+4.73)#42 | 4.3%(+4.27)#2,511 |
| 5. | 30307 | 7.3% | 3.8%(+3.56)#52 | 4.3%(+3.10)#3,336 |
| 6. | 30306 | 7.2% | 3.8%(+3.41)#54 | 4.3%(+2.95)#3,461 |
| 7. | 30340 | 7.0% | 3.8%(+3.23)#58 | 4.3%(+2.77)#3,640 |
| 8. | 30318 | 6.4% | 3.8%(+2.64)#71 | 4.3%(+2.18)#4,309 |
| 9. | 30315 | 6.4% | 3.8%(+2.60)#73 | 4.3%(+2.13)#4,356 |
| 10. | 30310 | 6.4% | 3.8%(+2.57)#74 | 4.3%(+2.10)#4,396 |
| 11. | 30324 | 5.9% | 3.8%(+2.12)#88 | 4.3%(+1.66)#4,994 |
| 12. | 30314 | 5.9% | 3.8%(+2.12)#89 | 4.3%(+1.66)#4,995 |
| 13. | 30345 | 5.8% | 3.8%(+2.05)#92 | 4.3%(+1.59)#5,112 |
| 14. | 30337 | 5.7% | 3.8%(+1.94)#99 | 4.3%(+1.48)#5,288 |
| 15. | 30308 | 5.5% | 3.8%(+1.70)#106 | 4.3%(+1.24)#5,698 |
| 16. | 30344 | 5.4% | 3.8%(+1.59)#111 | 4.3%(+1.13)#5,890 |
| 17. | 30363 | 5.3% | 3.8%(+1.56)#112 | 4.3%(+1.10)#5,947 |
| 18. | 30329 | 5.3% | 3.8%(+1.54)#114 | 4.3%(+1.08)#5,986 |
| 19. | 30350 | 5.3% | 3.8%(+1.50)#118 | 4.3%(+1.04)#6,079 |
| 20. | 30305 | 5.1% | 3.8%(+1.27)#125 | 4.3%(+0.807)#6,507 |
| 21. | 30341 | 5.0% | 3.8%(+1.26)#126 | 4.3%(+0.796)#6,532 |
| 22. | 30327 | 4.8% | 3.8%(+1.01)#137 | 4.3%(+0.545)#7,084 |
| 23. | 30313 | 4.4% | 3.8%(+0.652)#155 | 4.3%(+0.191)#7,980 |
| 24. | 30309 | 4.1% | 3.8%(+0.269)#184 | 4.3%(-0.192)#9,055 |
| 25. | 30342 | 4.1% | 3.8%(+0.260)#186 | 4.3%(-0.201)#9,086 |
| 26. | 30326 | 4.0% | 3.8%(+0.232)#187 | 4.3%(-0.229)#9,184 |
| 27. | 30338 | 4.0% | 3.8%(+0.198)#190 | 4.3%(-0.263)#9,296 |
| 28. | 30319 | 3.9% | 3.8%(+0.062)#199 | 4.3%(-0.399)#9,723 |
| 29. | 30311 | 3.7% | 3.8%(-0.110)#213 | 4.3%(-0.571)#10,236 |
| 30. | 30328 | 3.5% | 3.8%(-0.256)#225 | 4.3%(-0.717)#10,762 |
| 31. | 30339 | 3.5% | 3.8%(-0.330)#231 | 4.3%(-0.791)#11,029 |
| 32. | 30349 | 3.3% | 3.8%(-0.499)#243 | 4.3%(-0.960)#11,642 |
| 33. | 30303 | 3.1% | 3.8%(-0.683)#259 | 4.3%(-1.14)#12,322 |
| 34. | 30354 | 2.7% | 3.8%(-1.10)#300 | 4.3%(-1.56)#13,950 |
| 35. | 30331 | 2.1% | 3.8%(-1.66)#346 | 4.3%(-2.12)#15,943 |
| 36. | 30346 | 0.10% | 3.8%(-3.69)#494 | 4.3%(-4.15)#21,237 |
1
Common Questions
What are the Top 10 Zip Codes with the Highest Percentage of Population with a Degree in Visual and Performing Arts in Atlanta, GA?
Top 10 Zip Codes with the Highest Percentage of Population with a Degree in Visual and Performing Arts in Atlanta, GA are:
What zip code has the Highest Percentage of Population with a Degree in Visual and Performing Arts in Atlanta, GA?
30316 has the Highest Percentage of Population with a Degree in Visual and Performing Arts in Atlanta, GA with 11.6%.
What is the Percentage of Population with a Degree in Visual and Performing Arts in Atlanta, GA?
Percentage of Population with a Degree in Visual and Performing Arts in Atlanta is 6.1%.
What is the Percentage of Population with a Degree in Visual and Performing Arts in Georgia?
Percentage of Population with a Degree in Visual and Performing Arts in Georgia is 3.8%.
What is the Percentage of Population with a Degree in Visual and Performing Arts in the United States?
Percentage of Population with a Degree in Visual and Performing Arts in the United States is 4.3%.