Zip Codes with the Highest Percentage of Population with a Degree in Visual and Performing Arts in Americus, GA
RELATED REPORTS & OPTIONS
Visual and Performing Arts
Americus
Compare Zip Codes
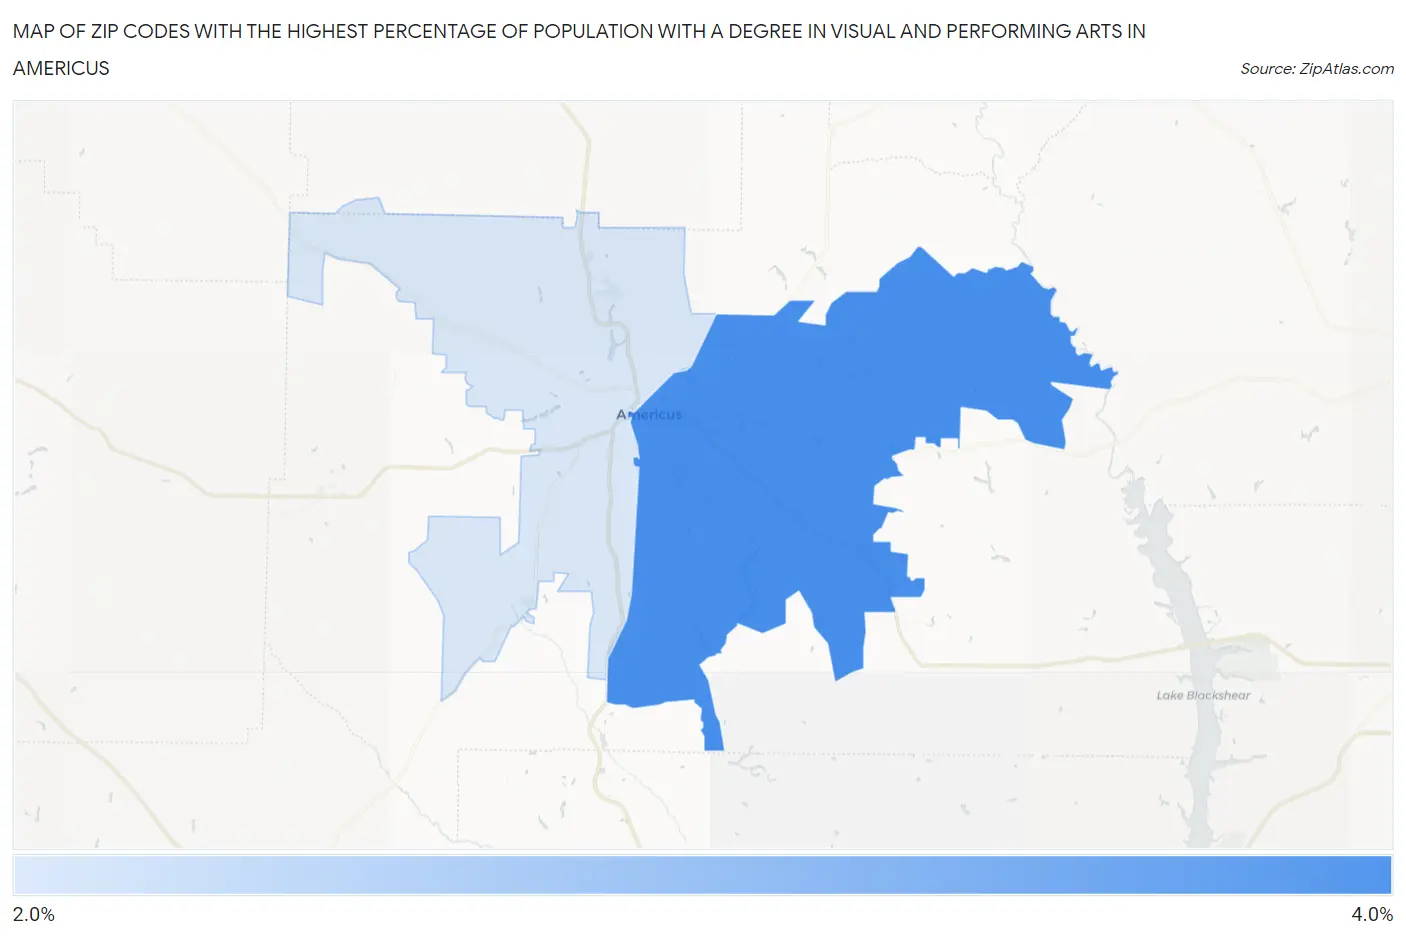
Map of Zip Codes with the Highest Percentage of Population with a Degree in Visual and Performing Arts in Americus
2.7%
3.1%
Zip Codes with the Highest Percentage of Population with a Degree in Visual and Performing Arts in Americus, GA
| Zip Code | % Graduates | vs State | vs National | |
| 1. | 31709 | 3.1% | 3.8%(-0.727)#265 | 4.3%(-1.19)#12,481 |
| 2. | 31719 | 2.7% | 3.8%(-1.09)#298 | 4.3%(-1.55)#13,889 |
1
Common Questions
What are the Top Zip Codes with the Highest Percentage of Population with a Degree in Visual and Performing Arts in Americus, GA?
Top Zip Codes with the Highest Percentage of Population with a Degree in Visual and Performing Arts in Americus, GA are:
What zip code has the Highest Percentage of Population with a Degree in Visual and Performing Arts in Americus, GA?
31709 has the Highest Percentage of Population with a Degree in Visual and Performing Arts in Americus, GA with 3.1%.
What is the Percentage of Population with a Degree in Visual and Performing Arts in Americus, GA?
Percentage of Population with a Degree in Visual and Performing Arts in Americus is 2.2%.
What is the Percentage of Population with a Degree in Visual and Performing Arts in Georgia?
Percentage of Population with a Degree in Visual and Performing Arts in Georgia is 3.8%.
What is the Percentage of Population with a Degree in Visual and Performing Arts in the United States?
Percentage of Population with a Degree in Visual and Performing Arts in the United States is 4.3%.