Nashville, GA Map & Demographics
Nashville Map
Nashville Overview
$19,216
PER CAPITA INCOME
$53,391
AVG FAMILY INCOME
$45,500
AVG HOUSEHOLD INCOME
15.7%
WAGE / INCOME GAP [ % ]
84.3¢/ $1
WAGE / INCOME GAP [ $ ]
$8,443
FAMILY INCOME DEFICIT
0.41
INEQUALITY / GINI INDEX
4,907
TOTAL POPULATION
2,189
MALE POPULATION
2,718
FEMALE POPULATION
80.54
MALES / 100 FEMALES
124.17
FEMALES / 100 MALES
36.4
MEDIAN AGE
3.3
AVG FAMILY SIZE
2.6
AVG HOUSEHOLD SIZE
1,914
LABOR FORCE [ PEOPLE ]
50.6%
PERCENT IN LABOR FORCE
7.2%
UNEMPLOYMENT RATE
Nashville Zip Codes
Nashville Area Codes
Income in Nashville
Income Overview in Nashville
Per Capita Income in Nashville is $19,216, while median incomes of families and households are $53,391 and $45,500 respectively.
| Characteristic | Number | Measure |
| Per Capita Income | 4,907 | $19,216 |
| Median Family Income | 1,119 | $53,391 |
| Mean Family Income | 1,119 | $58,788 |
| Median Household Income | 1,808 | $45,500 |
| Mean Household Income | 1,808 | $50,616 |
| Income Deficit | 1,119 | $8,443 |
| Wage / Income Gap (%) | 4,907 | 15.74% |
| Wage / Income Gap ($) | 4,907 | 84.26¢ per $1 |
| Gini / Inequality Index | 4,907 | 0.41 |
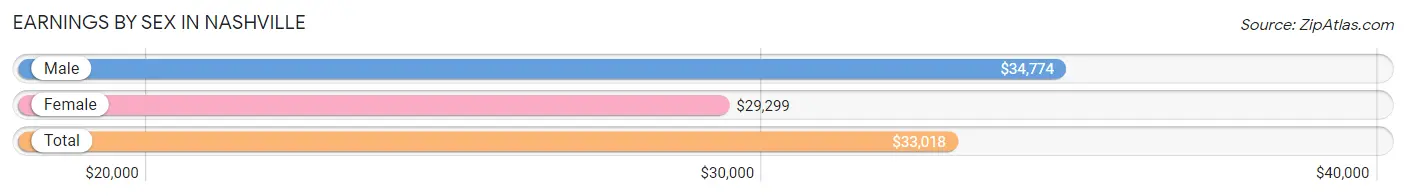
Earnings by Sex in Nashville
Average Earnings in Nashville are $33,018, $34,774 for men and $29,299 for women, a difference of 15.7%.
| Sex | Number | Average Earnings |
| Male | 975 (50.4%) | $34,774 |
| Female | 961 (49.6%) | $29,299 |
| Total | 1,936 (100.0%) | $33,018 |
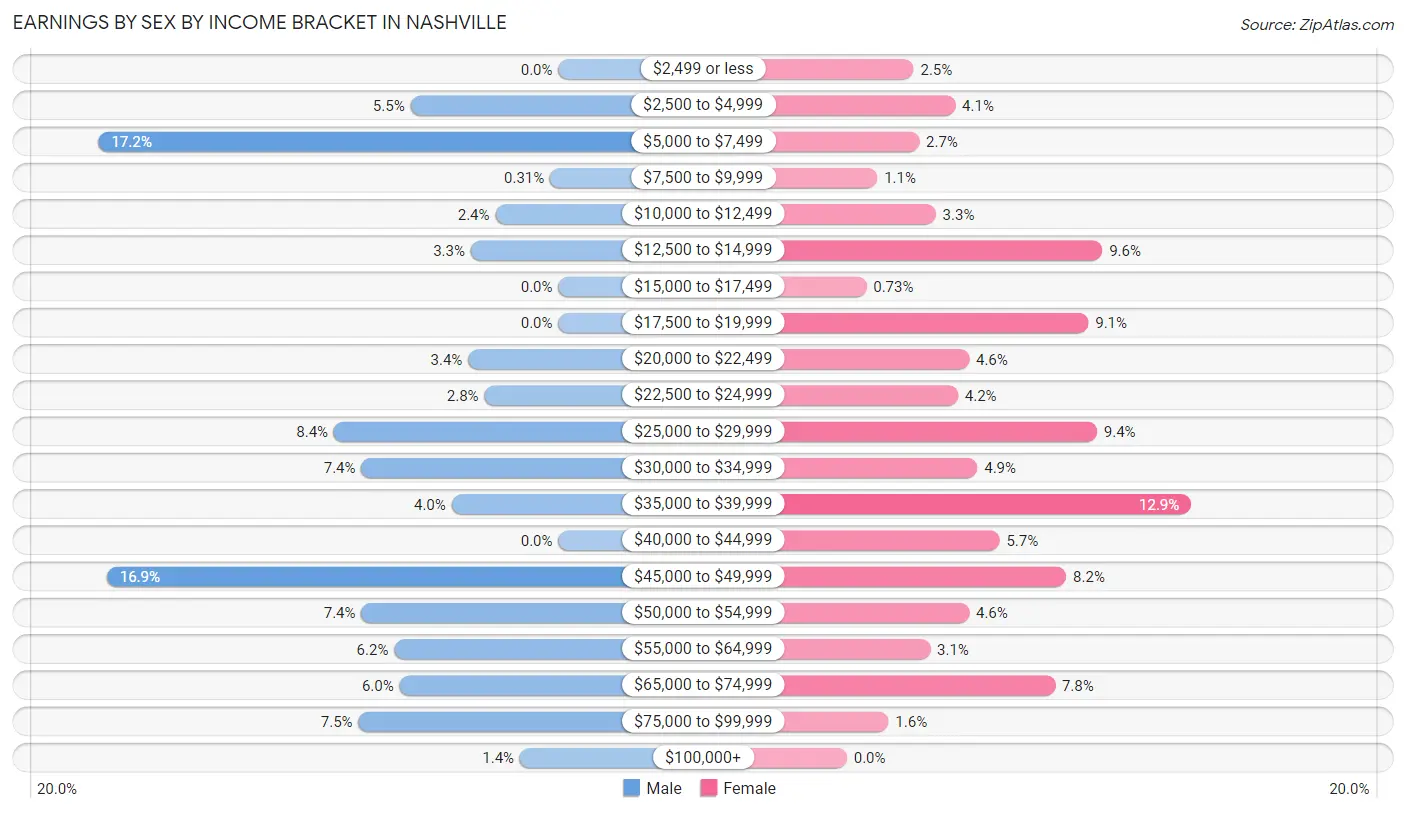
Earnings by Sex by Income Bracket in Nashville
The most common earnings brackets in Nashville are $5,000 to $7,499 for men (168 | 17.2%) and $35,000 to $39,999 for women (124 | 12.9%).
| Income | Male | Female |
| $2,499 or less | 0 (0.0%) | 24 (2.5%) |
| $2,500 to $4,999 | 54 (5.5%) | 39 (4.1%) |
| $5,000 to $7,499 | 168 (17.2%) | 26 (2.7%) |
| $7,500 to $9,999 | 3 (0.3%) | 11 (1.1%) |
| $10,000 to $12,499 | 23 (2.4%) | 32 (3.3%) |
| $12,500 to $14,999 | 32 (3.3%) | 92 (9.6%) |
| $15,000 to $17,499 | 0 (0.0%) | 7 (0.7%) |
| $17,500 to $19,999 | 0 (0.0%) | 87 (9.0%) |
| $20,000 to $22,499 | 33 (3.4%) | 44 (4.6%) |
| $22,500 to $24,999 | 27 (2.8%) | 40 (4.2%) |
| $25,000 to $29,999 | 82 (8.4%) | 90 (9.4%) |
| $30,000 to $34,999 | 72 (7.4%) | 47 (4.9%) |
| $35,000 to $39,999 | 39 (4.0%) | 124 (12.9%) |
| $40,000 to $44,999 | 0 (0.0%) | 55 (5.7%) |
| $45,000 to $49,999 | 165 (16.9%) | 79 (8.2%) |
| $50,000 to $54,999 | 72 (7.4%) | 44 (4.6%) |
| $55,000 to $64,999 | 60 (6.1%) | 30 (3.1%) |
| $65,000 to $74,999 | 58 (5.9%) | 75 (7.8%) |
| $75,000 to $99,999 | 73 (7.5%) | 15 (1.6%) |
| $100,000+ | 14 (1.4%) | 0 (0.0%) |
| Total | 975 (100.0%) | 961 (100.0%) |
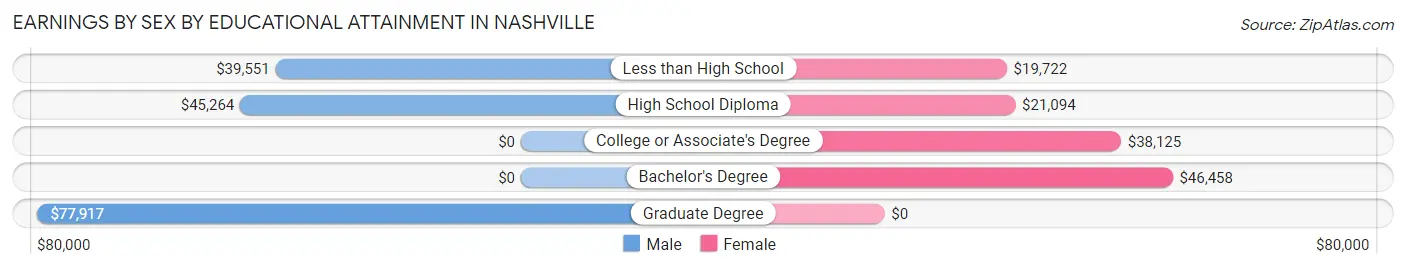
Earnings by Sex by Educational Attainment in Nashville
Average earnings in Nashville are $39,679 for men and $31,014 for women, a difference of 21.8%. Men with an educational attainment of graduate degree enjoy the highest average annual earnings of $77,917, while those with less than high school education earn the least with $39,551. Women with an educational attainment of bachelor's degree earn the most with the average annual earnings of $46,458, while those with less than high school education have the smallest earnings of $19,722.
| Educational Attainment | Male Income | Female Income |
| Less than High School | $39,551 | $19,722 |
| High School Diploma | $45,264 | $21,094 |
| College or Associate's Degree | - | - |
| Bachelor's Degree | - | - |
| Graduate Degree | $77,917 | $0 |
| Total | $39,679 | $31,014 |
Family Income in Nashville
Family Income Brackets in Nashville
According to the Nashville family income data, there are 373 families falling into the $50,000 to $74,999 income range, which is the most common income bracket and makes up 33.3% of all families. Conversely, the $200,000+ income bracket is the least frequent group with only 13 families (1.2%) belonging to this category.
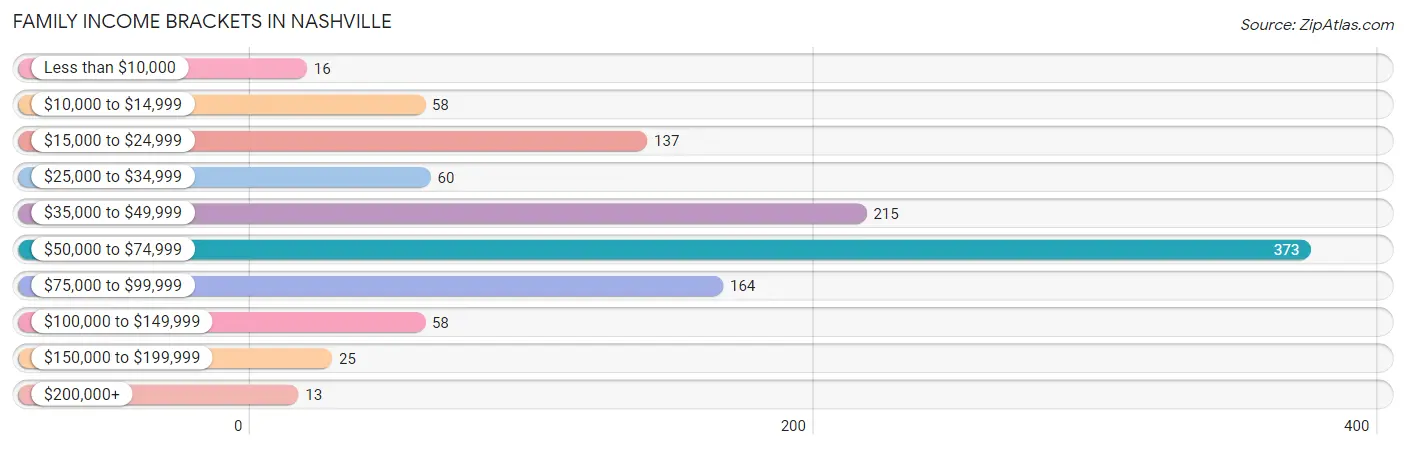
| Income Bracket | # Families | % Families |
| Less than $10,000 | 16 | 1.4% |
| $10,000 to $14,999 | 58 | 5.2% |
| $15,000 to $24,999 | 137 | 12.2% |
| $25,000 to $34,999 | 60 | 5.4% |
| $35,000 to $49,999 | 215 | 19.2% |
| $50,000 to $74,999 | 373 | 33.3% |
| $75,000 to $99,999 | 164 | 14.7% |
| $100,000 to $149,999 | 58 | 5.2% |
| $150,000 to $199,999 | 25 | 2.2% |
| $200,000+ | 13 | 1.2% |
Family Income by Famaliy Size in Nashville
5-person families (145 | 13.0%) account for the highest median family income in Nashville with $63,125 per family, while 2-person families (452 | 40.4%) have the highest median income of $23,802 per family member.
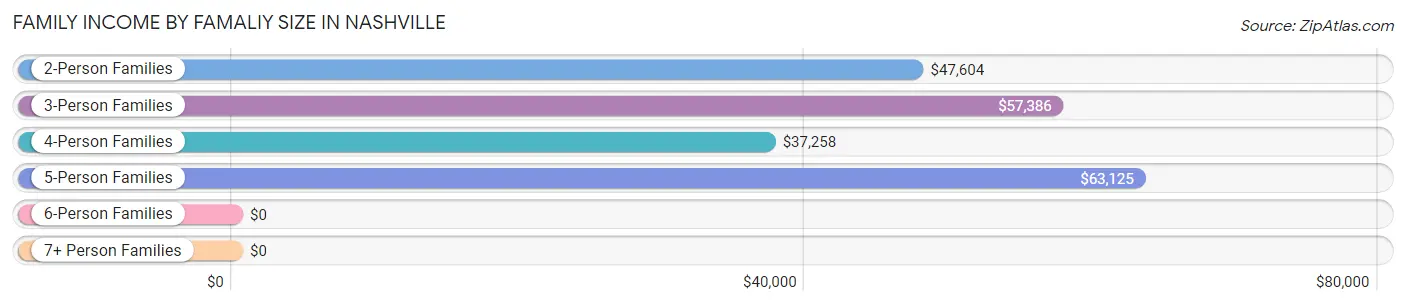
| Income Bracket | # Families | Median Income |
| 2-Person Families | 452 (40.4%) | $47,604 |
| 3-Person Families | 305 (27.3%) | $57,386 |
| 4-Person Families | 192 (17.2%) | $37,258 |
| 5-Person Families | 145 (13.0%) | $63,125 |
| 6-Person Families | 11 (1.0%) | $0 |
| 7+ Person Families | 14 (1.3%) | $0 |
| Total | 1,119 (100.0%) | $53,391 |
Family Income by Number of Earners in Nashville
The median family income in Nashville is $53,391, with families comprising 2 earners (367) having the highest median family income of $83,139, while families with no earners (183) have the lowest median family income of $40,034, accounting for 32.8% and 16.4% of families, respectively.
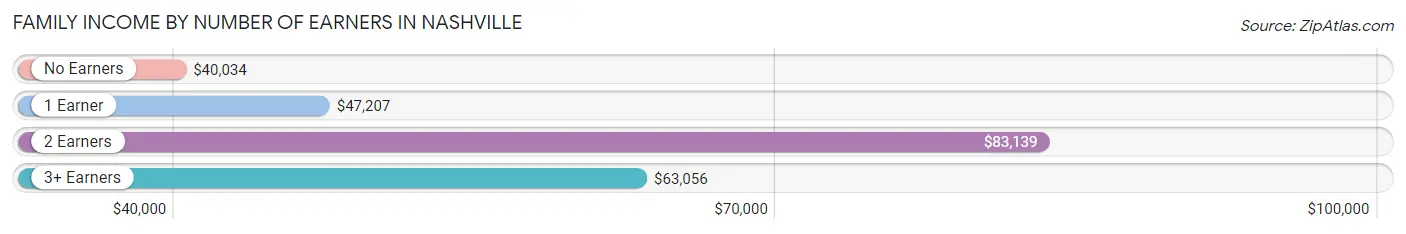
| Number of Earners | # Families | Median Income |
| No Earners | 183 (16.4%) | $40,034 |
| 1 Earner | 495 (44.2%) | $47,207 |
| 2 Earners | 367 (32.8%) | $83,139 |
| 3+ Earners | 74 (6.6%) | $63,056 |
| Total | 1,119 (100.0%) | $53,391 |
Household Income in Nashville
Household Income Brackets in Nashville
With 407 households falling in the category, the $50,000 to $74,999 income range is the most frequent in Nashville, accounting for 22.5% of all households. In contrast, only 13 households (0.7%) fall into the $200,000+ income bracket, making it the least populous group.
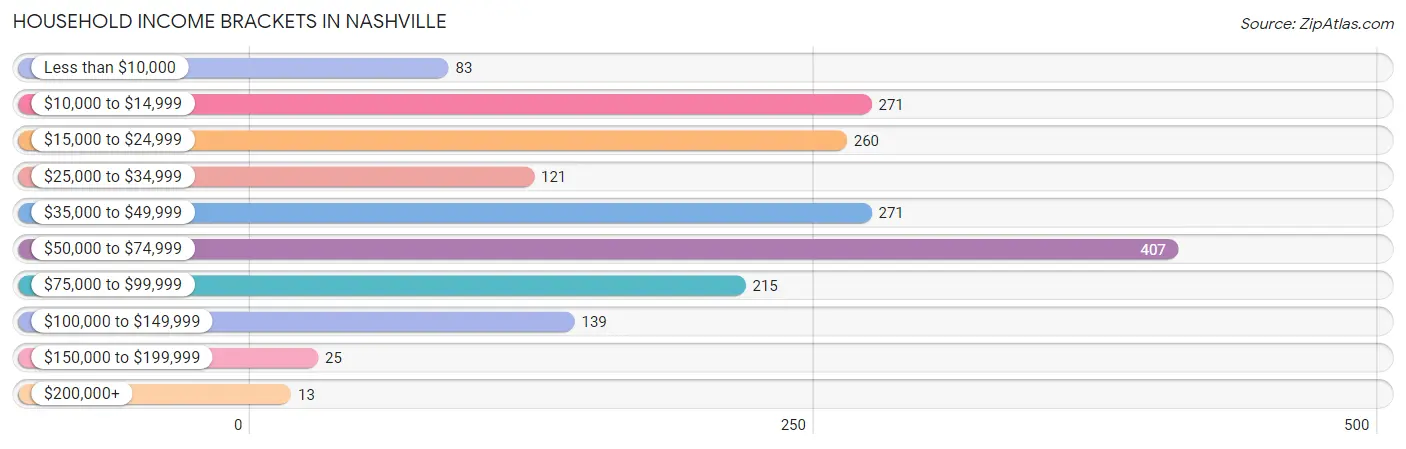
| Income Bracket | # Households | % Households |
| Less than $10,000 | 83 | 4.6% |
| $10,000 to $14,999 | 271 | 15.0% |
| $15,000 to $24,999 | 260 | 14.4% |
| $25,000 to $34,999 | 121 | 6.7% |
| $35,000 to $49,999 | 271 | 15.0% |
| $50,000 to $74,999 | 407 | 22.5% |
| $75,000 to $99,999 | 215 | 11.9% |
| $100,000 to $149,999 | 139 | 7.7% |
| $150,000 to $199,999 | 25 | 1.4% |
| $200,000+ | 13 | 0.7% |
Household Income by Householder Age in Nashville
The median household income in Nashville is $45,500, with the highest median household income of $63,080 found in the 25 to 44 years age bracket for the primary householder. A total of 637 households (35.2%) fall into this category. Meanwhile, the 15 to 24 years age bracket for the primary householder has the lowest median household income of $0, with 22 households (1.2%) in this group.
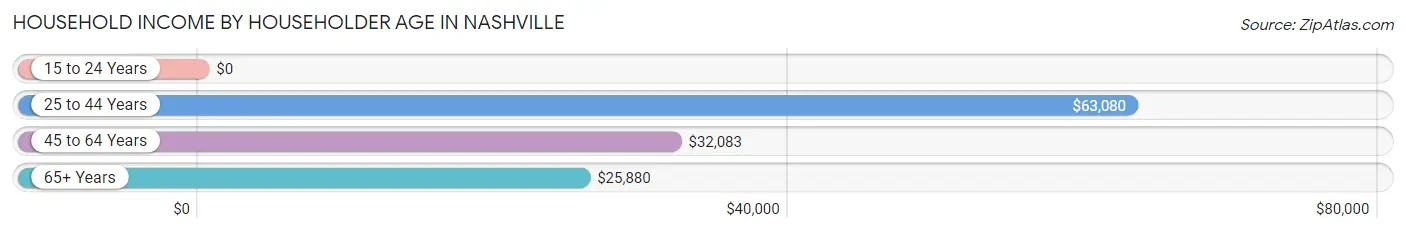
| Income Bracket | # Households | Median Income |
| 15 to 24 Years | 22 (1.2%) | $0 |
| 25 to 44 Years | 637 (35.2%) | $63,080 |
| 45 to 64 Years | 626 (34.6%) | $32,083 |
| 65+ Years | 523 (28.9%) | $25,880 |
| Total | 1,808 (100.0%) | $45,500 |
Poverty in Nashville
Income Below Poverty by Sex and Age in Nashville
With 14.0% poverty level for males and 28.7% for females among the residents of Nashville, 18 to 24 year old males and 5 year old females are the most vulnerable to poverty, with 63 males (51.2%) and 15 females (100.0%) in their respective age groups living below the poverty level.
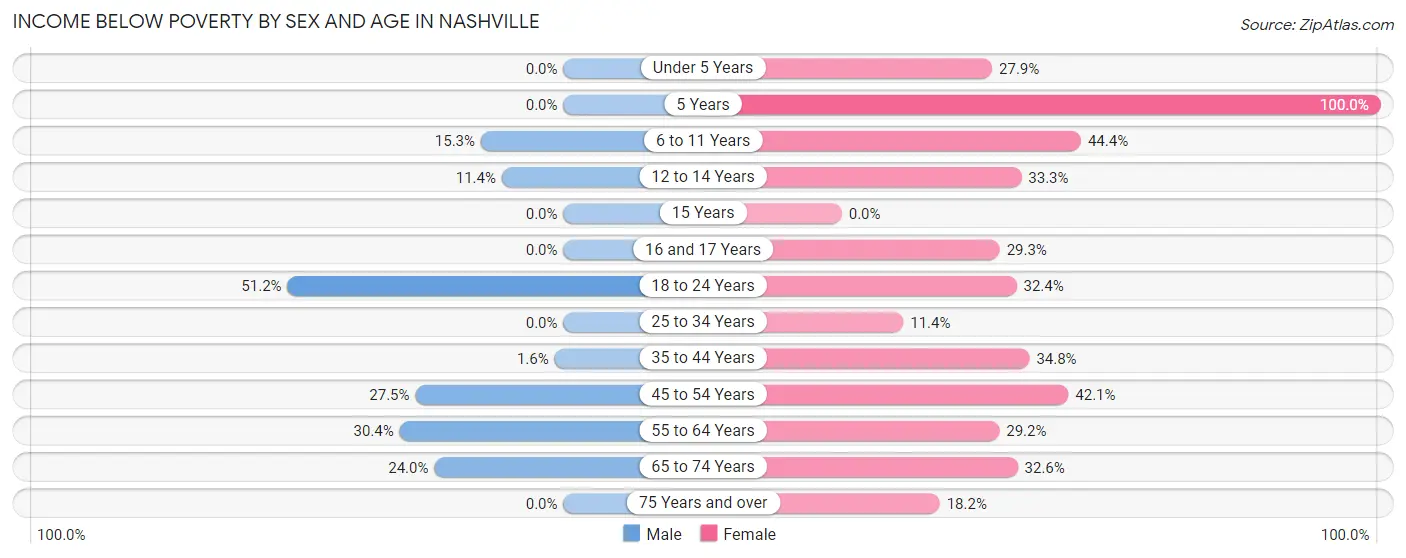
| Age Bracket | Male | Female |
| Under 5 Years | 0 (0.0%) | 65 (27.9%) |
| 5 Years | 0 (0.0%) | 15 (100.0%) |
| 6 to 11 Years | 45 (15.3%) | 103 (44.4%) |
| 12 to 14 Years | 8 (11.4%) | 7 (33.3%) |
| 15 Years | 0 (0.0%) | 0 (0.0%) |
| 16 and 17 Years | 0 (0.0%) | 17 (29.3%) |
| 18 to 24 Years | 63 (51.2%) | 60 (32.4%) |
| 25 to 34 Years | 0 (0.0%) | 47 (11.4%) |
| 35 to 44 Years | 5 (1.6%) | 93 (34.8%) |
| 45 to 54 Years | 64 (27.5%) | 82 (42.0%) |
| 55 to 64 Years | 66 (30.4%) | 119 (29.2%) |
| 65 to 74 Years | 40 (23.9%) | 109 (32.6%) |
| 75 Years and over | 0 (0.0%) | 42 (18.2%) |
| Total | 291 (14.0%) | 759 (28.7%) |
Income Above Poverty by Sex and Age in Nashville
According to the poverty statistics in Nashville, males aged under 5 years and females aged 15 years are the age groups that are most secure financially, with 100.0% of males and 100.0% of females in these age groups living above the poverty line.
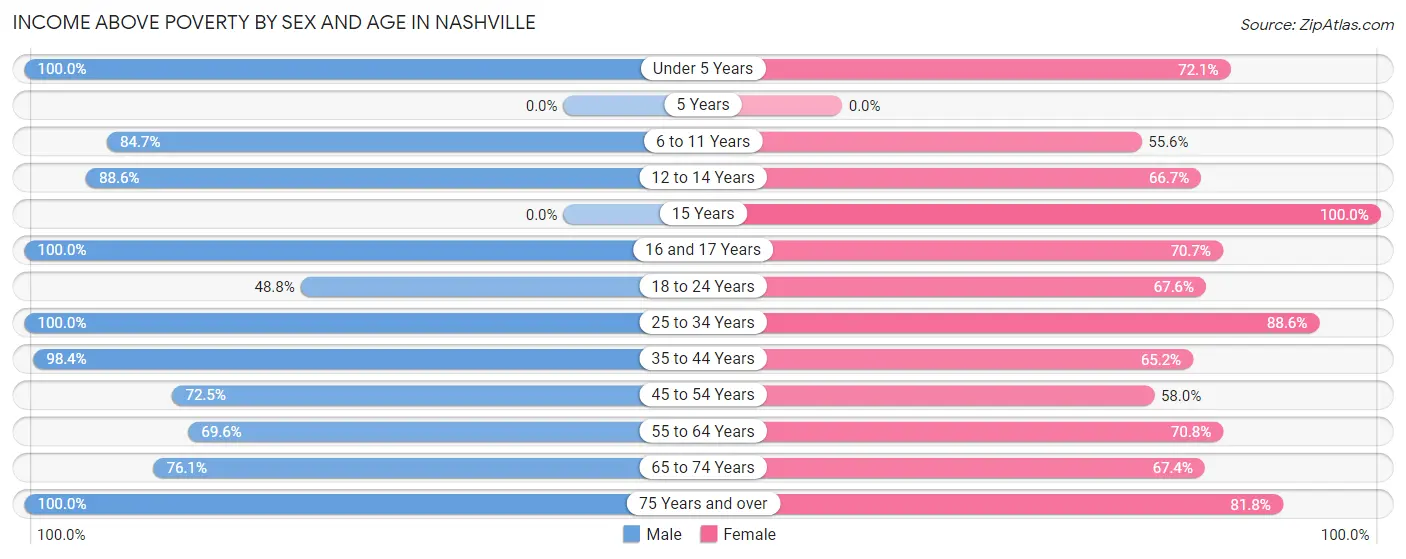
| Age Bracket | Male | Female |
| Under 5 Years | 201 (100.0%) | 168 (72.1%) |
| 5 Years | 0 (0.0%) | 0 (0.0%) |
| 6 to 11 Years | 249 (84.7%) | 129 (55.6%) |
| 12 to 14 Years | 62 (88.6%) | 14 (66.7%) |
| 15 Years | 0 (0.0%) | 58 (100.0%) |
| 16 and 17 Years | 11 (100.0%) | 41 (70.7%) |
| 18 to 24 Years | 60 (48.8%) | 125 (67.6%) |
| 25 to 34 Years | 354 (100.0%) | 365 (88.6%) |
| 35 to 44 Years | 302 (98.4%) | 174 (65.2%) |
| 45 to 54 Years | 169 (72.5%) | 113 (58.0%) |
| 55 to 64 Years | 151 (69.6%) | 288 (70.8%) |
| 65 to 74 Years | 127 (76.0%) | 225 (67.4%) |
| 75 Years and over | 100 (100.0%) | 189 (81.8%) |
| Total | 1,786 (86.0%) | 1,889 (71.3%) |
Income Below Poverty Among Married-Couple Families in Nashville
The poverty statistics for married-couple families in Nashville show that 11.8% or 74 of the total 628 families live below the poverty line. Families with 1 or 2 children have the highest poverty rate of 24.2%, comprising of 46 families. On the other hand, families with 3 or 4 children have the lowest poverty rate of 0.0%, which includes 0 families.
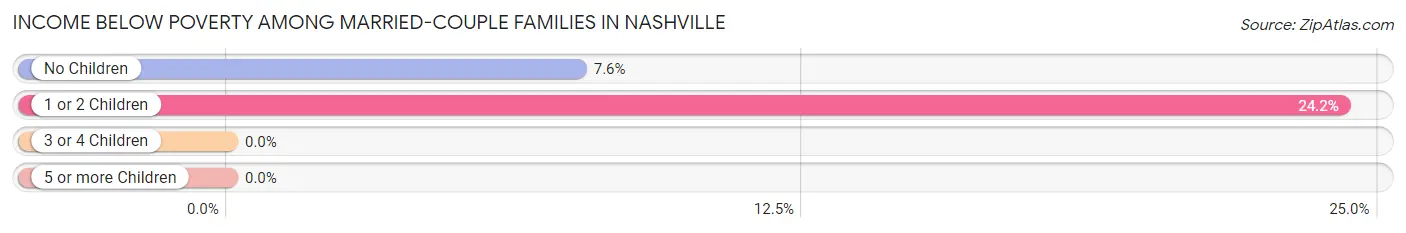
| Children | Above Poverty | Below Poverty |
| No Children | 341 (92.4%) | 28 (7.6%) |
| 1 or 2 Children | 144 (75.8%) | 46 (24.2%) |
| 3 or 4 Children | 69 (100.0%) | 0 (0.0%) |
| 5 or more Children | 0 (0.0%) | 0 (0.0%) |
| Total | 554 (88.2%) | 74 (11.8%) |
Income Below Poverty Among Single-Parent Households in Nashville
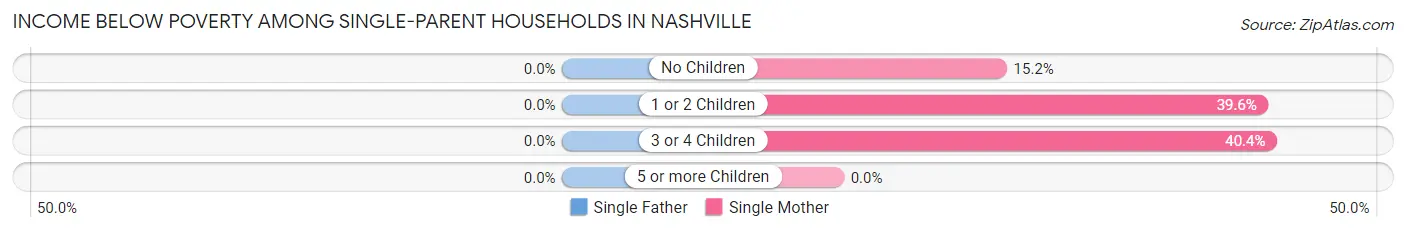
| Children | Single Father | Single Mother |
| No Children | 0 (0.0%) | 29 (15.2%) |
| 1 or 2 Children | 0 (0.0%) | 76 (39.6%) |
| 3 or 4 Children | 0 (0.0%) | 21 (40.4%) |
| 5 or more Children | 0 (0.0%) | 0 (0.0%) |
| Total | 0 (0.0%) | 126 (29.0%) |
Income Below Poverty Among Married-Couple vs Single-Parent Households in Nashville
The poverty data for Nashville shows that 74 of the married-couple family households (11.8%) and 126 of the single-parent households (25.7%) are living below the poverty level. Within the married-couple family households, those with 1 or 2 children have the highest poverty rate, with 46 households (24.2%) falling below the poverty line. Among the single-parent households, those with 1 or 2 children have the highest poverty rate, with 76 household (39.6%) living below poverty.
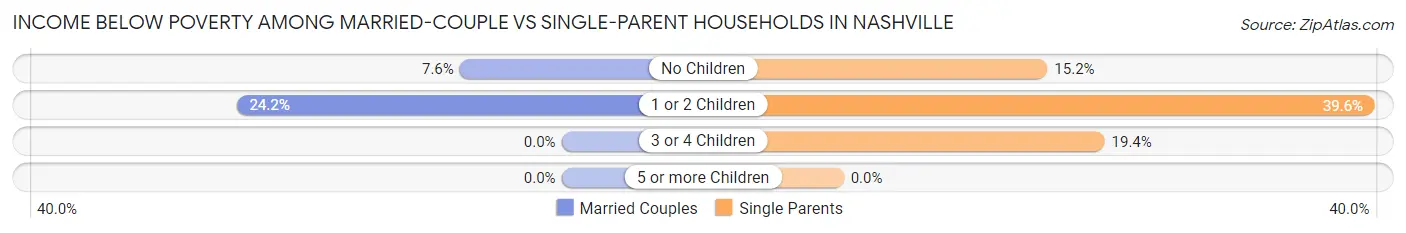
| Children | Married-Couple Families | Single-Parent Households |
| No Children | 28 (7.6%) | 29 (15.2%) |
| 1 or 2 Children | 46 (24.2%) | 76 (39.6%) |
| 3 or 4 Children | 0 (0.0%) | 21 (19.4%) |
| 5 or more Children | 0 (0.0%) | 0 (0.0%) |
| Total | 74 (11.8%) | 126 (25.7%) |
Race in Nashville
The most populous races in Nashville are White / Caucasian (3,200 | 65.2%), Black / African American (1,233 | 25.1%), and Two or more Races (203 | 4.1%).
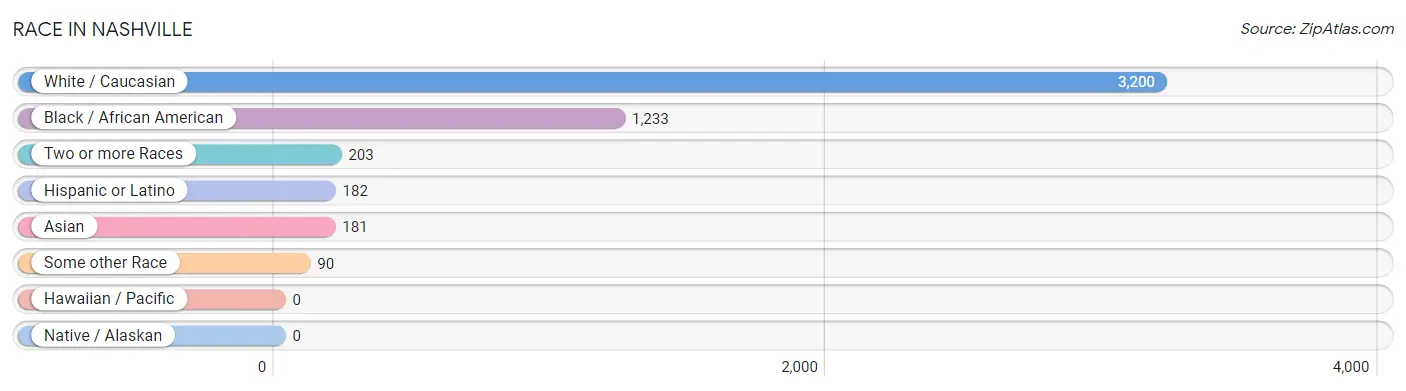
| Race | # Population | % Population |
| Asian | 181 | 3.7% |
| Black / African American | 1,233 | 25.1% |
| Hawaiian / Pacific | 0 | 0.0% |
| Hispanic or Latino | 182 | 3.7% |
| Native / Alaskan | 0 | 0.0% |
| White / Caucasian | 3,200 | 65.2% |
| Two or more Races | 203 | 4.1% |
| Some other Race | 90 | 1.8% |
| Total | 4,907 | 100.0% |
Ancestry in Nashville
The most populous ancestries reported in Nashville are Irish (468 | 9.5%), American (315 | 6.4%), English (175 | 3.6%), Indonesian (175 | 3.6%), and Mexican (155 | 3.2%), together accounting for 26.3% of all Nashville residents.
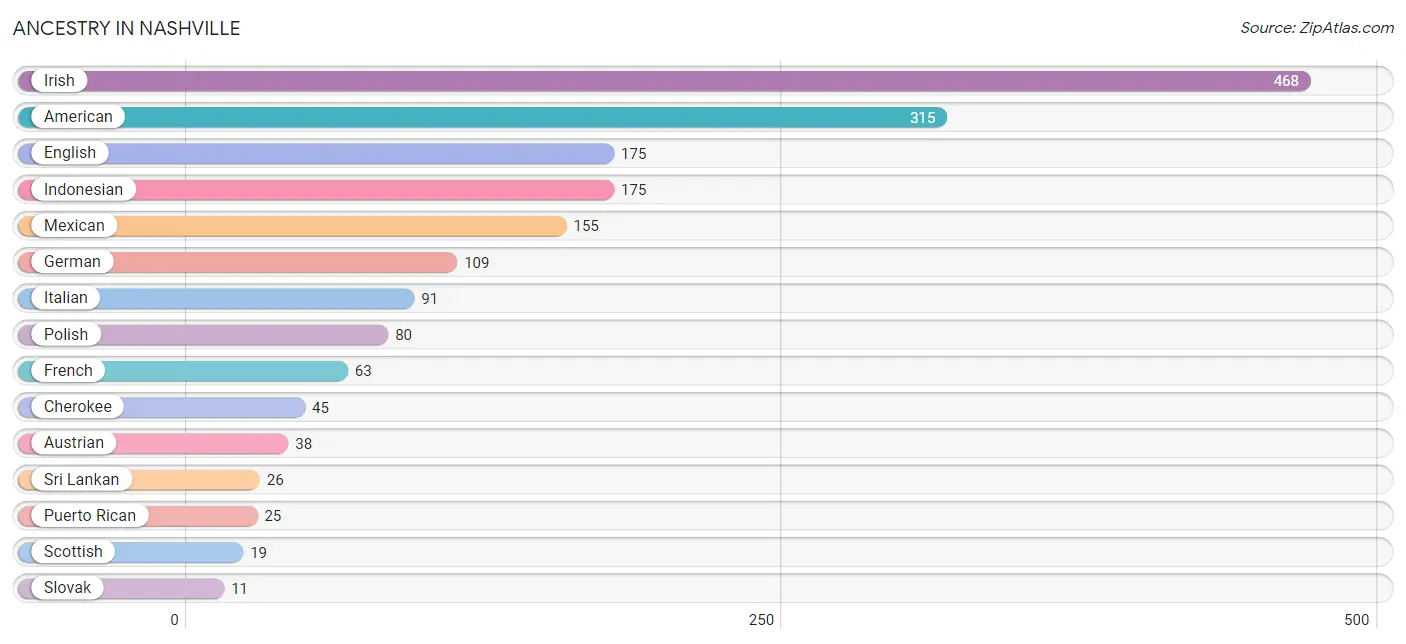
| Ancestry | # Population | % Population |
| American | 315 | 6.4% |
| Austrian | 38 | 0.8% |
| Cajun | 8 | 0.2% |
| Cherokee | 45 | 0.9% |
| Danish | 3 | 0.1% |
| Dominican | 2 | 0.0% |
| English | 175 | 3.6% |
| European | 5 | 0.1% |
| French | 63 | 1.3% |
| German | 109 | 2.2% |
| Indonesian | 175 | 3.6% |
| Irish | 468 | 9.5% |
| Italian | 91 | 1.8% |
| Mexican | 155 | 3.2% |
| Polish | 80 | 1.6% |
| Puerto Rican | 25 | 0.5% |
| Scotch-Irish | 3 | 0.1% |
| Scottish | 19 | 0.4% |
| Slovak | 11 | 0.2% |
| Sri Lankan | 26 | 0.5% | View All 20 Rows |
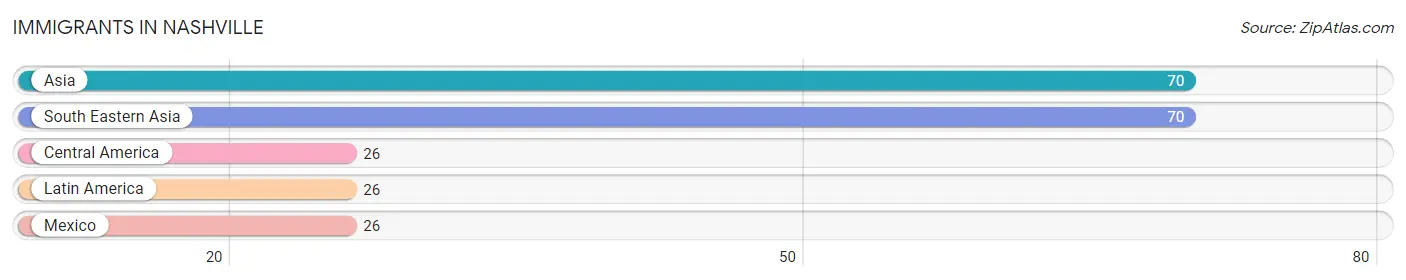
Immigrants in Nashville
The most numerous immigrant groups reported in Nashville came from Asia (70 | 1.4%), South Eastern Asia (70 | 1.4%), Central America (26 | 0.5%), Latin America (26 | 0.5%), and Mexico (26 | 0.5%), together accounting for 4.4% of all Nashville residents.
| Immigration Origin | # Population | % Population |
| Asia | 70 | 1.4% |
| Central America | 26 | 0.5% |
| Latin America | 26 | 0.5% |
| Mexico | 26 | 0.5% |
| South Eastern Asia | 70 | 1.4% | View All 5 Rows |
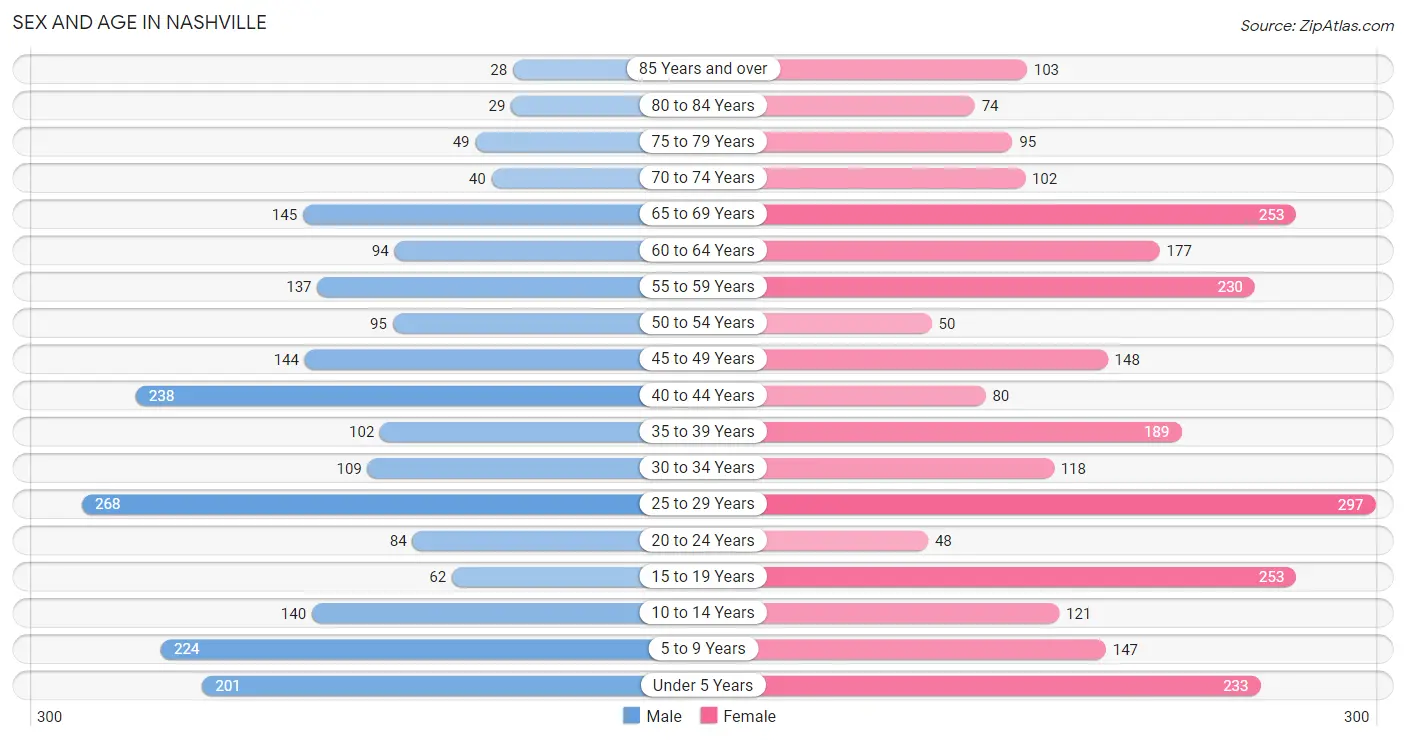
Sex and Age in Nashville
Sex and Age in Nashville
The most populous age groups in Nashville are 25 to 29 Years (268 | 12.2%) for men and 25 to 29 Years (297 | 10.9%) for women.
| Age Bracket | Male | Female |
| Under 5 Years | 201 (9.2%) | 233 (8.6%) |
| 5 to 9 Years | 224 (10.2%) | 147 (5.4%) |
| 10 to 14 Years | 140 (6.4%) | 121 (4.4%) |
| 15 to 19 Years | 62 (2.8%) | 253 (9.3%) |
| 20 to 24 Years | 84 (3.8%) | 48 (1.8%) |
| 25 to 29 Years | 268 (12.2%) | 297 (10.9%) |
| 30 to 34 Years | 109 (5.0%) | 118 (4.3%) |
| 35 to 39 Years | 102 (4.7%) | 189 (7.0%) |
| 40 to 44 Years | 238 (10.9%) | 80 (2.9%) |
| 45 to 49 Years | 144 (6.6%) | 148 (5.4%) |
| 50 to 54 Years | 95 (4.3%) | 50 (1.8%) |
| 55 to 59 Years | 137 (6.3%) | 230 (8.5%) |
| 60 to 64 Years | 94 (4.3%) | 177 (6.5%) |
| 65 to 69 Years | 145 (6.6%) | 253 (9.3%) |
| 70 to 74 Years | 40 (1.8%) | 102 (3.7%) |
| 75 to 79 Years | 49 (2.2%) | 95 (3.5%) |
| 80 to 84 Years | 29 (1.3%) | 74 (2.7%) |
| 85 Years and over | 28 (1.3%) | 103 (3.8%) |
| Total | 2,189 (100.0%) | 2,718 (100.0%) |
Families and Households in Nashville
Median Family Size in Nashville
The median family size in Nashville is 3.33 persons per family, with single male/father families (56 | 5.0%) accounting for the largest median family size of 3.63 persons per family. On the other hand, married-couple families (628 | 56.1%) represent the smallest median family size with 3.20 persons per family.
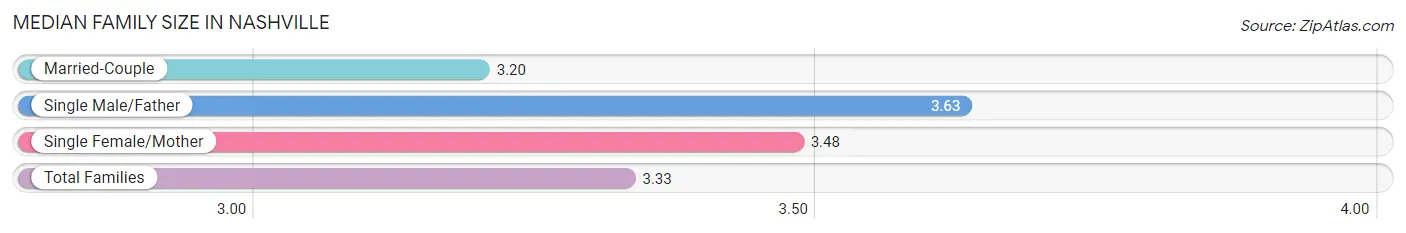
| Family Type | # Families | Family Size |
| Married-Couple | 628 (56.1%) | 3.20 |
| Single Male/Father | 56 (5.0%) | 3.63 |
| Single Female/Mother | 435 (38.9%) | 3.48 |
| Total Families | 1,119 (100.0%) | 3.33 |
Median Household Size in Nashville
The median household size in Nashville is 2.61 persons per household, with single male/father households (56 | 3.1%) accounting for the largest median household size of 4.23 persons per household. non-family households (689 | 38.1%) represent the smallest median household size with 1.25 persons per household.
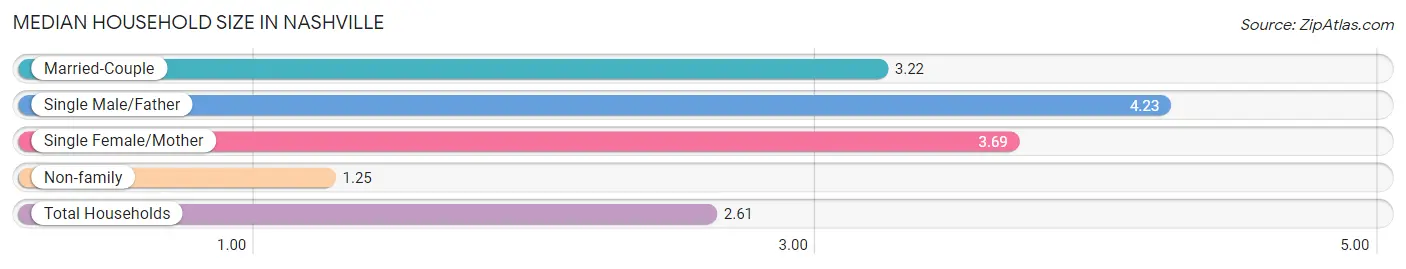
| Household Type | # Households | Household Size |
| Married-Couple | 628 (34.7%) | 3.22 |
| Single Male/Father | 56 (3.1%) | 4.23 |
| Single Female/Mother | 435 (24.1%) | 3.69 |
| Non-family | 689 (38.1%) | 1.25 |
| Total Households | 1,808 (100.0%) | 2.61 |
Household Size by Marriage Status in Nashville
Out of a total of 1,808 households in Nashville, 1,119 (61.9%) are family households, while 689 (38.1%) are nonfamily households. The most numerous type of family households are 2-person households, comprising 416, and the most common type of nonfamily households are 1-person households, comprising 524.
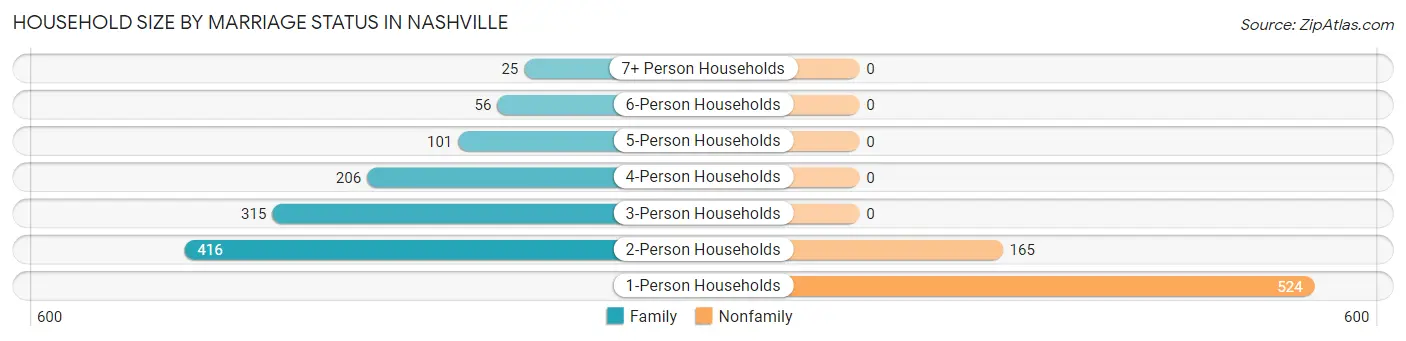
| Household Size | Family Households | Nonfamily Households |
| 1-Person Households | - | 524 (29.0%) |
| 2-Person Households | 416 (23.0%) | 165 (9.1%) |
| 3-Person Households | 315 (17.4%) | 0 (0.0%) |
| 4-Person Households | 206 (11.4%) | 0 (0.0%) |
| 5-Person Households | 101 (5.6%) | 0 (0.0%) |
| 6-Person Households | 56 (3.1%) | 0 (0.0%) |
| 7+ Person Households | 25 (1.4%) | 0 (0.0%) |
| Total | 1,119 (61.9%) | 689 (38.1%) |
Female Fertility in Nashville
Fertility by Age in Nashville
Average fertility rate in Nashville is 58.0 births per 1,000 women. Women in the age bracket of 20 to 34 years have the highest fertility rate with 143.0 births per 1,000 women. Women in the age bracket of 20 to 34 years acount for 100.0% of all women with births.
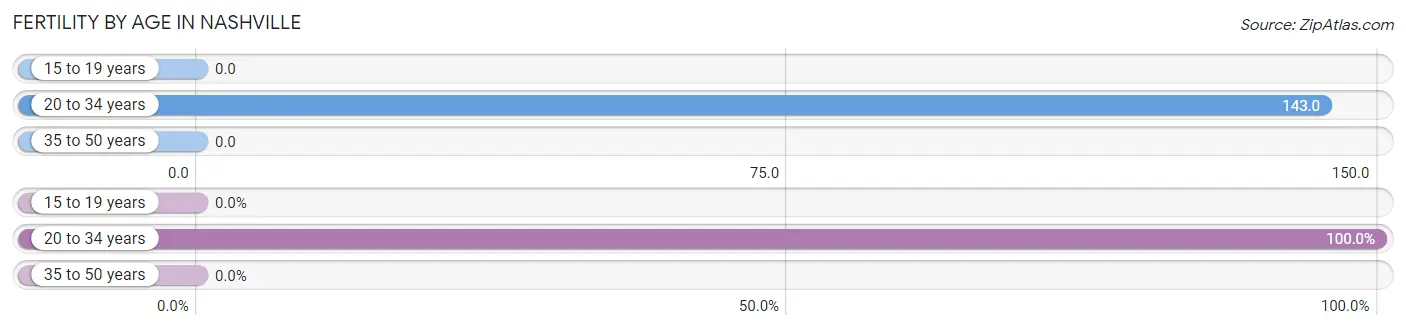
| Age Bracket | Women with Births | Births / 1,000 Women |
| 15 to 19 years | 0 (0.0%) | 0.0 |
| 20 to 34 years | 66 (100.0%) | 143.0 |
| 35 to 50 years | 0 (0.0%) | 0.0 |
| Total | 66 (100.0%) | 58.0 |
Fertility by Age by Marriage Status in Nashville
53.0% of women with births (66) in Nashville are married. The highest percentage of unmarried women with births falls into 20 to 34 years age bracket with 47.0% of them unmarried at the time of birth, while the lowest percentage of unmarried women with births belong to 20 to 34 years age bracket with 47.0% of them unmarried.
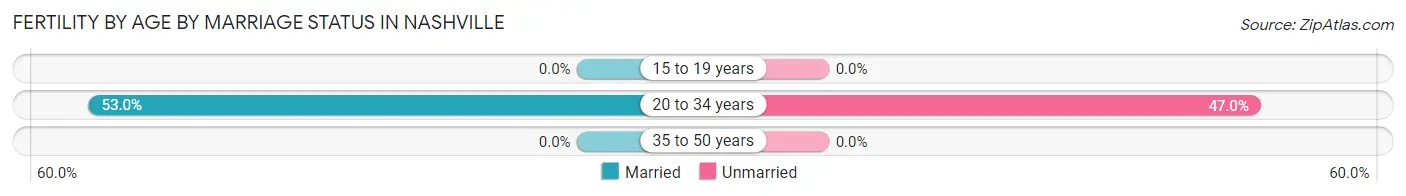
| Age Bracket | Married | Unmarried |
| 15 to 19 years | 0 (0.0%) | 0 (0.0%) |
| 20 to 34 years | 35 (53.0%) | 31 (47.0%) |
| 35 to 50 years | 0 (0.0%) | 0 (0.0%) |
| Total | 35 (53.0%) | 31 (47.0%) |
Fertility by Education in Nashville
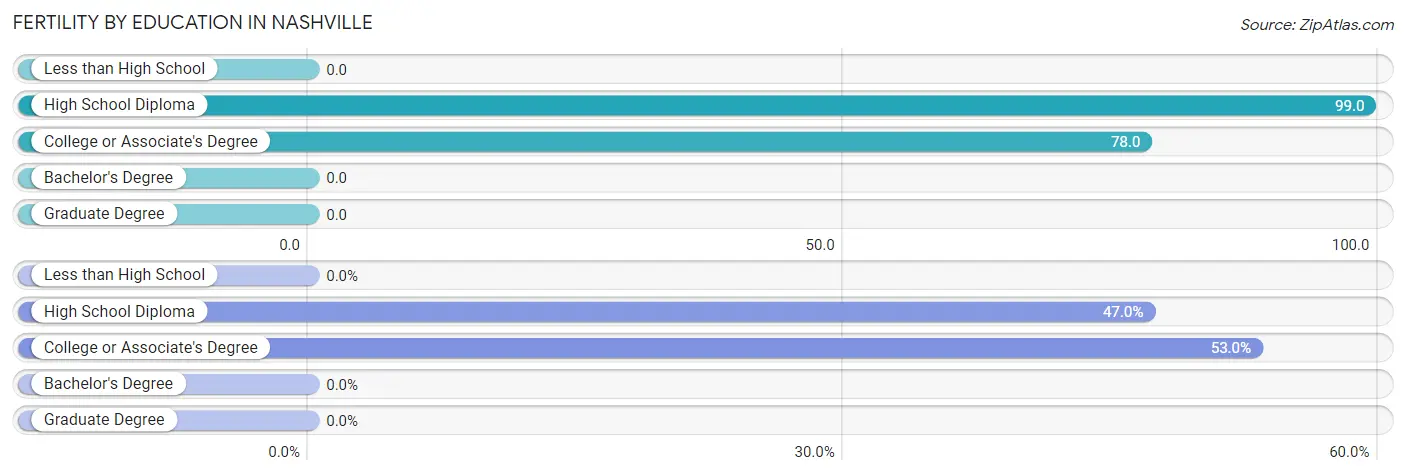
| Educational Attainment | Women with Births | Births / 1,000 Women |
| Less than High School | 0 (0.0%) | 0.0 |
| High School Diploma | 31 (47.0%) | 99.0 |
| College or Associate's Degree | 35 (53.0%) | 78.0 |
| Bachelor's Degree | 0 (0.0%) | 0.0 |
| Graduate Degree | 0 (0.0%) | 0.0 |
| Total | 66 (100.0%) | 58.0 |
Fertility by Education by Marriage Status in Nashville
47.0% of women with births in Nashville are unmarried. Women with the educational attainment of college or associate's degree are most likely to be married with 100.0% of them married at childbirth, while women with the educational attainment of high school diploma are least likely to be married with 100.0% of them unmarried at childbirth.
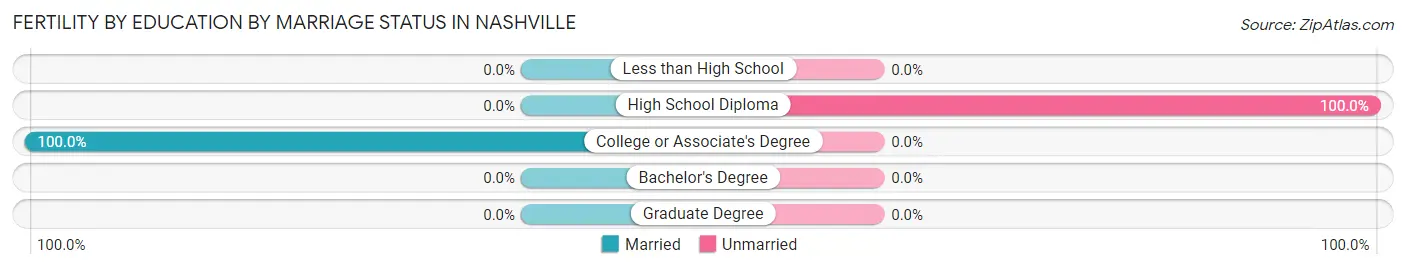
| Educational Attainment | Married | Unmarried |
| Less than High School | 0 (0.0%) | 0 (0.0%) |
| High School Diploma | 0 (0.0%) | 31 (100.0%) |
| College or Associate's Degree | 35 (100.0%) | 0 (0.0%) |
| Bachelor's Degree | 0 (0.0%) | 0 (0.0%) |
| Graduate Degree | 0 (0.0%) | 0 (0.0%) |
| Total | 35 (53.0%) | 31 (47.0%) |
Employment Characteristics in Nashville
Employment by Class of Employer in Nashville
Among the 1,754 employed individuals in Nashville, private company employees (1,329 | 75.8%), local government employees (169 | 9.6%), and not-for-profit organizations (92 | 5.2%) make up the most common classes of employment.
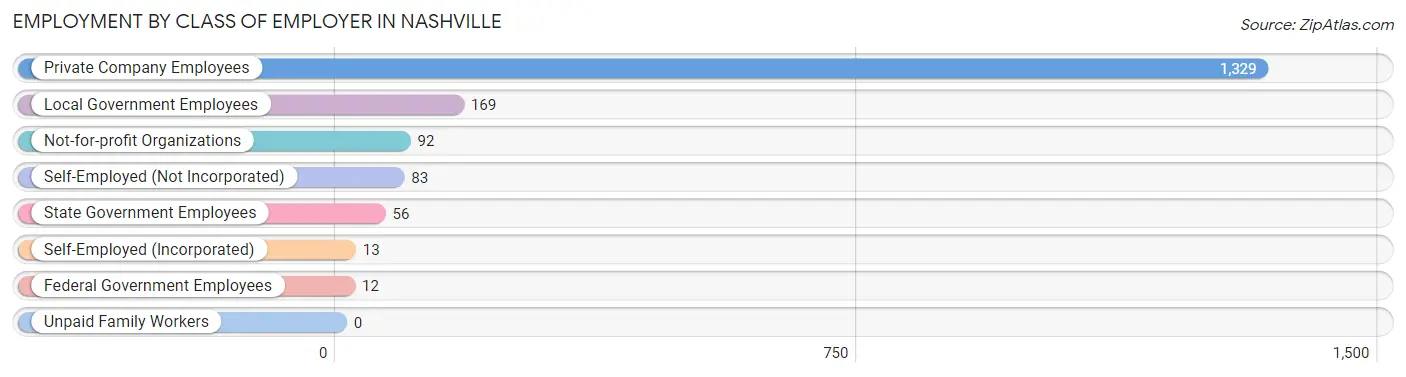
| Employer Class | # Employees | % Employees |
| Private Company Employees | 1,329 | 75.8% |
| Self-Employed (Incorporated) | 13 | 0.7% |
| Self-Employed (Not Incorporated) | 83 | 4.7% |
| Not-for-profit Organizations | 92 | 5.2% |
| Local Government Employees | 169 | 9.6% |
| State Government Employees | 56 | 3.2% |
| Federal Government Employees | 12 | 0.7% |
| Unpaid Family Workers | 0 | 0.0% |
| Total | 1,754 | 100.0% |
Employment Status by Age in Nashville
According to the labor force statistics for Nashville, out of the total population over 16 years of age (3,783), 50.6% or 1,914 individuals are in the labor force, with 7.2% or 138 of them unemployed. The age group with the highest labor force participation rate is 20 to 24 years, with 84.1% or 111 individuals in the labor force. Within the labor force, the 55 to 59 years age range has the highest percentage of unemployed individuals, with 22.9% or 32 of them being unemployed.
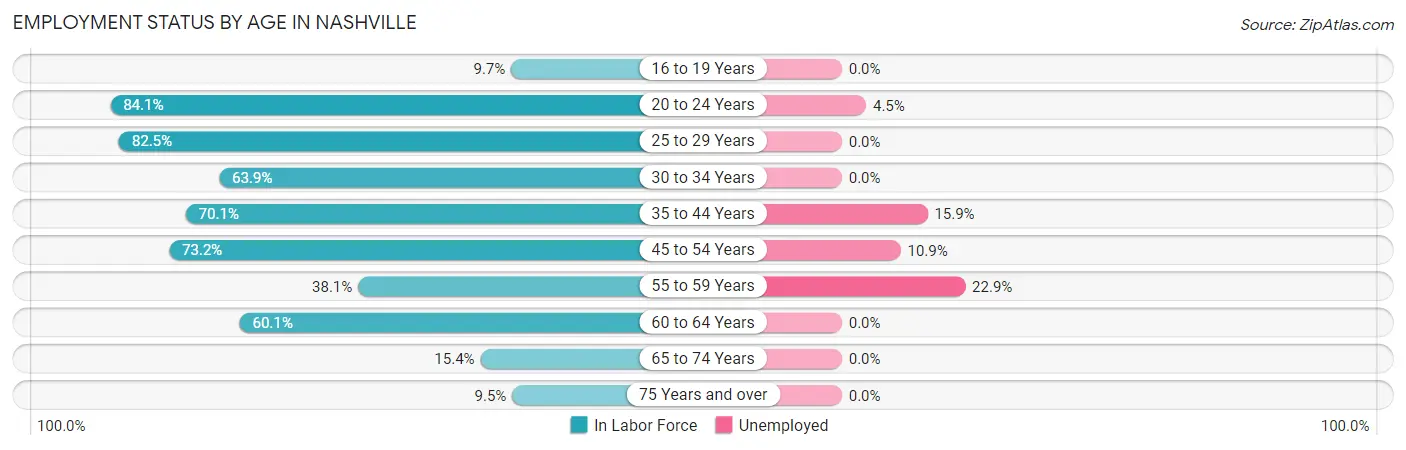
| Age Bracket | In Labor Force | Unemployed |
| 16 to 19 Years | 25 (9.7%) | 0 (0.0%) |
| 20 to 24 Years | 111 (84.1%) | 5 (4.5%) |
| 25 to 29 Years | 466 (82.5%) | 0 (0.0%) |
| 30 to 34 Years | 145 (63.9%) | 0 (0.0%) |
| 35 to 44 Years | 427 (70.1%) | 68 (15.9%) |
| 45 to 54 Years | 320 (73.2%) | 35 (10.9%) |
| 55 to 59 Years | 140 (38.1%) | 32 (22.9%) |
| 60 to 64 Years | 163 (60.1%) | 0 (0.0%) |
| 65 to 74 Years | 83 (15.4%) | 0 (0.0%) |
| 75 Years and over | 36 (9.5%) | 0 (0.0%) |
| Total | 1,914 (50.6%) | 138 (7.2%) |
Employment Status by Educational Attainment in Nashville
According to labor force statistics for Nashville, 67.1% of individuals (1,661) out of the total population between 25 and 64 years of age (2,476) are in the labor force, with 8.1% or 135 of them being unemployed. The group with the highest labor force participation rate are those with the educational attainment of bachelor's degree or higher, with 83.6% or 189 individuals in the labor force. Within the labor force, individuals with less than high school education have the highest percentage of unemployment, with 24.7% or 71 of them being unemployed.
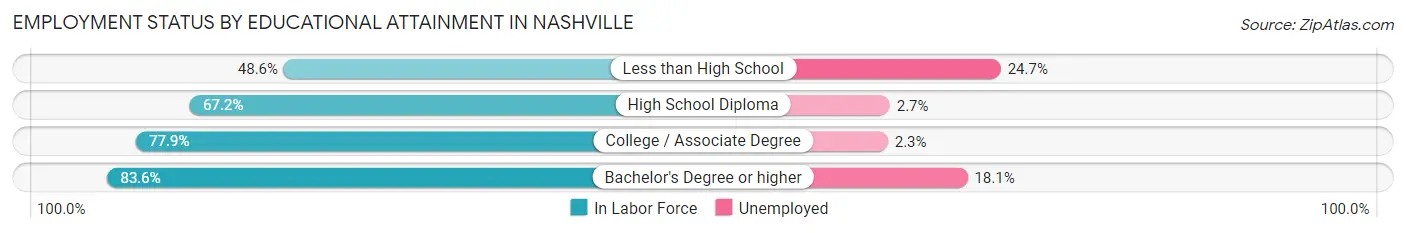
| Educational Attainment | In Labor Force | Unemployed |
| Less than High School | 287 (48.6%) | 146 (24.7%) |
| High School Diploma | 674 (67.2%) | 27 (2.7%) |
| College / Associate Degree | 511 (77.9%) | 15 (2.3%) |
| Bachelor's Degree or higher | 189 (83.6%) | 41 (18.1%) |
| Total | 1,661 (67.1%) | 201 (8.1%) |
Employment Occupations by Sex in Nashville
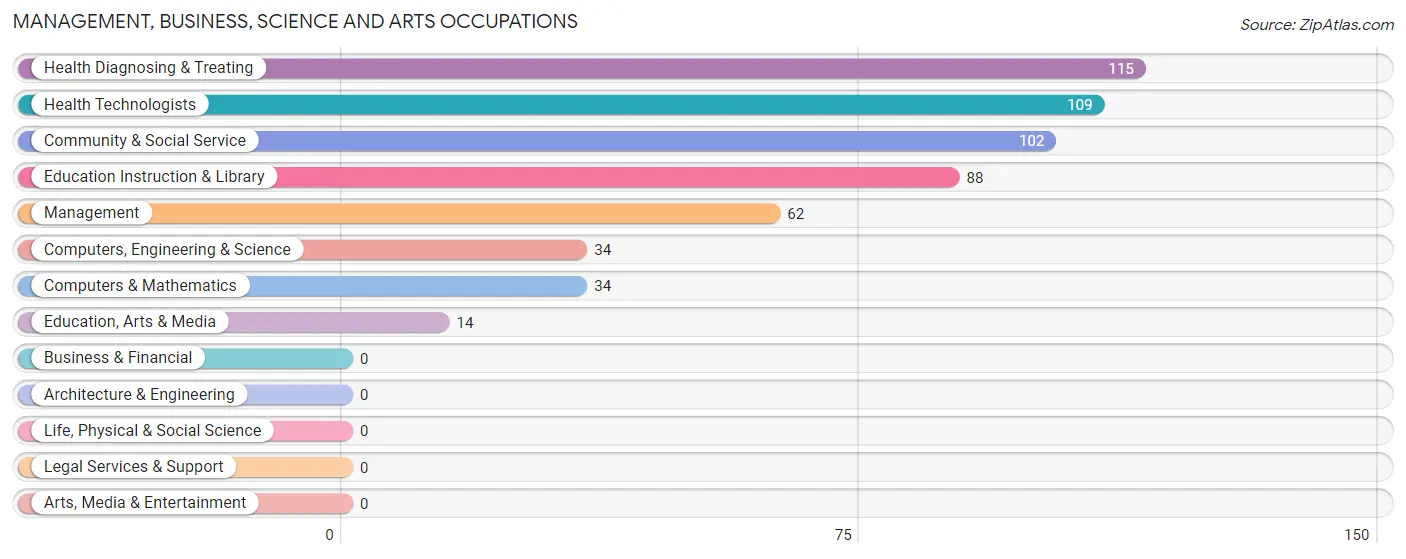
Management, Business, Science and Arts Occupations
The most common Management, Business, Science and Arts occupations in Nashville are Health Diagnosing & Treating (115 | 6.5%), Health Technologists (109 | 6.2%), Community & Social Service (102 | 5.8%), Education Instruction & Library (88 | 5.0%), and Management (62 | 3.5%).
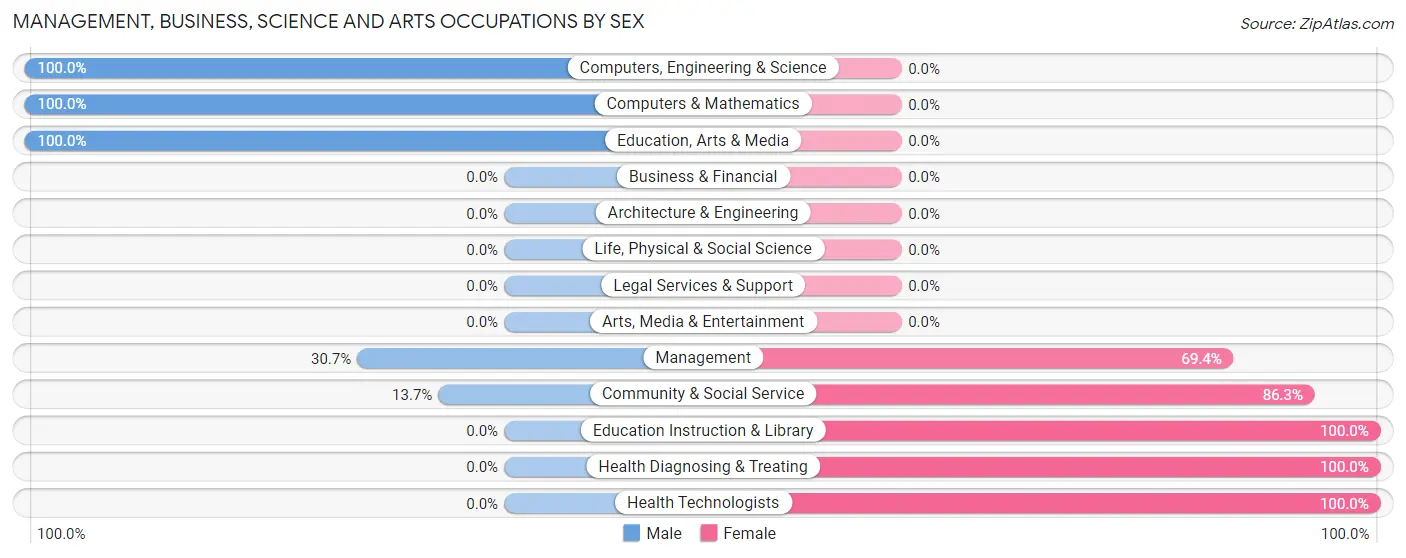
Management, Business, Science and Arts Occupations by Sex
Within the Management, Business, Science and Arts occupations in Nashville, the most male-oriented occupations are Computers, Engineering & Science (100.0%), Computers & Mathematics (100.0%), and Education, Arts & Media (100.0%), while the most female-oriented occupations are Education Instruction & Library (100.0%), Health Diagnosing & Treating (100.0%), and Health Technologists (100.0%).
| Occupation | Male | Female |
| Management | 19 (30.6%) | 43 (69.4%) |
| Business & Financial | 0 (0.0%) | 0 (0.0%) |
| Computers, Engineering & Science | 34 (100.0%) | 0 (0.0%) |
| Computers & Mathematics | 34 (100.0%) | 0 (0.0%) |
| Architecture & Engineering | 0 (0.0%) | 0 (0.0%) |
| Life, Physical & Social Science | 0 (0.0%) | 0 (0.0%) |
| Community & Social Service | 14 (13.7%) | 88 (86.3%) |
| Education, Arts & Media | 14 (100.0%) | 0 (0.0%) |
| Legal Services & Support | 0 (0.0%) | 0 (0.0%) |
| Education Instruction & Library | 0 (0.0%) | 88 (100.0%) |
| Arts, Media & Entertainment | 0 (0.0%) | 0 (0.0%) |
| Health Diagnosing & Treating | 0 (0.0%) | 115 (100.0%) |
| Health Technologists | 0 (0.0%) | 109 (100.0%) |
| Total (Category) | 67 (21.4%) | 246 (78.6%) |
| Total (Overall) | 863 (48.9%) | 903 (51.1%) |
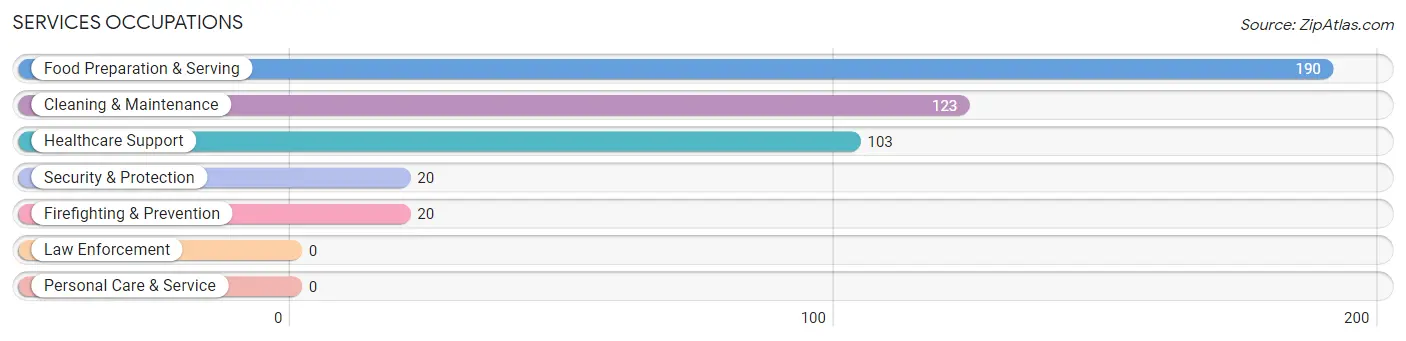
Services Occupations
The most common Services occupations in Nashville are Food Preparation & Serving (190 | 10.8%), Cleaning & Maintenance (123 | 7.0%), Healthcare Support (103 | 5.8%), Security & Protection (20 | 1.1%), and Firefighting & Prevention (20 | 1.1%).
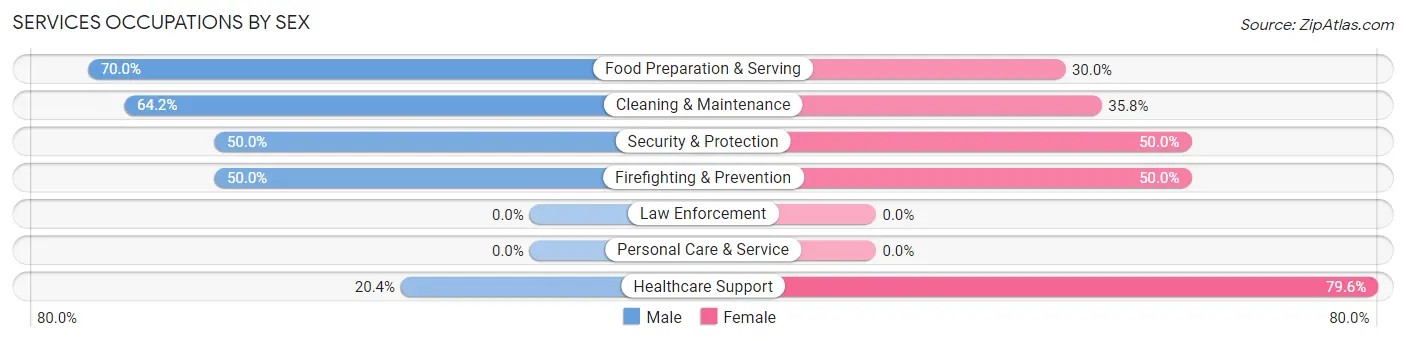
Services Occupations by Sex
Within the Services occupations in Nashville, the most male-oriented occupations are Food Preparation & Serving (70.0%), Cleaning & Maintenance (64.2%), and Security & Protection (50.0%), while the most female-oriented occupations are Healthcare Support (79.6%), Security & Protection (50.0%), and Firefighting & Prevention (50.0%).
| Occupation | Male | Female |
| Healthcare Support | 21 (20.4%) | 82 (79.6%) |
| Security & Protection | 10 (50.0%) | 10 (50.0%) |
| Firefighting & Prevention | 10 (50.0%) | 10 (50.0%) |
| Law Enforcement | 0 (0.0%) | 0 (0.0%) |
| Food Preparation & Serving | 133 (70.0%) | 57 (30.0%) |
| Cleaning & Maintenance | 79 (64.2%) | 44 (35.8%) |
| Personal Care & Service | 0 (0.0%) | 0 (0.0%) |
| Total (Category) | 243 (55.7%) | 193 (44.3%) |
| Total (Overall) | 863 (48.9%) | 903 (51.1%) |
Sales and Office Occupations
The most common Sales and Office occupations in Nashville are Office & Administration (177 | 10.0%), and Sales & Related (99 | 5.6%).

Sales and Office Occupations by Sex
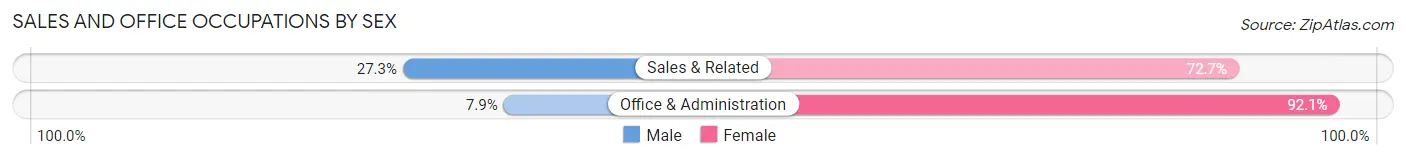
| Occupation | Male | Female |
| Sales & Related | 27 (27.3%) | 72 (72.7%) |
| Office & Administration | 14 (7.9%) | 163 (92.1%) |
| Total (Category) | 41 (14.9%) | 235 (85.1%) |
| Total (Overall) | 863 (48.9%) | 903 (51.1%) |
Natural Resources, Construction and Maintenance Occupations
The most common Natural Resources, Construction and Maintenance occupations in Nashville are Construction & Extraction (165 | 9.3%), and Installation, Maintenance & Repair (61 | 3.5%).

Natural Resources, Construction and Maintenance Occupations by Sex
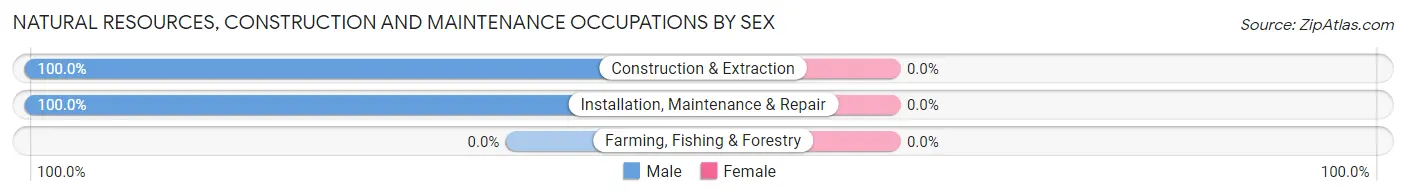
| Occupation | Male | Female |
| Farming, Fishing & Forestry | 0 (0.0%) | 0 (0.0%) |
| Construction & Extraction | 165 (100.0%) | 0 (0.0%) |
| Installation, Maintenance & Repair | 61 (100.0%) | 0 (0.0%) |
| Total (Category) | 226 (100.0%) | 0 (0.0%) |
| Total (Overall) | 863 (48.9%) | 903 (51.1%) |
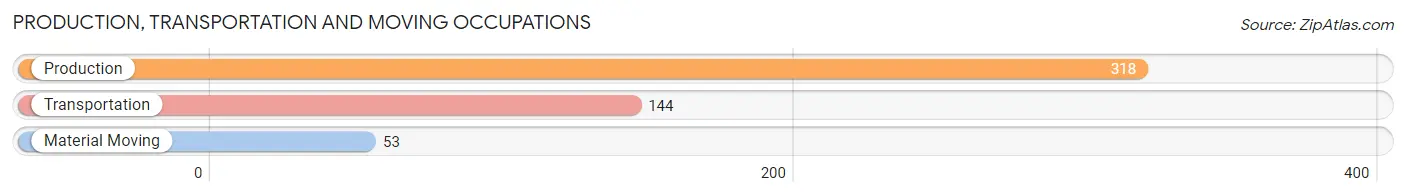
Production, Transportation and Moving Occupations
The most common Production, Transportation and Moving occupations in Nashville are Production (318 | 18.0%), Transportation (144 | 8.2%), and Material Moving (53 | 3.0%).
Production, Transportation and Moving Occupations by Sex
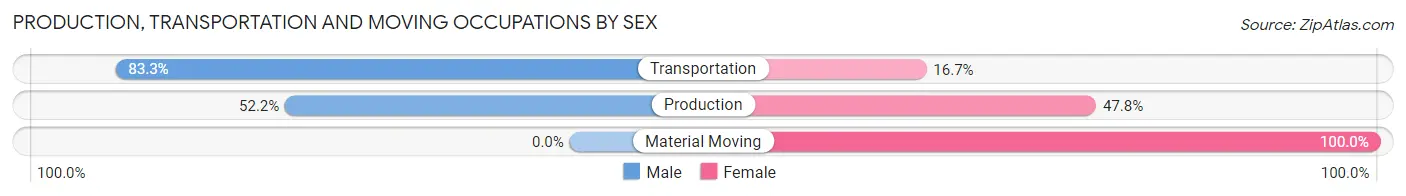
| Occupation | Male | Female |
| Production | 166 (52.2%) | 152 (47.8%) |
| Transportation | 120 (83.3%) | 24 (16.7%) |
| Material Moving | 0 (0.0%) | 53 (100.0%) |
| Total (Category) | 286 (55.5%) | 229 (44.5%) |
| Total (Overall) | 863 (48.9%) | 903 (51.1%) |
Employment Industries by Sex in Nashville
Employment Industries in Nashville
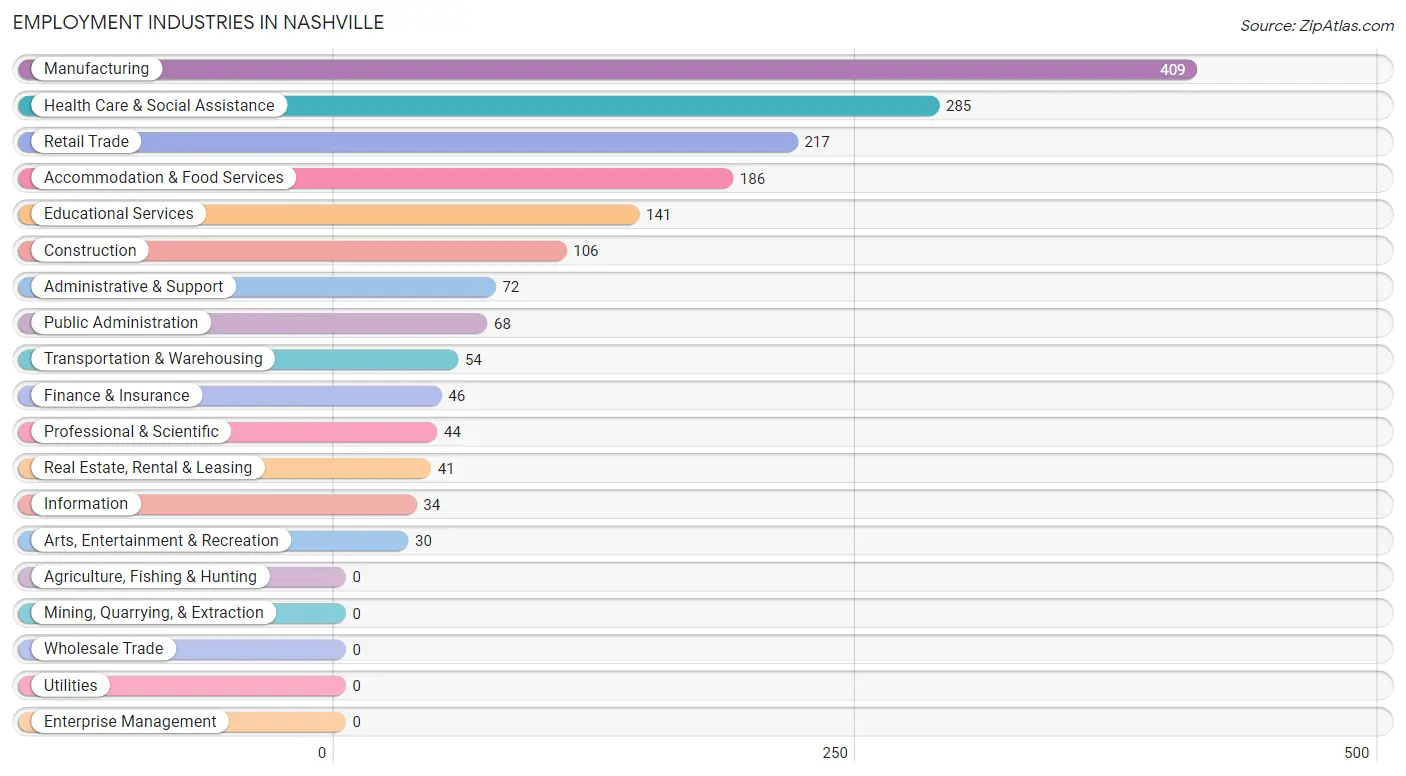
The major employment industries in Nashville include Manufacturing (409 | 23.2%), Health Care & Social Assistance (285 | 16.1%), Retail Trade (217 | 12.3%), Accommodation & Food Services (186 | 10.5%), and Educational Services (141 | 8.0%).
Employment Industries by Sex in Nashville
The Nashville industries that see more men than women are Construction (100.0%), Transportation & Warehousing (100.0%), and Information (100.0%), whereas the industries that tend to have a higher number of women are Finance & Insurance (100.0%), Public Administration (100.0%), and Health Care & Social Assistance (89.1%).
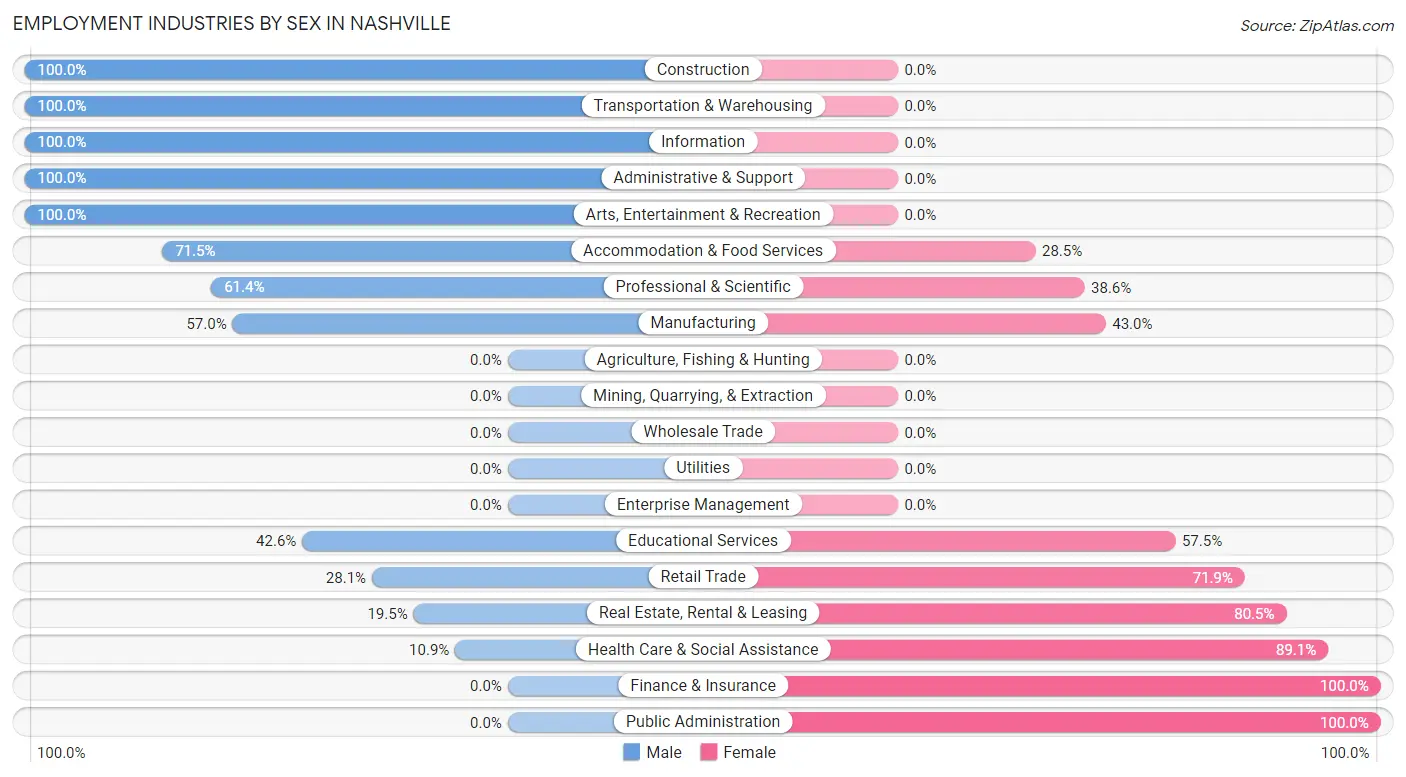
| Industry | Male | Female |
| Agriculture, Fishing & Hunting | 0 (0.0%) | 0 (0.0%) |
| Mining, Quarrying, & Extraction | 0 (0.0%) | 0 (0.0%) |
| Construction | 106 (100.0%) | 0 (0.0%) |
| Manufacturing | 233 (57.0%) | 176 (43.0%) |
| Wholesale Trade | 0 (0.0%) | 0 (0.0%) |
| Retail Trade | 61 (28.1%) | 156 (71.9%) |
| Transportation & Warehousing | 54 (100.0%) | 0 (0.0%) |
| Utilities | 0 (0.0%) | 0 (0.0%) |
| Information | 34 (100.0%) | 0 (0.0%) |
| Finance & Insurance | 0 (0.0%) | 46 (100.0%) |
| Real Estate, Rental & Leasing | 8 (19.5%) | 33 (80.5%) |
| Professional & Scientific | 27 (61.4%) | 17 (38.6%) |
| Enterprise Management | 0 (0.0%) | 0 (0.0%) |
| Administrative & Support | 72 (100.0%) | 0 (0.0%) |
| Educational Services | 60 (42.5%) | 81 (57.5%) |
| Health Care & Social Assistance | 31 (10.9%) | 254 (89.1%) |
| Arts, Entertainment & Recreation | 30 (100.0%) | 0 (0.0%) |
| Accommodation & Food Services | 133 (71.5%) | 53 (28.5%) |
| Public Administration | 0 (0.0%) | 68 (100.0%) |
| Total | 863 (48.9%) | 903 (51.1%) |
Education in Nashville
School Enrollment in Nashville
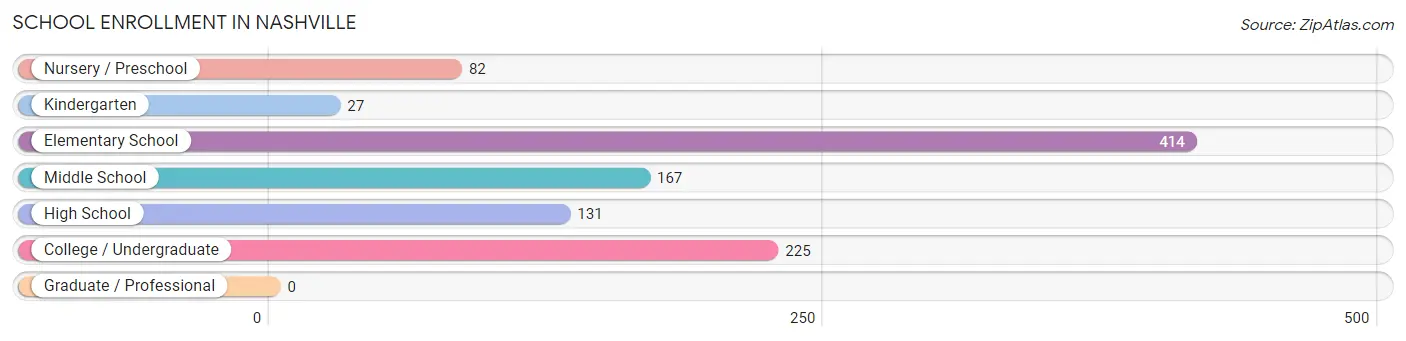
The most common levels of schooling among the 1,046 students in Nashville are elementary school (414 | 39.6%), college / undergraduate (225 | 21.5%), and middle school (167 | 16.0%).
| School Level | # Students | % Students |
| Nursery / Preschool | 82 | 7.8% |
| Kindergarten | 27 | 2.6% |
| Elementary School | 414 | 39.6% |
| Middle School | 167 | 16.0% |
| High School | 131 | 12.5% |
| College / Undergraduate | 225 | 21.5% |
| Graduate / Professional | 0 | 0.0% |
| Total | 1,046 | 100.0% |
School Enrollment by Age by Funding Source in Nashville
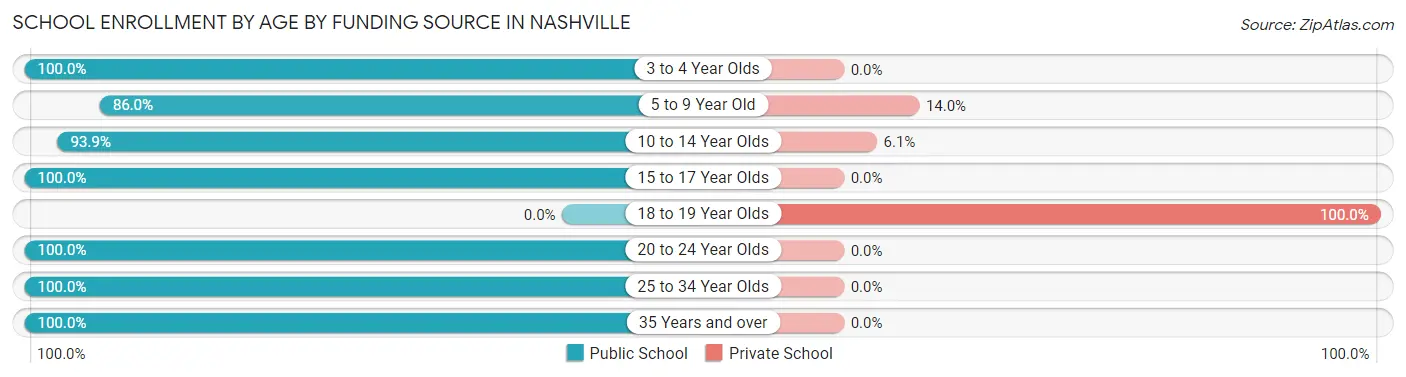
Out of a total of 1,046 students who are enrolled in schools in Nashville, 144 (13.8%) attend a private institution, while the remaining 902 (86.2%) are enrolled in public schools. The age group of 18 to 19 year olds has the highest likelihood of being enrolled in private schools, with 76 (100.0% in the age bracket) enrolled. Conversely, the age group of 3 to 4 year olds has the lowest likelihood of being enrolled in a private school, with 82 (100.0% in the age bracket) attending a public institution.
| Age Bracket | Public School | Private School |
| 3 to 4 Year Olds | 82 (100.0%) | 0 (0.0%) |
| 5 to 9 Year Old | 319 (86.0%) | 52 (14.0%) |
| 10 to 14 Year Olds | 245 (93.9%) | 16 (6.1%) |
| 15 to 17 Year Olds | 84 (100.0%) | 0 (0.0%) |
| 18 to 19 Year Olds | 0 (0.0%) | 76 (100.0%) |
| 20 to 24 Year Olds | 51 (100.0%) | 0 (0.0%) |
| 25 to 34 Year Olds | 110 (100.0%) | 0 (0.0%) |
| 35 Years and over | 11 (100.0%) | 0 (0.0%) |
| Total | 902 (86.2%) | 144 (13.8%) |
Educational Attainment by Field of Study in Nashville
Business (56 | 17.1%), education (42 | 12.8%), visual & performing arts (39 | 11.9%), psychology (29 | 8.8%), and bio, nature & agricultural (26 | 7.9%) are the most common fields of study among 328 individuals in Nashville who have obtained a bachelor's degree or higher.
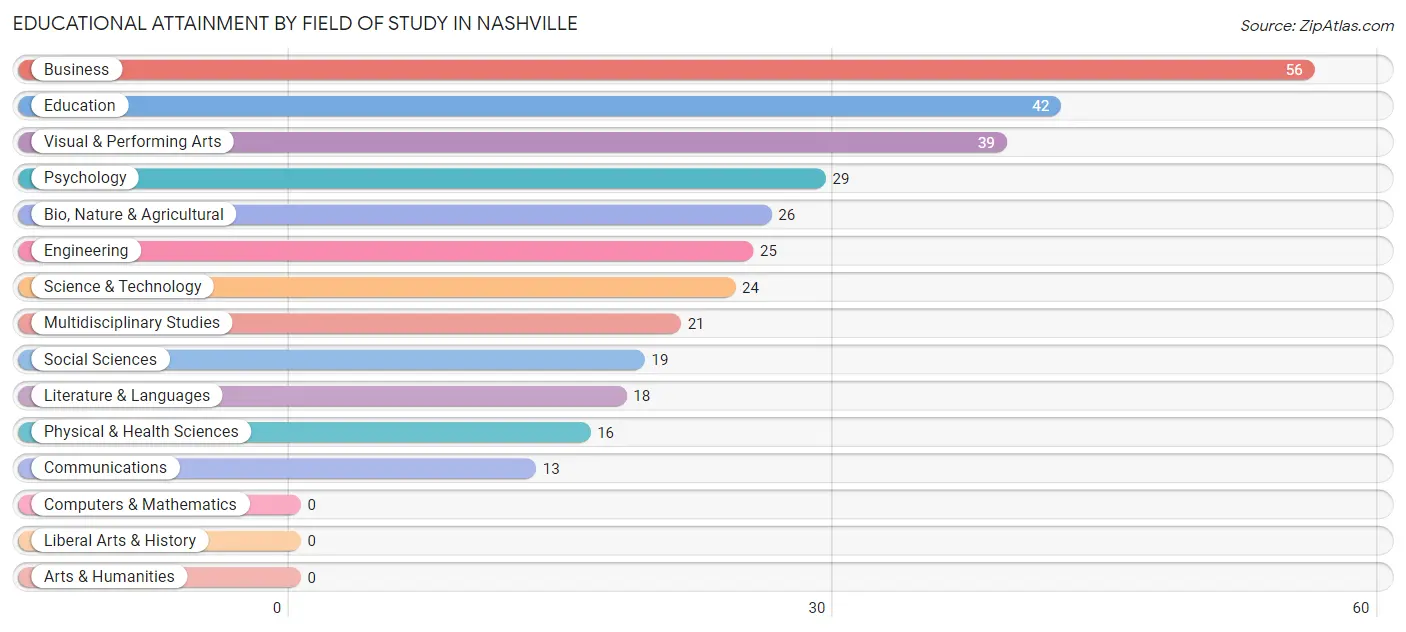
| Field of Study | # Graduates | % Graduates |
| Computers & Mathematics | 0 | 0.0% |
| Bio, Nature & Agricultural | 26 | 7.9% |
| Physical & Health Sciences | 16 | 4.9% |
| Psychology | 29 | 8.8% |
| Social Sciences | 19 | 5.8% |
| Engineering | 25 | 7.6% |
| Multidisciplinary Studies | 21 | 6.4% |
| Science & Technology | 24 | 7.3% |
| Business | 56 | 17.1% |
| Education | 42 | 12.8% |
| Literature & Languages | 18 | 5.5% |
| Liberal Arts & History | 0 | 0.0% |
| Visual & Performing Arts | 39 | 11.9% |
| Communications | 13 | 4.0% |
| Arts & Humanities | 0 | 0.0% |
| Total | 328 | 100.0% |
Transportation & Commute in Nashville
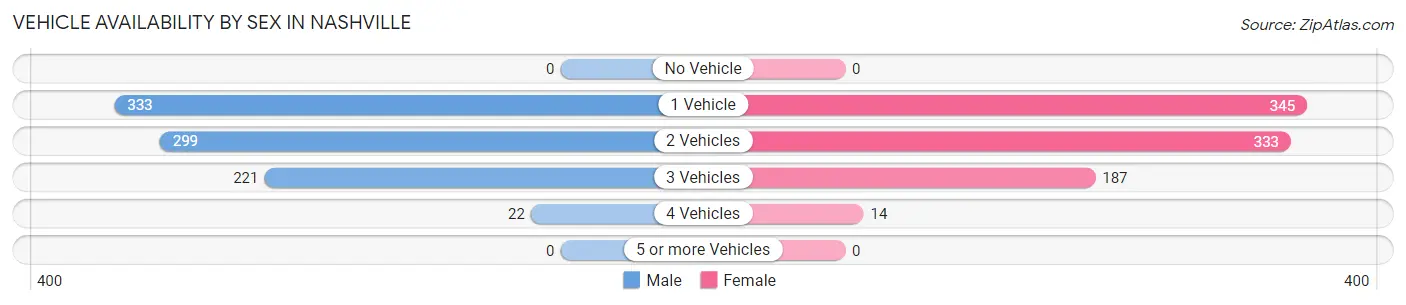
Vehicle Availability by Sex in Nashville
The most prevalent vehicle ownership categories in Nashville are males with 1 vehicle (333, accounting for 38.1%) and females with 1 vehicle (345, making up 37.9%).
| Vehicles Available | Male | Female |
| No Vehicle | 0 (0.0%) | 0 (0.0%) |
| 1 Vehicle | 333 (38.1%) | 345 (39.3%) |
| 2 Vehicles | 299 (34.2%) | 333 (37.9%) |
| 3 Vehicles | 221 (25.3%) | 187 (21.3%) |
| 4 Vehicles | 22 (2.5%) | 14 (1.6%) |
| 5 or more Vehicles | 0 (0.0%) | 0 (0.0%) |
| Total | 875 (100.0%) | 879 (100.0%) |
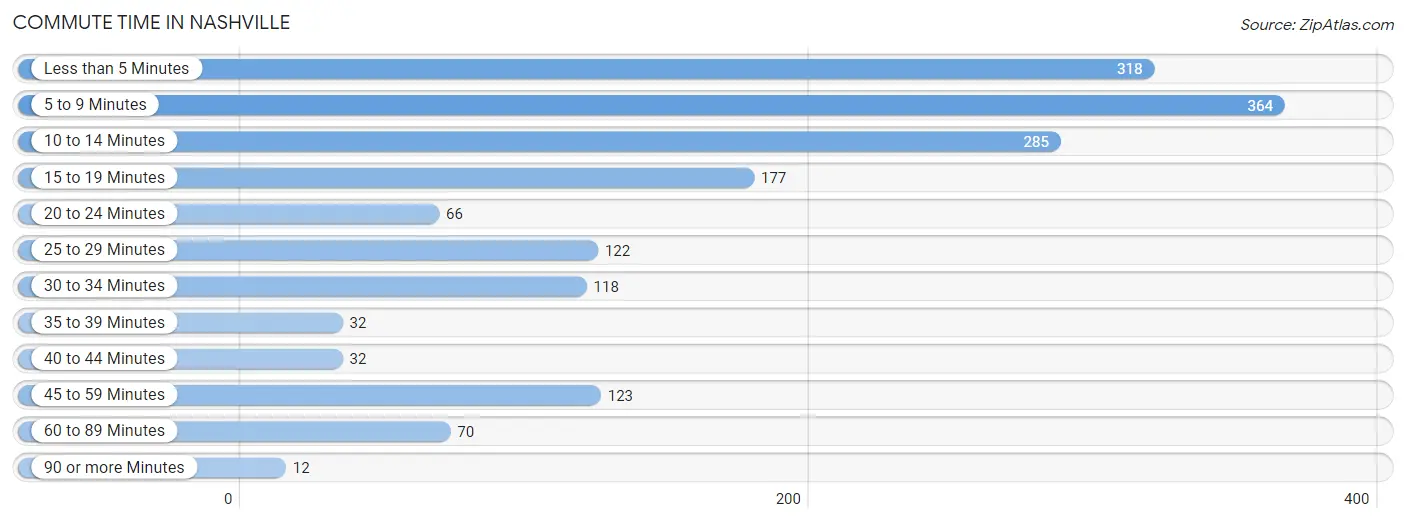
Commute Time in Nashville
The most frequently occuring commute durations in Nashville are 5 to 9 minutes (364 commuters, 21.2%), less than 5 minutes (318 commuters, 18.5%), and 10 to 14 minutes (285 commuters, 16.6%).
| Commute Time | # Commuters | % Commuters |
| Less than 5 Minutes | 318 | 18.5% |
| 5 to 9 Minutes | 364 | 21.2% |
| 10 to 14 Minutes | 285 | 16.6% |
| 15 to 19 Minutes | 177 | 10.3% |
| 20 to 24 Minutes | 66 | 3.8% |
| 25 to 29 Minutes | 122 | 7.1% |
| 30 to 34 Minutes | 118 | 6.9% |
| 35 to 39 Minutes | 32 | 1.9% |
| 40 to 44 Minutes | 32 | 1.9% |
| 45 to 59 Minutes | 123 | 7.2% |
| 60 to 89 Minutes | 70 | 4.1% |
| 90 or more Minutes | 12 | 0.7% |
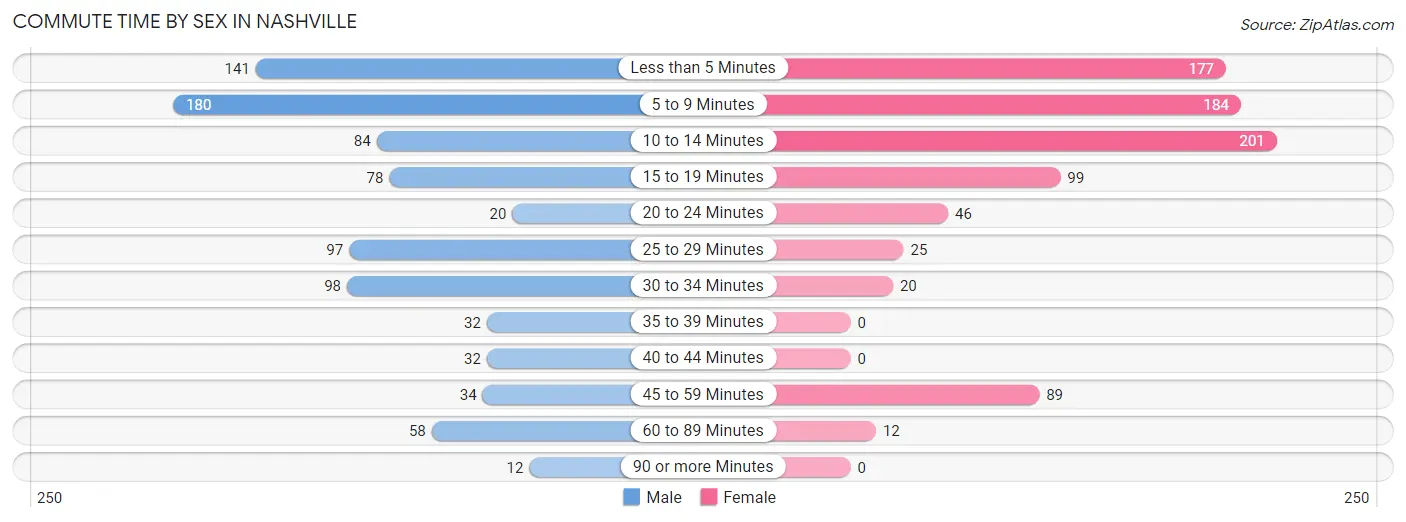
Commute Time by Sex in Nashville
The most common commute times in Nashville are 5 to 9 minutes (180 commuters, 20.8%) for males and 10 to 14 minutes (201 commuters, 23.6%) for females.
| Commute Time | Male | Female |
| Less than 5 Minutes | 141 (16.3%) | 177 (20.7%) |
| 5 to 9 Minutes | 180 (20.8%) | 184 (21.6%) |
| 10 to 14 Minutes | 84 (9.7%) | 201 (23.6%) |
| 15 to 19 Minutes | 78 (9.0%) | 99 (11.6%) |
| 20 to 24 Minutes | 20 (2.3%) | 46 (5.4%) |
| 25 to 29 Minutes | 97 (11.2%) | 25 (2.9%) |
| 30 to 34 Minutes | 98 (11.3%) | 20 (2.3%) |
| 35 to 39 Minutes | 32 (3.7%) | 0 (0.0%) |
| 40 to 44 Minutes | 32 (3.7%) | 0 (0.0%) |
| 45 to 59 Minutes | 34 (3.9%) | 89 (10.4%) |
| 60 to 89 Minutes | 58 (6.7%) | 12 (1.4%) |
| 90 or more Minutes | 12 (1.4%) | 0 (0.0%) |
Time of Departure to Work by Sex in Nashville
The most frequent times of departure to work in Nashville are 7:00 AM to 7:29 AM (190, 21.9%) for males and 6:30 AM to 6:59 AM (189, 22.2%) for females.
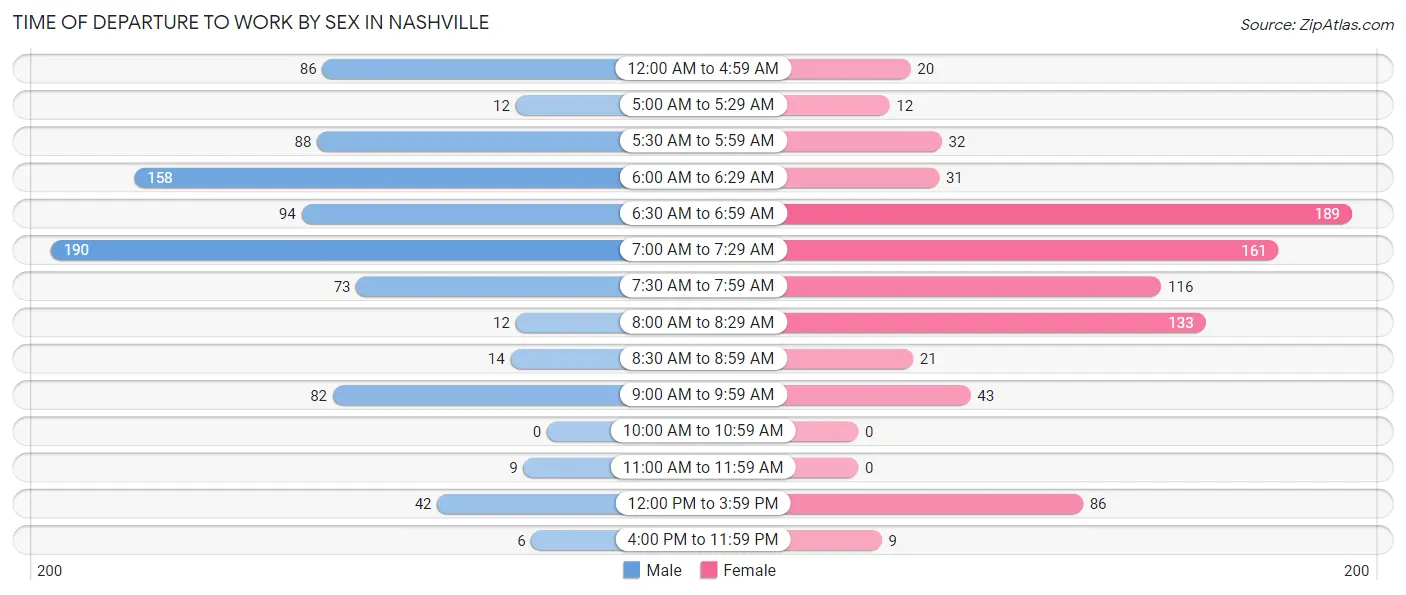
| Time of Departure | Male | Female |
| 12:00 AM to 4:59 AM | 86 (9.9%) | 20 (2.3%) |
| 5:00 AM to 5:29 AM | 12 (1.4%) | 12 (1.4%) |
| 5:30 AM to 5:59 AM | 88 (10.2%) | 32 (3.7%) |
| 6:00 AM to 6:29 AM | 158 (18.2%) | 31 (3.6%) |
| 6:30 AM to 6:59 AM | 94 (10.8%) | 189 (22.2%) |
| 7:00 AM to 7:29 AM | 190 (21.9%) | 161 (18.9%) |
| 7:30 AM to 7:59 AM | 73 (8.4%) | 116 (13.6%) |
| 8:00 AM to 8:29 AM | 12 (1.4%) | 133 (15.6%) |
| 8:30 AM to 8:59 AM | 14 (1.6%) | 21 (2.5%) |
| 9:00 AM to 9:59 AM | 82 (9.5%) | 43 (5.0%) |
| 10:00 AM to 10:59 AM | 0 (0.0%) | 0 (0.0%) |
| 11:00 AM to 11:59 AM | 9 (1.0%) | 0 (0.0%) |
| 12:00 PM to 3:59 PM | 42 (4.9%) | 86 (10.1%) |
| 4:00 PM to 11:59 PM | 6 (0.7%) | 9 (1.1%) |
| Total | 866 (100.0%) | 853 (100.0%) |
Housing Occupancy in Nashville
Occupancy by Ownership in Nashville
Of the total 1,808 dwellings in Nashville, owner-occupied units account for 957 (52.9%), while renter-occupied units make up 851 (47.1%).
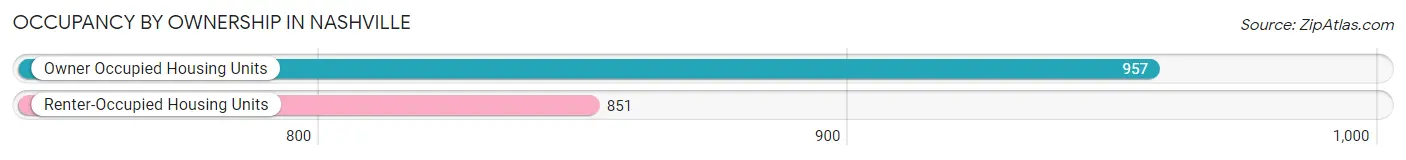
| Occupancy | # Housing Units | % Housing Units |
| Owner Occupied Housing Units | 957 | 52.9% |
| Renter-Occupied Housing Units | 851 | 47.1% |
| Total Occupied Housing Units | 1,808 | 100.0% |
Occupancy by Household Size in Nashville
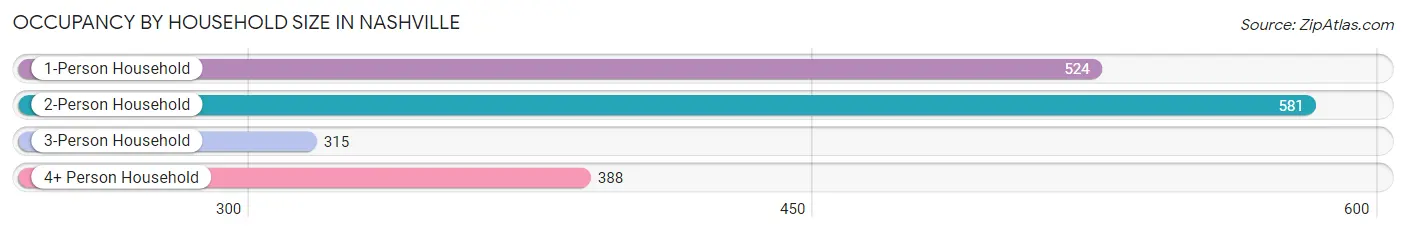
| Household Size | # Housing Units | % Housing Units |
| 1-Person Household | 524 | 29.0% |
| 2-Person Household | 581 | 32.1% |
| 3-Person Household | 315 | 17.4% |
| 4+ Person Household | 388 | 21.5% |
| Total Housing Units | 1,808 | 100.0% |
Occupancy by Ownership by Household Size in Nashville
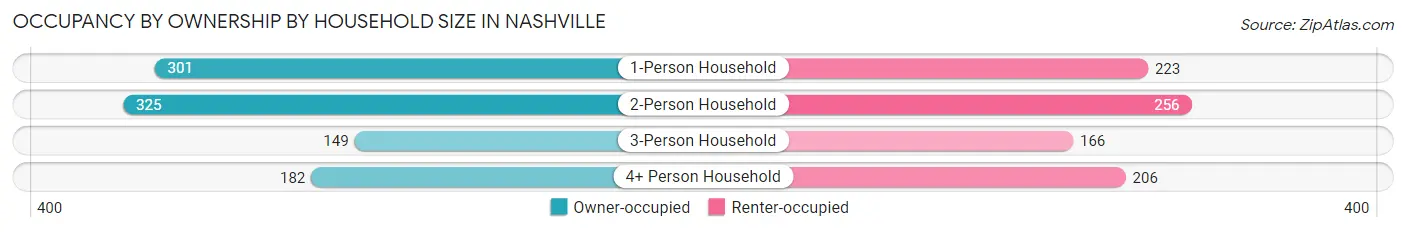
| Household Size | Owner-occupied | Renter-occupied |
| 1-Person Household | 301 (57.4%) | 223 (42.6%) |
| 2-Person Household | 325 (55.9%) | 256 (44.1%) |
| 3-Person Household | 149 (47.3%) | 166 (52.7%) |
| 4+ Person Household | 182 (46.9%) | 206 (53.1%) |
| Total Housing Units | 957 (52.9%) | 851 (47.1%) |
Occupancy by Educational Attainment in Nashville
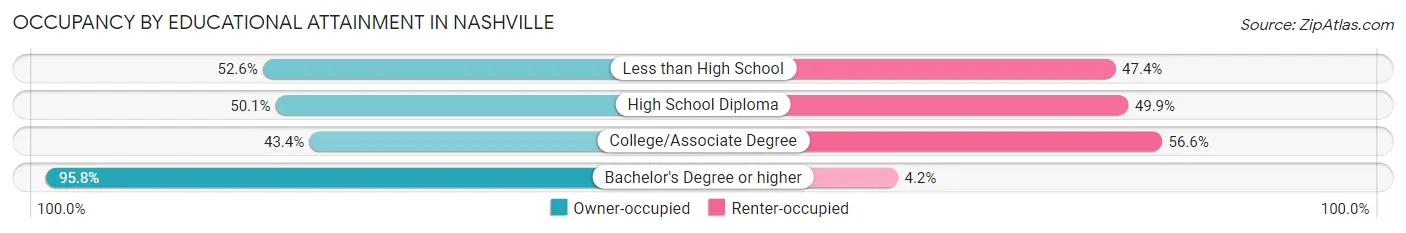
| Household Size | Owner-occupied | Renter-occupied |
| Less than High School | 291 (52.6%) | 262 (47.4%) |
| High School Diploma | 261 (50.1%) | 260 (49.9%) |
| College/Associate Degree | 247 (43.4%) | 322 (56.6%) |
| Bachelor's Degree or higher | 158 (95.8%) | 7 (4.2%) |
Occupancy by Age of Householder in Nashville
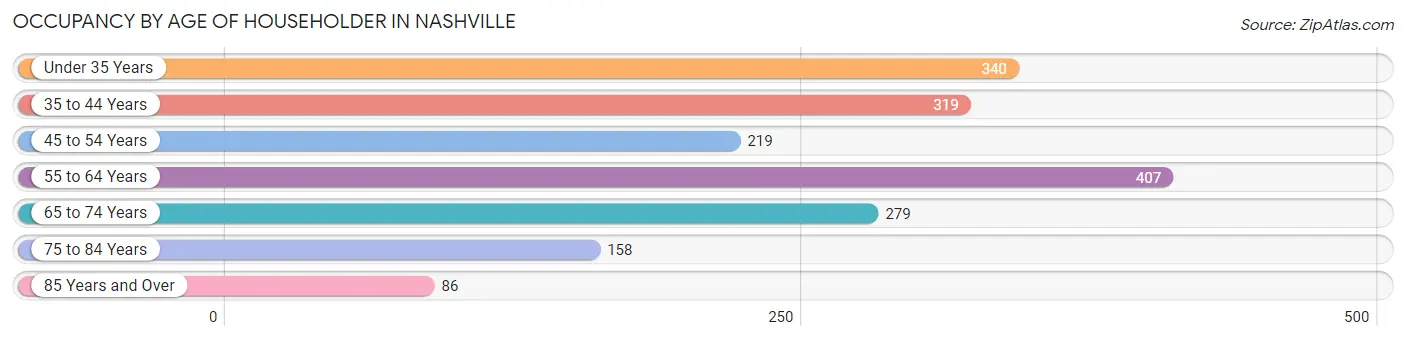
| Age Bracket | # Households | % Households |
| Under 35 Years | 340 | 18.8% |
| 35 to 44 Years | 319 | 17.6% |
| 45 to 54 Years | 219 | 12.1% |
| 55 to 64 Years | 407 | 22.5% |
| 65 to 74 Years | 279 | 15.4% |
| 75 to 84 Years | 158 | 8.7% |
| 85 Years and Over | 86 | 4.8% |
| Total | 1,808 | 100.0% |
Housing Finances in Nashville
Median Income by Occupancy in Nashville
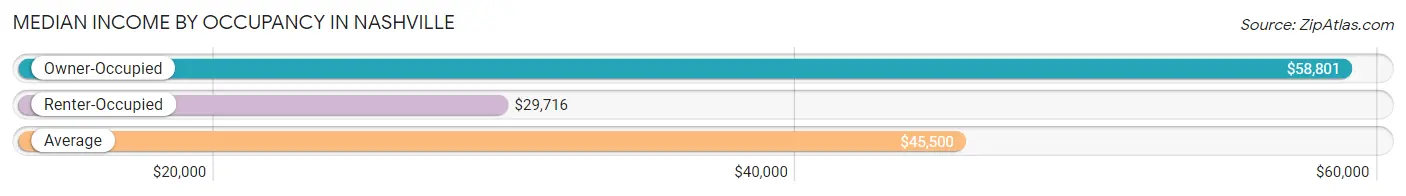
| Occupancy Type | # Households | Median Income |
| Owner-Occupied | 957 (52.9%) | $58,801 |
| Renter-Occupied | 851 (47.1%) | $29,716 |
| Average | 1,808 (100.0%) | $45,500 |
Occupancy by Householder Income Bracket in Nashville
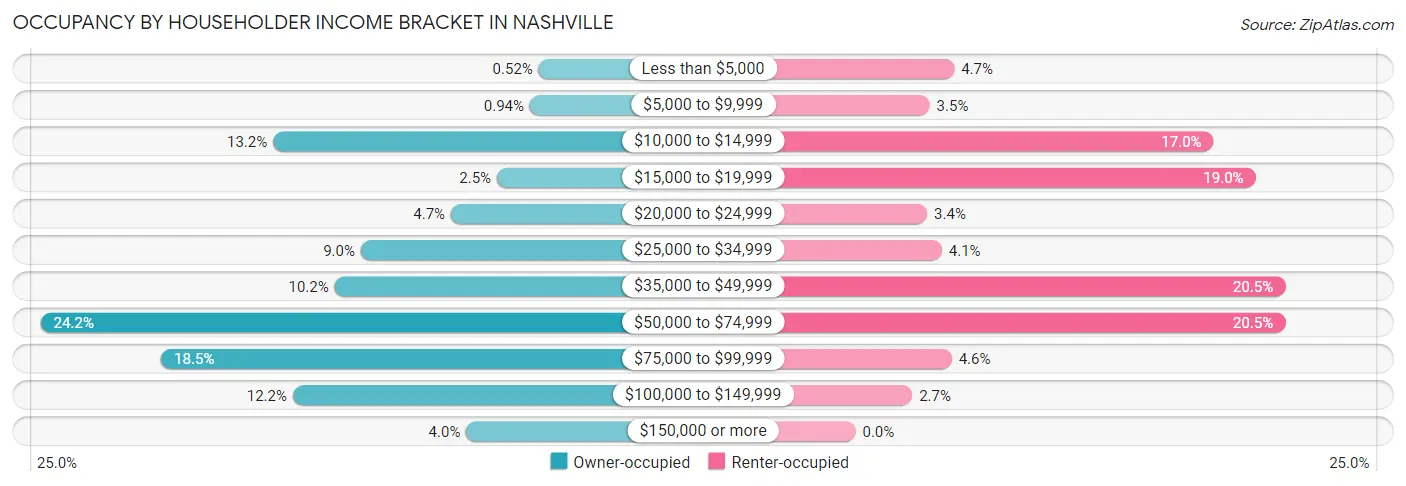
| Income Bracket | Owner-occupied | Renter-occupied |
| Less than $5,000 | 5 (0.5%) | 40 (4.7%) |
| $5,000 to $9,999 | 9 (0.9%) | 30 (3.5%) |
| $10,000 to $14,999 | 126 (13.2%) | 145 (17.0%) |
| $15,000 to $19,999 | 24 (2.5%) | 162 (19.0%) |
| $20,000 to $24,999 | 45 (4.7%) | 29 (3.4%) |
| $25,000 to $34,999 | 86 (9.0%) | 35 (4.1%) |
| $35,000 to $49,999 | 98 (10.2%) | 174 (20.4%) |
| $50,000 to $74,999 | 232 (24.2%) | 174 (20.4%) |
| $75,000 to $99,999 | 177 (18.5%) | 39 (4.6%) |
| $100,000 to $149,999 | 117 (12.2%) | 23 (2.7%) |
| $150,000 or more | 38 (4.0%) | 0 (0.0%) |
| Total | 957 (100.0%) | 851 (100.0%) |
Monthly Housing Cost Tiers in Nashville
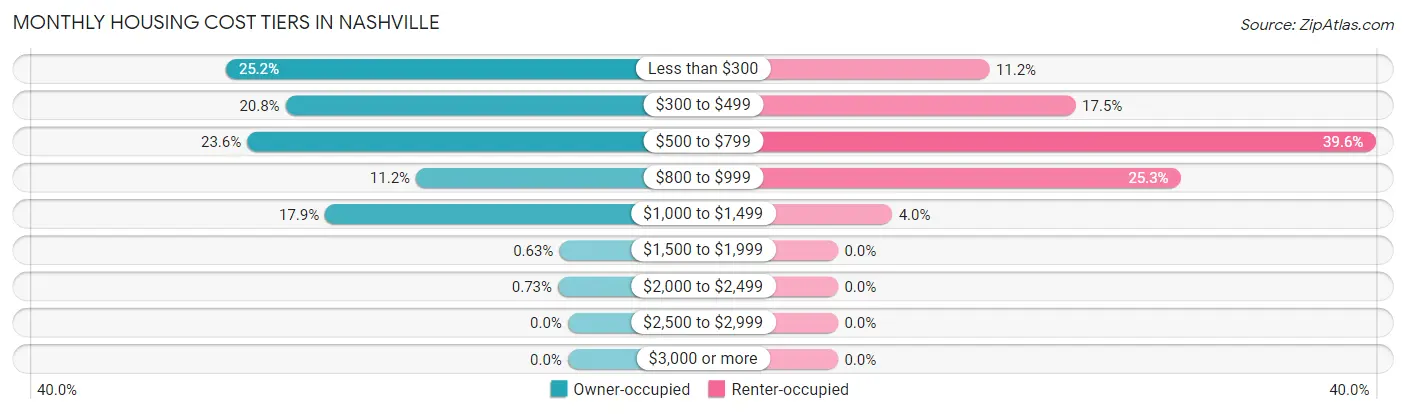
| Monthly Cost | Owner-occupied | Renter-occupied |
| Less than $300 | 241 (25.2%) | 95 (11.2%) |
| $300 to $499 | 199 (20.8%) | 149 (17.5%) |
| $500 to $799 | 226 (23.6%) | 337 (39.6%) |
| $800 to $999 | 107 (11.2%) | 215 (25.3%) |
| $1,000 to $1,499 | 171 (17.9%) | 34 (4.0%) |
| $1,500 to $1,999 | 6 (0.6%) | 0 (0.0%) |
| $2,000 to $2,499 | 7 (0.7%) | 0 (0.0%) |
| $2,500 to $2,999 | 0 (0.0%) | 0 (0.0%) |
| $3,000 or more | 0 (0.0%) | 0 (0.0%) |
| Total | 957 (100.0%) | 851 (100.0%) |
Physical Housing Characteristics in Nashville
Housing Structures in Nashville
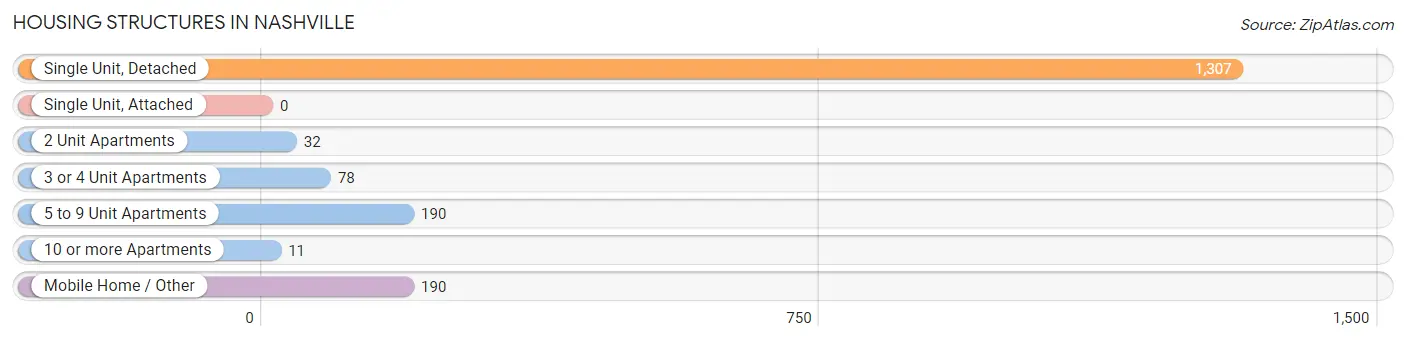
| Structure Type | # Housing Units | % Housing Units |
| Single Unit, Detached | 1,307 | 72.3% |
| Single Unit, Attached | 0 | 0.0% |
| 2 Unit Apartments | 32 | 1.8% |
| 3 or 4 Unit Apartments | 78 | 4.3% |
| 5 to 9 Unit Apartments | 190 | 10.5% |
| 10 or more Apartments | 11 | 0.6% |
| Mobile Home / Other | 190 | 10.5% |
| Total | 1,808 | 100.0% |
Housing Structures by Occupancy in Nashville
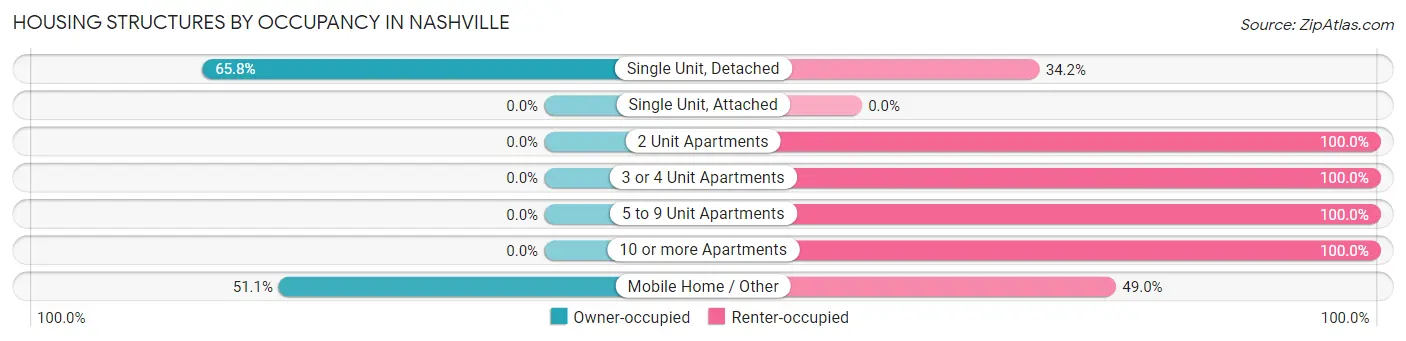
| Structure Type | Owner-occupied | Renter-occupied |
| Single Unit, Detached | 860 (65.8%) | 447 (34.2%) |
| Single Unit, Attached | 0 (0.0%) | 0 (0.0%) |
| 2 Unit Apartments | 0 (0.0%) | 32 (100.0%) |
| 3 or 4 Unit Apartments | 0 (0.0%) | 78 (100.0%) |
| 5 to 9 Unit Apartments | 0 (0.0%) | 190 (100.0%) |
| 10 or more Apartments | 0 (0.0%) | 11 (100.0%) |
| Mobile Home / Other | 97 (51.0%) | 93 (48.9%) |
| Total | 957 (52.9%) | 851 (47.1%) |
Housing Structures by Number of Rooms in Nashville
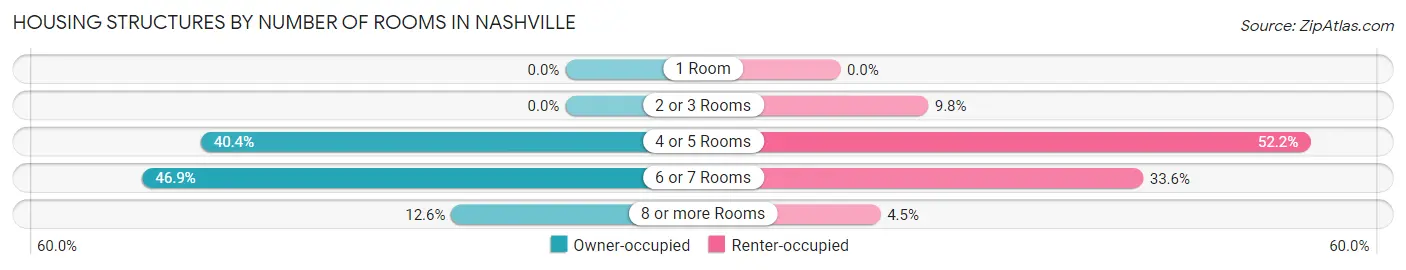
| Number of Rooms | Owner-occupied | Renter-occupied |
| 1 Room | 0 (0.0%) | 0 (0.0%) |
| 2 or 3 Rooms | 0 (0.0%) | 83 (9.8%) |
| 4 or 5 Rooms | 387 (40.4%) | 444 (52.2%) |
| 6 or 7 Rooms | 449 (46.9%) | 286 (33.6%) |
| 8 or more Rooms | 121 (12.6%) | 38 (4.5%) |
| Total | 957 (100.0%) | 851 (100.0%) |
Housing Structure by Heating Type in Nashville
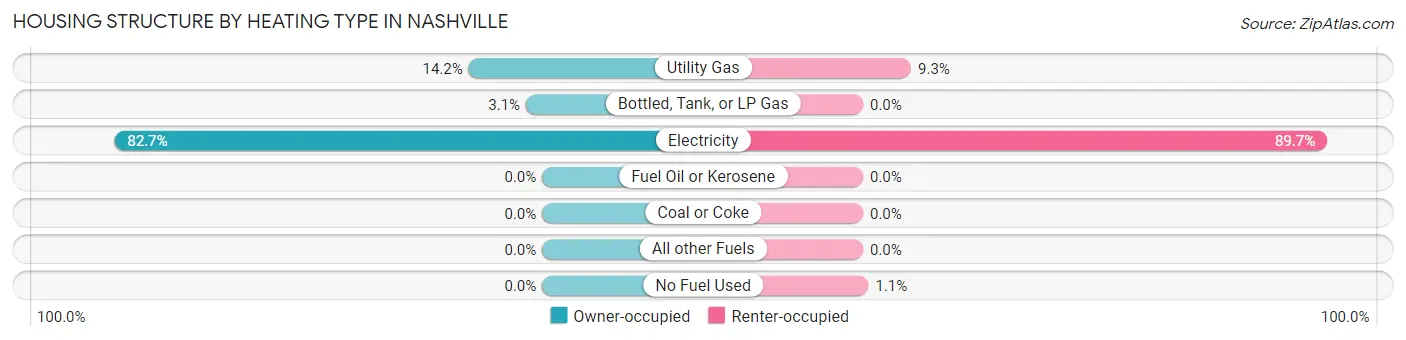
| Heating Type | Owner-occupied | Renter-occupied |
| Utility Gas | 136 (14.2%) | 79 (9.3%) |
| Bottled, Tank, or LP Gas | 30 (3.1%) | 0 (0.0%) |
| Electricity | 791 (82.7%) | 763 (89.7%) |
| Fuel Oil or Kerosene | 0 (0.0%) | 0 (0.0%) |
| Coal or Coke | 0 (0.0%) | 0 (0.0%) |
| All other Fuels | 0 (0.0%) | 0 (0.0%) |
| No Fuel Used | 0 (0.0%) | 9 (1.1%) |
| Total | 957 (100.0%) | 851 (100.0%) |
Household Vehicle Usage in Nashville
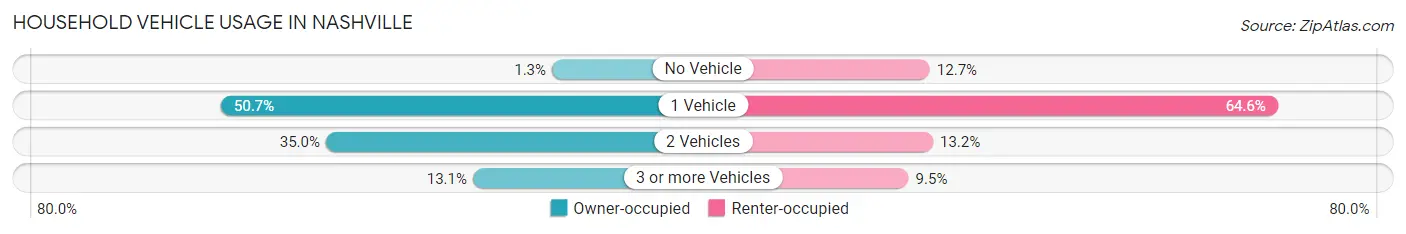
| Vehicles per Household | Owner-occupied | Renter-occupied |
| No Vehicle | 12 (1.3%) | 108 (12.7%) |
| 1 Vehicle | 485 (50.7%) | 550 (64.6%) |
| 2 Vehicles | 335 (35.0%) | 112 (13.2%) |
| 3 or more Vehicles | 125 (13.1%) | 81 (9.5%) |
| Total | 957 (100.0%) | 851 (100.0%) |
Real Estate & Mortgages in Nashville
Real Estate and Mortgage Overview in Nashville
| Characteristic | Without Mortgage | With Mortgage |
| Housing Units | 586 | 371 |
| Median Property Value | $84,800 | $111,800 |
| Median Household Income | $50,536 | $25 |
| Monthly Housing Costs | $371 | $0 |
| Real Estate Taxes | $836 | $11 |
Property Value by Mortgage Status in Nashville
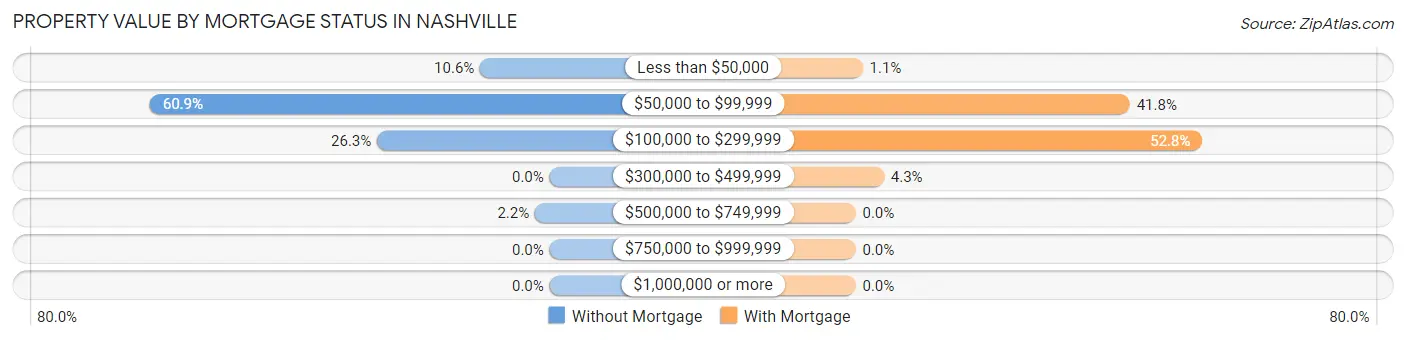
| Property Value | Without Mortgage | With Mortgage |
| Less than $50,000 | 62 (10.6%) | 4 (1.1%) |
| $50,000 to $99,999 | 357 (60.9%) | 155 (41.8%) |
| $100,000 to $299,999 | 154 (26.3%) | 196 (52.8%) |
| $300,000 to $499,999 | 0 (0.0%) | 16 (4.3%) |
| $500,000 to $749,999 | 13 (2.2%) | 0 (0.0%) |
| $750,000 to $999,999 | 0 (0.0%) | 0 (0.0%) |
| $1,000,000 or more | 0 (0.0%) | 0 (0.0%) |
| Total | 586 (100.0%) | 371 (100.0%) |
Household Income by Mortgage Status in Nashville
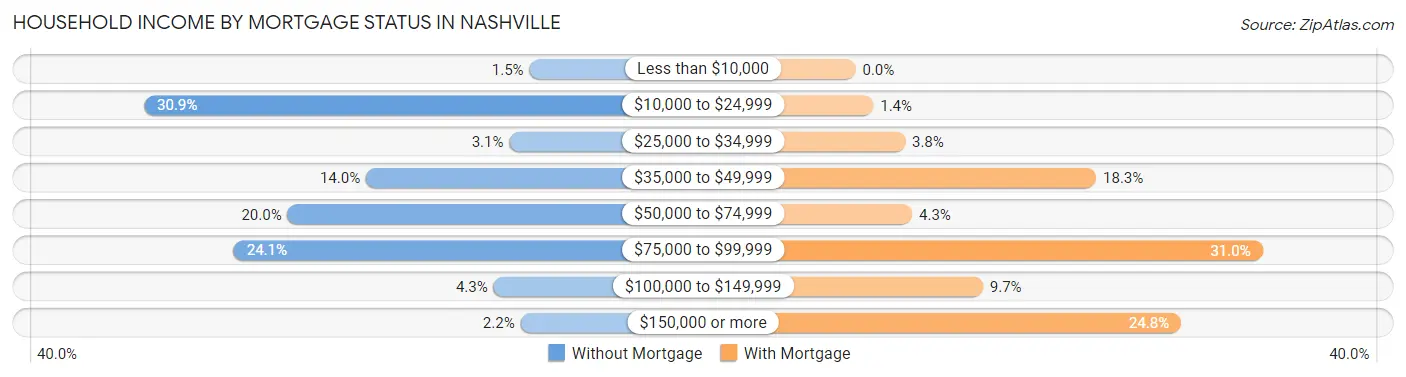
| Household Income | Without Mortgage | With Mortgage |
| Less than $10,000 | 9 (1.5%) | 0 (0.0%) |
| $10,000 to $24,999 | 181 (30.9%) | 5 (1.3%) |
| $25,000 to $34,999 | 18 (3.1%) | 14 (3.8%) |
| $35,000 to $49,999 | 82 (14.0%) | 68 (18.3%) |
| $50,000 to $74,999 | 117 (20.0%) | 16 (4.3%) |
| $75,000 to $99,999 | 141 (24.1%) | 115 (31.0%) |
| $100,000 to $149,999 | 25 (4.3%) | 36 (9.7%) |
| $150,000 or more | 13 (2.2%) | 92 (24.8%) |
| Total | 586 (100.0%) | 371 (100.0%) |
Property Value to Household Income Ratio in Nashville
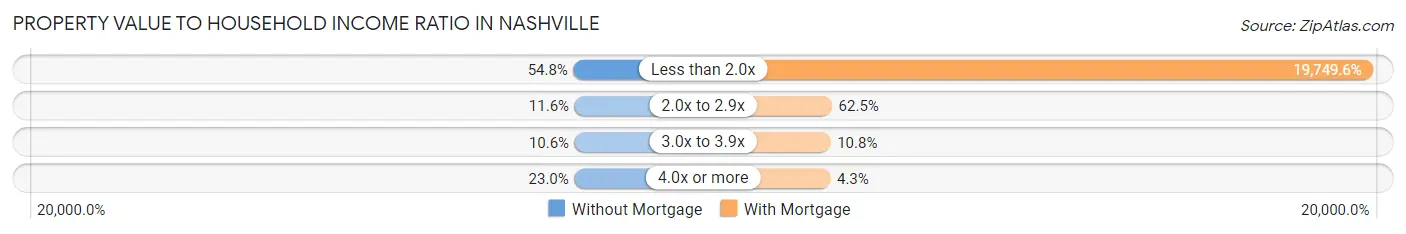
| Value-to-Income Ratio | Without Mortgage | With Mortgage |
| Less than 2.0x | 321 (54.8%) | 73,271 (19,749.6%) |
| 2.0x to 2.9x | 68 (11.6%) | 232 (62.5%) |
| 3.0x to 3.9x | 62 (10.6%) | 40 (10.8%) |
| 4.0x or more | 135 (23.0%) | 16 (4.3%) |
| Total | 586 (100.0%) | 371 (100.0%) |
Real Estate Taxes by Mortgage Status in Nashville
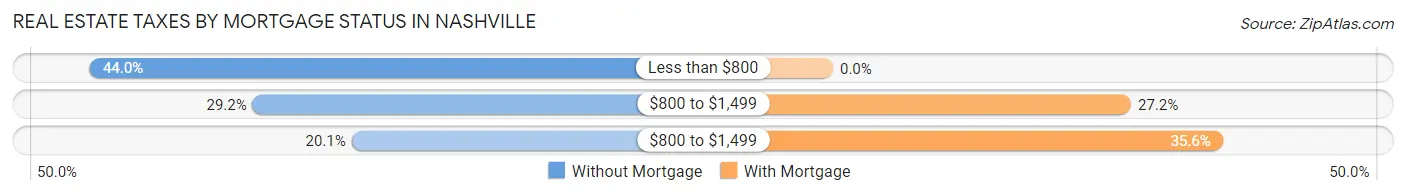
| Property Taxes | Without Mortgage | With Mortgage |
| Less than $800 | 258 (44.0%) | 0 (0.0%) |
| $800 to $1,499 | 171 (29.2%) | 101 (27.2%) |
| $800 to $1,499 | 118 (20.1%) | 132 (35.6%) |
| Total | 586 (100.0%) | 371 (100.0%) |
Health & Disability in Nashville
Health Insurance Coverage by Age in Nashville
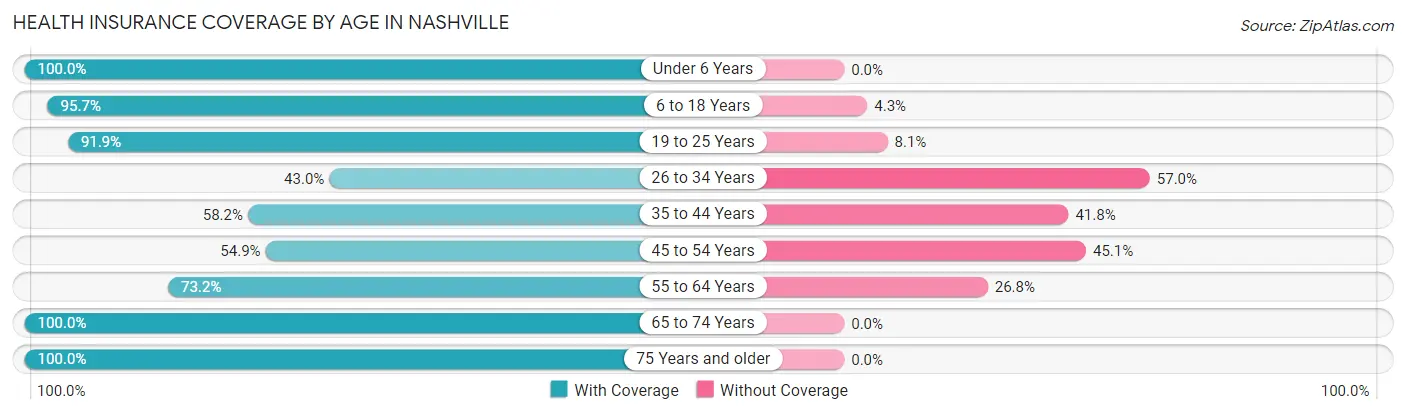
| Age Bracket | With Coverage | Without Coverage |
| Under 6 Years | 449 (100.0%) | 0 (0.0%) |
| 6 to 18 Years | 868 (95.7%) | 39 (4.3%) |
| 19 to 25 Years | 205 (91.9%) | 18 (8.1%) |
| 26 to 34 Years | 296 (43.0%) | 392 (57.0%) |
| 35 to 44 Years | 327 (58.2%) | 235 (41.8%) |
| 45 to 54 Years | 235 (54.9%) | 193 (45.1%) |
| 55 to 64 Years | 457 (73.2%) | 167 (26.8%) |
| 65 to 74 Years | 501 (100.0%) | 0 (0.0%) |
| 75 Years and older | 331 (100.0%) | 0 (0.0%) |
| Total | 3,669 (77.8%) | 1,044 (22.2%) |
Health Insurance Coverage by Citizenship Status in Nashville
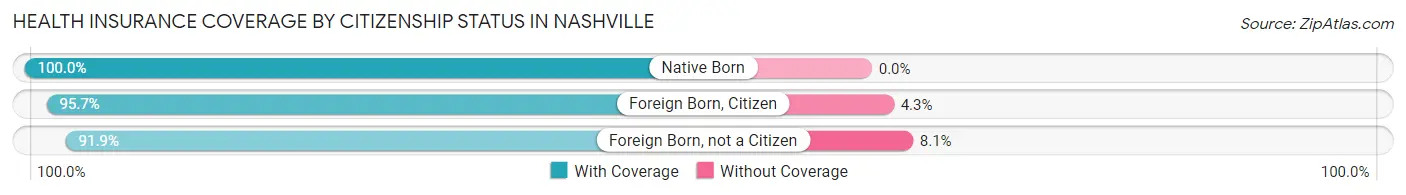
| Citizenship Status | With Coverage | Without Coverage |
| Native Born | 449 (100.0%) | 0 (0.0%) |
| Foreign Born, Citizen | 868 (95.7%) | 39 (4.3%) |
| Foreign Born, not a Citizen | 205 (91.9%) | 18 (8.1%) |
Health Insurance Coverage by Household Income in Nashville
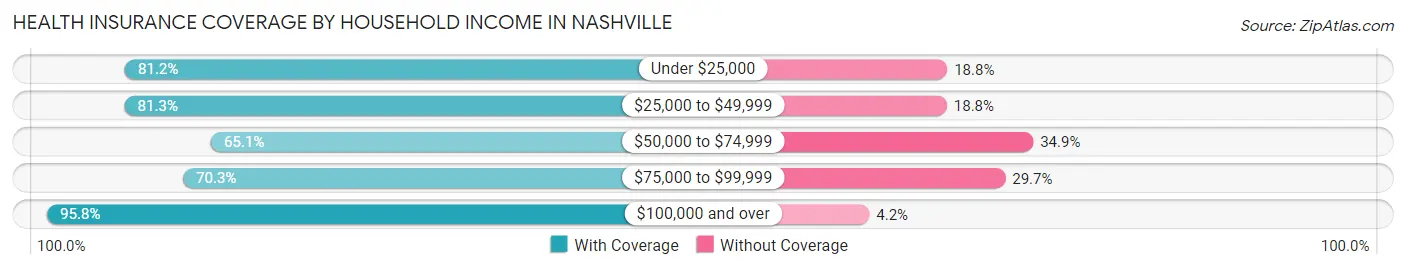
| Household Income | With Coverage | Without Coverage |
| Under $25,000 | 867 (81.2%) | 201 (18.8%) |
| $25,000 to $49,999 | 858 (81.2%) | 198 (18.8%) |
| $50,000 to $74,999 | 868 (65.1%) | 466 (34.9%) |
| $75,000 to $99,999 | 348 (70.3%) | 147 (29.7%) |
| $100,000 and over | 726 (95.8%) | 32 (4.2%) |
Public vs Private Health Insurance Coverage by Age in Nashville
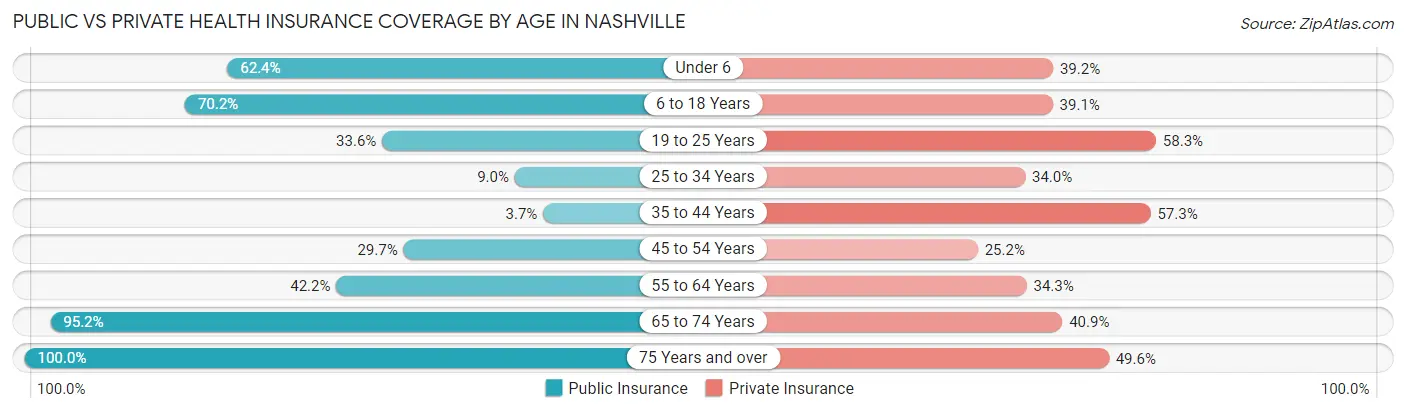
| Age Bracket | Public Insurance | Private Insurance |
| Under 6 | 280 (62.4%) | 176 (39.2%) |
| 6 to 18 Years | 637 (70.2%) | 355 (39.1%) |
| 19 to 25 Years | 75 (33.6%) | 130 (58.3%) |
| 25 to 34 Years | 62 (9.0%) | 234 (34.0%) |
| 35 to 44 Years | 21 (3.7%) | 322 (57.3%) |
| 45 to 54 Years | 127 (29.7%) | 108 (25.2%) |
| 55 to 64 Years | 263 (42.1%) | 214 (34.3%) |
| 65 to 74 Years | 477 (95.2%) | 205 (40.9%) |
| 75 Years and over | 331 (100.0%) | 164 (49.5%) |
| Total | 2,273 (48.2%) | 1,908 (40.5%) |
Disability Status by Sex by Age in Nashville
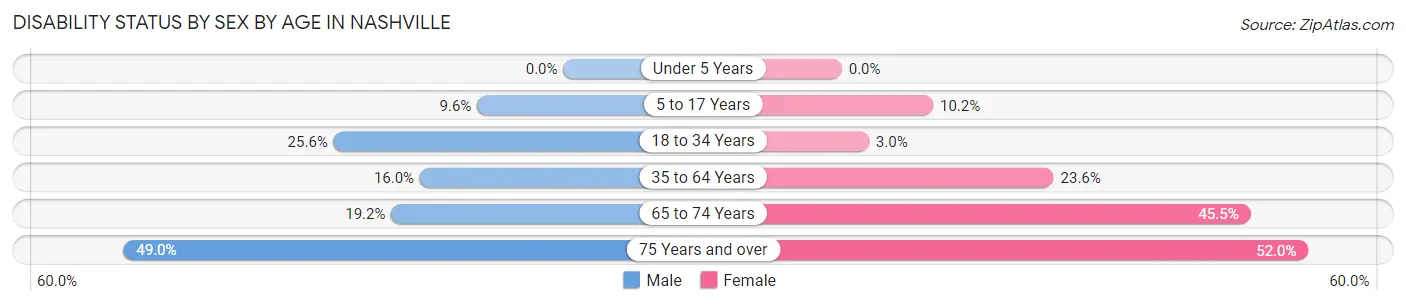
| Age Bracket | Male | Female |
| Under 5 Years | 0 (0.0%) | 0 (0.0%) |
| 5 to 17 Years | 36 (9.6%) | 39 (10.2%) |
| 18 to 34 Years | 122 (25.6%) | 18 (3.0%) |
| 35 to 64 Years | 119 (16.0%) | 205 (23.6%) |
| 65 to 74 Years | 32 (19.2%) | 152 (45.5%) |
| 75 Years and over | 49 (49.0%) | 120 (51.9%) |
Disability Class by Sex by Age in Nashville
Disability Class: Hearing Difficulty
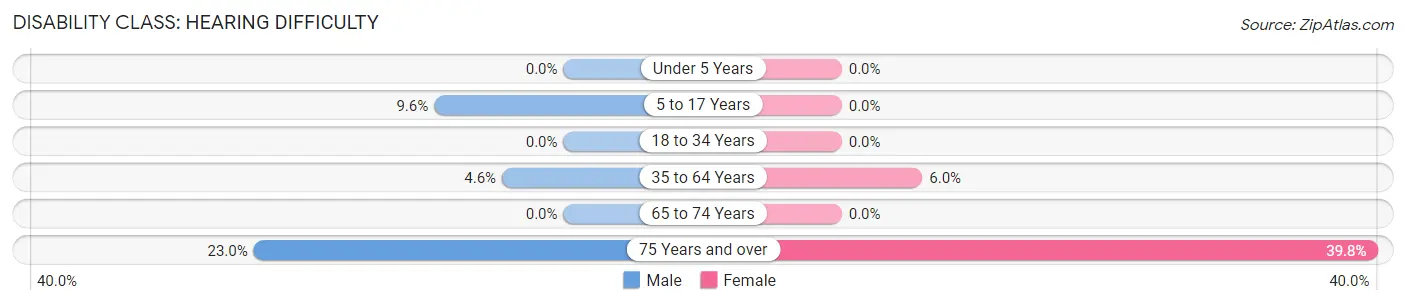
| Age Bracket | Male | Female |
| Under 5 Years | 0 (0.0%) | 0 (0.0%) |
| 5 to 17 Years | 36 (9.6%) | 0 (0.0%) |
| 18 to 34 Years | 0 (0.0%) | 0 (0.0%) |
| 35 to 64 Years | 34 (4.6%) | 52 (6.0%) |
| 65 to 74 Years | 0 (0.0%) | 0 (0.0%) |
| 75 Years and over | 23 (23.0%) | 92 (39.8%) |
Disability Class: Vision Difficulty
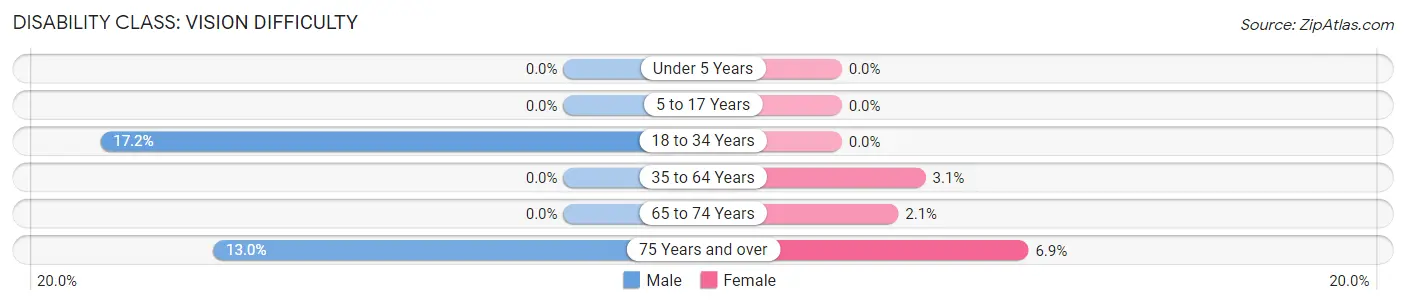
| Age Bracket | Male | Female |
| Under 5 Years | 0 (0.0%) | 0 (0.0%) |
| 5 to 17 Years | 0 (0.0%) | 0 (0.0%) |
| 18 to 34 Years | 82 (17.2%) | 0 (0.0%) |
| 35 to 64 Years | 0 (0.0%) | 27 (3.1%) |
| 65 to 74 Years | 0 (0.0%) | 7 (2.1%) |
| 75 Years and over | 13 (13.0%) | 16 (6.9%) |
Disability Class: Cognitive Difficulty
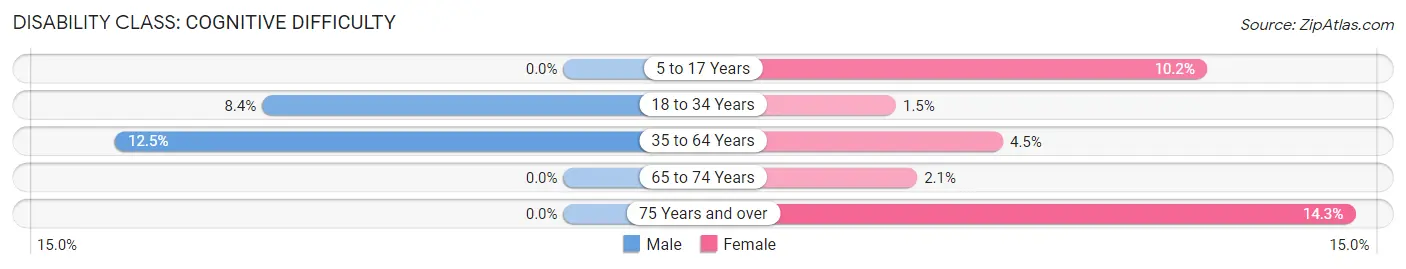
| Age Bracket | Male | Female |
| 5 to 17 Years | 0 (0.0%) | 39 (10.2%) |
| 18 to 34 Years | 40 (8.4%) | 9 (1.5%) |
| 35 to 64 Years | 93 (12.5%) | 39 (4.5%) |
| 65 to 74 Years | 0 (0.0%) | 7 (2.1%) |
| 75 Years and over | 0 (0.0%) | 33 (14.3%) |
Disability Class: Ambulatory Difficulty
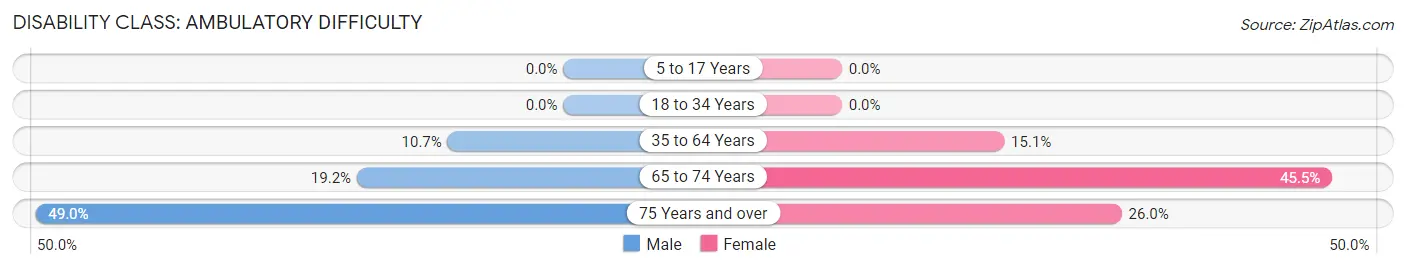
| Age Bracket | Male | Female |
| 5 to 17 Years | 0 (0.0%) | 0 (0.0%) |
| 18 to 34 Years | 0 (0.0%) | 0 (0.0%) |
| 35 to 64 Years | 80 (10.7%) | 131 (15.1%) |
| 65 to 74 Years | 32 (19.2%) | 152 (45.5%) |
| 75 Years and over | 49 (49.0%) | 60 (26.0%) |
Disability Class: Self-Care Difficulty
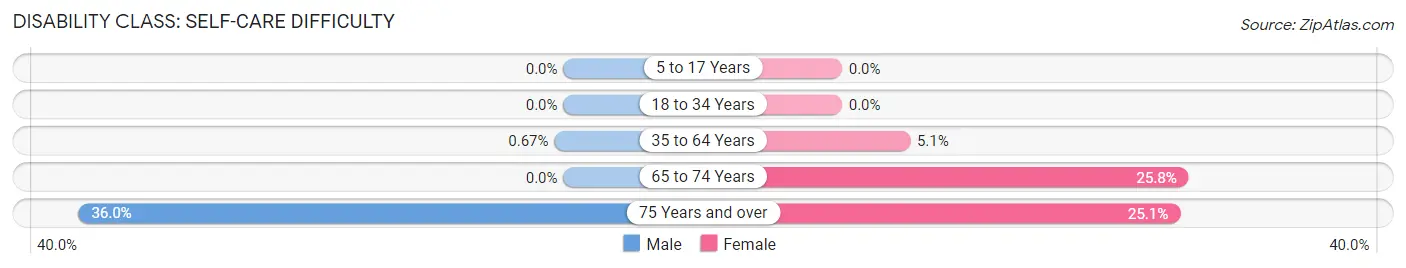
| Age Bracket | Male | Female |
| 5 to 17 Years | 0 (0.0%) | 0 (0.0%) |
| 18 to 34 Years | 0 (0.0%) | 0 (0.0%) |
| 35 to 64 Years | 5 (0.7%) | 44 (5.1%) |
| 65 to 74 Years | 0 (0.0%) | 86 (25.8%) |
| 75 Years and over | 36 (36.0%) | 58 (25.1%) |
Technology Access in Nashville
Computing Device Access in Nashville
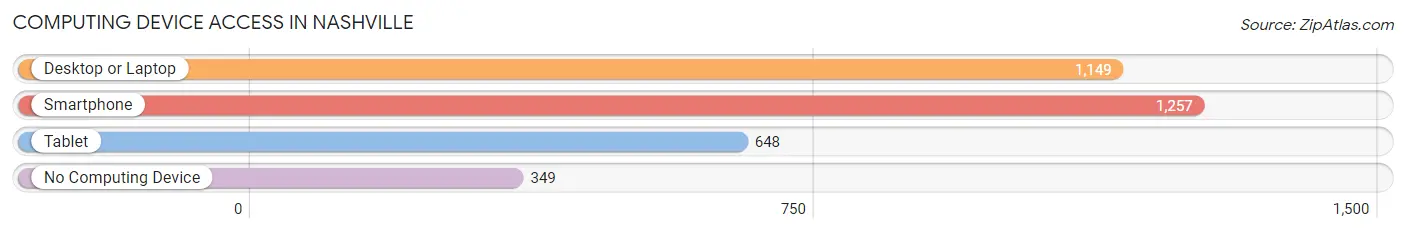
| Device Type | # Households | % Households |
| Desktop or Laptop | 1,149 | 63.5% |
| Smartphone | 1,257 | 69.5% |
| Tablet | 648 | 35.8% |
| No Computing Device | 349 | 19.3% |
| Total | 1,808 | 100.0% |
Internet Access in Nashville
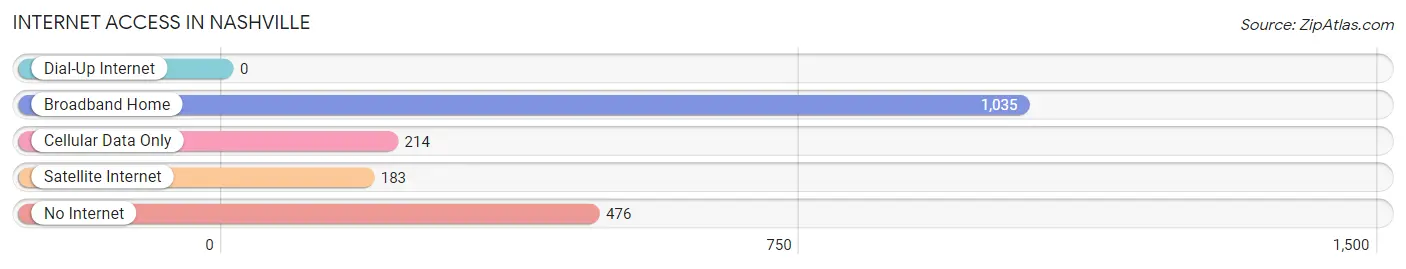
| Internet Type | # Households | % Households |
| Dial-Up Internet | 0 | 0.0% |
| Broadband Home | 1,035 | 57.3% |
| Cellular Data Only | 214 | 11.8% |
| Satellite Internet | 183 | 10.1% |
| No Internet | 476 | 26.3% |
| Total | 1,808 | 100.0% |
Nashville Summary
Nashville, Georgia is a small town located in Berrien County, in the south-central part of the state. It is situated on the banks of the Alapaha River, about 30 miles from the Florida border. The town was founded in 1836 and named after General Francis Nash, a Revolutionary War hero. Nashville is a rural community with a population of approximately 1,500 people.
Geography
Nashville is located in the southeastern corner of Berrien County, in the south-central part of the state. It is situated on the banks of the Alapaha River, about 30 miles from the Florida border. The town is surrounded by rolling hills and farmland, and is located in the heart of the Wiregrass region of Georgia. The climate is mild and humid, with temperatures ranging from the mid-50s in the winter to the mid-90s in the summer.
Economy
Nashville’s economy is largely based on agriculture and forestry. The town is home to several large farms, as well as a number of small family-owned farms. The town is also home to several timber companies, which harvest and process timber for use in furniture, construction, and other industries. In addition, Nashville is home to several small businesses, including a grocery store, a hardware store, and a few restaurants.
Demographics
As of the 2010 census, Nashville had a population of 1,500 people. The racial makeup of the town was 79.3% White, 17.3% African American, 0.7% Native American, 0.3% Asian, 0.1% Pacific Islander, and 2.3% from other races. The median household income was $30,000, and the median family income was $35,000. The town’s poverty rate was 22.3%.
History
Nashville was founded in 1836 and named after General Francis Nash, a Revolutionary War hero. The town was originally a trading post for local farmers and ranchers, and it quickly grew into a small but thriving community. In the late 19th century, the town was home to several cotton mills, which provided employment for many of the town’s residents. In the early 20th century, the town’s economy shifted to agriculture and forestry, and it has remained largely unchanged since then.
Today, Nashville is a small but vibrant community. The town is home to several churches, a library, a museum, and a number of small businesses. The town is also home to a number of festivals and events throughout the year, including the annual Nashville Peach Festival and the Nashville Watermelon Festival. Nashville is a great place to live, work, and raise a family.
Common Questions
What is Per Capita Income in Nashville?
Per Capita income in Nashville is $19,216.
What is the Median Family Income in Nashville?
Median Family Income in Nashville is $53,391.
What is the Median Household income in Nashville?
Median Household Income in Nashville is $45,500.
What is Income or Wage Gap in Nashville?
Income or Wage Gap in Nashville is 15.7%.
Women in Nashville earn 84.3 cents for every dollar earned by a man.
What is Family Income Deficit in Nashville?
Family Income Deficit in Nashville is $8,443.
Families that are below poverty line in Nashville earn $8,443 less on average than the poverty threshold level.
What is Inequality or Gini Index in Nashville?
Inequality or Gini Index in Nashville is 0.41.
What is the Total Population of Nashville?
Total Population of Nashville is 4,907.
What is the Total Male Population of Nashville?
Total Male Population of Nashville is 2,189.
What is the Total Female Population of Nashville?
Total Female Population of Nashville is 2,718.
What is the Ratio of Males per 100 Females in Nashville?
There are 80.54 Males per 100 Females in Nashville.
What is the Ratio of Females per 100 Males in Nashville?
There are 124.17 Females per 100 Males in Nashville.
What is the Median Population Age in Nashville?
Median Population Age in Nashville is 36.4 Years.
What is the Average Family Size in Nashville
Average Family Size in Nashville is 3.3 People.
What is the Average Household Size in Nashville
Average Household Size in Nashville is 2.6 People.
How Large is the Labor Force in Nashville?
There are 1,914 People in the Labor Forcein in Nashville.
What is the Percentage of People in the Labor Force in Nashville?
50.6% of People are in the Labor Force in Nashville.
What is the Unemployment Rate in Nashville?
Unemployment Rate in Nashville is 7.2%.