Bloomingdale, GA Map & Demographics
Bloomingdale Map
Bloomingdale Overview
$35,982
PER CAPITA INCOME
$77,361
AVG FAMILY INCOME
$62,250
AVG HOUSEHOLD INCOME
36.8%
WAGE / INCOME GAP [ % ]
63.2¢/ $1
WAGE / INCOME GAP [ $ ]
0.40
INEQUALITY / GINI INDEX
2,933
TOTAL POPULATION
1,552
MALE POPULATION
1,381
FEMALE POPULATION
112.38
MALES / 100 FEMALES
88.98
FEMALES / 100 MALES
53.3
MEDIAN AGE
2.7
AVG FAMILY SIZE
2.3
AVG HOUSEHOLD SIZE
1,599
LABOR FORCE [ PEOPLE ]
62.5%
PERCENT IN LABOR FORCE
2.7%
UNEMPLOYMENT RATE
Bloomingdale Zip Codes
Bloomingdale Area Codes
Income in Bloomingdale
Income Overview in Bloomingdale
Per Capita Income in Bloomingdale is $35,982, while median incomes of families and households are $77,361 and $62,250 respectively.
| Characteristic | Number | Measure |
| Per Capita Income | 2,933 | $35,982 |
| Median Family Income | 880 | $77,361 |
| Mean Family Income | 880 | $90,145 |
| Median Household Income | 1,271 | $62,250 |
| Mean Household Income | 1,271 | $79,337 |
| Income Deficit | 880 | $0 |
| Wage / Income Gap (%) | 2,933 | 36.79% |
| Wage / Income Gap ($) | 2,933 | 63.21¢ per $1 |
| Gini / Inequality Index | 2,933 | 0.40 |
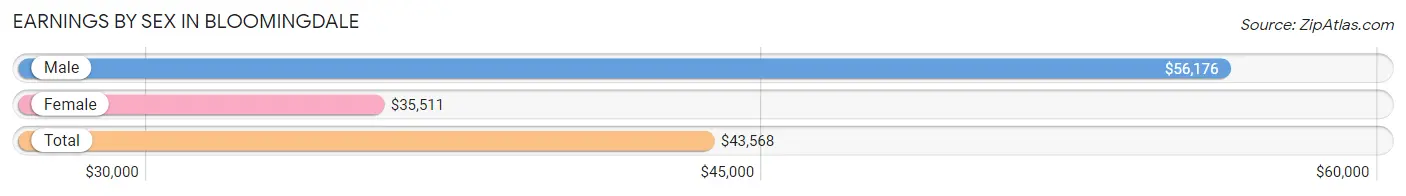
Earnings by Sex in Bloomingdale
Average Earnings in Bloomingdale are $43,568, $56,176 for men and $35,511 for women, a difference of 36.8%.
| Sex | Number | Average Earnings |
| Male | 952 (58.5%) | $56,176 |
| Female | 675 (41.5%) | $35,511 |
| Total | 1,627 (100.0%) | $43,568 |
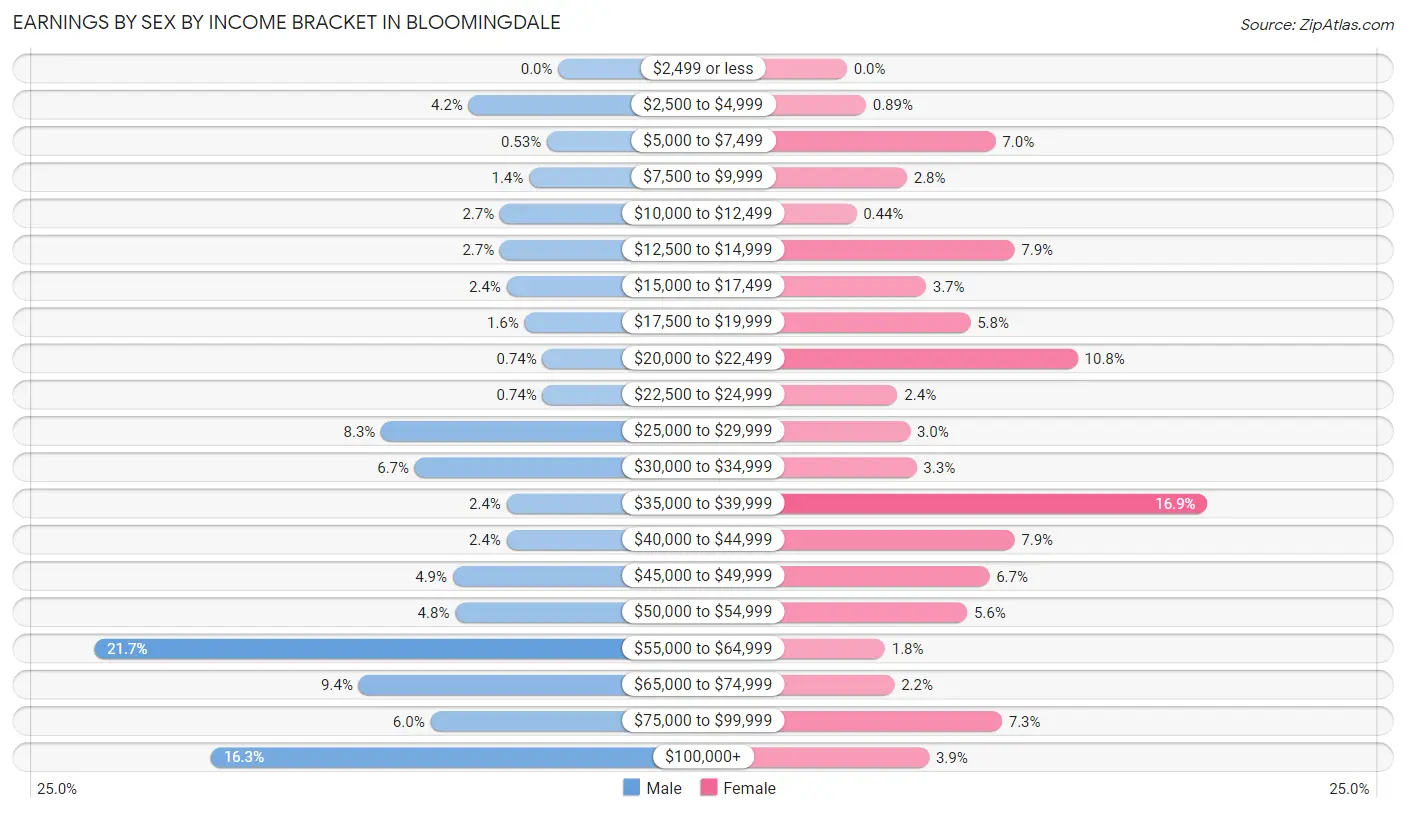
Earnings by Sex by Income Bracket in Bloomingdale
The most common earnings brackets in Bloomingdale are $55,000 to $64,999 for men (207 | 21.7%) and $35,000 to $39,999 for women (114 | 16.9%).
| Income | Male | Female |
| $2,499 or less | 0 (0.0%) | 0 (0.0%) |
| $2,500 to $4,999 | 40 (4.2%) | 6 (0.9%) |
| $5,000 to $7,499 | 5 (0.5%) | 47 (7.0%) |
| $7,500 to $9,999 | 13 (1.4%) | 19 (2.8%) |
| $10,000 to $12,499 | 26 (2.7%) | 3 (0.4%) |
| $12,500 to $14,999 | 26 (2.7%) | 53 (7.9%) |
| $15,000 to $17,499 | 23 (2.4%) | 25 (3.7%) |
| $17,500 to $19,999 | 15 (1.6%) | 39 (5.8%) |
| $20,000 to $22,499 | 7 (0.7%) | 73 (10.8%) |
| $22,500 to $24,999 | 7 (0.7%) | 16 (2.4%) |
| $25,000 to $29,999 | 79 (8.3%) | 20 (3.0%) |
| $30,000 to $34,999 | 64 (6.7%) | 22 (3.3%) |
| $35,000 to $39,999 | 23 (2.4%) | 114 (16.9%) |
| $40,000 to $44,999 | 23 (2.4%) | 53 (7.9%) |
| $45,000 to $49,999 | 47 (4.9%) | 45 (6.7%) |
| $50,000 to $54,999 | 46 (4.8%) | 38 (5.6%) |
| $55,000 to $64,999 | 207 (21.7%) | 12 (1.8%) |
| $65,000 to $74,999 | 89 (9.3%) | 15 (2.2%) |
| $75,000 to $99,999 | 57 (6.0%) | 49 (7.3%) |
| $100,000+ | 155 (16.3%) | 26 (3.8%) |
| Total | 952 (100.0%) | 675 (100.0%) |
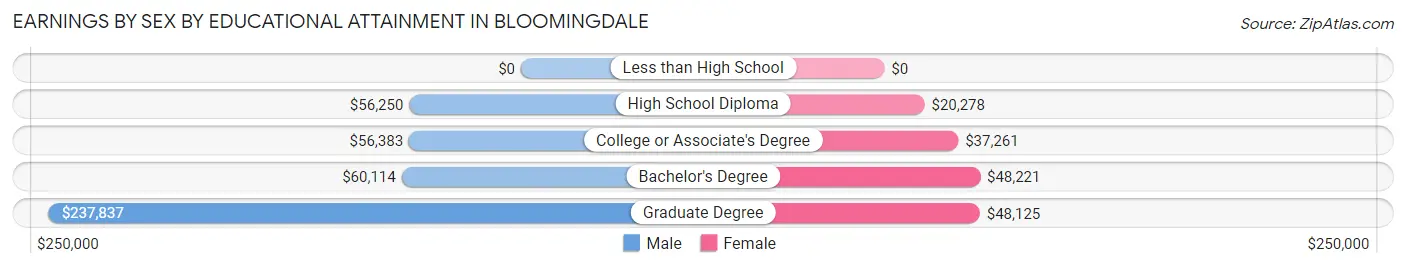
Earnings by Sex by Educational Attainment in Bloomingdale
Average earnings in Bloomingdale are $57,794 for men and $35,810 for women, a difference of 38.0%. Men with an educational attainment of graduate degree enjoy the highest average annual earnings of $237,837, while those with high school diploma education earn the least with $56,250. Women with an educational attainment of bachelor's degree earn the most with the average annual earnings of $48,221, while those with high school diploma education have the smallest earnings of $20,278.
| Educational Attainment | Male Income | Female Income |
| Less than High School | - | - |
| High School Diploma | $56,250 | $20,278 |
| College or Associate's Degree | $56,383 | $37,261 |
| Bachelor's Degree | $60,114 | $48,221 |
| Graduate Degree | $237,837 | $48,125 |
| Total | $57,794 | $35,810 |
Family Income in Bloomingdale
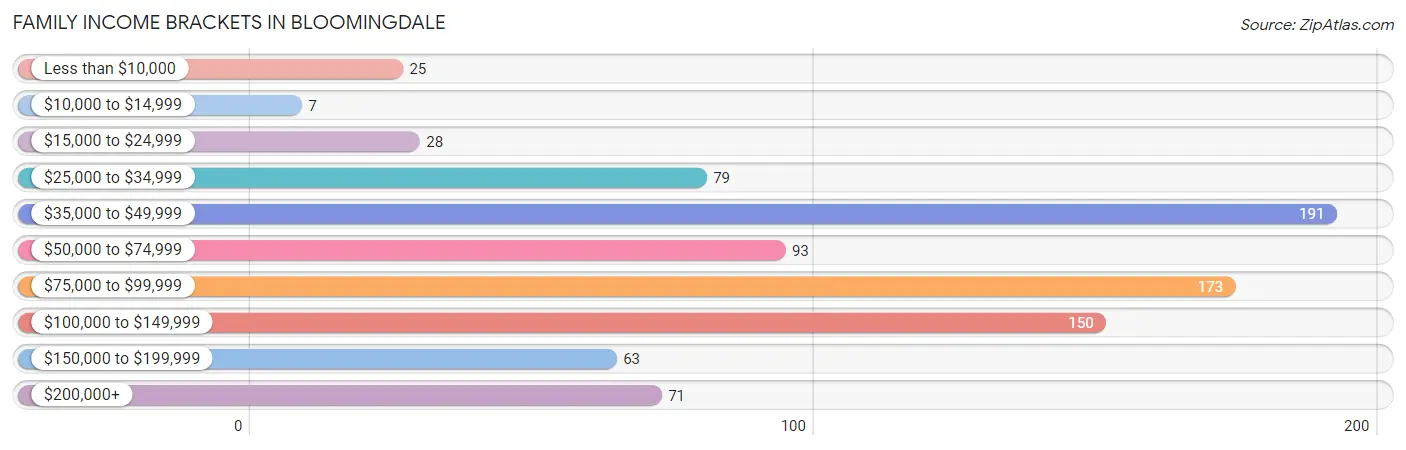
Family Income Brackets in Bloomingdale
According to the Bloomingdale family income data, there are 191 families falling into the $35,000 to $49,999 income range, which is the most common income bracket and makes up 21.7% of all families. Conversely, the $10,000 to $14,999 income bracket is the least frequent group with only 7 families (0.8%) belonging to this category.
| Income Bracket | # Families | % Families |
| Less than $10,000 | 25 | 2.8% |
| $10,000 to $14,999 | 7 | 0.8% |
| $15,000 to $24,999 | 28 | 3.2% |
| $25,000 to $34,999 | 79 | 9.0% |
| $35,000 to $49,999 | 191 | 21.7% |
| $50,000 to $74,999 | 93 | 10.6% |
| $75,000 to $99,999 | 173 | 19.7% |
| $100,000 to $149,999 | 150 | 17.0% |
| $150,000 to $199,999 | 63 | 7.2% |
| $200,000+ | 71 | 8.1% |
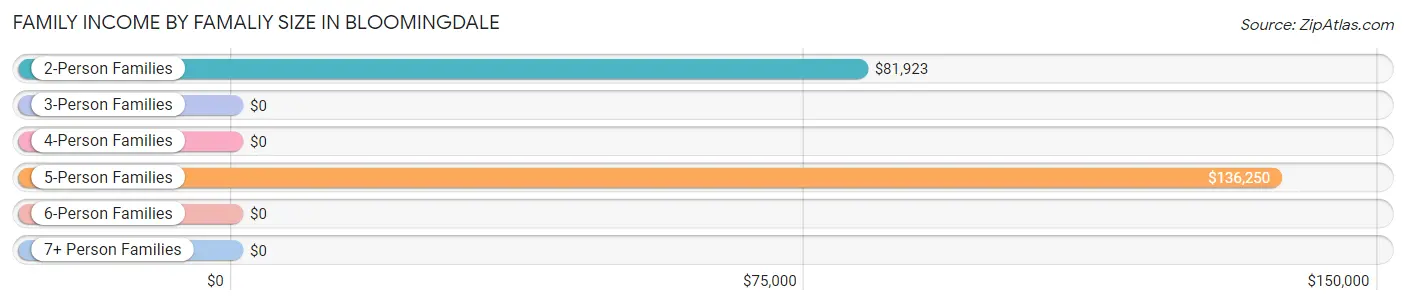
Family Income by Famaliy Size in Bloomingdale
5-person families (33 | 3.7%) account for the highest median family income in Bloomingdale with $136,250 per family, while 2-person families (568 | 64.5%) have the highest median income of $40,962 per family member.
| Income Bracket | # Families | Median Income |
| 2-Person Families | 568 (64.5%) | $81,923 |
| 3-Person Families | 200 (22.7%) | $0 |
| 4-Person Families | 65 (7.4%) | $0 |
| 5-Person Families | 33 (3.7%) | $136,250 |
| 6-Person Families | 14 (1.6%) | $0 |
| 7+ Person Families | 0 (0.0%) | $0 |
| Total | 880 (100.0%) | $77,361 |
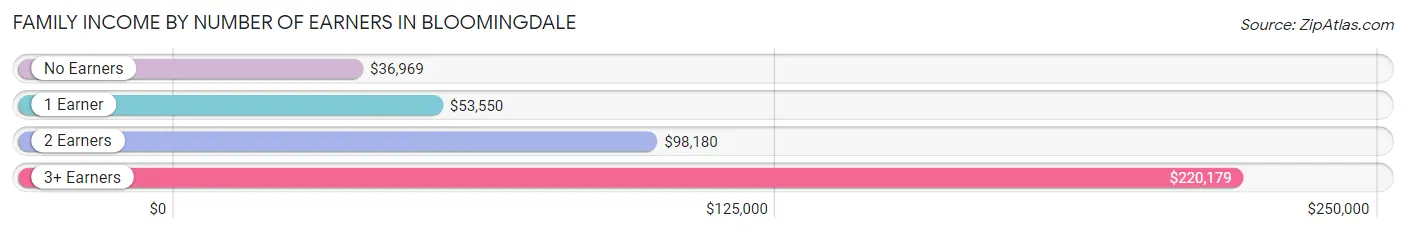
Family Income by Number of Earners in Bloomingdale
The median family income in Bloomingdale is $77,361, with families comprising 3+ earners (49) having the highest median family income of $220,179, while families with no earners (163) have the lowest median family income of $36,969, accounting for 5.6% and 18.5% of families, respectively.
| Number of Earners | # Families | Median Income |
| No Earners | 163 (18.5%) | $36,969 |
| 1 Earner | 325 (36.9%) | $53,550 |
| 2 Earners | 343 (39.0%) | $98,180 |
| 3+ Earners | 49 (5.6%) | $220,179 |
| Total | 880 (100.0%) | $77,361 |
Household Income in Bloomingdale
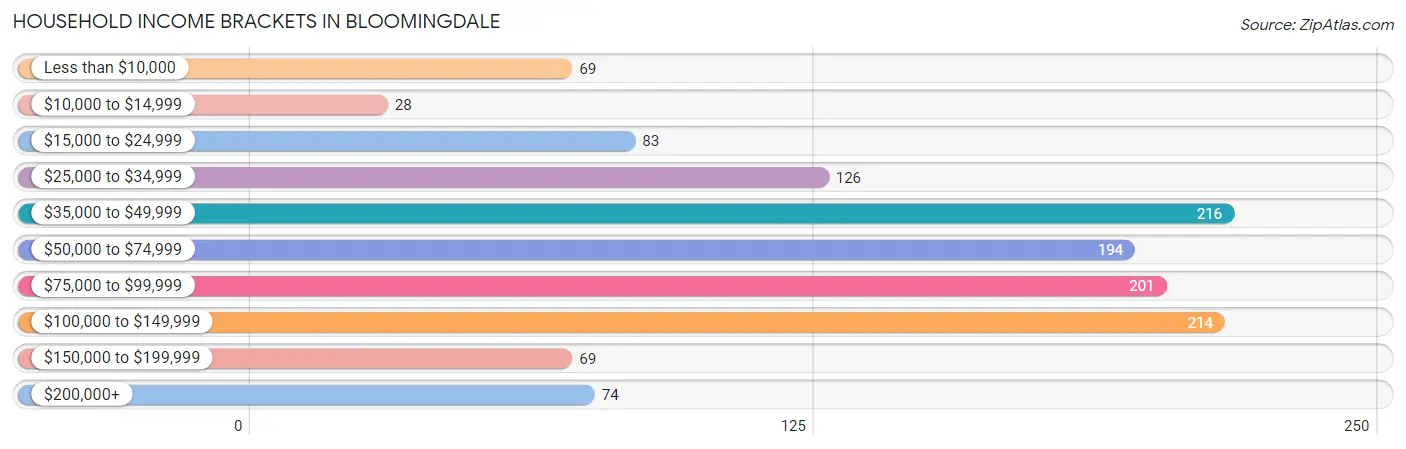
Household Income Brackets in Bloomingdale
With 216 households falling in the category, the $35,000 to $49,999 income range is the most frequent in Bloomingdale, accounting for 17.0% of all households. In contrast, only 28 households (2.2%) fall into the $10,000 to $14,999 income bracket, making it the least populous group.
| Income Bracket | # Households | % Households |
| Less than $10,000 | 69 | 5.4% |
| $10,000 to $14,999 | 28 | 2.2% |
| $15,000 to $24,999 | 83 | 6.5% |
| $25,000 to $34,999 | 126 | 9.9% |
| $35,000 to $49,999 | 216 | 17.0% |
| $50,000 to $74,999 | 194 | 15.3% |
| $75,000 to $99,999 | 201 | 15.8% |
| $100,000 to $149,999 | 214 | 16.8% |
| $150,000 to $199,999 | 69 | 5.4% |
| $200,000+ | 74 | 5.8% |
Household Income by Householder Age in Bloomingdale
The median household income in Bloomingdale is $62,250, with the highest median household income of $97,592 found in the 45 to 64 years age bracket for the primary householder. A total of 517 households (40.7%) fall into this category. Meanwhile, the 25 to 44 years age bracket for the primary householder has the lowest median household income of $50,469, with 351 households (27.6%) in this group.
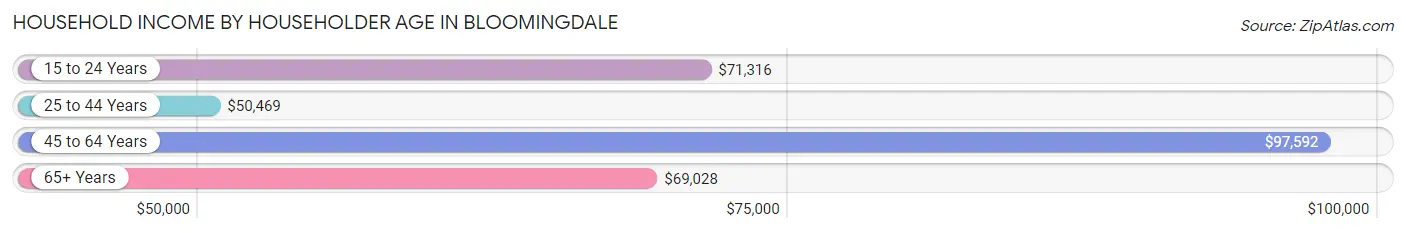
| Income Bracket | # Households | Median Income |
| 15 to 24 Years | 30 (2.4%) | $71,316 |
| 25 to 44 Years | 351 (27.6%) | $50,469 |
| 45 to 64 Years | 517 (40.7%) | $97,592 |
| 65+ Years | 373 (29.3%) | $69,028 |
| Total | 1,271 (100.0%) | $62,250 |
Poverty in Bloomingdale
Income Below Poverty by Sex and Age in Bloomingdale
With 7.6% poverty level for males and 14.0% for females among the residents of Bloomingdale, 15 year old males and 12 to 14 year old females are the most vulnerable to poverty, with 15 males (100.0%) and 12 females (100.0%) in their respective age groups living below the poverty level.
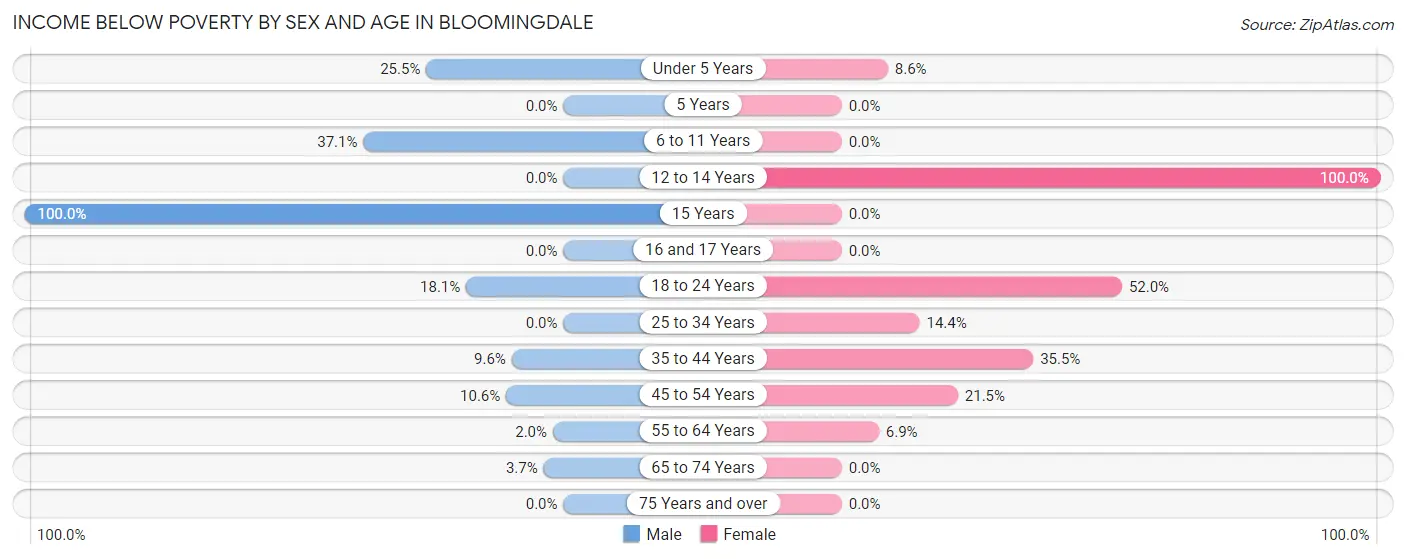
| Age Bracket | Male | Female |
| Under 5 Years | 14 (25.5%) | 13 (8.6%) |
| 5 Years | 0 (0.0%) | 0 (0.0%) |
| 6 to 11 Years | 26 (37.1%) | 0 (0.0%) |
| 12 to 14 Years | 0 (0.0%) | 12 (100.0%) |
| 15 Years | 15 (100.0%) | 0 (0.0%) |
| 16 and 17 Years | 0 (0.0%) | 0 (0.0%) |
| 18 to 24 Years | 24 (18.0%) | 39 (52.0%) |
| 25 to 34 Years | 0 (0.0%) | 29 (14.4%) |
| 35 to 44 Years | 7 (9.6%) | 54 (35.5%) |
| 45 to 54 Years | 17 (10.6%) | 14 (21.5%) |
| 55 to 64 Years | 8 (1.9%) | 32 (6.9%) |
| 65 to 74 Years | 7 (3.7%) | 0 (0.0%) |
| 75 Years and over | 0 (0.0%) | 0 (0.0%) |
| Total | 118 (7.6%) | 193 (14.0%) |
Income Above Poverty by Sex and Age in Bloomingdale
According to the poverty statistics in Bloomingdale, males aged 5 years and females aged 6 to 11 years are the age groups that are most secure financially, with 100.0% of males and 100.0% of females in these age groups living above the poverty line.
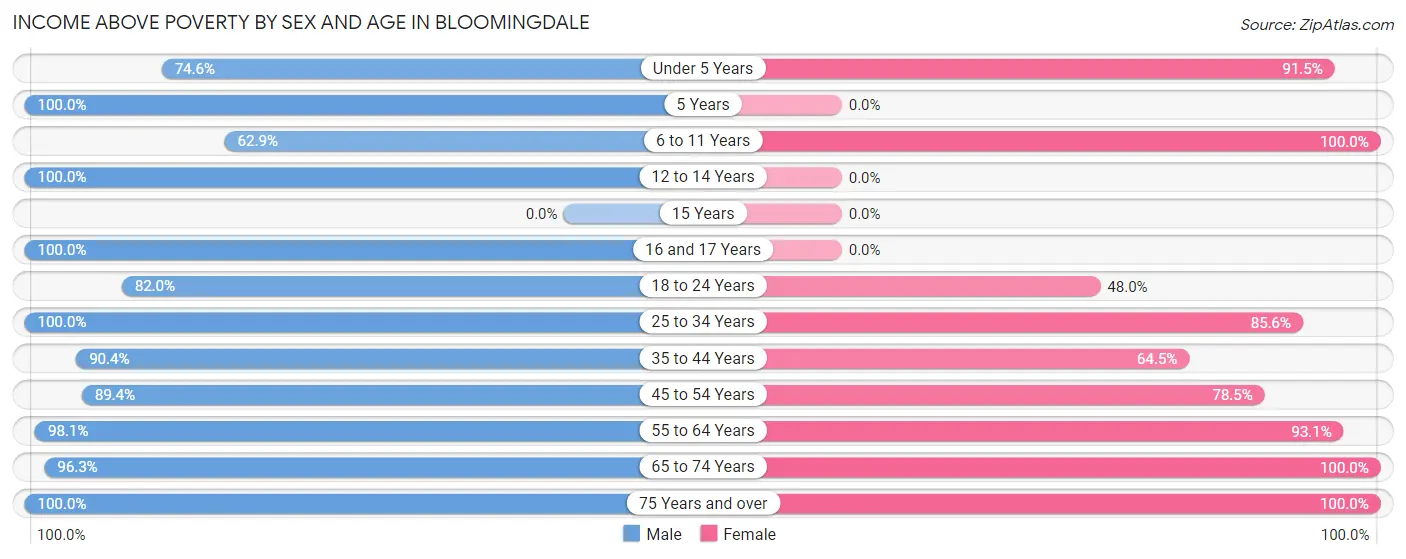
| Age Bracket | Male | Female |
| Under 5 Years | 41 (74.6%) | 139 (91.4%) |
| 5 Years | 15 (100.0%) | 0 (0.0%) |
| 6 to 11 Years | 44 (62.9%) | 11 (100.0%) |
| 12 to 14 Years | 44 (100.0%) | 0 (0.0%) |
| 15 Years | 0 (0.0%) | 0 (0.0%) |
| 16 and 17 Years | 29 (100.0%) | 0 (0.0%) |
| 18 to 24 Years | 109 (82.0%) | 36 (48.0%) |
| 25 to 34 Years | 236 (100.0%) | 172 (85.6%) |
| 35 to 44 Years | 66 (90.4%) | 98 (64.5%) |
| 45 to 54 Years | 143 (89.4%) | 51 (78.5%) |
| 55 to 64 Years | 403 (98.1%) | 434 (93.1%) |
| 65 to 74 Years | 183 (96.3%) | 147 (100.0%) |
| 75 Years and over | 119 (100.0%) | 100 (100.0%) |
| Total | 1,432 (92.4%) | 1,188 (86.0%) |
Income Below Poverty Among Married-Couple Families in Bloomingdale
The poverty statistics for married-couple families in Bloomingdale show that 2.9% or 20 of the total 694 families live below the poverty line. Families with 3 or 4 children have the highest poverty rate of 100.0%, comprising of 14 families. On the other hand, families with no children have the lowest poverty rate of 0.0%, which includes 0 families.
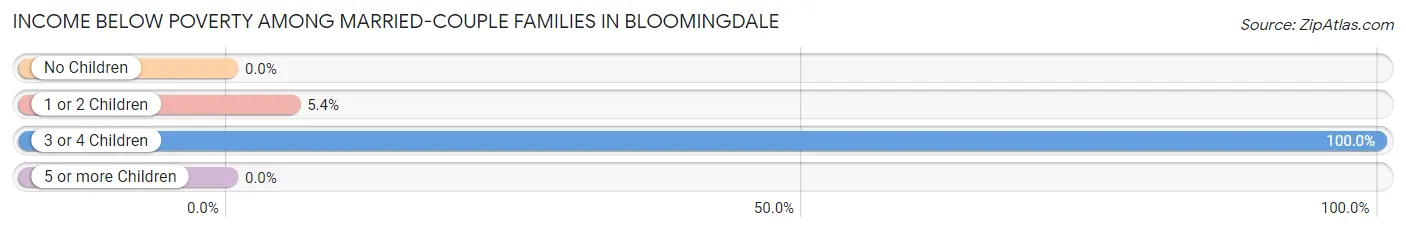
| Children | Above Poverty | Below Poverty |
| No Children | 569 (100.0%) | 0 (0.0%) |
| 1 or 2 Children | 105 (94.6%) | 6 (5.4%) |
| 3 or 4 Children | 0 (0.0%) | 14 (100.0%) |
| 5 or more Children | 0 (0.0%) | 0 (0.0%) |
| Total | 674 (97.1%) | 20 (2.9%) |
Income Below Poverty Among Single-Parent Households in Bloomingdale
According to the poverty data in Bloomingdale, 6.2% or 7 single-father households and 26.0% or 19 single-mother households are living below the poverty line. Among single-father households, those with no children have the highest poverty rate, with 7 households (17.5%) experiencing poverty. Likewise, among single-mother households, those with 1 or 2 children have the highest poverty rate, with 19 households (29.7%) falling below the poverty line.
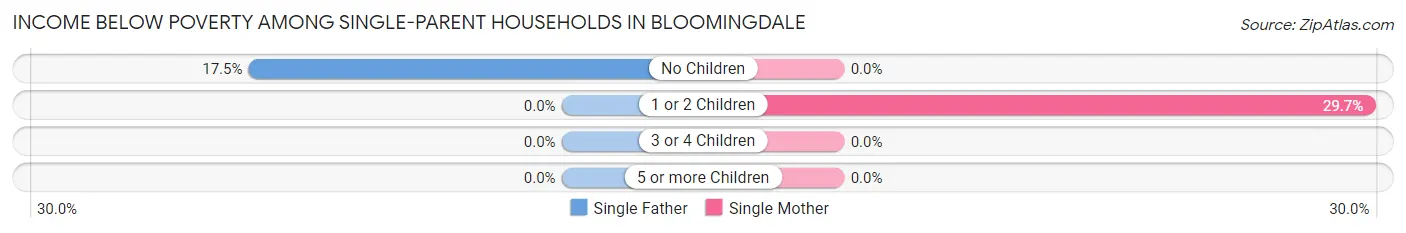
| Children | Single Father | Single Mother |
| No Children | 7 (17.5%) | 0 (0.0%) |
| 1 or 2 Children | 0 (0.0%) | 19 (29.7%) |
| 3 or 4 Children | 0 (0.0%) | 0 (0.0%) |
| 5 or more Children | 0 (0.0%) | 0 (0.0%) |
| Total | 7 (6.2%) | 19 (26.0%) |
Income Below Poverty Among Married-Couple vs Single-Parent Households in Bloomingdale
The poverty data for Bloomingdale shows that 20 of the married-couple family households (2.9%) and 26 of the single-parent households (14.0%) are living below the poverty level. Within the married-couple family households, those with 3 or 4 children have the highest poverty rate, with 14 households (100.0%) falling below the poverty line. Among the single-parent households, those with no children have the highest poverty rate, with 7 household (14.3%) living below poverty.
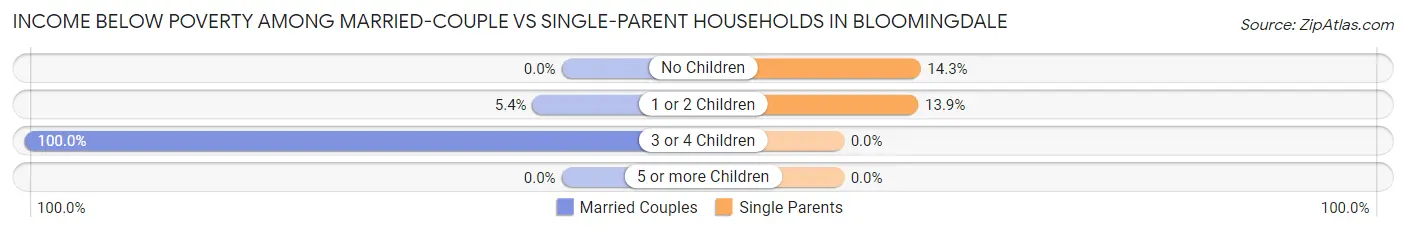
| Children | Married-Couple Families | Single-Parent Households |
| No Children | 0 (0.0%) | 7 (14.3%) |
| 1 or 2 Children | 6 (5.4%) | 19 (13.9%) |
| 3 or 4 Children | 14 (100.0%) | 0 (0.0%) |
| 5 or more Children | 0 (0.0%) | 0 (0.0%) |
| Total | 20 (2.9%) | 26 (14.0%) |
Race in Bloomingdale
The most populous races in Bloomingdale are White / Caucasian (2,233 | 76.1%), Black / African American (357 | 12.2%), and Two or more Races (267 | 9.1%).
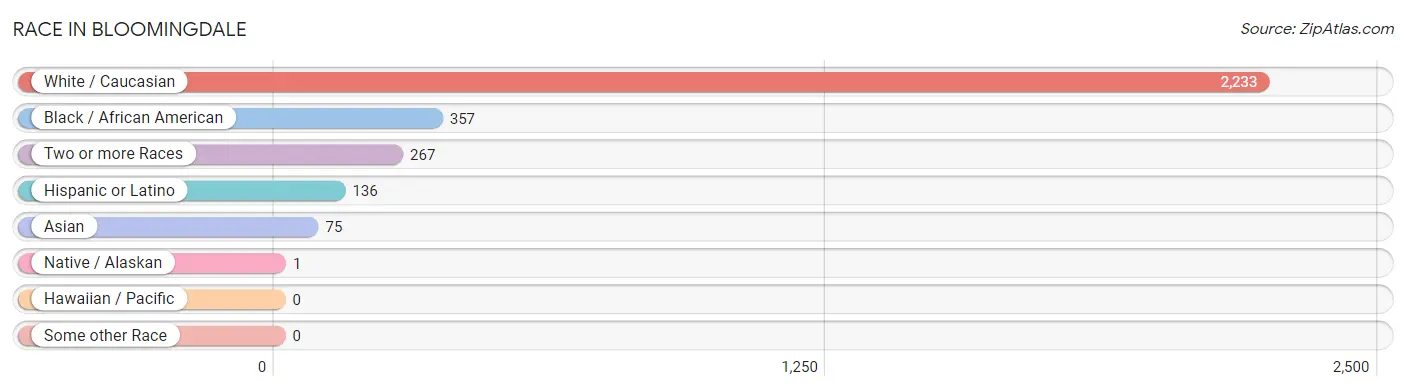
| Race | # Population | % Population |
| Asian | 75 | 2.6% |
| Black / African American | 357 | 12.2% |
| Hawaiian / Pacific | 0 | 0.0% |
| Hispanic or Latino | 136 | 4.6% |
| Native / Alaskan | 1 | 0.0% |
| White / Caucasian | 2,233 | 76.1% |
| Two or more Races | 267 | 9.1% |
| Some other Race | 0 | 0.0% |
| Total | 2,933 | 100.0% |
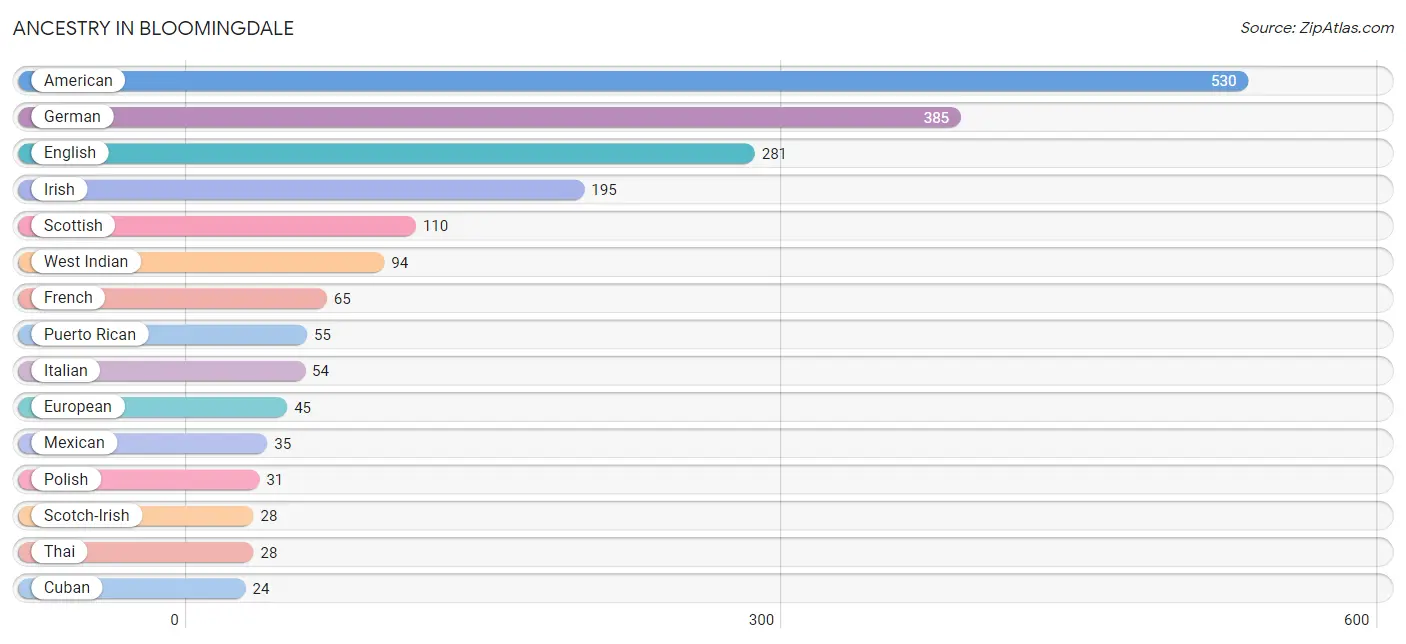
Ancestry in Bloomingdale
The most populous ancestries reported in Bloomingdale are American (530 | 18.1%), German (385 | 13.1%), English (281 | 9.6%), Irish (195 | 6.7%), and Scottish (110 | 3.7%), together accounting for 51.2% of all Bloomingdale residents.
| Ancestry | # Population | % Population |
| American | 530 | 18.1% |
| British | 11 | 0.4% |
| Burmese | 22 | 0.7% |
| Central American | 15 | 0.5% |
| Cherokee | 10 | 0.3% |
| Cuban | 24 | 0.8% |
| Danish | 8 | 0.3% |
| Dutch | 10 | 0.3% |
| English | 281 | 9.6% |
| European | 45 | 1.5% |
| French | 65 | 2.2% |
| German | 385 | 13.1% |
| Honduran | 15 | 0.5% |
| Hungarian | 3 | 0.1% |
| Iranian | 1 | 0.0% |
| Irish | 195 | 6.7% |
| Italian | 54 | 1.8% |
| Korean | 2 | 0.1% |
| Mexican | 35 | 1.2% |
| Mongolian | 22 | 0.7% |
| Northern European | 5 | 0.2% |
| Pennsylvania German | 5 | 0.2% |
| Polish | 31 | 1.1% |
| Puerto Rican | 55 | 1.9% |
| Russian | 20 | 0.7% |
| Scandinavian | 19 | 0.6% |
| Scotch-Irish | 28 | 0.9% |
| Scottish | 110 | 3.7% |
| Spanish | 7 | 0.2% |
| Sri Lankan | 8 | 0.3% |
| Swedish | 11 | 0.4% |
| Swiss | 9 | 0.3% |
| Thai | 28 | 0.9% |
| Turkish | 9 | 0.3% |
| West Indian | 94 | 3.2% | View All 35 Rows |
Immigrants in Bloomingdale
The most numerous immigrant groups reported in Bloomingdale came from Asia (67 | 2.3%), Latin America (58 | 2.0%), Central America (32 | 1.1%), India (28 | 0.9%), and South Central Asia (28 | 0.9%), together accounting for 7.2% of all Bloomingdale residents.
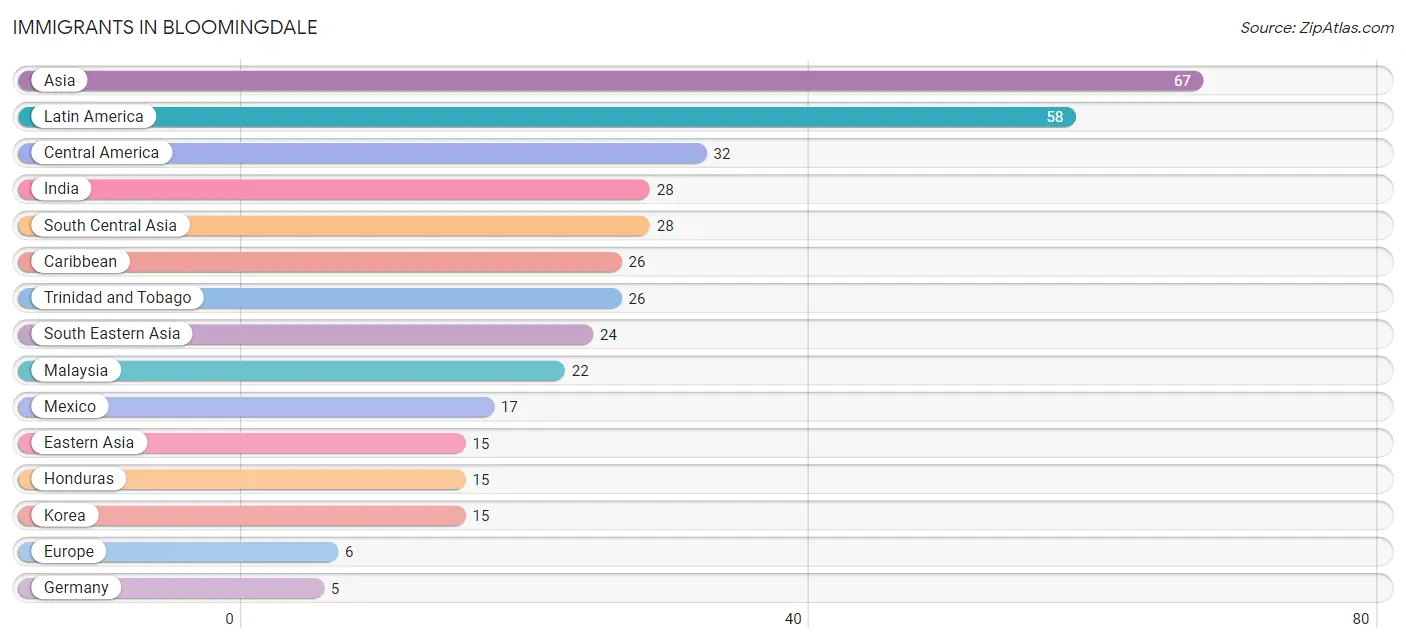
| Immigration Origin | # Population | % Population |
| Asia | 67 | 2.3% |
| Caribbean | 26 | 0.9% |
| Central America | 32 | 1.1% |
| Eastern Asia | 15 | 0.5% |
| Eastern Europe | 1 | 0.0% |
| Europe | 6 | 0.2% |
| Germany | 5 | 0.2% |
| Honduras | 15 | 0.5% |
| India | 28 | 0.9% |
| Korea | 15 | 0.5% |
| Latin America | 58 | 2.0% |
| Malaysia | 22 | 0.7% |
| Mexico | 17 | 0.6% |
| Philippines | 2 | 0.1% |
| Russia | 1 | 0.0% |
| South Central Asia | 28 | 0.9% |
| South Eastern Asia | 24 | 0.8% |
| Trinidad and Tobago | 26 | 0.9% |
| Western Europe | 5 | 0.2% | View All 19 Rows |
Sex and Age in Bloomingdale
Sex and Age in Bloomingdale
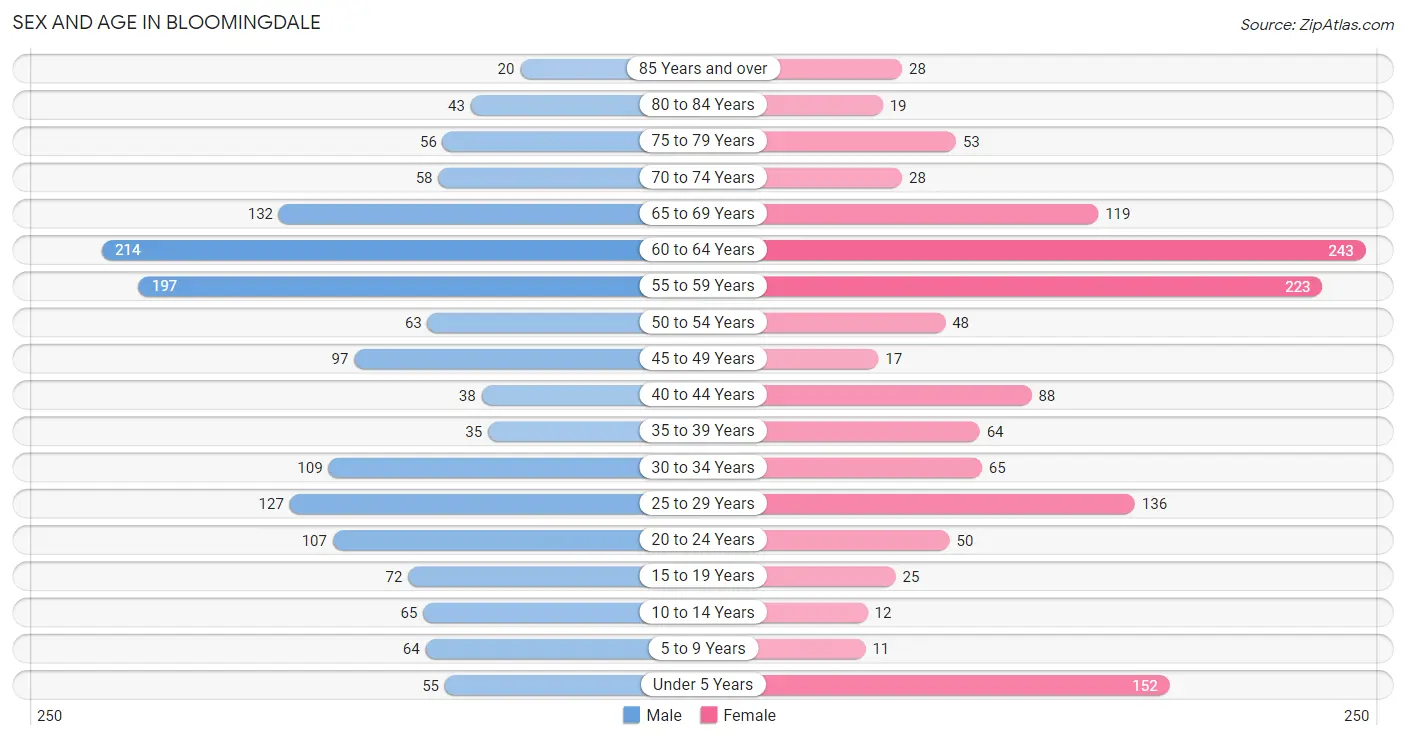
The most populous age groups in Bloomingdale are 60 to 64 Years (214 | 13.8%) for men and 60 to 64 Years (243 | 17.6%) for women.
| Age Bracket | Male | Female |
| Under 5 Years | 55 (3.5%) | 152 (11.0%) |
| 5 to 9 Years | 64 (4.1%) | 11 (0.8%) |
| 10 to 14 Years | 65 (4.2%) | 12 (0.9%) |
| 15 to 19 Years | 72 (4.6%) | 25 (1.8%) |
| 20 to 24 Years | 107 (6.9%) | 50 (3.6%) |
| 25 to 29 Years | 127 (8.2%) | 136 (9.9%) |
| 30 to 34 Years | 109 (7.0%) | 65 (4.7%) |
| 35 to 39 Years | 35 (2.3%) | 64 (4.6%) |
| 40 to 44 Years | 38 (2.5%) | 88 (6.4%) |
| 45 to 49 Years | 97 (6.2%) | 17 (1.2%) |
| 50 to 54 Years | 63 (4.1%) | 48 (3.5%) |
| 55 to 59 Years | 197 (12.7%) | 223 (16.2%) |
| 60 to 64 Years | 214 (13.8%) | 243 (17.6%) |
| 65 to 69 Years | 132 (8.5%) | 119 (8.6%) |
| 70 to 74 Years | 58 (3.7%) | 28 (2.0%) |
| 75 to 79 Years | 56 (3.6%) | 53 (3.8%) |
| 80 to 84 Years | 43 (2.8%) | 19 (1.4%) |
| 85 Years and over | 20 (1.3%) | 28 (2.0%) |
| Total | 1,552 (100.0%) | 1,381 (100.0%) |
Families and Households in Bloomingdale
Median Family Size in Bloomingdale
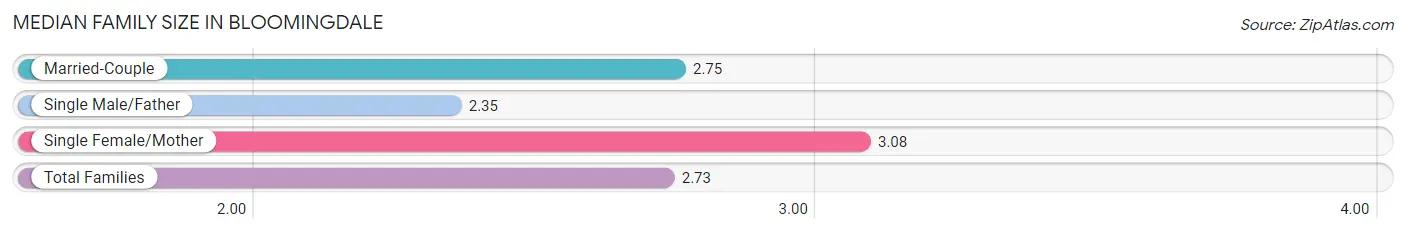
The median family size in Bloomingdale is 2.73 persons per family, with single female/mother families (73 | 8.3%) accounting for the largest median family size of 3.08 persons per family. On the other hand, single male/father families (113 | 12.8%) represent the smallest median family size with 2.35 persons per family.
| Family Type | # Families | Family Size |
| Married-Couple | 694 (78.9%) | 2.75 |
| Single Male/Father | 113 (12.8%) | 2.35 |
| Single Female/Mother | 73 (8.3%) | 3.08 |
| Total Families | 880 (100.0%) | 2.73 |
Median Household Size in Bloomingdale
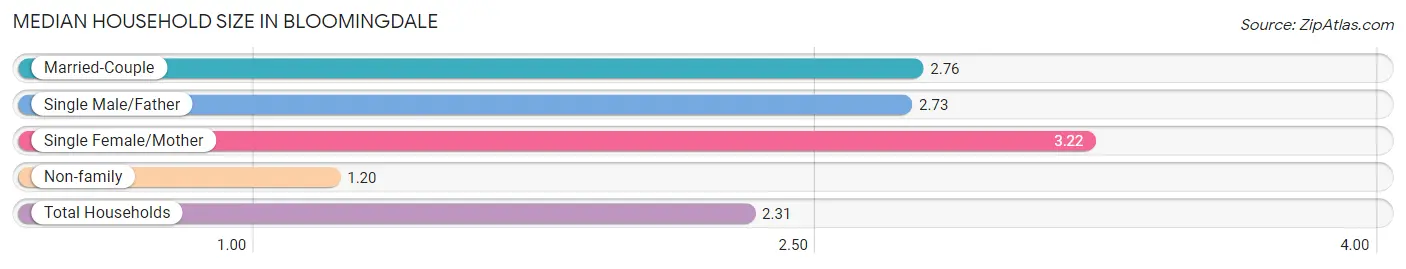
The median household size in Bloomingdale is 2.31 persons per household, with single female/mother households (73 | 5.7%) accounting for the largest median household size of 3.22 persons per household. non-family households (391 | 30.8%) represent the smallest median household size with 1.20 persons per household.
| Household Type | # Households | Household Size |
| Married-Couple | 694 (54.6%) | 2.76 |
| Single Male/Father | 113 (8.9%) | 2.73 |
| Single Female/Mother | 73 (5.7%) | 3.22 |
| Non-family | 391 (30.8%) | 1.20 |
| Total Households | 1,271 (100.0%) | 2.31 |
Household Size by Marriage Status in Bloomingdale
Out of a total of 1,271 households in Bloomingdale, 880 (69.2%) are family households, while 391 (30.8%) are nonfamily households. The most numerous type of family households are 2-person households, comprising 543, and the most common type of nonfamily households are 1-person households, comprising 336.
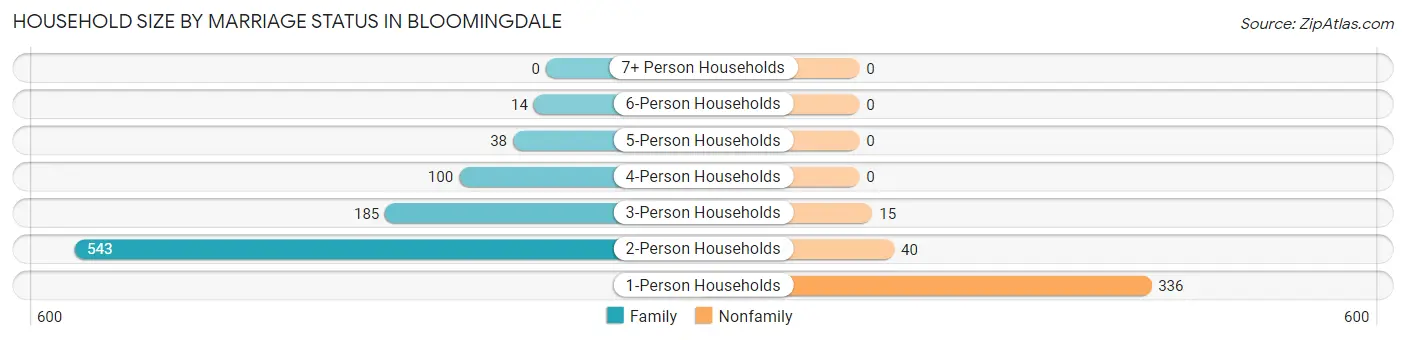
| Household Size | Family Households | Nonfamily Households |
| 1-Person Households | - | 336 (26.4%) |
| 2-Person Households | 543 (42.7%) | 40 (3.2%) |
| 3-Person Households | 185 (14.6%) | 15 (1.2%) |
| 4-Person Households | 100 (7.9%) | 0 (0.0%) |
| 5-Person Households | 38 (3.0%) | 0 (0.0%) |
| 6-Person Households | 14 (1.1%) | 0 (0.0%) |
| 7+ Person Households | 0 (0.0%) | 0 (0.0%) |
| Total | 880 (69.2%) | 391 (30.8%) |
Female Fertility in Bloomingdale
Fertility by Age in Bloomingdale
Average fertility rate in Bloomingdale is 83.0 births per 1,000 women. Women in the age bracket of 20 to 34 years have the highest fertility rate with 147.0 births per 1,000 women. Women in the age bracket of 20 to 34 years acount for 100.0% of all women with births.
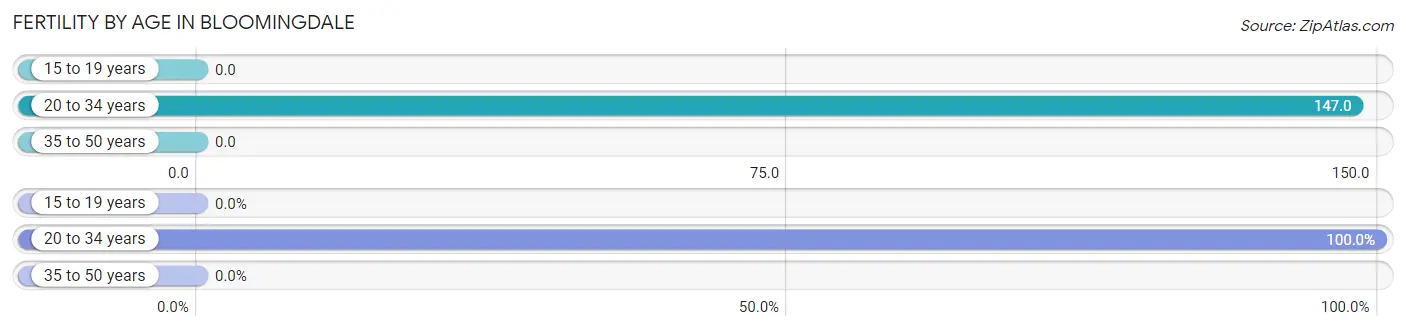
| Age Bracket | Women with Births | Births / 1,000 Women |
| 15 to 19 years | 0 (0.0%) | 0.0 |
| 20 to 34 years | 37 (100.0%) | 147.0 |
| 35 to 50 years | 0 (0.0%) | 0.0 |
| Total | 37 (100.0%) | 83.0 |
Fertility by Age by Marriage Status in Bloomingdale
21.6% of women with births (37) in Bloomingdale are married. The highest percentage of unmarried women with births falls into 20 to 34 years age bracket with 78.4% of them unmarried at the time of birth, while the lowest percentage of unmarried women with births belong to 20 to 34 years age bracket with 78.4% of them unmarried.
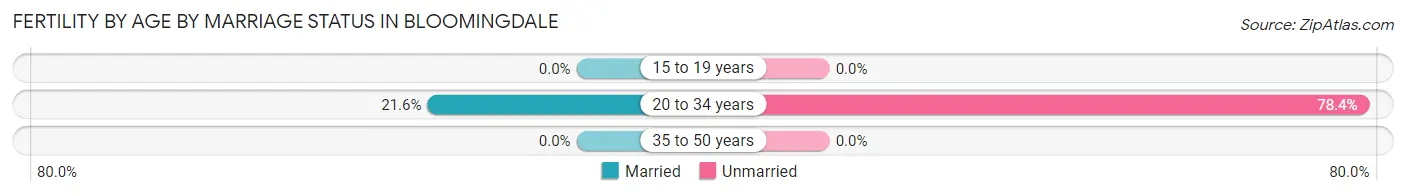
| Age Bracket | Married | Unmarried |
| 15 to 19 years | 0 (0.0%) | 0 (0.0%) |
| 20 to 34 years | 8 (21.6%) | 29 (78.4%) |
| 35 to 50 years | 0 (0.0%) | 0 (0.0%) |
| Total | 8 (21.6%) | 29 (78.4%) |
Fertility by Education in Bloomingdale
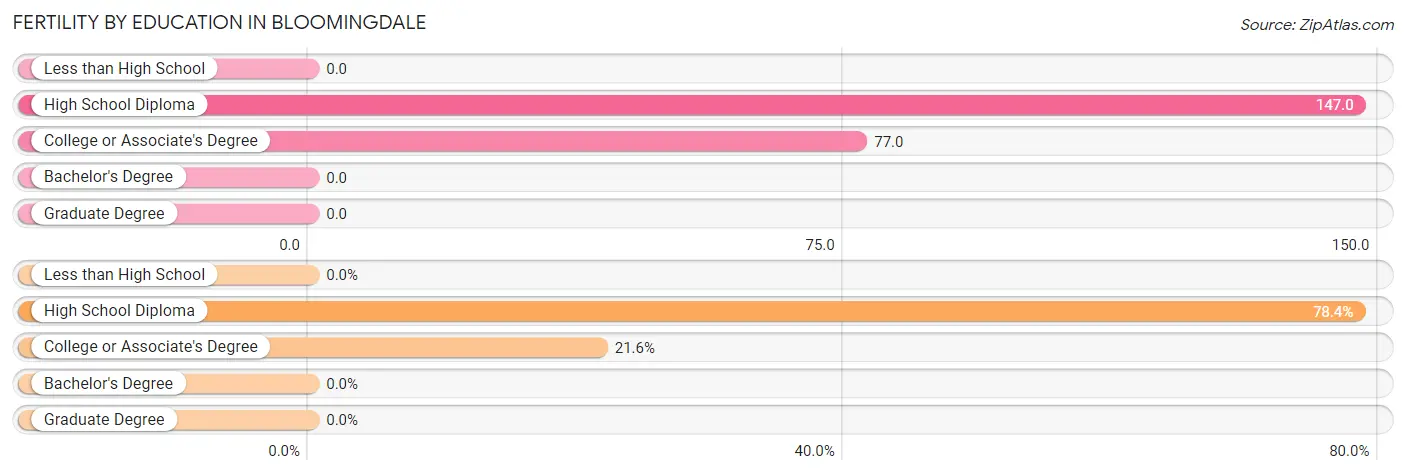
| Educational Attainment | Women with Births | Births / 1,000 Women |
| Less than High School | 0 (0.0%) | 0.0 |
| High School Diploma | 29 (78.4%) | 147.0 |
| College or Associate's Degree | 8 (21.6%) | 77.0 |
| Bachelor's Degree | 0 (0.0%) | 0.0 |
| Graduate Degree | 0 (0.0%) | 0.0 |
| Total | 37 (100.0%) | 83.0 |
Fertility by Education by Marriage Status in Bloomingdale
78.4% of women with births in Bloomingdale are unmarried. Women with the educational attainment of college or associate's degree are most likely to be married with 100.0% of them married at childbirth, while women with the educational attainment of high school diploma are least likely to be married with 100.0% of them unmarried at childbirth.
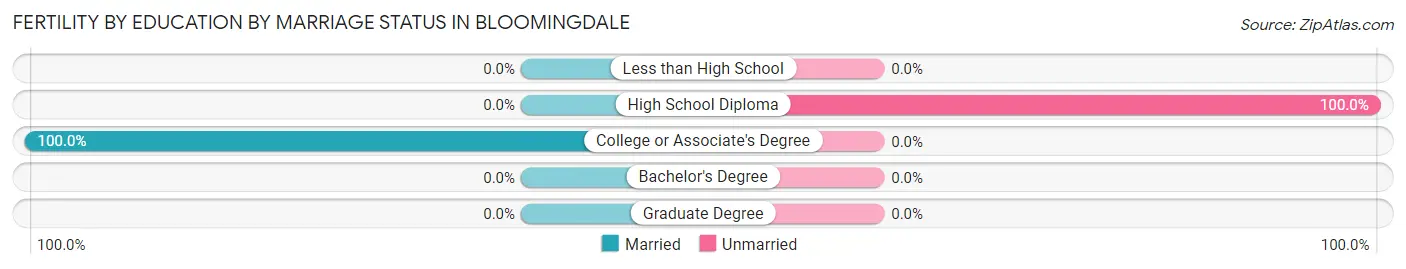
| Educational Attainment | Married | Unmarried |
| Less than High School | 0 (0.0%) | 0 (0.0%) |
| High School Diploma | 0 (0.0%) | 29 (100.0%) |
| College or Associate's Degree | 8 (100.0%) | 0 (0.0%) |
| Bachelor's Degree | 0 (0.0%) | 0 (0.0%) |
| Graduate Degree | 0 (0.0%) | 0 (0.0%) |
| Total | 8 (21.6%) | 29 (78.4%) |
Employment Characteristics in Bloomingdale
Employment by Class of Employer in Bloomingdale
Among the 1,556 employed individuals in Bloomingdale, private company employees (949 | 61.0%), not-for-profit organizations (172 | 11.1%), and local government employees (104 | 6.7%) make up the most common classes of employment.
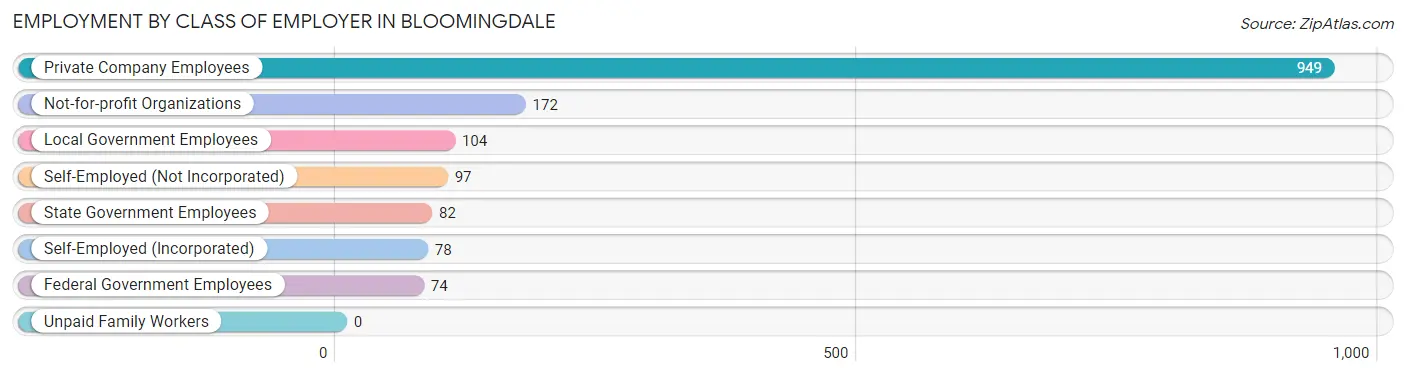
| Employer Class | # Employees | % Employees |
| Private Company Employees | 949 | 61.0% |
| Self-Employed (Incorporated) | 78 | 5.0% |
| Self-Employed (Not Incorporated) | 97 | 6.2% |
| Not-for-profit Organizations | 172 | 11.1% |
| Local Government Employees | 104 | 6.7% |
| State Government Employees | 82 | 5.3% |
| Federal Government Employees | 74 | 4.8% |
| Unpaid Family Workers | 0 | 0.0% |
| Total | 1,556 | 100.0% |
Employment Status by Age in Bloomingdale
According to the labor force statistics for Bloomingdale, out of the total population over 16 years of age (2,559), 62.5% or 1,599 individuals are in the labor force, with 2.7% or 43 of them unemployed. The age group with the highest labor force participation rate is 30 to 34 years, with 96.0% or 167 individuals in the labor force. Within the labor force, the 20 to 24 years age range has the highest percentage of unemployed individuals, with 19.6% or 18 of them being unemployed.
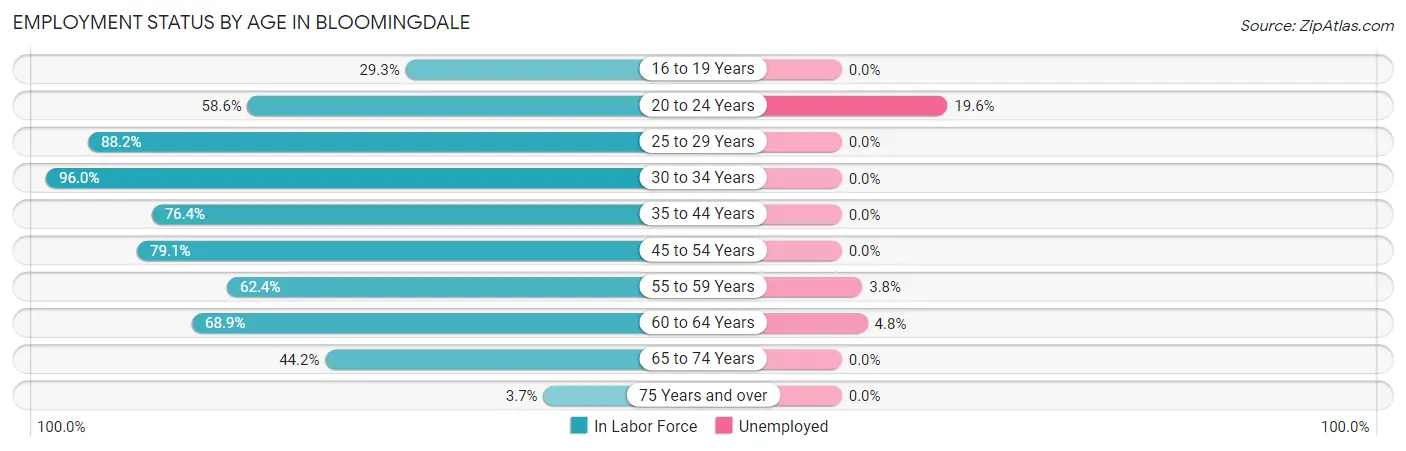
| Age Bracket | In Labor Force | Unemployed |
| 16 to 19 Years | 24 (29.3%) | 0 (0.0%) |
| 20 to 24 Years | 92 (58.6%) | 18 (19.6%) |
| 25 to 29 Years | 232 (88.2%) | 0 (0.0%) |
| 30 to 34 Years | 167 (96.0%) | 0 (0.0%) |
| 35 to 44 Years | 172 (76.4%) | 0 (0.0%) |
| 45 to 54 Years | 178 (79.1%) | 0 (0.0%) |
| 55 to 59 Years | 262 (62.4%) | 10 (3.8%) |
| 60 to 64 Years | 315 (68.9%) | 15 (4.8%) |
| 65 to 74 Years | 149 (44.2%) | 0 (0.0%) |
| 75 Years and over | 8 (3.7%) | 0 (0.0%) |
| Total | 1,599 (62.5%) | 43 (2.7%) |
Employment Status by Educational Attainment in Bloomingdale
According to labor force statistics for Bloomingdale, 75.2% of individuals (1,327) out of the total population between 25 and 64 years of age (1,764) are in the labor force, with 1.9% or 25 of them being unemployed. The group with the highest labor force participation rate are those with the educational attainment of college / associate degree, with 88.0% or 601 individuals in the labor force. Within the labor force, individuals with high school diploma education have the highest percentage of unemployment, with 5.9% or 25 of them being unemployed.
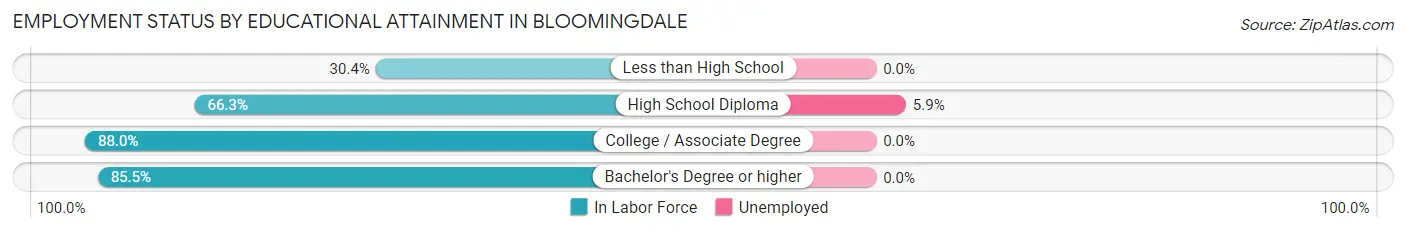
| Educational Attainment | In Labor Force | Unemployed |
| Less than High School | 42 (30.4%) | 0 (0.0%) |
| High School Diploma | 424 (66.3%) | 38 (5.9%) |
| College / Associate Degree | 601 (88.0%) | 0 (0.0%) |
| Bachelor's Degree or higher | 259 (85.5%) | 0 (0.0%) |
| Total | 1,327 (75.2%) | 34 (1.9%) |
Employment Occupations by Sex in Bloomingdale
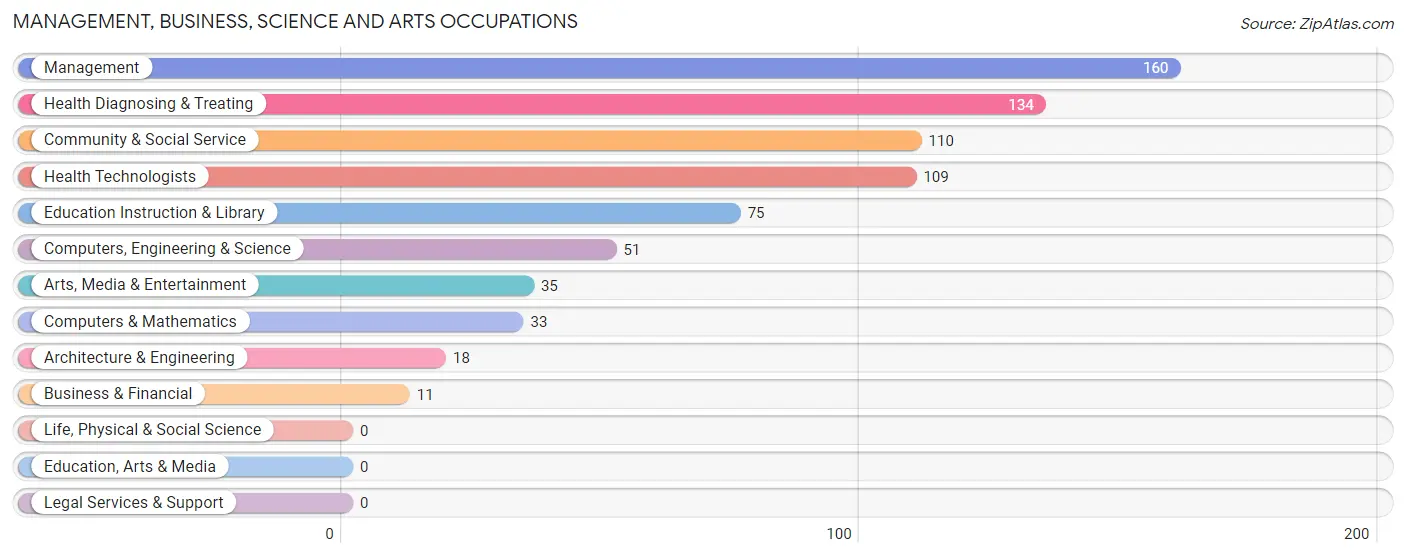
Management, Business, Science and Arts Occupations
The most common Management, Business, Science and Arts occupations in Bloomingdale are Management (160 | 10.4%), Health Diagnosing & Treating (134 | 8.7%), Community & Social Service (110 | 7.1%), Health Technologists (109 | 7.1%), and Education Instruction & Library (75 | 4.9%).
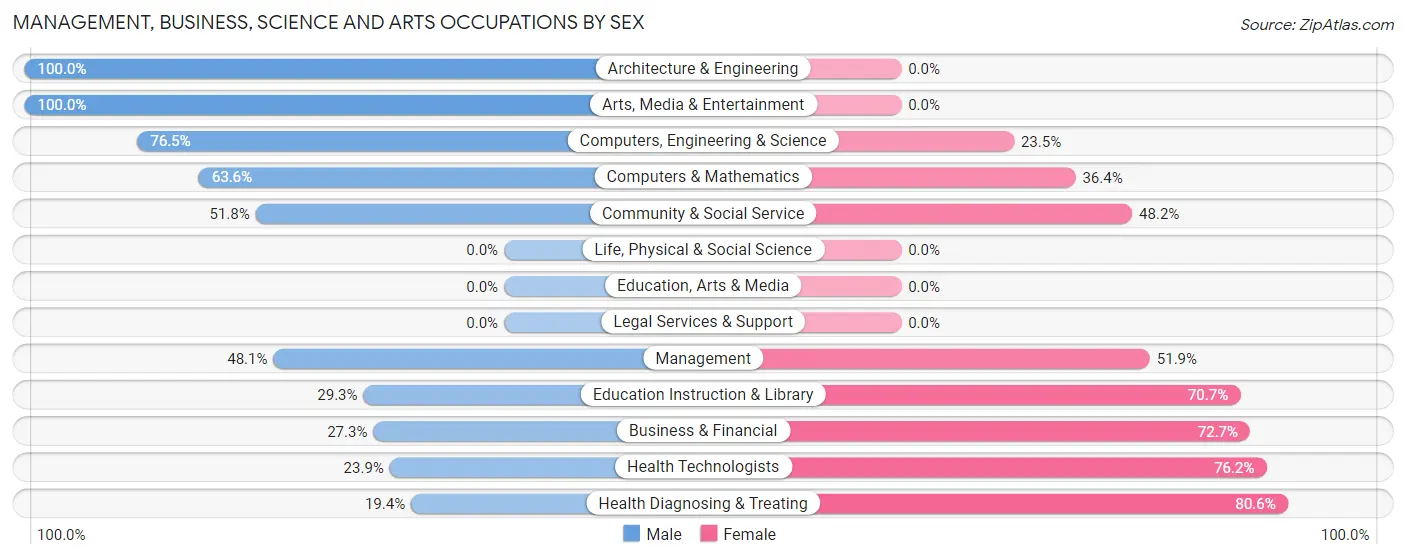
Management, Business, Science and Arts Occupations by Sex
Within the Management, Business, Science and Arts occupations in Bloomingdale, the most male-oriented occupations are Architecture & Engineering (100.0%), Arts, Media & Entertainment (100.0%), and Computers, Engineering & Science (76.5%), while the most female-oriented occupations are Health Diagnosing & Treating (80.6%), Health Technologists (76.1%), and Business & Financial (72.7%).
| Occupation | Male | Female |
| Management | 77 (48.1%) | 83 (51.9%) |
| Business & Financial | 3 (27.3%) | 8 (72.7%) |
| Computers, Engineering & Science | 39 (76.5%) | 12 (23.5%) |
| Computers & Mathematics | 21 (63.6%) | 12 (36.4%) |
| Architecture & Engineering | 18 (100.0%) | 0 (0.0%) |
| Life, Physical & Social Science | 0 (0.0%) | 0 (0.0%) |
| Community & Social Service | 57 (51.8%) | 53 (48.2%) |
| Education, Arts & Media | 0 (0.0%) | 0 (0.0%) |
| Legal Services & Support | 0 (0.0%) | 0 (0.0%) |
| Education Instruction & Library | 22 (29.3%) | 53 (70.7%) |
| Arts, Media & Entertainment | 35 (100.0%) | 0 (0.0%) |
| Health Diagnosing & Treating | 26 (19.4%) | 108 (80.6%) |
| Health Technologists | 26 (23.8%) | 83 (76.1%) |
| Total (Category) | 202 (43.3%) | 264 (56.7%) |
| Total (Overall) | 863 (56.1%) | 675 (43.9%) |
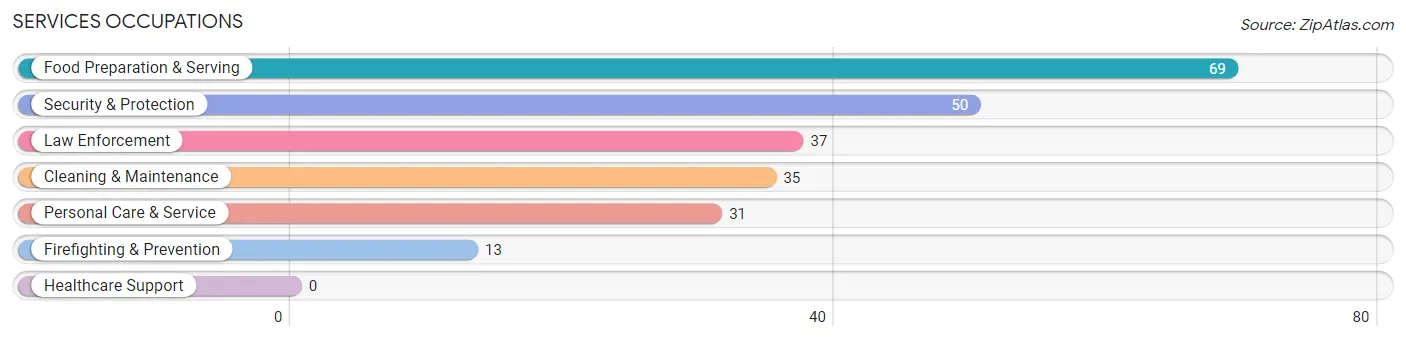
Services Occupations
The most common Services occupations in Bloomingdale are Food Preparation & Serving (69 | 4.5%), Security & Protection (50 | 3.3%), Law Enforcement (37 | 2.4%), Cleaning & Maintenance (35 | 2.3%), and Personal Care & Service (31 | 2.0%).
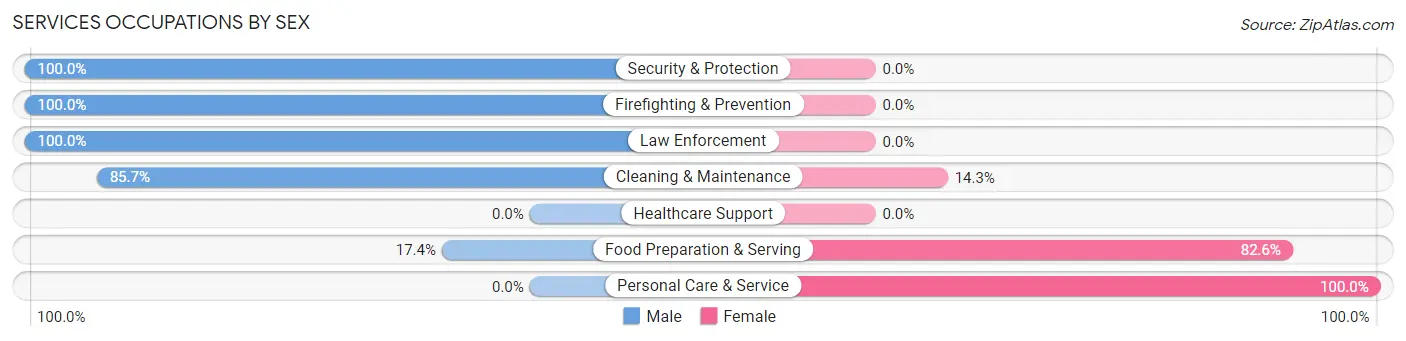
Services Occupations by Sex
Within the Services occupations in Bloomingdale, the most male-oriented occupations are Security & Protection (100.0%), Firefighting & Prevention (100.0%), and Law Enforcement (100.0%), while the most female-oriented occupations are Personal Care & Service (100.0%), Food Preparation & Serving (82.6%), and Cleaning & Maintenance (14.3%).
| Occupation | Male | Female |
| Healthcare Support | 0 (0.0%) | 0 (0.0%) |
| Security & Protection | 50 (100.0%) | 0 (0.0%) |
| Firefighting & Prevention | 13 (100.0%) | 0 (0.0%) |
| Law Enforcement | 37 (100.0%) | 0 (0.0%) |
| Food Preparation & Serving | 12 (17.4%) | 57 (82.6%) |
| Cleaning & Maintenance | 30 (85.7%) | 5 (14.3%) |
| Personal Care & Service | 0 (0.0%) | 31 (100.0%) |
| Total (Category) | 92 (49.7%) | 93 (50.3%) |
| Total (Overall) | 863 (56.1%) | 675 (43.9%) |
Sales and Office Occupations
The most common Sales and Office occupations in Bloomingdale are Office & Administration (153 | 10.0%), and Sales & Related (124 | 8.1%).
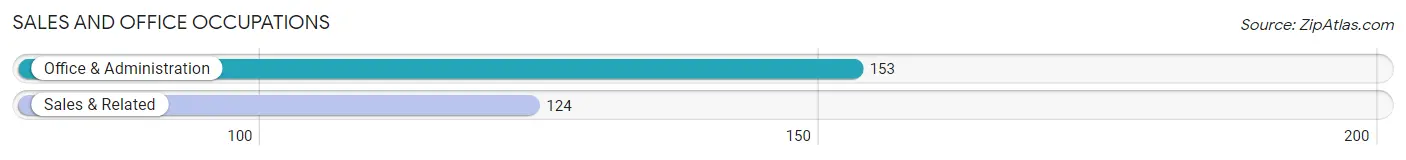
Sales and Office Occupations by Sex
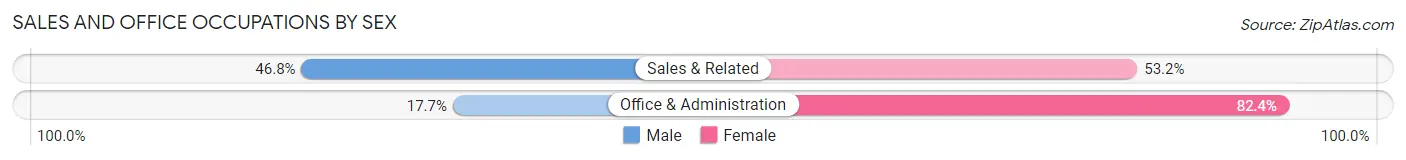
| Occupation | Male | Female |
| Sales & Related | 58 (46.8%) | 66 (53.2%) |
| Office & Administration | 27 (17.6%) | 126 (82.4%) |
| Total (Category) | 85 (30.7%) | 192 (69.3%) |
| Total (Overall) | 863 (56.1%) | 675 (43.9%) |
Natural Resources, Construction and Maintenance Occupations
The most common Natural Resources, Construction and Maintenance occupations in Bloomingdale are Construction & Extraction (182 | 11.8%), and Installation, Maintenance & Repair (75 | 4.9%).
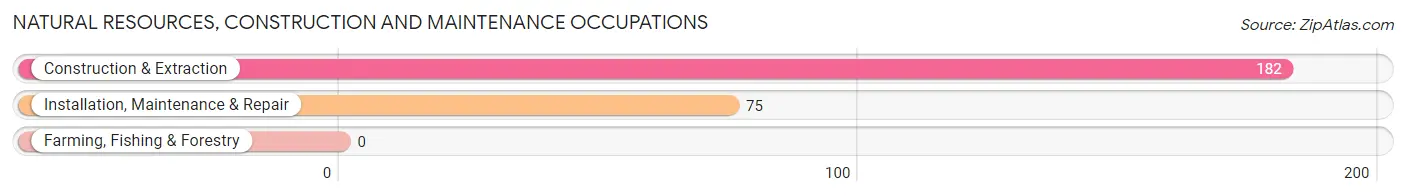
Natural Resources, Construction and Maintenance Occupations by Sex
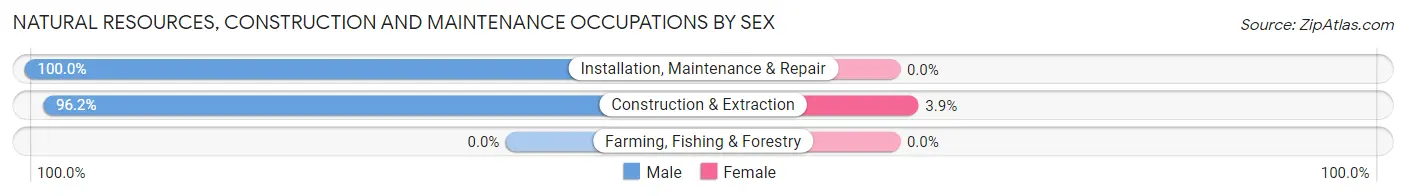
| Occupation | Male | Female |
| Farming, Fishing & Forestry | 0 (0.0%) | 0 (0.0%) |
| Construction & Extraction | 175 (96.2%) | 7 (3.8%) |
| Installation, Maintenance & Repair | 75 (100.0%) | 0 (0.0%) |
| Total (Category) | 250 (97.3%) | 7 (2.7%) |
| Total (Overall) | 863 (56.1%) | 675 (43.9%) |
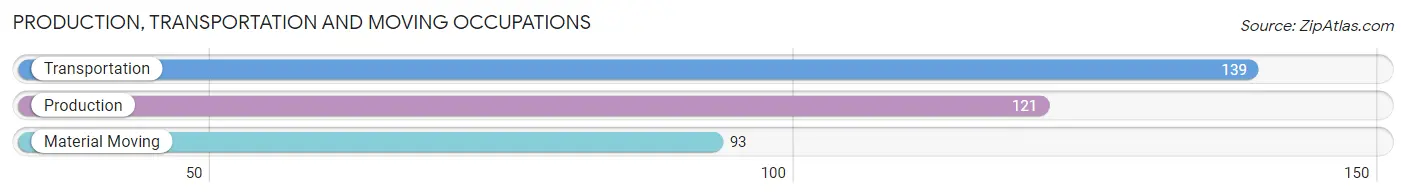
Production, Transportation and Moving Occupations
The most common Production, Transportation and Moving occupations in Bloomingdale are Transportation (139 | 9.0%), Production (121 | 7.9%), and Material Moving (93 | 6.0%).
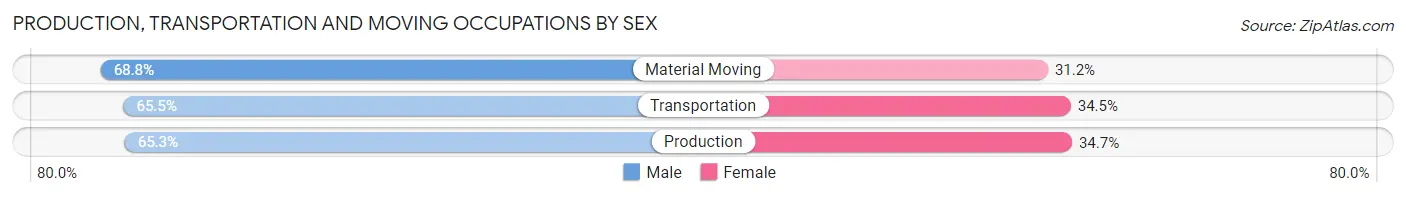
Production, Transportation and Moving Occupations by Sex
| Occupation | Male | Female |
| Production | 79 (65.3%) | 42 (34.7%) |
| Transportation | 91 (65.5%) | 48 (34.5%) |
| Material Moving | 64 (68.8%) | 29 (31.2%) |
| Total (Category) | 234 (66.3%) | 119 (33.7%) |
| Total (Overall) | 863 (56.1%) | 675 (43.9%) |
Employment Industries by Sex in Bloomingdale
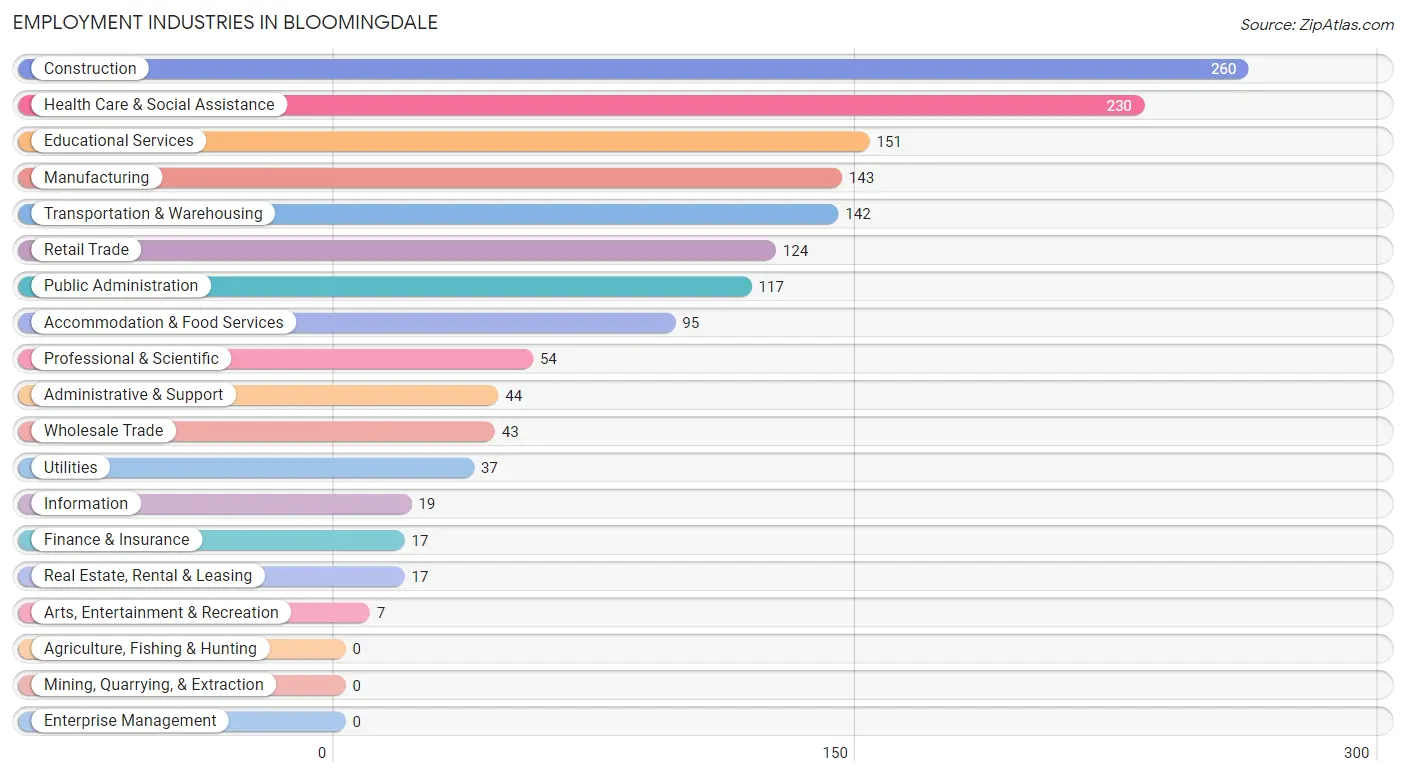
Employment Industries in Bloomingdale
The major employment industries in Bloomingdale include Construction (260 | 16.9%), Health Care & Social Assistance (230 | 14.9%), Educational Services (151 | 9.8%), Manufacturing (143 | 9.3%), and Transportation & Warehousing (142 | 9.2%).
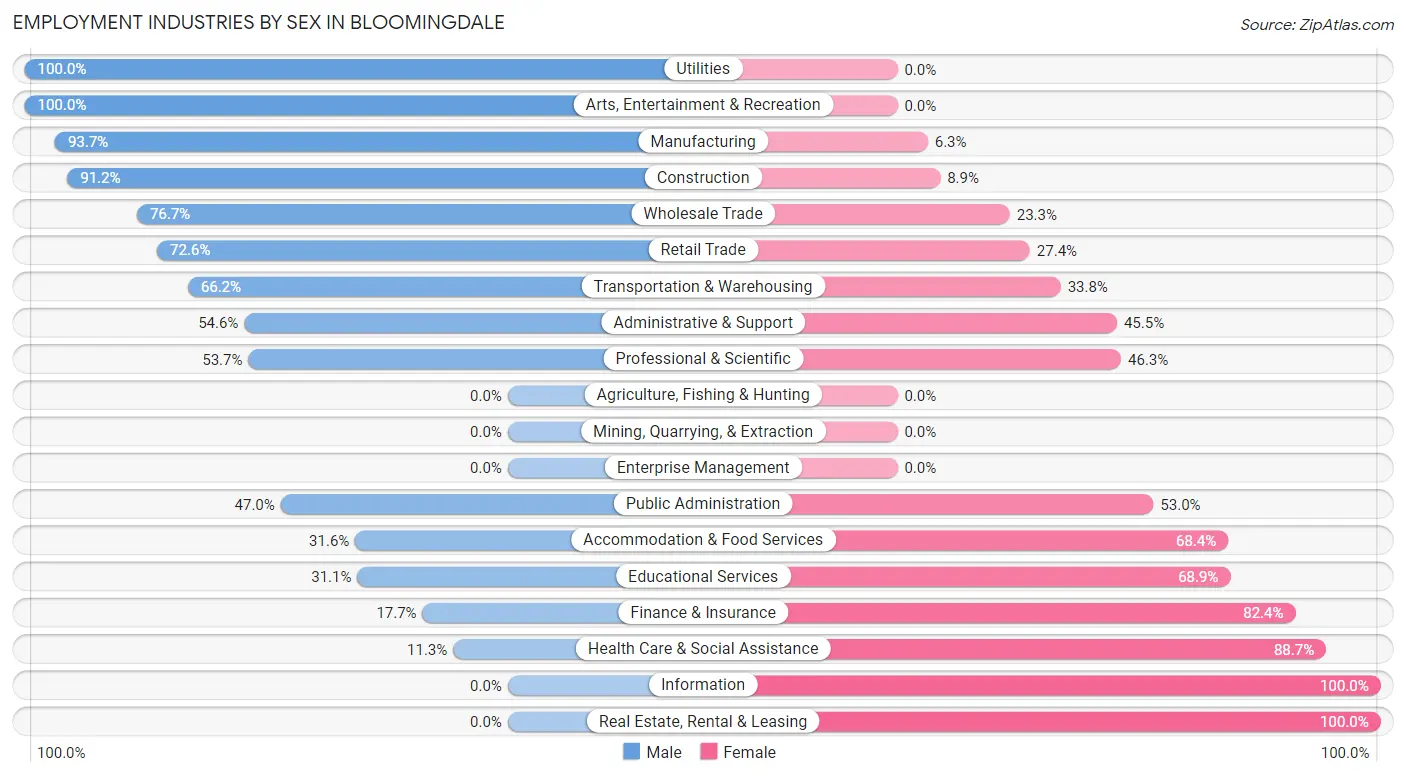
Employment Industries by Sex in Bloomingdale
The Bloomingdale industries that see more men than women are Utilities (100.0%), Arts, Entertainment & Recreation (100.0%), and Manufacturing (93.7%), whereas the industries that tend to have a higher number of women are Information (100.0%), Real Estate, Rental & Leasing (100.0%), and Health Care & Social Assistance (88.7%).
| Industry | Male | Female |
| Agriculture, Fishing & Hunting | 0 (0.0%) | 0 (0.0%) |
| Mining, Quarrying, & Extraction | 0 (0.0%) | 0 (0.0%) |
| Construction | 237 (91.1%) | 23 (8.8%) |
| Manufacturing | 134 (93.7%) | 9 (6.3%) |
| Wholesale Trade | 33 (76.7%) | 10 (23.3%) |
| Retail Trade | 90 (72.6%) | 34 (27.4%) |
| Transportation & Warehousing | 94 (66.2%) | 48 (33.8%) |
| Utilities | 37 (100.0%) | 0 (0.0%) |
| Information | 0 (0.0%) | 19 (100.0%) |
| Finance & Insurance | 3 (17.6%) | 14 (82.4%) |
| Real Estate, Rental & Leasing | 0 (0.0%) | 17 (100.0%) |
| Professional & Scientific | 29 (53.7%) | 25 (46.3%) |
| Enterprise Management | 0 (0.0%) | 0 (0.0%) |
| Administrative & Support | 24 (54.5%) | 20 (45.5%) |
| Educational Services | 47 (31.1%) | 104 (68.9%) |
| Health Care & Social Assistance | 26 (11.3%) | 204 (88.7%) |
| Arts, Entertainment & Recreation | 7 (100.0%) | 0 (0.0%) |
| Accommodation & Food Services | 30 (31.6%) | 65 (68.4%) |
| Public Administration | 55 (47.0%) | 62 (53.0%) |
| Total | 863 (56.1%) | 675 (43.9%) |
Education in Bloomingdale
School Enrollment in Bloomingdale
The most common levels of schooling among the 292 students in Bloomingdale are high school (92 | 31.5%), nursery / preschool (66 | 22.6%), and middle school (43 | 14.7%).
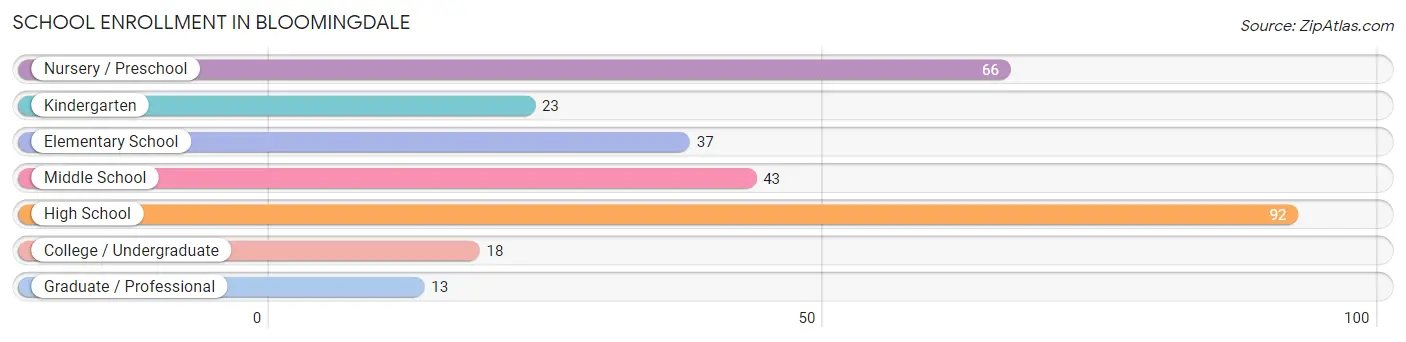
| School Level | # Students | % Students |
| Nursery / Preschool | 66 | 22.6% |
| Kindergarten | 23 | 7.9% |
| Elementary School | 37 | 12.7% |
| Middle School | 43 | 14.7% |
| High School | 92 | 31.5% |
| College / Undergraduate | 18 | 6.2% |
| Graduate / Professional | 13 | 4.4% |
| Total | 292 | 100.0% |
School Enrollment by Age by Funding Source in Bloomingdale
Out of a total of 292 students who are enrolled in schools in Bloomingdale, 32 (11.0%) attend a private institution, while the remaining 260 (89.0%) are enrolled in public schools. The age group of 10 to 14 year olds has the highest likelihood of being enrolled in private schools, with 21 (27.3% in the age bracket) enrolled. Conversely, the age group of 3 to 4 year olds has the lowest likelihood of being enrolled in a private school, with 51 (100.0% in the age bracket) attending a public institution.
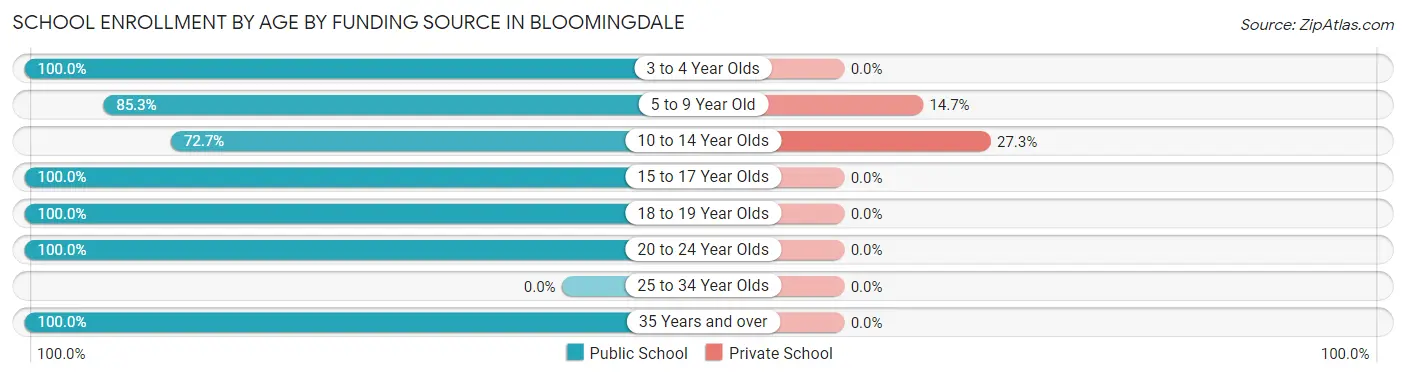
| Age Bracket | Public School | Private School |
| 3 to 4 Year Olds | 51 (100.0%) | 0 (0.0%) |
| 5 to 9 Year Old | 64 (85.3%) | 11 (14.7%) |
| 10 to 14 Year Olds | 56 (72.7%) | 21 (27.3%) |
| 15 to 17 Year Olds | 45 (100.0%) | 0 (0.0%) |
| 18 to 19 Year Olds | 13 (100.0%) | 0 (0.0%) |
| 20 to 24 Year Olds | 18 (100.0%) | 0 (0.0%) |
| 25 to 34 Year Olds | 0 (0.0%) | 0 (0.0%) |
| 35 Years and over | 13 (100.0%) | 0 (0.0%) |
| Total | 260 (89.0%) | 32 (11.0%) |
Educational Attainment by Field of Study in Bloomingdale
Business (188 | 46.1%), science & technology (36 | 8.8%), social sciences (34 | 8.3%), physical & health sciences (26 | 6.4%), and engineering (25 | 6.1%) are the most common fields of study among 408 individuals in Bloomingdale who have obtained a bachelor's degree or higher.
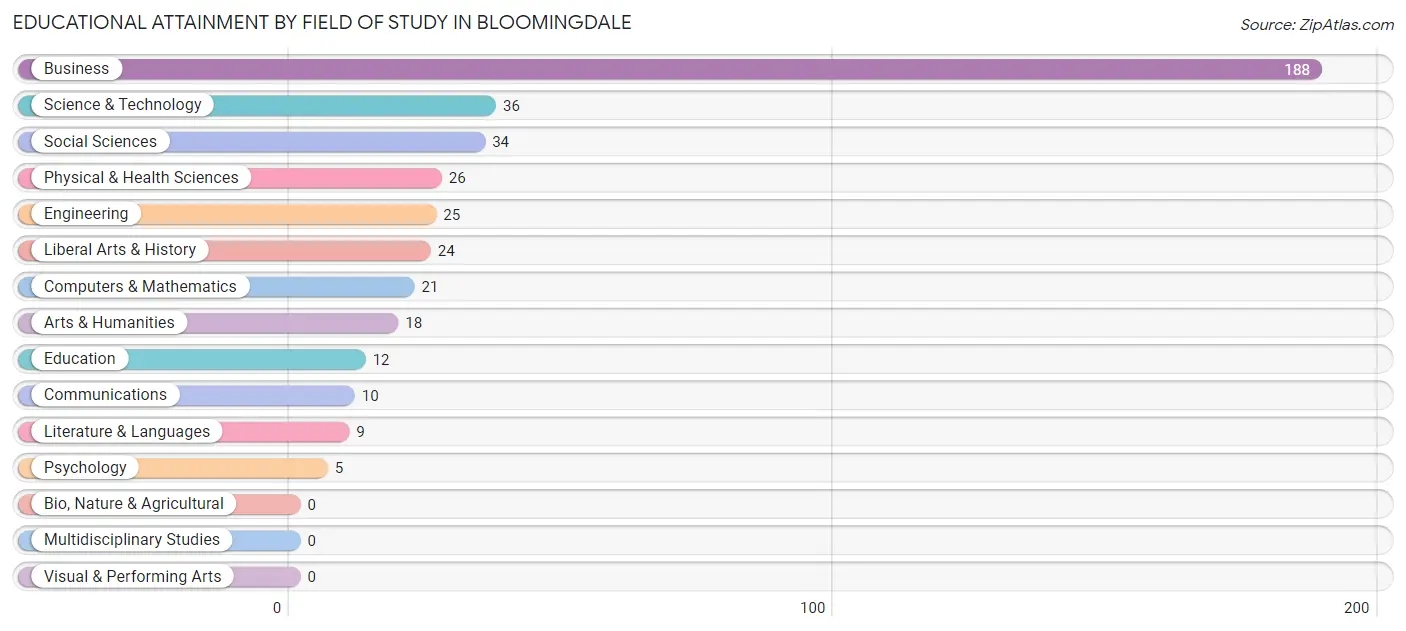
| Field of Study | # Graduates | % Graduates |
| Computers & Mathematics | 21 | 5.1% |
| Bio, Nature & Agricultural | 0 | 0.0% |
| Physical & Health Sciences | 26 | 6.4% |
| Psychology | 5 | 1.2% |
| Social Sciences | 34 | 8.3% |
| Engineering | 25 | 6.1% |
| Multidisciplinary Studies | 0 | 0.0% |
| Science & Technology | 36 | 8.8% |
| Business | 188 | 46.1% |
| Education | 12 | 2.9% |
| Literature & Languages | 9 | 2.2% |
| Liberal Arts & History | 24 | 5.9% |
| Visual & Performing Arts | 0 | 0.0% |
| Communications | 10 | 2.5% |
| Arts & Humanities | 18 | 4.4% |
| Total | 408 | 100.0% |
Transportation & Commute in Bloomingdale
Vehicle Availability by Sex in Bloomingdale
The most prevalent vehicle ownership categories in Bloomingdale are males with 2 vehicles (373, accounting for 42.3%) and females with 2 vehicles (362, making up 55.3%).
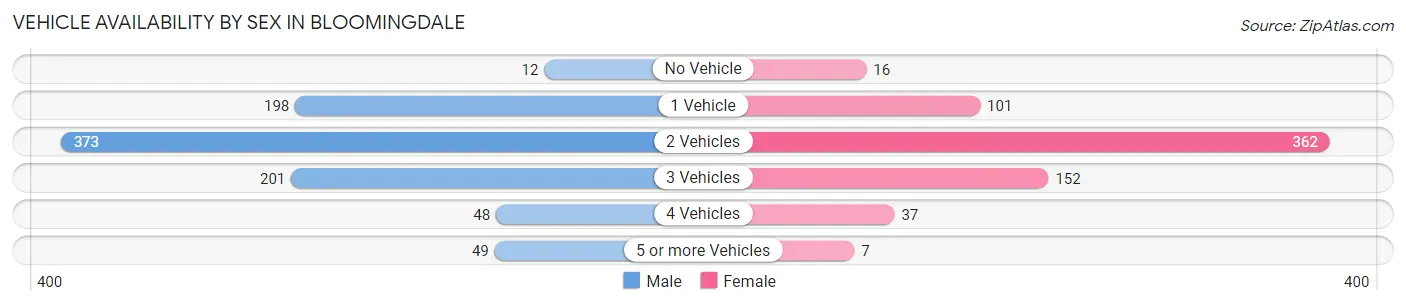
| Vehicles Available | Male | Female |
| No Vehicle | 12 (1.4%) | 16 (2.4%) |
| 1 Vehicle | 198 (22.5%) | 101 (15.0%) |
| 2 Vehicles | 373 (42.3%) | 362 (53.6%) |
| 3 Vehicles | 201 (22.8%) | 152 (22.5%) |
| 4 Vehicles | 48 (5.4%) | 37 (5.5%) |
| 5 or more Vehicles | 49 (5.6%) | 7 (1.0%) |
| Total | 881 (100.0%) | 675 (100.0%) |
Commute Time in Bloomingdale
The most frequently occuring commute durations in Bloomingdale are 30 to 34 minutes (306 commuters, 20.8%), 10 to 14 minutes (283 commuters, 19.3%), and 20 to 24 minutes (275 commuters, 18.7%).
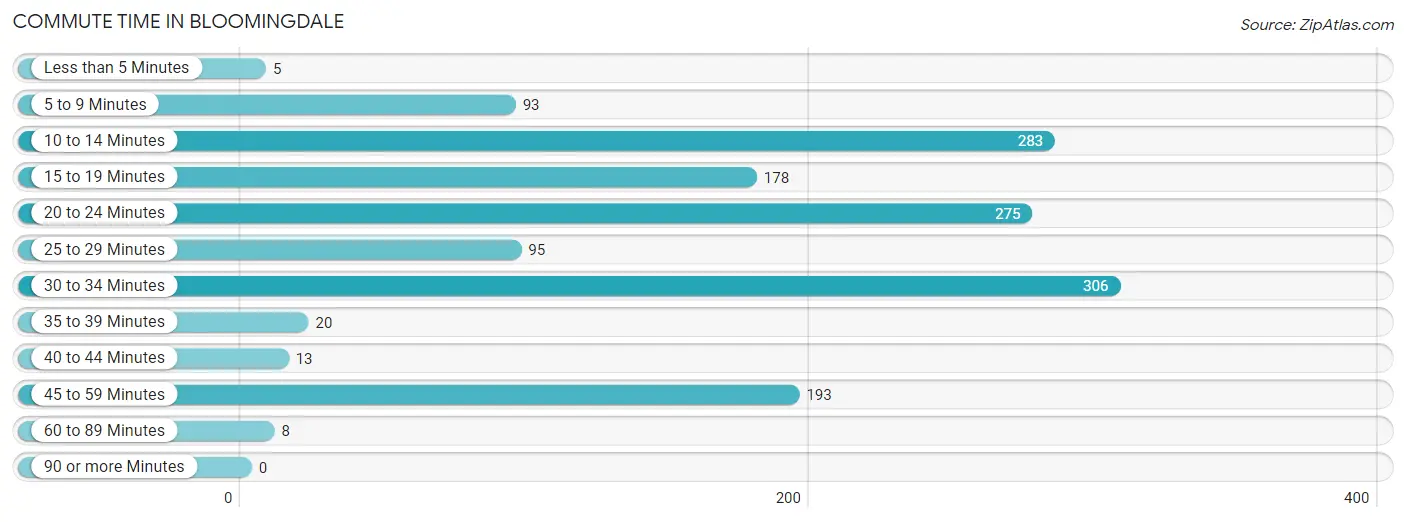
| Commute Time | # Commuters | % Commuters |
| Less than 5 Minutes | 5 | 0.3% |
| 5 to 9 Minutes | 93 | 6.3% |
| 10 to 14 Minutes | 283 | 19.3% |
| 15 to 19 Minutes | 178 | 12.1% |
| 20 to 24 Minutes | 275 | 18.7% |
| 25 to 29 Minutes | 95 | 6.5% |
| 30 to 34 Minutes | 306 | 20.8% |
| 35 to 39 Minutes | 20 | 1.4% |
| 40 to 44 Minutes | 13 | 0.9% |
| 45 to 59 Minutes | 193 | 13.1% |
| 60 to 89 Minutes | 8 | 0.5% |
| 90 or more Minutes | 0 | 0.0% |
Commute Time by Sex in Bloomingdale
The most common commute times in Bloomingdale are 30 to 34 minutes (174 commuters, 21.0%) for males and 10 to 14 minutes (176 commuters, 27.4%) for females.
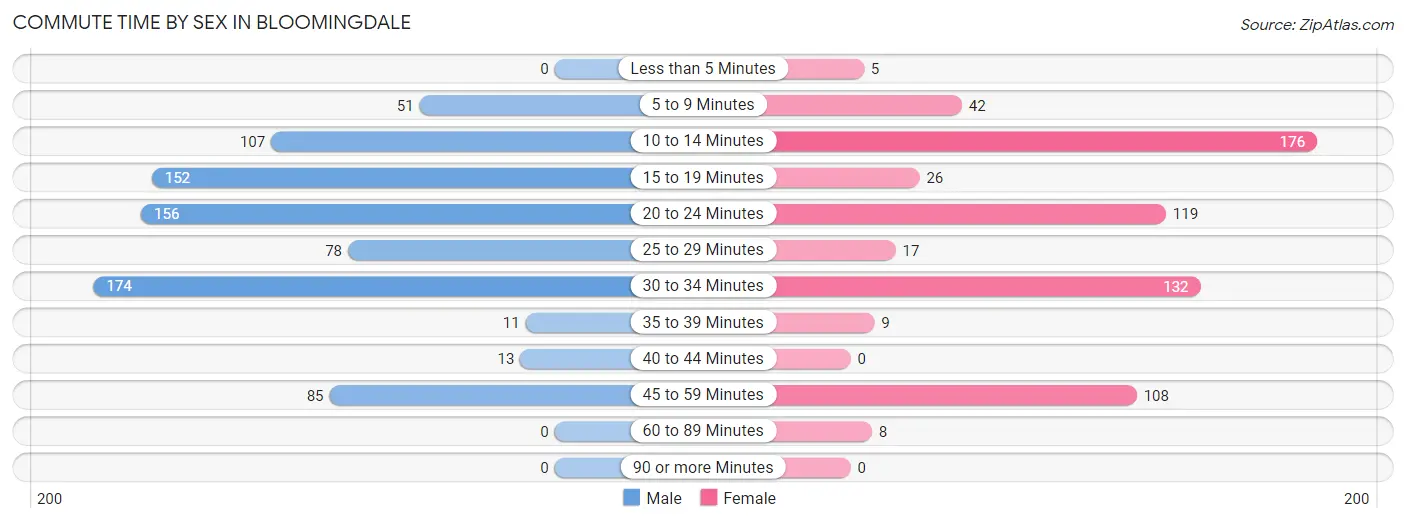
| Commute Time | Male | Female |
| Less than 5 Minutes | 0 (0.0%) | 5 (0.8%) |
| 5 to 9 Minutes | 51 (6.2%) | 42 (6.5%) |
| 10 to 14 Minutes | 107 (12.9%) | 176 (27.4%) |
| 15 to 19 Minutes | 152 (18.4%) | 26 (4.1%) |
| 20 to 24 Minutes | 156 (18.9%) | 119 (18.5%) |
| 25 to 29 Minutes | 78 (9.4%) | 17 (2.6%) |
| 30 to 34 Minutes | 174 (21.0%) | 132 (20.6%) |
| 35 to 39 Minutes | 11 (1.3%) | 9 (1.4%) |
| 40 to 44 Minutes | 13 (1.6%) | 0 (0.0%) |
| 45 to 59 Minutes | 85 (10.3%) | 108 (16.8%) |
| 60 to 89 Minutes | 0 (0.0%) | 8 (1.3%) |
| 90 or more Minutes | 0 (0.0%) | 0 (0.0%) |
Time of Departure to Work by Sex in Bloomingdale
The most frequent times of departure to work in Bloomingdale are 7:00 AM to 7:29 AM (170, 20.6%) for males and 7:00 AM to 7:29 AM (306, 47.7%) for females.
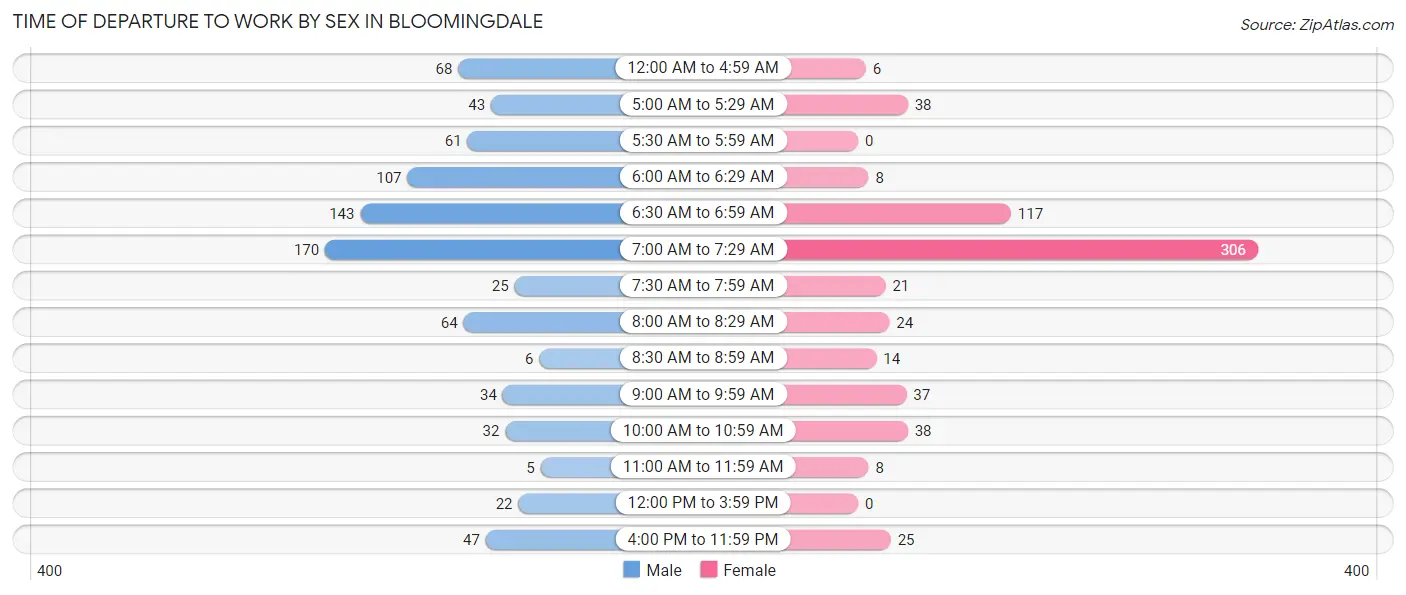
| Time of Departure | Male | Female |
| 12:00 AM to 4:59 AM | 68 (8.2%) | 6 (0.9%) |
| 5:00 AM to 5:29 AM | 43 (5.2%) | 38 (5.9%) |
| 5:30 AM to 5:59 AM | 61 (7.4%) | 0 (0.0%) |
| 6:00 AM to 6:29 AM | 107 (12.9%) | 8 (1.3%) |
| 6:30 AM to 6:59 AM | 143 (17.3%) | 117 (18.2%) |
| 7:00 AM to 7:29 AM | 170 (20.6%) | 306 (47.7%) |
| 7:30 AM to 7:59 AM | 25 (3.0%) | 21 (3.3%) |
| 8:00 AM to 8:29 AM | 64 (7.7%) | 24 (3.7%) |
| 8:30 AM to 8:59 AM | 6 (0.7%) | 14 (2.2%) |
| 9:00 AM to 9:59 AM | 34 (4.1%) | 37 (5.8%) |
| 10:00 AM to 10:59 AM | 32 (3.9%) | 38 (5.9%) |
| 11:00 AM to 11:59 AM | 5 (0.6%) | 8 (1.3%) |
| 12:00 PM to 3:59 PM | 22 (2.7%) | 0 (0.0%) |
| 4:00 PM to 11:59 PM | 47 (5.7%) | 25 (3.9%) |
| Total | 827 (100.0%) | 642 (100.0%) |
Housing Occupancy in Bloomingdale
Occupancy by Ownership in Bloomingdale
Of the total 1,271 dwellings in Bloomingdale, owner-occupied units account for 870 (68.4%), while renter-occupied units make up 401 (31.6%).
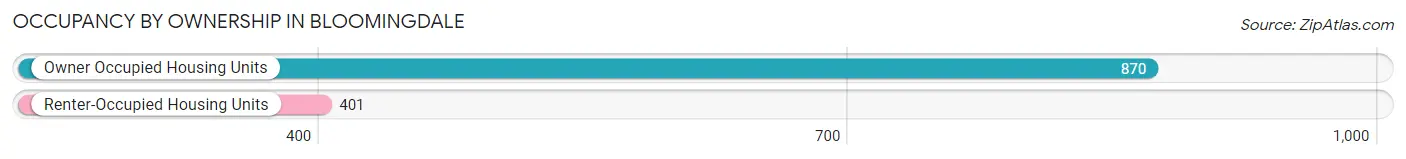
| Occupancy | # Housing Units | % Housing Units |
| Owner Occupied Housing Units | 870 | 68.4% |
| Renter-Occupied Housing Units | 401 | 31.6% |
| Total Occupied Housing Units | 1,271 | 100.0% |
Occupancy by Household Size in Bloomingdale
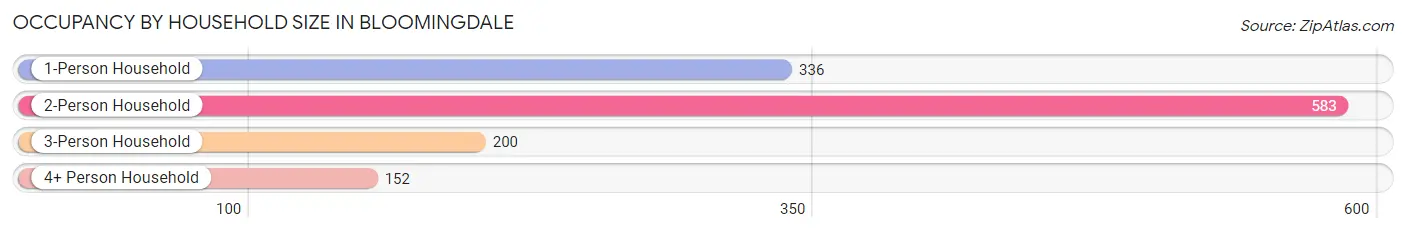
| Household Size | # Housing Units | % Housing Units |
| 1-Person Household | 336 | 26.4% |
| 2-Person Household | 583 | 45.9% |
| 3-Person Household | 200 | 15.7% |
| 4+ Person Household | 152 | 12.0% |
| Total Housing Units | 1,271 | 100.0% |
Occupancy by Ownership by Household Size in Bloomingdale
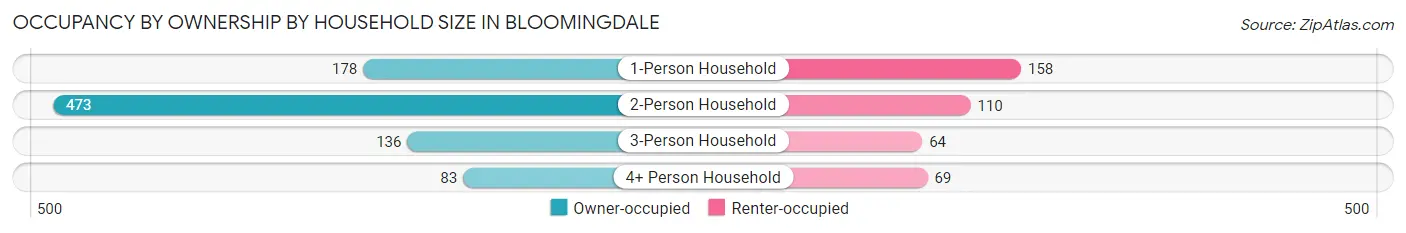
| Household Size | Owner-occupied | Renter-occupied |
| 1-Person Household | 178 (53.0%) | 158 (47.0%) |
| 2-Person Household | 473 (81.1%) | 110 (18.9%) |
| 3-Person Household | 136 (68.0%) | 64 (32.0%) |
| 4+ Person Household | 83 (54.6%) | 69 (45.4%) |
| Total Housing Units | 870 (68.4%) | 401 (31.6%) |
Occupancy by Educational Attainment in Bloomingdale
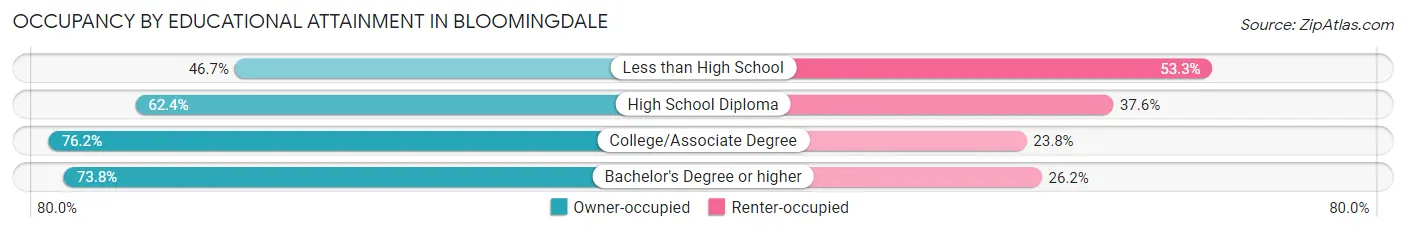
| Household Size | Owner-occupied | Renter-occupied |
| Less than High School | 56 (46.7%) | 64 (53.3%) |
| High School Diploma | 261 (62.4%) | 157 (37.6%) |
| College/Associate Degree | 390 (76.2%) | 122 (23.8%) |
| Bachelor's Degree or higher | 163 (73.8%) | 58 (26.2%) |
Occupancy by Age of Householder in Bloomingdale
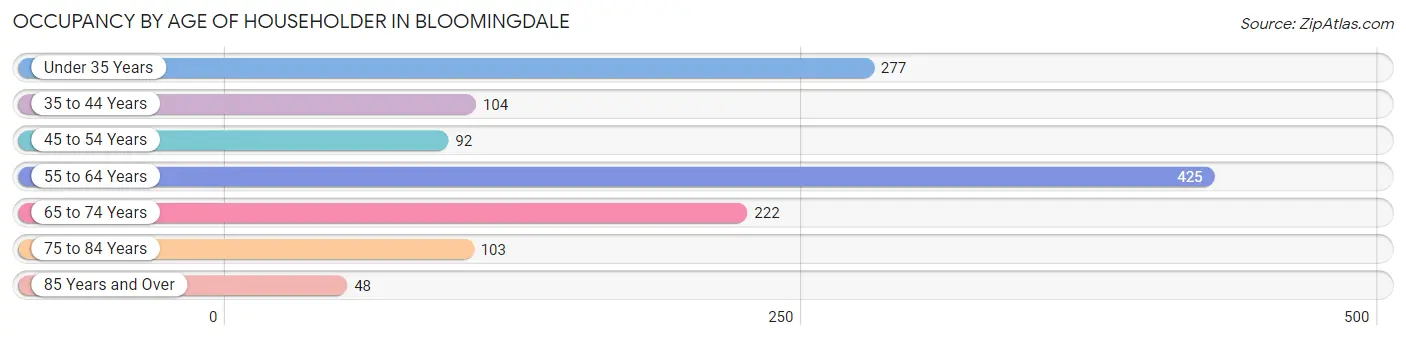
| Age Bracket | # Households | % Households |
| Under 35 Years | 277 | 21.8% |
| 35 to 44 Years | 104 | 8.2% |
| 45 to 54 Years | 92 | 7.2% |
| 55 to 64 Years | 425 | 33.4% |
| 65 to 74 Years | 222 | 17.5% |
| 75 to 84 Years | 103 | 8.1% |
| 85 Years and Over | 48 | 3.8% |
| Total | 1,271 | 100.0% |
Housing Finances in Bloomingdale
Median Income by Occupancy in Bloomingdale
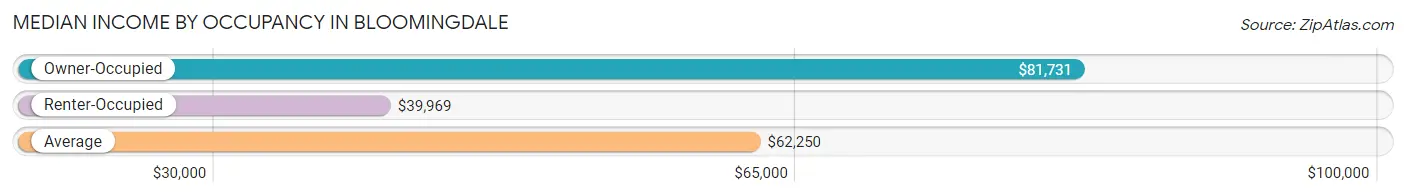
| Occupancy Type | # Households | Median Income |
| Owner-Occupied | 870 (68.4%) | $81,731 |
| Renter-Occupied | 401 (31.6%) | $39,969 |
| Average | 1,271 (100.0%) | $62,250 |
Occupancy by Householder Income Bracket in Bloomingdale
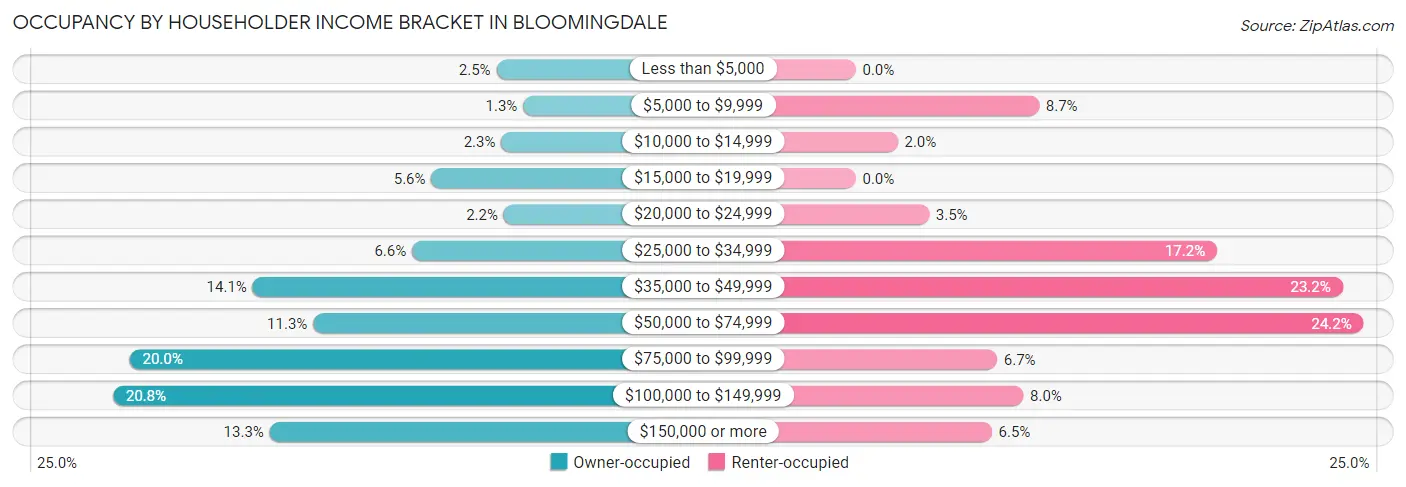
| Income Bracket | Owner-occupied | Renter-occupied |
| Less than $5,000 | 22 (2.5%) | 0 (0.0%) |
| $5,000 to $9,999 | 11 (1.3%) | 35 (8.7%) |
| $10,000 to $14,999 | 20 (2.3%) | 8 (2.0%) |
| $15,000 to $19,999 | 49 (5.6%) | 0 (0.0%) |
| $20,000 to $24,999 | 19 (2.2%) | 14 (3.5%) |
| $25,000 to $34,999 | 57 (6.6%) | 69 (17.2%) |
| $35,000 to $49,999 | 123 (14.1%) | 93 (23.2%) |
| $50,000 to $74,999 | 98 (11.3%) | 97 (24.2%) |
| $75,000 to $99,999 | 174 (20.0%) | 27 (6.7%) |
| $100,000 to $149,999 | 181 (20.8%) | 32 (8.0%) |
| $150,000 or more | 116 (13.3%) | 26 (6.5%) |
| Total | 870 (100.0%) | 401 (100.0%) |
Monthly Housing Cost Tiers in Bloomingdale
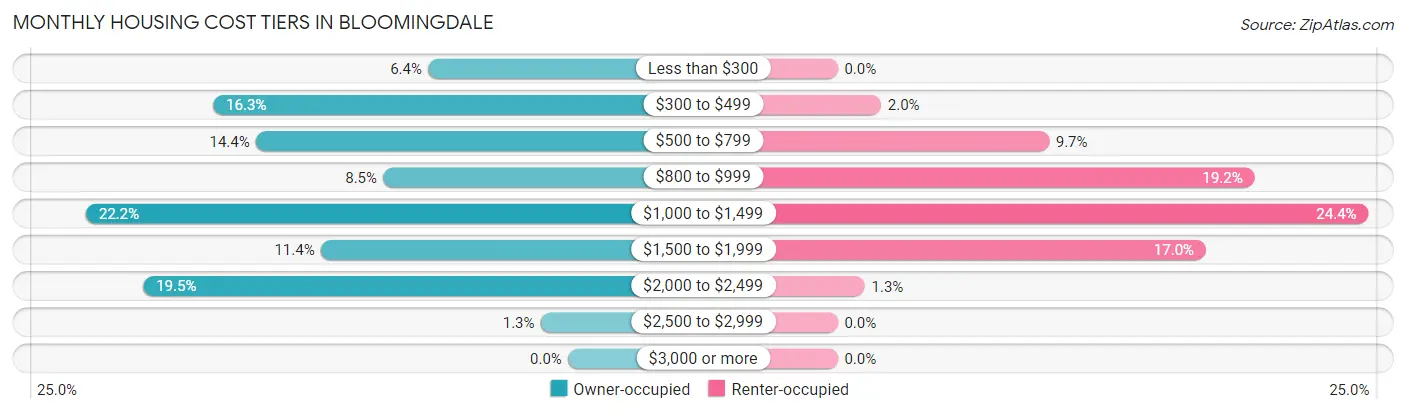
| Monthly Cost | Owner-occupied | Renter-occupied |
| Less than $300 | 56 (6.4%) | 0 (0.0%) |
| $300 to $499 | 142 (16.3%) | 8 (2.0%) |
| $500 to $799 | 125 (14.4%) | 39 (9.7%) |
| $800 to $999 | 74 (8.5%) | 77 (19.2%) |
| $1,000 to $1,499 | 193 (22.2%) | 98 (24.4%) |
| $1,500 to $1,999 | 99 (11.4%) | 68 (17.0%) |
| $2,000 to $2,499 | 170 (19.5%) | 5 (1.3%) |
| $2,500 to $2,999 | 11 (1.3%) | 0 (0.0%) |
| $3,000 or more | 0 (0.0%) | 0 (0.0%) |
| Total | 870 (100.0%) | 401 (100.0%) |
Physical Housing Characteristics in Bloomingdale
Housing Structures in Bloomingdale
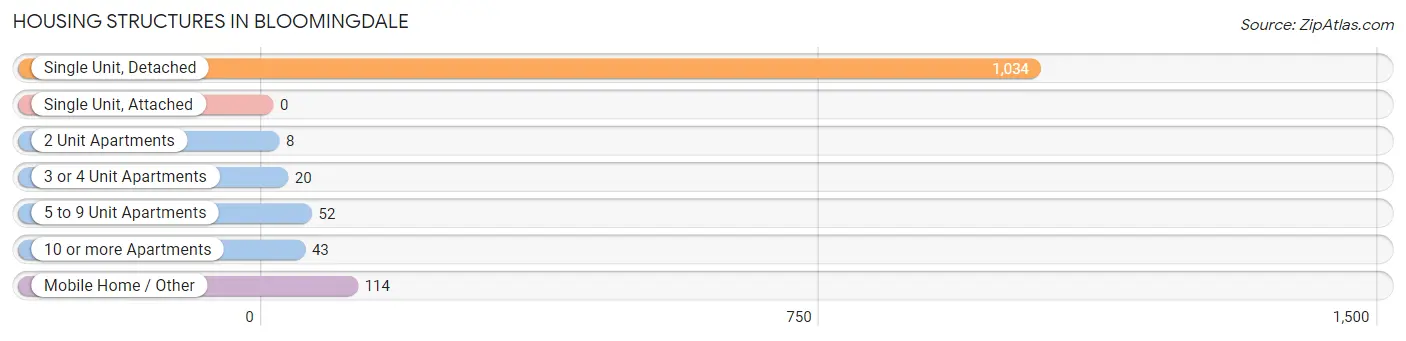
| Structure Type | # Housing Units | % Housing Units |
| Single Unit, Detached | 1,034 | 81.4% |
| Single Unit, Attached | 0 | 0.0% |
| 2 Unit Apartments | 8 | 0.6% |
| 3 or 4 Unit Apartments | 20 | 1.6% |
| 5 to 9 Unit Apartments | 52 | 4.1% |
| 10 or more Apartments | 43 | 3.4% |
| Mobile Home / Other | 114 | 9.0% |
| Total | 1,271 | 100.0% |
Housing Structures by Occupancy in Bloomingdale
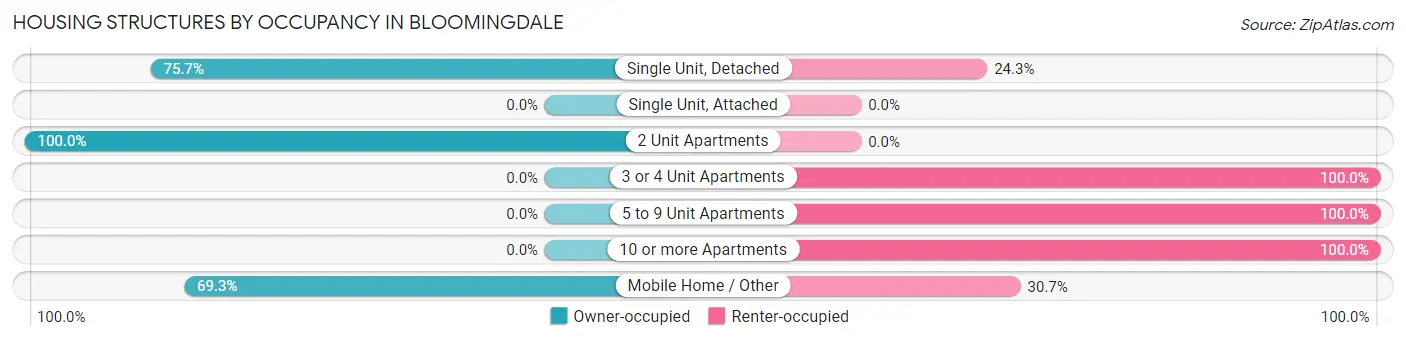
| Structure Type | Owner-occupied | Renter-occupied |
| Single Unit, Detached | 783 (75.7%) | 251 (24.3%) |
| Single Unit, Attached | 0 (0.0%) | 0 (0.0%) |
| 2 Unit Apartments | 8 (100.0%) | 0 (0.0%) |
| 3 or 4 Unit Apartments | 0 (0.0%) | 20 (100.0%) |
| 5 to 9 Unit Apartments | 0 (0.0%) | 52 (100.0%) |
| 10 or more Apartments | 0 (0.0%) | 43 (100.0%) |
| Mobile Home / Other | 79 (69.3%) | 35 (30.7%) |
| Total | 870 (68.4%) | 401 (31.6%) |
Housing Structures by Number of Rooms in Bloomingdale
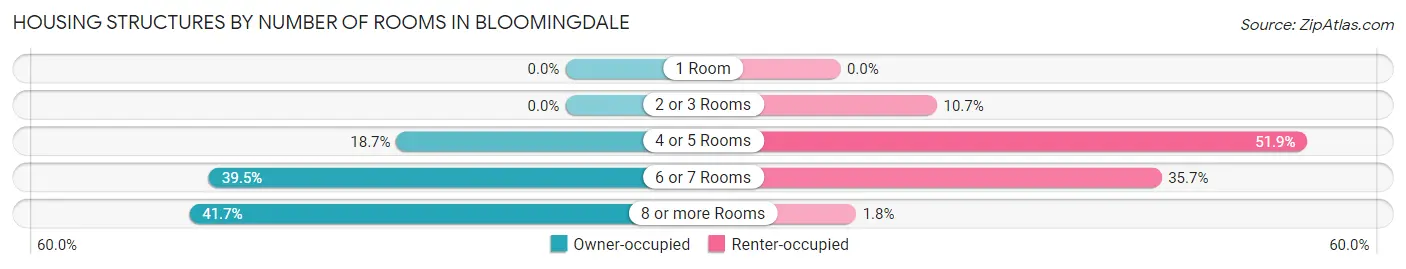
| Number of Rooms | Owner-occupied | Renter-occupied |
| 1 Room | 0 (0.0%) | 0 (0.0%) |
| 2 or 3 Rooms | 0 (0.0%) | 43 (10.7%) |
| 4 or 5 Rooms | 163 (18.7%) | 208 (51.9%) |
| 6 or 7 Rooms | 344 (39.5%) | 143 (35.7%) |
| 8 or more Rooms | 363 (41.7%) | 7 (1.8%) |
| Total | 870 (100.0%) | 401 (100.0%) |
Housing Structure by Heating Type in Bloomingdale
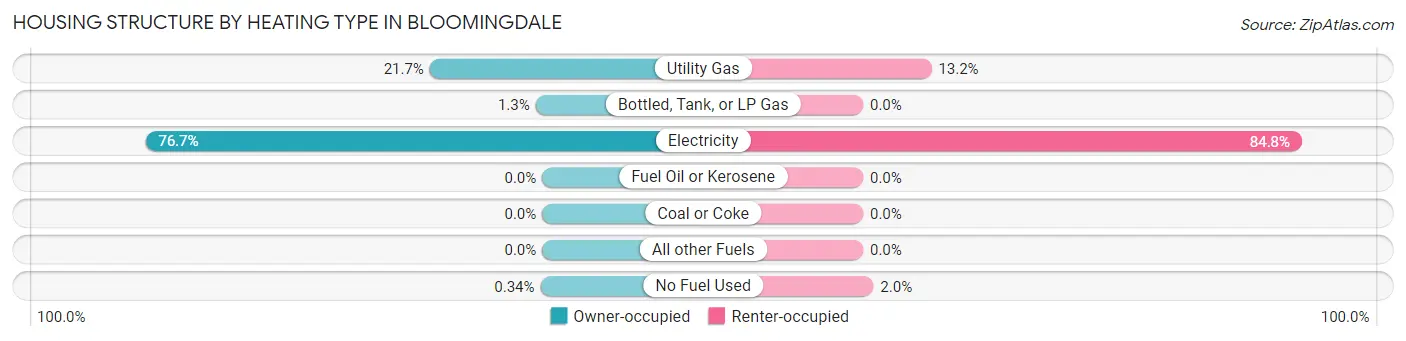
| Heating Type | Owner-occupied | Renter-occupied |
| Utility Gas | 189 (21.7%) | 53 (13.2%) |
| Bottled, Tank, or LP Gas | 11 (1.3%) | 0 (0.0%) |
| Electricity | 667 (76.7%) | 340 (84.8%) |
| Fuel Oil or Kerosene | 0 (0.0%) | 0 (0.0%) |
| Coal or Coke | 0 (0.0%) | 0 (0.0%) |
| All other Fuels | 0 (0.0%) | 0 (0.0%) |
| No Fuel Used | 3 (0.3%) | 8 (2.0%) |
| Total | 870 (100.0%) | 401 (100.0%) |
Household Vehicle Usage in Bloomingdale
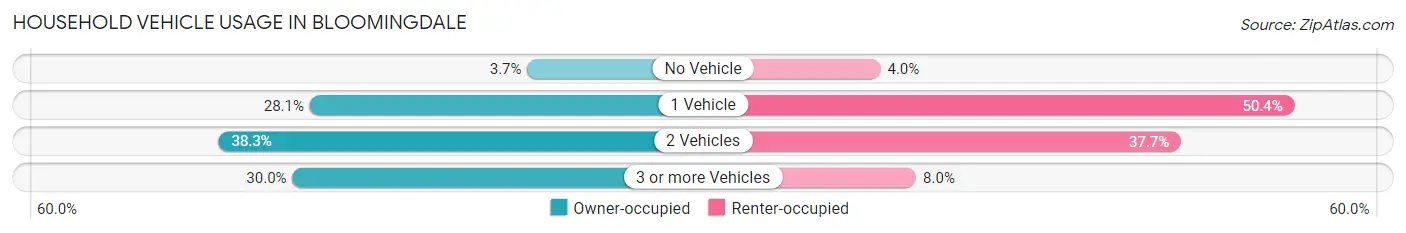
| Vehicles per Household | Owner-occupied | Renter-occupied |
| No Vehicle | 32 (3.7%) | 16 (4.0%) |
| 1 Vehicle | 244 (28.1%) | 202 (50.4%) |
| 2 Vehicles | 333 (38.3%) | 151 (37.7%) |
| 3 or more Vehicles | 261 (30.0%) | 32 (8.0%) |
| Total | 870 (100.0%) | 401 (100.0%) |
Real Estate & Mortgages in Bloomingdale
Real Estate and Mortgage Overview in Bloomingdale
| Characteristic | Without Mortgage | With Mortgage |
| Housing Units | 363 | 507 |
| Median Property Value | $168,000 | $190,300 |
| Median Household Income | $63,542 | $103 |
| Monthly Housing Costs | $479 | $0 |
| Real Estate Taxes | $1,281 | $13 |
Property Value by Mortgage Status in Bloomingdale
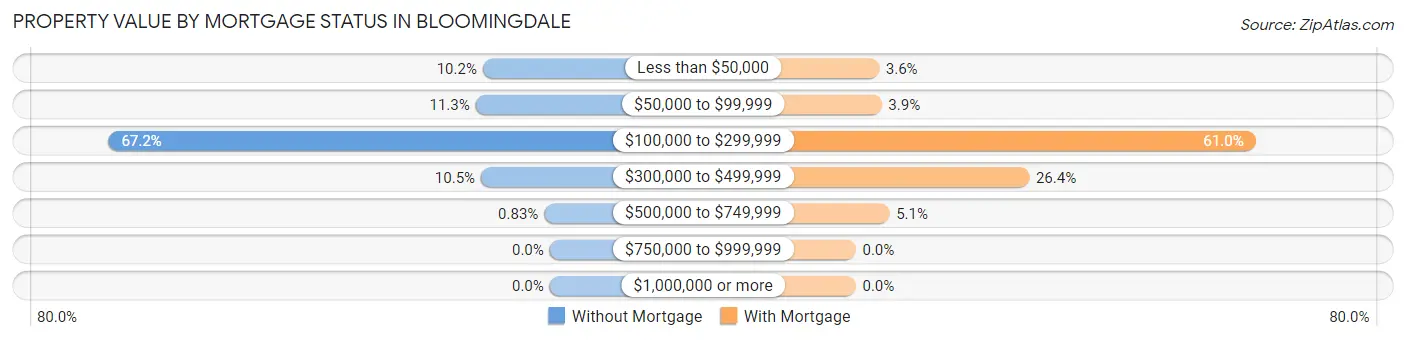
| Property Value | Without Mortgage | With Mortgage |
| Less than $50,000 | 37 (10.2%) | 18 (3.5%) |
| $50,000 to $99,999 | 41 (11.3%) | 20 (3.9%) |
| $100,000 to $299,999 | 244 (67.2%) | 309 (61.0%) |
| $300,000 to $499,999 | 38 (10.5%) | 134 (26.4%) |
| $500,000 to $749,999 | 3 (0.8%) | 26 (5.1%) |
| $750,000 to $999,999 | 0 (0.0%) | 0 (0.0%) |
| $1,000,000 or more | 0 (0.0%) | 0 (0.0%) |
| Total | 363 (100.0%) | 507 (100.0%) |
Household Income by Mortgage Status in Bloomingdale
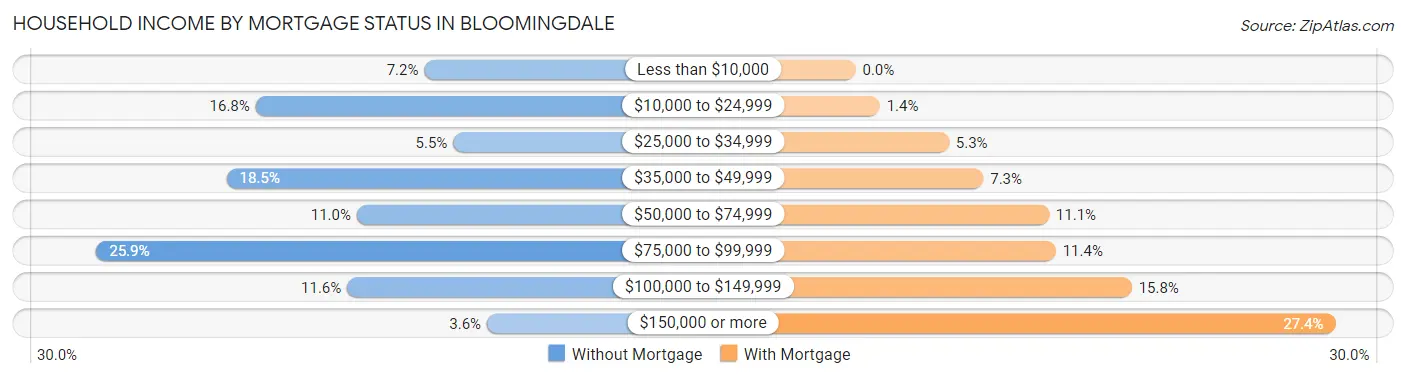
| Household Income | Without Mortgage | With Mortgage |
| Less than $10,000 | 26 (7.2%) | 0 (0.0%) |
| $10,000 to $24,999 | 61 (16.8%) | 7 (1.4%) |
| $25,000 to $34,999 | 20 (5.5%) | 27 (5.3%) |
| $35,000 to $49,999 | 67 (18.5%) | 37 (7.3%) |
| $50,000 to $74,999 | 40 (11.0%) | 56 (11.1%) |
| $75,000 to $99,999 | 94 (25.9%) | 58 (11.4%) |
| $100,000 to $149,999 | 42 (11.6%) | 80 (15.8%) |
| $150,000 or more | 13 (3.6%) | 139 (27.4%) |
| Total | 363 (100.0%) | 507 (100.0%) |
Property Value to Household Income Ratio in Bloomingdale
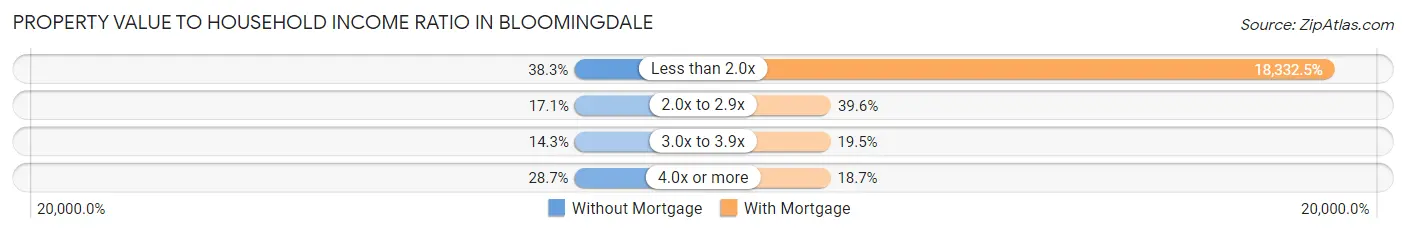
| Value-to-Income Ratio | Without Mortgage | With Mortgage |
| Less than 2.0x | 139 (38.3%) | 92,946 (18,332.5%) |
| 2.0x to 2.9x | 62 (17.1%) | 201 (39.6%) |
| 3.0x to 3.9x | 52 (14.3%) | 99 (19.5%) |
| 4.0x or more | 104 (28.6%) | 95 (18.7%) |
| Total | 363 (100.0%) | 507 (100.0%) |
Real Estate Taxes by Mortgage Status in Bloomingdale
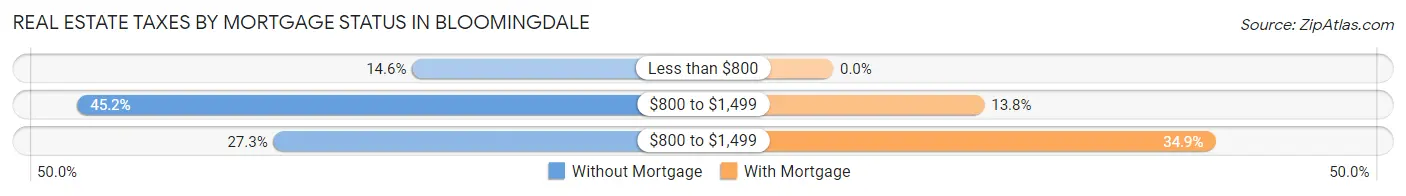
| Property Taxes | Without Mortgage | With Mortgage |
| Less than $800 | 53 (14.6%) | 0 (0.0%) |
| $800 to $1,499 | 164 (45.2%) | 70 (13.8%) |
| $800 to $1,499 | 99 (27.3%) | 177 (34.9%) |
| Total | 363 (100.0%) | 507 (100.0%) |
Health & Disability in Bloomingdale
Health Insurance Coverage by Age in Bloomingdale
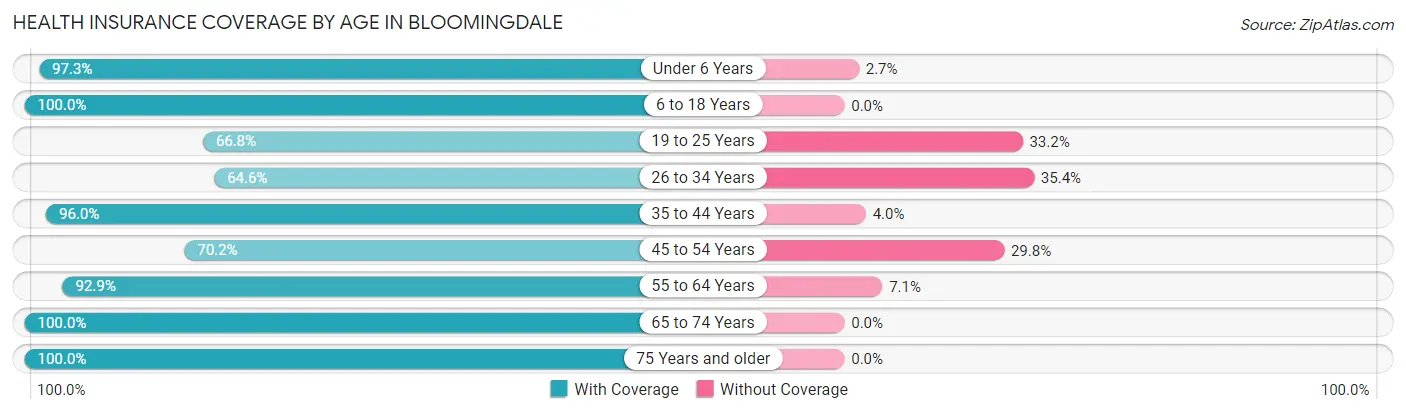
| Age Bracket | With Coverage | Without Coverage |
| Under 6 Years | 216 (97.3%) | 6 (2.7%) |
| 6 to 18 Years | 208 (100.0%) | 0 (0.0%) |
| 19 to 25 Years | 225 (66.8%) | 112 (33.2%) |
| 26 to 34 Years | 170 (64.6%) | 93 (35.4%) |
| 35 to 44 Years | 216 (96.0%) | 9 (4.0%) |
| 45 to 54 Years | 158 (70.2%) | 67 (29.8%) |
| 55 to 64 Years | 815 (92.9%) | 62 (7.1%) |
| 65 to 74 Years | 337 (100.0%) | 0 (0.0%) |
| 75 Years and older | 219 (100.0%) | 0 (0.0%) |
| Total | 2,564 (88.0%) | 349 (12.0%) |
Health Insurance Coverage by Citizenship Status in Bloomingdale
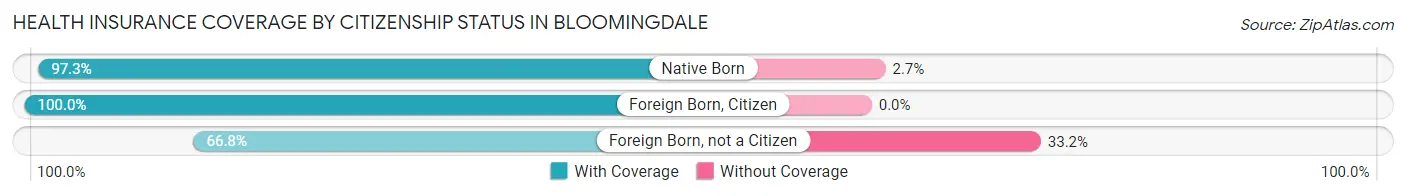
| Citizenship Status | With Coverage | Without Coverage |
| Native Born | 216 (97.3%) | 6 (2.7%) |
| Foreign Born, Citizen | 208 (100.0%) | 0 (0.0%) |
| Foreign Born, not a Citizen | 225 (66.8%) | 112 (33.2%) |
Health Insurance Coverage by Household Income in Bloomingdale
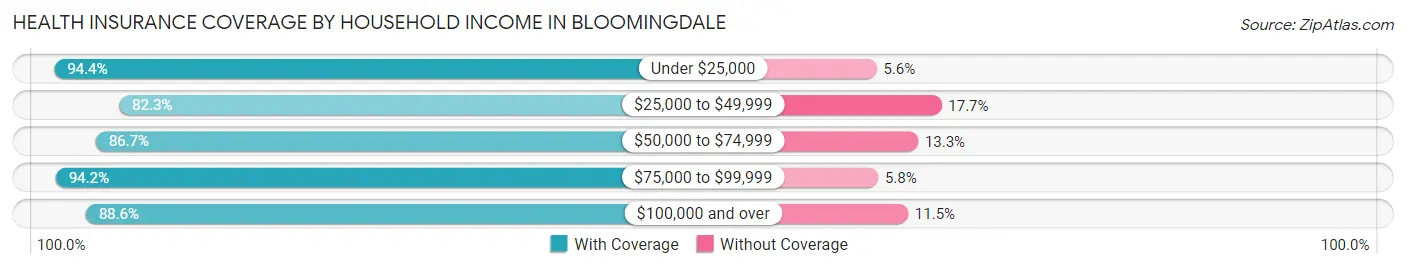
| Household Income | With Coverage | Without Coverage |
| Under $25,000 | 306 (94.4%) | 18 (5.6%) |
| $25,000 to $49,999 | 687 (82.3%) | 148 (17.7%) |
| $50,000 to $74,999 | 286 (86.7%) | 44 (13.3%) |
| $75,000 to $99,999 | 403 (94.2%) | 25 (5.8%) |
| $100,000 and over | 882 (88.5%) | 114 (11.5%) |
Public vs Private Health Insurance Coverage by Age in Bloomingdale
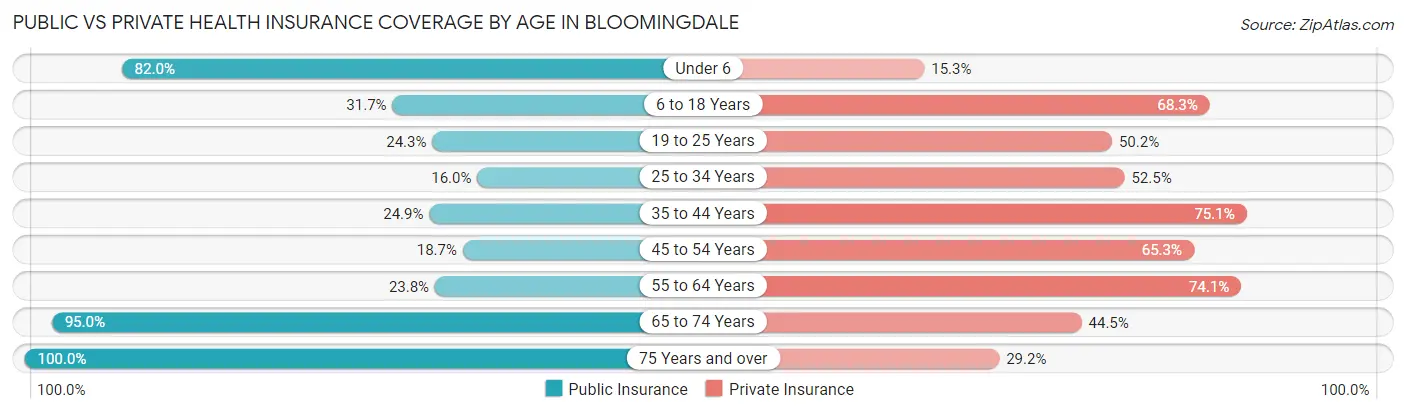
| Age Bracket | Public Insurance | Private Insurance |
| Under 6 | 182 (82.0%) | 34 (15.3%) |
| 6 to 18 Years | 66 (31.7%) | 142 (68.3%) |
| 19 to 25 Years | 82 (24.3%) | 169 (50.1%) |
| 25 to 34 Years | 42 (16.0%) | 138 (52.5%) |
| 35 to 44 Years | 56 (24.9%) | 169 (75.1%) |
| 45 to 54 Years | 42 (18.7%) | 147 (65.3%) |
| 55 to 64 Years | 209 (23.8%) | 650 (74.1%) |
| 65 to 74 Years | 320 (95.0%) | 150 (44.5%) |
| 75 Years and over | 219 (100.0%) | 64 (29.2%) |
| Total | 1,218 (41.8%) | 1,663 (57.1%) |
Disability Status by Sex by Age in Bloomingdale
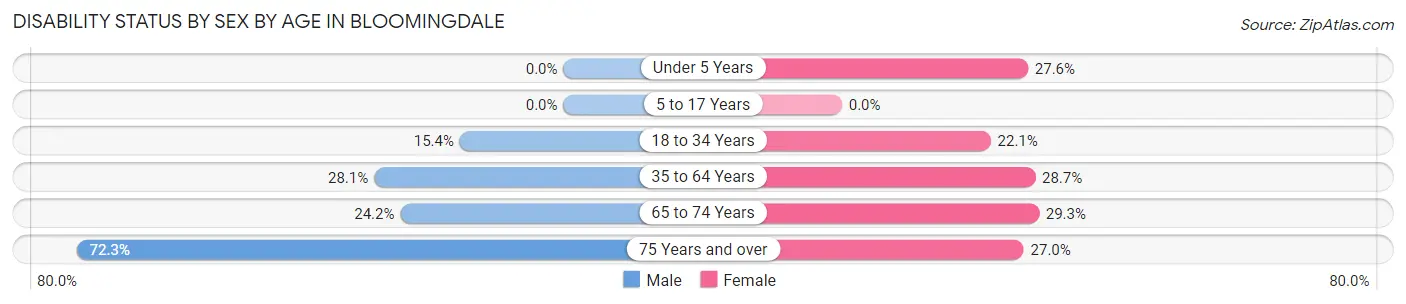
| Age Bracket | Male | Female |
| Under 5 Years | 0 (0.0%) | 42 (27.6%) |
| 5 to 17 Years | 0 (0.0%) | 0 (0.0%) |
| 18 to 34 Years | 54 (15.4%) | 61 (22.1%) |
| 35 to 64 Years | 181 (28.1%) | 196 (28.7%) |
| 65 to 74 Years | 46 (24.2%) | 43 (29.2%) |
| 75 Years and over | 86 (72.3%) | 27 (27.0%) |
Disability Class by Sex by Age in Bloomingdale
Disability Class: Hearing Difficulty
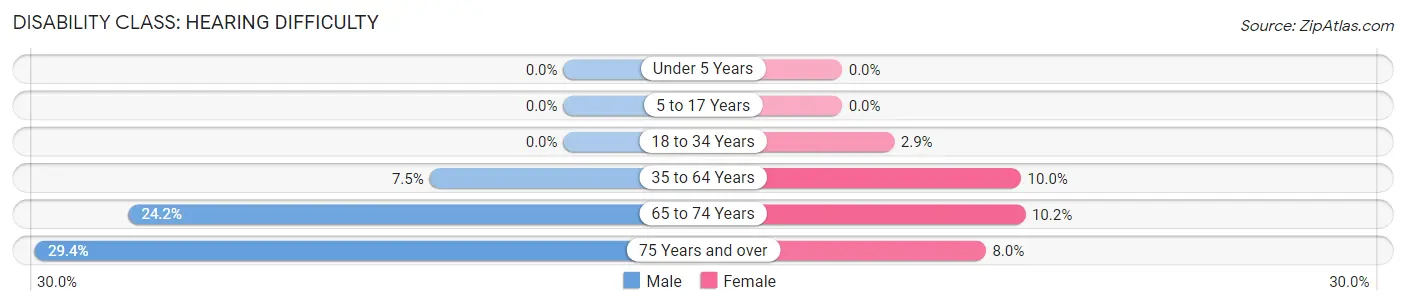
| Age Bracket | Male | Female |
| Under 5 Years | 0 (0.0%) | 0 (0.0%) |
| 5 to 17 Years | 0 (0.0%) | 0 (0.0%) |
| 18 to 34 Years | 0 (0.0%) | 8 (2.9%) |
| 35 to 64 Years | 48 (7.4%) | 68 (10.0%) |
| 65 to 74 Years | 46 (24.2%) | 15 (10.2%) |
| 75 Years and over | 35 (29.4%) | 8 (8.0%) |
Disability Class: Vision Difficulty
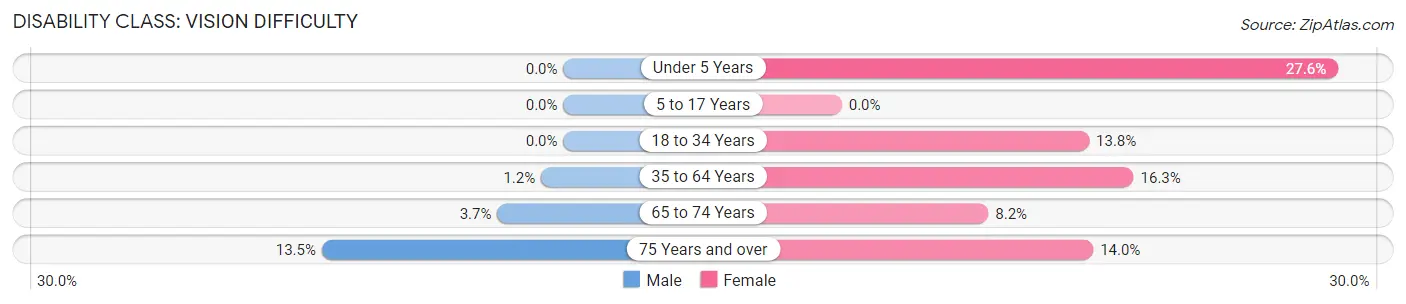
| Age Bracket | Male | Female |
| Under 5 Years | 0 (0.0%) | 42 (27.6%) |
| 5 to 17 Years | 0 (0.0%) | 0 (0.0%) |
| 18 to 34 Years | 0 (0.0%) | 38 (13.8%) |
| 35 to 64 Years | 8 (1.2%) | 111 (16.3%) |
| 65 to 74 Years | 7 (3.7%) | 12 (8.2%) |
| 75 Years and over | 16 (13.5%) | 14 (14.0%) |
Disability Class: Cognitive Difficulty
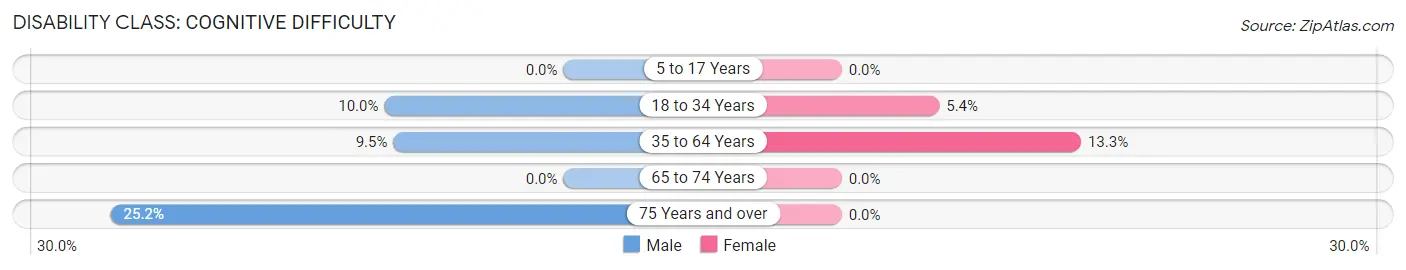
| Age Bracket | Male | Female |
| 5 to 17 Years | 0 (0.0%) | 0 (0.0%) |
| 18 to 34 Years | 35 (10.0%) | 15 (5.4%) |
| 35 to 64 Years | 61 (9.5%) | 91 (13.3%) |
| 65 to 74 Years | 0 (0.0%) | 0 (0.0%) |
| 75 Years and over | 30 (25.2%) | 0 (0.0%) |
Disability Class: Ambulatory Difficulty
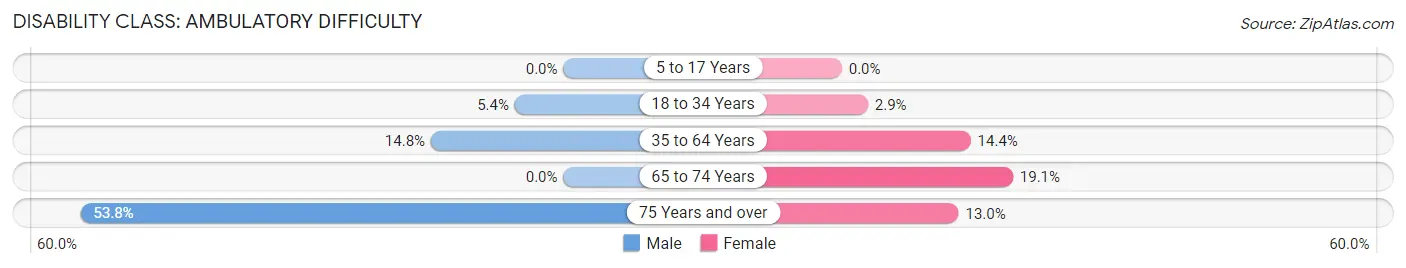
| Age Bracket | Male | Female |
| 5 to 17 Years | 0 (0.0%) | 0 (0.0%) |
| 18 to 34 Years | 19 (5.4%) | 8 (2.9%) |
| 35 to 64 Years | 95 (14.7%) | 98 (14.3%) |
| 65 to 74 Years | 0 (0.0%) | 28 (19.1%) |
| 75 Years and over | 64 (53.8%) | 13 (13.0%) |
Disability Class: Self-Care Difficulty
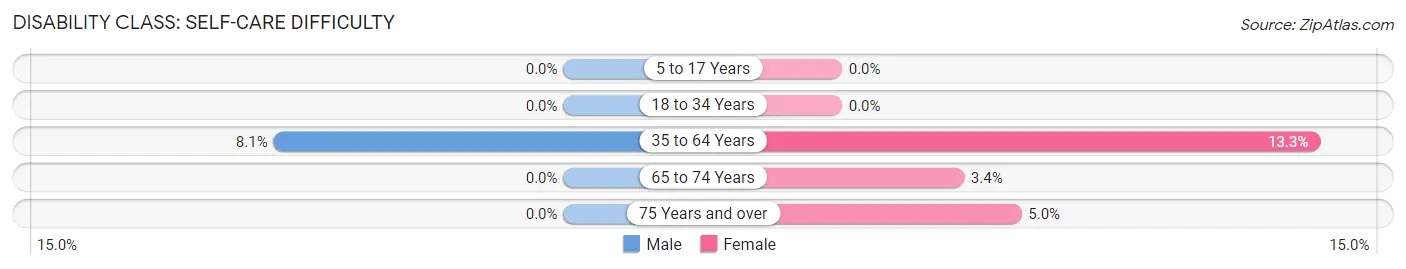
| Age Bracket | Male | Female |
| 5 to 17 Years | 0 (0.0%) | 0 (0.0%) |
| 18 to 34 Years | 0 (0.0%) | 0 (0.0%) |
| 35 to 64 Years | 52 (8.1%) | 91 (13.3%) |
| 65 to 74 Years | 0 (0.0%) | 5 (3.4%) |
| 75 Years and over | 0 (0.0%) | 5 (5.0%) |
Technology Access in Bloomingdale
Computing Device Access in Bloomingdale
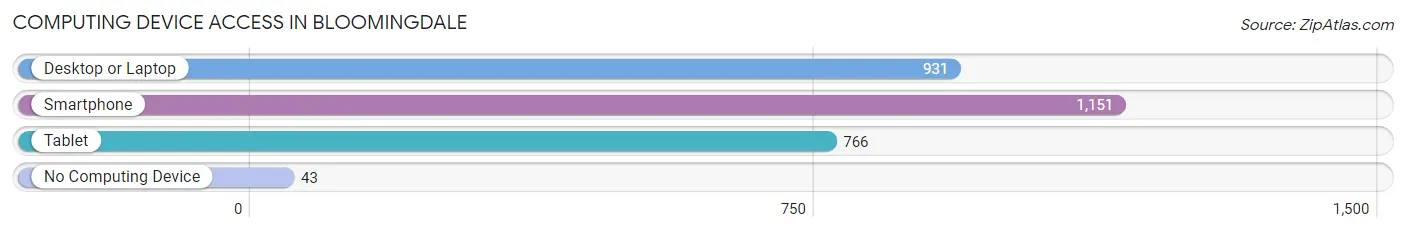
| Device Type | # Households | % Households |
| Desktop or Laptop | 931 | 73.3% |
| Smartphone | 1,151 | 90.6% |
| Tablet | 766 | 60.3% |
| No Computing Device | 43 | 3.4% |
| Total | 1,271 | 100.0% |
Internet Access in Bloomingdale
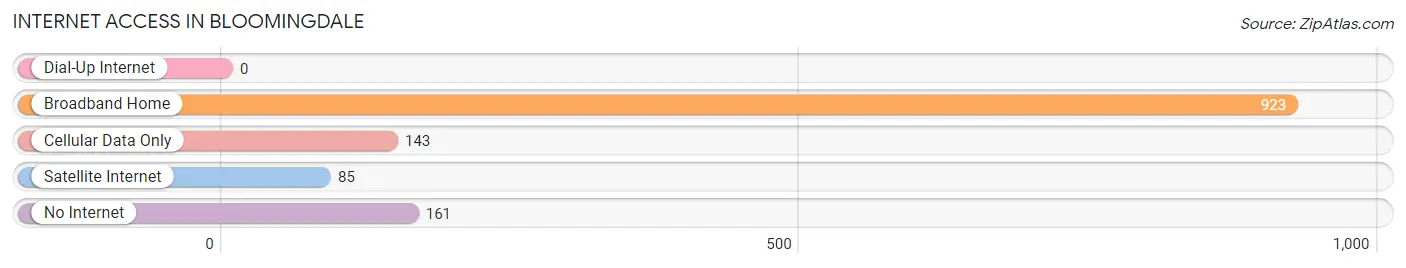
| Internet Type | # Households | % Households |
| Dial-Up Internet | 0 | 0.0% |
| Broadband Home | 923 | 72.6% |
| Cellular Data Only | 143 | 11.3% |
| Satellite Internet | 85 | 6.7% |
| No Internet | 161 | 12.7% |
| Total | 1,271 | 100.0% |
Bloomingdale Summary
Bloomingdale is a small city located in Chatham County, Georgia, United States. It is part of the Savannah Metropolitan Statistical Area. The population was 2,118 at the 2010 census.
History
Bloomingdale was founded in 1837 by a group of settlers from South Carolina. The town was named after a local flower, the blooming dale. The town was incorporated in 1891.
In the early 1900s, Bloomingdale was a thriving agricultural community. The town was home to several cotton gins, a sawmill, and a grist mill. The town also had a post office, a bank, and a hotel.
In the 1950s, Bloomingdale began to experience a decline in population as people moved away to larger cities. The town was hit hard by the Great Recession of 2008, and the population has continued to decline since then.
Geography
Bloomingdale is located in Chatham County, Georgia, at the intersection of U.S. Route 80 and Georgia State Route 204. The city is located about 15 miles west of Savannah and about 25 miles east of Statesboro.
The city has a total area of 2.2 square miles, all of which is land. The city is located in the Savannah River watershed.
Economy
The economy of Bloomingdale is largely based on agriculture. The city is home to several farms, including a dairy farm, a poultry farm, and a vegetable farm.
The city also has a few small businesses, including a gas station, a convenience store, and a few restaurants.
Demographics
As of the 2010 census, there were 2,118 people, 817 households, and 545 families living in the city. The population density was 962.2 people per square mile. The racial makeup of the city was 79.2% White, 16.2% African American, 0.5% Native American, 0.7% Asian, 0.1% Pacific Islander, 1.3% from other races, and 2.1% from two or more races. Hispanic or Latino of any race were 3.2% of the population.
The median income for a household in the city was $37,917, and the median income for a family was $45,000. The per capita income for the city was $17,845. About 15.2% of families and 18.2% of the population were below the poverty line, including 25.2% of those under age 18 and 11.2% of those age 65 or over.
Common Questions
What is Per Capita Income in Bloomingdale?
Per Capita income in Bloomingdale is $35,982.
What is the Median Family Income in Bloomingdale?
Median Family Income in Bloomingdale is $77,361.
What is the Median Household income in Bloomingdale?
Median Household Income in Bloomingdale is $62,250.
What is Income or Wage Gap in Bloomingdale?
Income or Wage Gap in Bloomingdale is 36.8%.
Women in Bloomingdale earn 63.2 cents for every dollar earned by a man.
What is Inequality or Gini Index in Bloomingdale?
Inequality or Gini Index in Bloomingdale is 0.40.
What is the Total Population of Bloomingdale?
Total Population of Bloomingdale is 2,933.
What is the Total Male Population of Bloomingdale?
Total Male Population of Bloomingdale is 1,552.
What is the Total Female Population of Bloomingdale?
Total Female Population of Bloomingdale is 1,381.
What is the Ratio of Males per 100 Females in Bloomingdale?
There are 112.38 Males per 100 Females in Bloomingdale.
What is the Ratio of Females per 100 Males in Bloomingdale?
There are 88.98 Females per 100 Males in Bloomingdale.
What is the Median Population Age in Bloomingdale?
Median Population Age in Bloomingdale is 53.3 Years.
What is the Average Family Size in Bloomingdale
Average Family Size in Bloomingdale is 2.7 People.
What is the Average Household Size in Bloomingdale
Average Household Size in Bloomingdale is 2.3 People.
How Large is the Labor Force in Bloomingdale?
There are 1,599 People in the Labor Forcein in Bloomingdale.
What is the Percentage of People in the Labor Force in Bloomingdale?
62.5% of People are in the Labor Force in Bloomingdale.
What is the Unemployment Rate in Bloomingdale?
Unemployment Rate in Bloomingdale is 2.7%.