Zip Codes with the Highest Percentage of Population with a Degree in Psychology in Delaware
RELATED REPORTS & OPTIONS
Psychology
Delaware
Compare Zip Codes
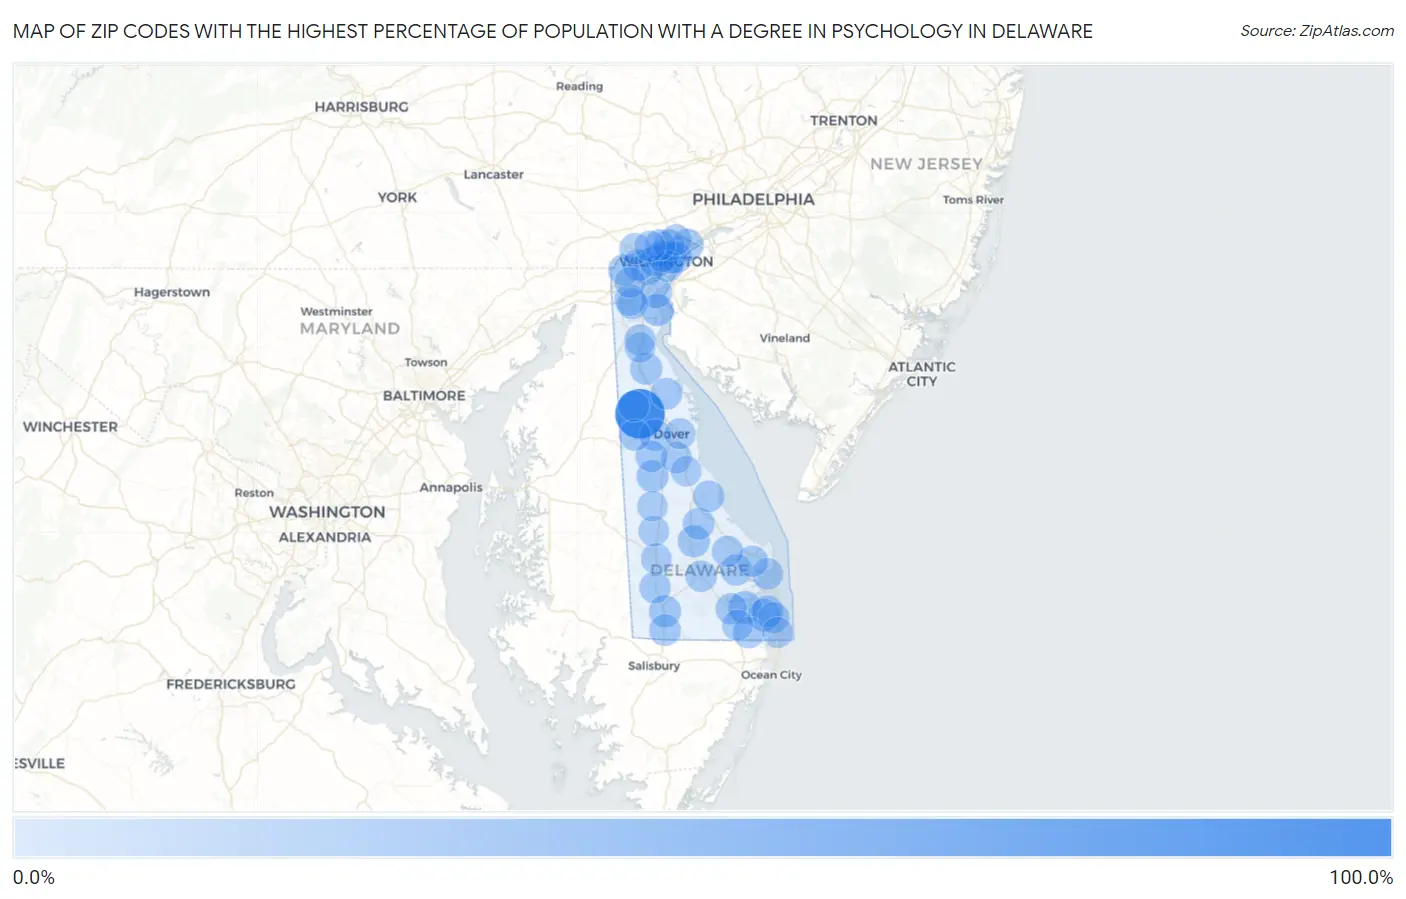
Map of Zip Codes with the Highest Percentage of Population with a Degree in Psychology in Delaware
0.0%
100.0%
Zip Codes with the Highest Percentage of Population with a Degree in Psychology in Delaware
| Zip Code | % Graduates | vs State | vs National | |
| 1. | 19955 | 87.8% | 4.9%(+82.9)#1 | 5.1%(+82.8)#35 |
| 2. | 19939 | 11.8% | 4.9%(+6.97)#2 | 5.1%(+6.79)#1,781 |
| 3. | 19805 | 9.6% | 4.9%(+4.77)#3 | 5.1%(+4.58)#2,704 |
| 4. | 19706 | 8.6% | 4.9%(+3.73)#4 | 5.1%(+3.54)#3,517 |
| 5. | 19967 | 8.6% | 4.9%(+3.72)#5 | 5.1%(+3.53)#3,524 |
| 6. | 19804 | 8.4% | 4.9%(+3.49)#6 | 5.1%(+3.30)#3,746 |
| 7. | 19734 | 8.1% | 4.9%(+3.24)#7 | 5.1%(+3.06)#4,006 |
| 8. | 19941 | 7.9% | 4.9%(+3.06)#8 | 5.1%(+2.88)#4,220 |
| 9. | 19703 | 7.9% | 4.9%(+3.06)#9 | 5.1%(+2.88)#4,223 |
| 10. | 19943 | 7.6% | 4.9%(+2.71)#10 | 5.1%(+2.52)#4,692 |
| 11. | 19956 | 7.3% | 4.9%(+2.43)#11 | 5.1%(+2.25)#5,120 |
| 12. | 19960 | 6.6% | 4.9%(+1.71)#12 | 5.1%(+1.52)#6,509 |
| 13. | 19904 | 6.1% | 4.9%(+1.25)#13 | 5.1%(+1.07)#7,611 |
| 14. | 19940 | 5.9% | 4.9%(+1.05)#14 | 5.1%(+0.864)#8,208 |
| 15. | 19970 | 5.9% | 4.9%(+1.00)#15 | 5.1%(+0.821)#8,357 |
| 16. | 19934 | 5.8% | 4.9%(+0.938)#16 | 5.1%(+0.755)#8,550 |
| 17. | 19809 | 5.8% | 4.9%(+0.929)#17 | 5.1%(+0.747)#8,575 |
| 18. | 19808 | 5.8% | 4.9%(+0.897)#18 | 5.1%(+0.714)#8,693 |
| 19. | 19973 | 5.7% | 4.9%(+0.842)#19 | 5.1%(+0.660)#8,854 |
| 20. | 19802 | 5.6% | 4.9%(+0.760)#20 | 5.1%(+0.578)#9,094 |
| 21. | 19806 | 5.6% | 4.9%(+0.758)#21 | 5.1%(+0.576)#9,102 |
| 22. | 19977 | 5.6% | 4.9%(+0.752)#22 | 5.1%(+0.570)#9,121 |
| 23. | 19720 | 5.4% | 4.9%(+0.577)#23 | 5.1%(+0.394)#9,697 |
| 24. | 19953 | 5.4% | 4.9%(+0.563)#24 | 5.1%(+0.380)#9,738 |
| 25. | 19963 | 5.1% | 4.9%(+0.230)#25 | 5.1%(+0.047)#10,904 |
| 26. | 19966 | 5.1% | 4.9%(+0.211)#26 | 5.1%(+0.029)#10,971 |
| 27. | 19975 | 5.0% | 4.9%(+0.134)#27 | 5.1%(-0.048)#11,242 |
| 28. | 19702 | 4.6% | 4.9%(-0.252)#28 | 5.1%(-0.434)#12,649 |
| 29. | 19947 | 4.5% | 4.9%(-0.349)#29 | 5.1%(-0.531)#13,037 |
| 30. | 19971 | 4.4% | 4.9%(-0.513)#30 | 5.1%(-0.695)#13,640 |
| 31. | 19951 | 4.3% | 4.9%(-0.548)#31 | 5.1%(-0.730)#13,780 |
| 32. | 19958 | 4.3% | 4.9%(-0.570)#32 | 5.1%(-0.752)#13,863 |
| 33. | 19962 | 4.3% | 4.9%(-0.577)#33 | 5.1%(-0.759)#13,886 |
| 34. | 19701 | 4.3% | 4.9%(-0.577)#34 | 5.1%(-0.759)#13,890 |
| 35. | 19968 | 4.2% | 4.9%(-0.619)#35 | 5.1%(-0.802)#14,039 |
| 36. | 19711 | 4.0% | 4.9%(-0.862)#36 | 5.1%(-1.04)#14,896 |
| 37. | 19707 | 4.0% | 4.9%(-0.877)#37 | 5.1%(-1.06)#14,958 |
| 38. | 19803 | 3.9% | 4.9%(-0.924)#38 | 5.1%(-1.11)#15,133 |
| 39. | 19709 | 3.9% | 4.9%(-0.942)#39 | 5.1%(-1.12)#15,189 |
| 40. | 19801 | 3.9% | 4.9%(-1.02)#40 | 5.1%(-1.20)#15,440 |
| 41. | 19930 | 3.7% | 4.9%(-1.12)#41 | 5.1%(-1.30)#15,799 |
| 42. | 19810 | 3.6% | 4.9%(-1.26)#42 | 5.1%(-1.44)#16,290 |
| 43. | 19732 | 3.6% | 4.9%(-1.26)#43 | 5.1%(-1.44)#16,312 |
| 44. | 19938 | 3.6% | 4.9%(-1.30)#44 | 5.1%(-1.49)#16,474 |
| 45. | 19713 | 3.1% | 4.9%(-1.76)#45 | 5.1%(-1.95)#17,932 |
| 46. | 19901 | 3.0% | 4.9%(-1.88)#46 | 5.1%(-2.06)#18,261 |
| 47. | 19945 | 2.7% | 4.9%(-2.16)#47 | 5.1%(-2.34)#19,035 |
| 48. | 19944 | 2.7% | 4.9%(-2.21)#48 | 5.1%(-2.39)#19,177 |
| 49. | 19807 | 2.6% | 4.9%(-2.30)#49 | 5.1%(-2.48)#19,428 |
| 50. | 19933 | 2.1% | 4.9%(-2.79)#50 | 5.1%(-2.97)#20,638 |
| 51. | 19950 | 1.4% | 4.9%(-3.49)#51 | 5.1%(-3.68)#22,023 |
| 52. | 19952 | 0.99% | 4.9%(-3.87)#52 | 5.1%(-4.06)#22,664 |
| 53. | 19946 | 0.93% | 4.9%(-3.94)#53 | 5.1%(-4.12)#22,747 |
| 54. | 19730 | 0.62% | 4.9%(-4.25)#54 | 5.1%(-4.43)#23,146 |
1
Common Questions
What are the Top 10 Zip Codes with the Highest Percentage of Population with a Degree in Psychology in Delaware?
Top 10 Zip Codes with the Highest Percentage of Population with a Degree in Psychology in Delaware are:
What zip code has the Highest Percentage of Population with a Degree in Psychology in Delaware?
19955 has the Highest Percentage of Population with a Degree in Psychology in Delaware with 87.8%.
What is the Percentage of Population with a Degree in Psychology in the State of Delaware?
Percentage of Population with a Degree in Psychology in Delaware is 4.9%.
What is the Percentage of Population with a Degree in Psychology in the United States?
Percentage of Population with a Degree in Psychology in the United States is 5.1%.