Sand Springs, TX Map & Demographics
Sand Springs Map
Sand Springs Overview
$28,093
PER CAPITA INCOME
$54,167
AVG FAMILY INCOME
$43,125
AVG HOUSEHOLD INCOME
23.3%
WAGE / INCOME GAP [ % ]
76.7¢/ $1
WAGE / INCOME GAP [ $ ]
0.44
INEQUALITY / GINI INDEX
1,036
TOTAL POPULATION
622
MALE POPULATION
414
FEMALE POPULATION
150.24
MALES / 100 FEMALES
66.56
FEMALES / 100 MALES
38.6
MEDIAN AGE
3.0
AVG FAMILY SIZE
2.3
AVG HOUSEHOLD SIZE
599
LABOR FORCE [ PEOPLE ]
69.8%
PERCENT IN LABOR FORCE
1.8%
UNEMPLOYMENT RATE
Income in Sand Springs
Income Overview in Sand Springs
Per Capita Income in Sand Springs is $28,093, while median incomes of families and households are $54,167 and $43,125 respectively.
| Characteristic | Number | Measure |
| Per Capita Income | 1,036 | $28,093 |
| Median Family Income | 266 | $54,167 |
| Mean Family Income | 266 | $75,427 |
| Median Household Income | 443 | $43,125 |
| Mean Household Income | 443 | $60,059 |
| Income Deficit | 266 | $0 |
| Wage / Income Gap (%) | 1,036 | 23.33% |
| Wage / Income Gap ($) | 1,036 | 76.67¢ per $1 |
| Gini / Inequality Index | 1,036 | 0.44 |
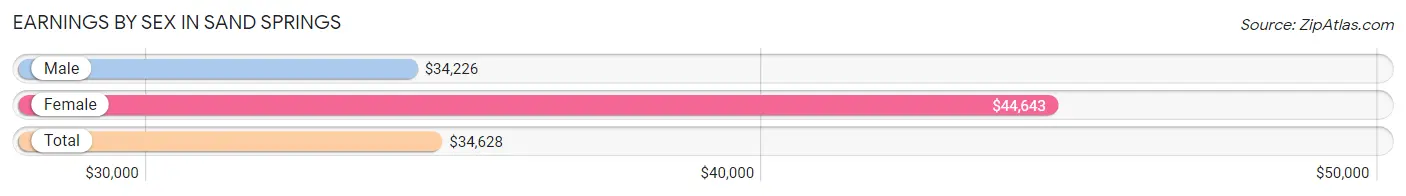
Earnings by Sex in Sand Springs
Average Earnings in Sand Springs are $34,628, $34,226 for men and $44,643 for women, a difference of 23.3%.
| Sex | Number | Average Earnings |
| Male | 406 (69.1%) | $34,226 |
| Female | 182 (30.9%) | $44,643 |
| Total | 588 (100.0%) | $34,628 |
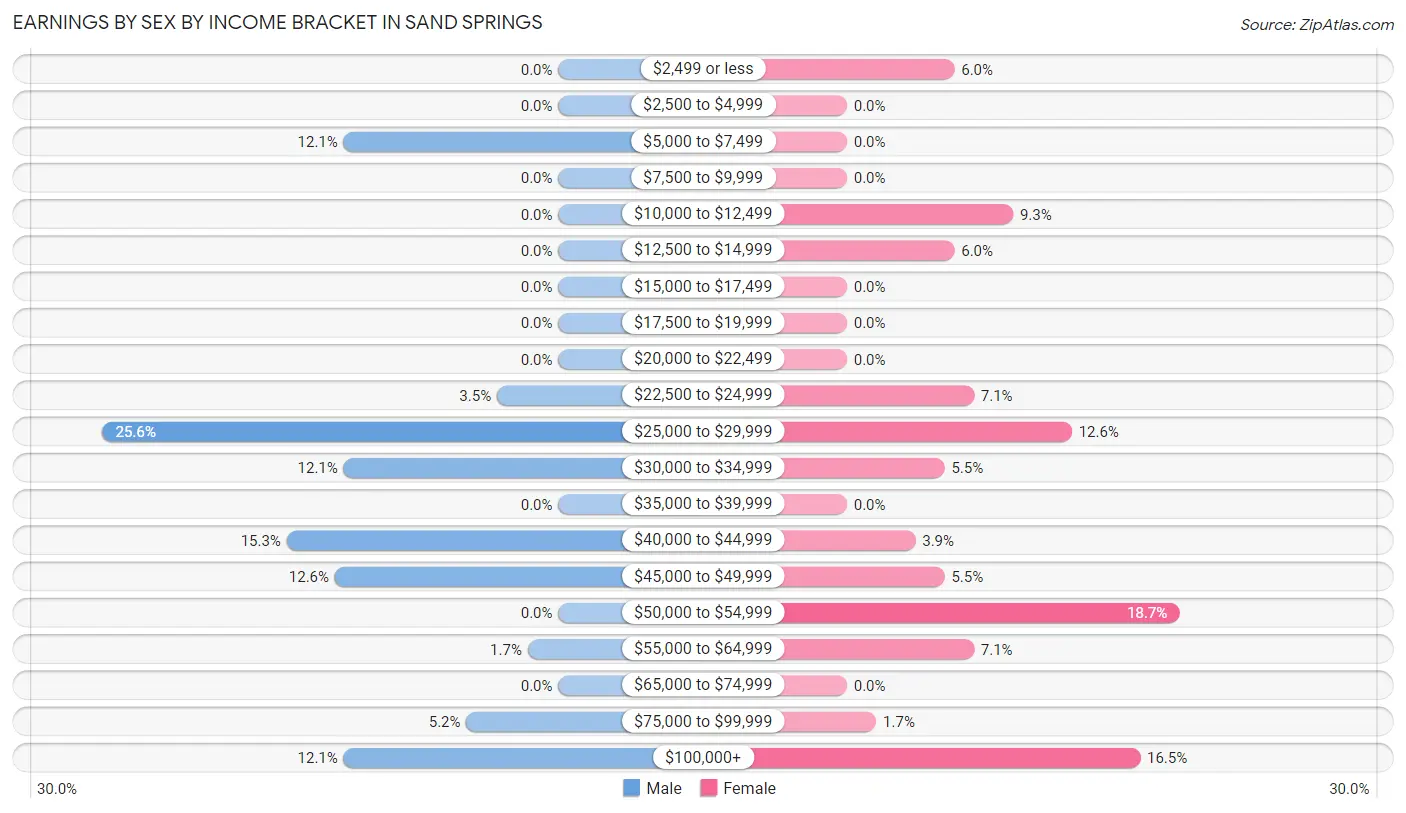
Earnings by Sex by Income Bracket in Sand Springs
The most common earnings brackets in Sand Springs are $25,000 to $29,999 for men (104 | 25.6%) and $50,000 to $54,999 for women (34 | 18.7%).
| Income | Male | Female |
| $2,499 or less | 0 (0.0%) | 11 (6.0%) |
| $2,500 to $4,999 | 0 (0.0%) | 0 (0.0%) |
| $5,000 to $7,499 | 49 (12.1%) | 0 (0.0%) |
| $7,500 to $9,999 | 0 (0.0%) | 0 (0.0%) |
| $10,000 to $12,499 | 0 (0.0%) | 17 (9.3%) |
| $12,500 to $14,999 | 0 (0.0%) | 11 (6.0%) |
| $15,000 to $17,499 | 0 (0.0%) | 0 (0.0%) |
| $17,500 to $19,999 | 0 (0.0%) | 0 (0.0%) |
| $20,000 to $22,499 | 0 (0.0%) | 0 (0.0%) |
| $22,500 to $24,999 | 14 (3.5%) | 13 (7.1%) |
| $25,000 to $29,999 | 104 (25.6%) | 23 (12.6%) |
| $30,000 to $34,999 | 49 (12.1%) | 10 (5.5%) |
| $35,000 to $39,999 | 0 (0.0%) | 0 (0.0%) |
| $40,000 to $44,999 | 62 (15.3%) | 7 (3.8%) |
| $45,000 to $49,999 | 51 (12.6%) | 10 (5.5%) |
| $50,000 to $54,999 | 0 (0.0%) | 34 (18.7%) |
| $55,000 to $64,999 | 7 (1.7%) | 13 (7.1%) |
| $65,000 to $74,999 | 0 (0.0%) | 0 (0.0%) |
| $75,000 to $99,999 | 21 (5.2%) | 3 (1.7%) |
| $100,000+ | 49 (12.1%) | 30 (16.5%) |
| Total | 406 (100.0%) | 182 (100.0%) |
Earnings by Sex by Educational Attainment in Sand Springs
Average earnings in Sand Springs are $29,400 for men and $48,500 for women, a difference of 39.4%. Men with an educational attainment of college or associate's degree enjoy the highest average annual earnings of $103,393, while those with high school diploma education earn the least with $26,218. Women with an educational attainment of graduate degree earn the most with the average annual earnings of $60,833, while those with college or associate's degree education have the smallest earnings of $28,750.

| Educational Attainment | Male Income | Female Income |
| Less than High School | - | - |
| High School Diploma | $26,218 | $0 |
| College or Associate's Degree | $103,393 | $28,750 |
| Bachelor's Degree | - | - |
| Graduate Degree | - | - |
| Total | $29,400 | $48,500 |
Family Income in Sand Springs
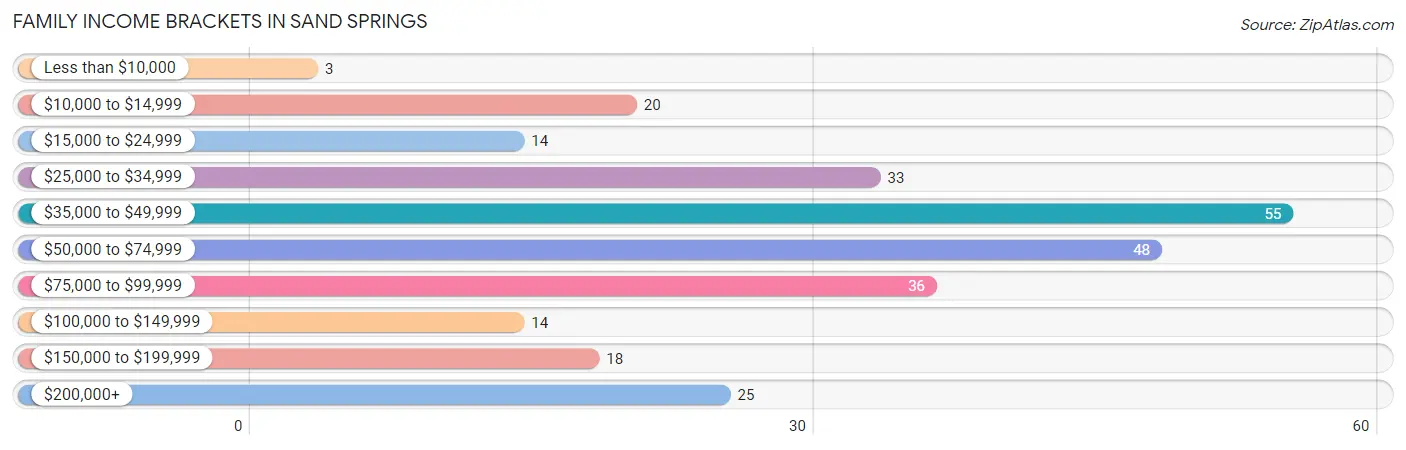
Family Income Brackets in Sand Springs
According to the Sand Springs family income data, there are 55 families falling into the $35,000 to $49,999 income range, which is the most common income bracket and makes up 20.7% of all families. Conversely, the less than $10,000 income bracket is the least frequent group with only 3 families (1.1%) belonging to this category.
| Income Bracket | # Families | % Families |
| Less than $10,000 | 3 | 1.1% |
| $10,000 to $14,999 | 20 | 7.5% |
| $15,000 to $24,999 | 14 | 5.3% |
| $25,000 to $34,999 | 33 | 12.4% |
| $35,000 to $49,999 | 55 | 20.7% |
| $50,000 to $74,999 | 48 | 18.0% |
| $75,000 to $99,999 | 36 | 13.5% |
| $100,000 to $149,999 | 14 | 5.3% |
| $150,000 to $199,999 | 18 | 6.8% |
| $200,000+ | 25 | 9.4% |
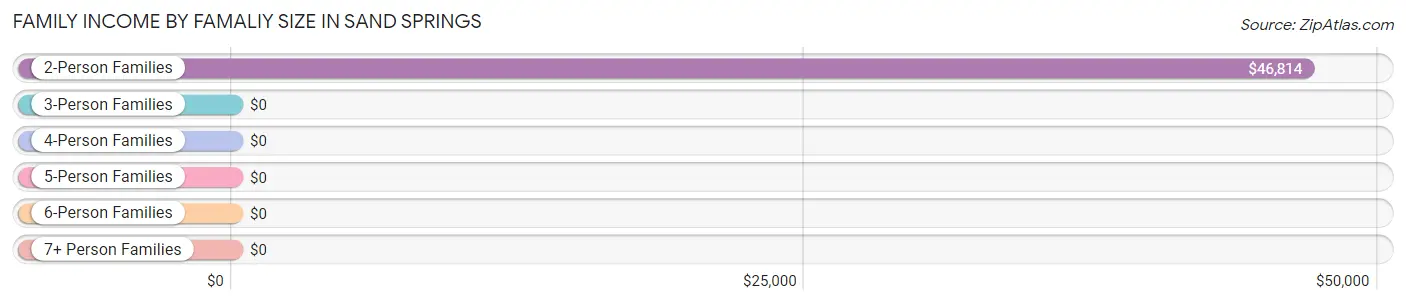
Family Income by Famaliy Size in Sand Springs
2-person families (140 | 52.6%) account for the highest median family income in Sand Springs with $46,814 per family, while 2-person families (140 | 52.6%) have the highest median income of $23,407 per family member.
| Income Bracket | # Families | Median Income |
| 2-Person Families | 140 (52.6%) | $46,814 |
| 3-Person Families | 50 (18.8%) | $0 |
| 4-Person Families | 21 (7.9%) | $0 |
| 5-Person Families | 47 (17.7%) | $0 |
| 6-Person Families | 8 (3.0%) | $0 |
| 7+ Person Families | 0 (0.0%) | $0 |
| Total | 266 (100.0%) | $54,167 |
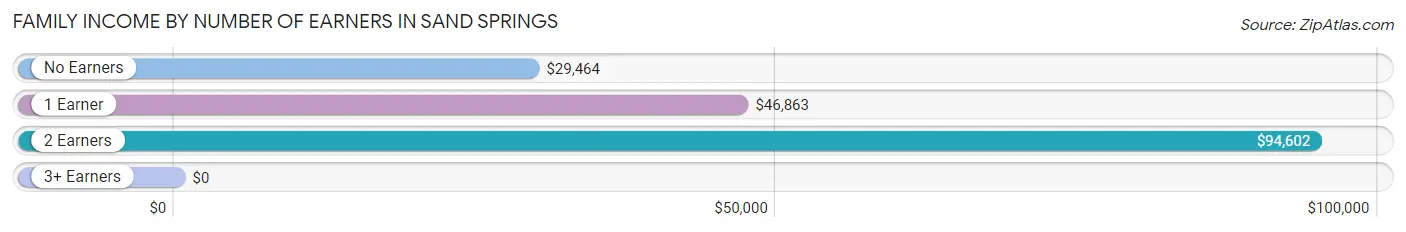
Family Income by Number of Earners in Sand Springs
| Number of Earners | # Families | Median Income |
| No Earners | 17 (6.4%) | $29,464 |
| 1 Earner | 128 (48.1%) | $46,863 |
| 2 Earners | 121 (45.5%) | $94,602 |
| 3+ Earners | 0 (0.0%) | $0 |
| Total | 266 (100.0%) | $54,167 |
Household Income in Sand Springs
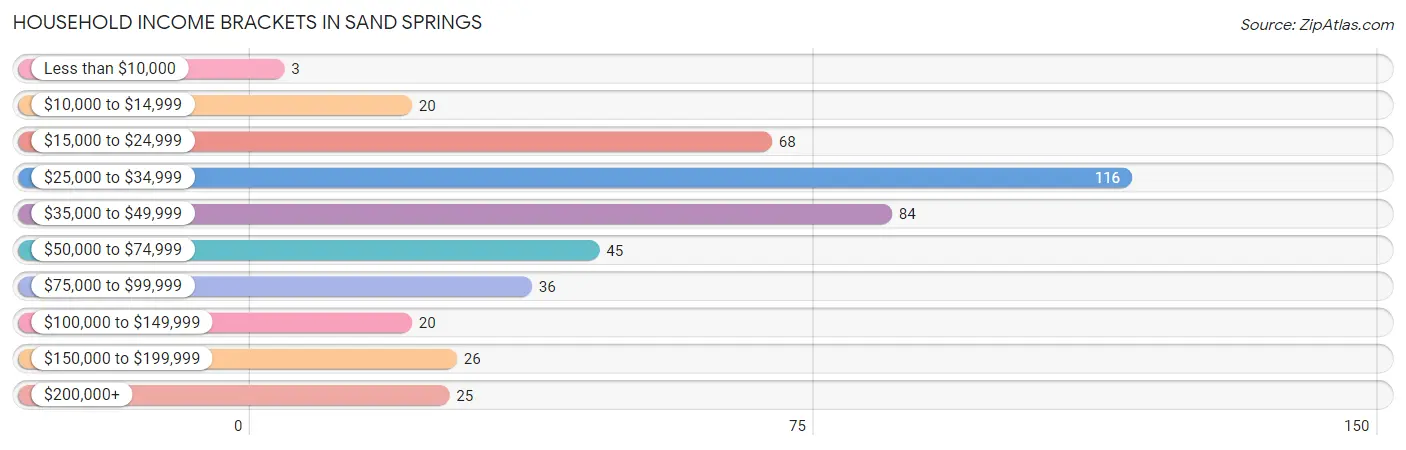
Household Income Brackets in Sand Springs
With 116 households falling in the category, the $25,000 to $34,999 income range is the most frequent in Sand Springs, accounting for 26.2% of all households. In contrast, only 3 households (0.7%) fall into the less than $10,000 income bracket, making it the least populous group.
| Income Bracket | # Households | % Households |
| Less than $10,000 | 3 | 0.7% |
| $10,000 to $14,999 | 20 | 4.5% |
| $15,000 to $24,999 | 68 | 15.3% |
| $25,000 to $34,999 | 116 | 26.2% |
| $35,000 to $49,999 | 84 | 19.0% |
| $50,000 to $74,999 | 45 | 10.2% |
| $75,000 to $99,999 | 36 | 8.1% |
| $100,000 to $149,999 | 20 | 4.5% |
| $150,000 to $199,999 | 26 | 5.9% |
| $200,000+ | 25 | 5.6% |
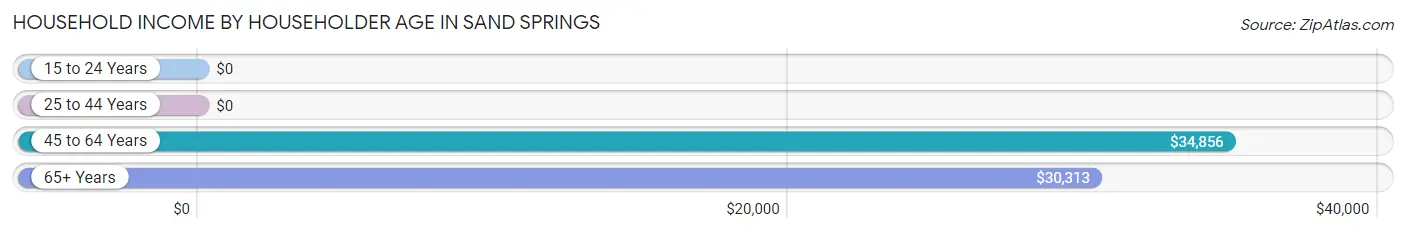
Household Income by Householder Age in Sand Springs
The median household income in Sand Springs is $43,125, with the highest median household income of $34,856 found in the 45 to 64 years age bracket for the primary householder. A total of 125 households (28.2%) fall into this category. Meanwhile, the 15 to 24 years age bracket for the primary householder has the lowest median household income of $0, with 51 households (11.5%) in this group.
| Income Bracket | # Households | Median Income |
| 15 to 24 Years | 51 (11.5%) | $0 |
| 25 to 44 Years | 186 (42.0%) | $0 |
| 45 to 64 Years | 125 (28.2%) | $34,856 |
| 65+ Years | 81 (18.3%) | $30,313 |
| Total | 443 (100.0%) | $43,125 |
Poverty in Sand Springs
Income Below Poverty by Sex and Age in Sand Springs
With 11.6% poverty level for males and 7.2% for females among the residents of Sand Springs, 45 to 54 year old males and 25 to 34 year old females are the most vulnerable to poverty, with 28 males (25.0%) and 16 females (29.1%) in their respective age groups living below the poverty level.
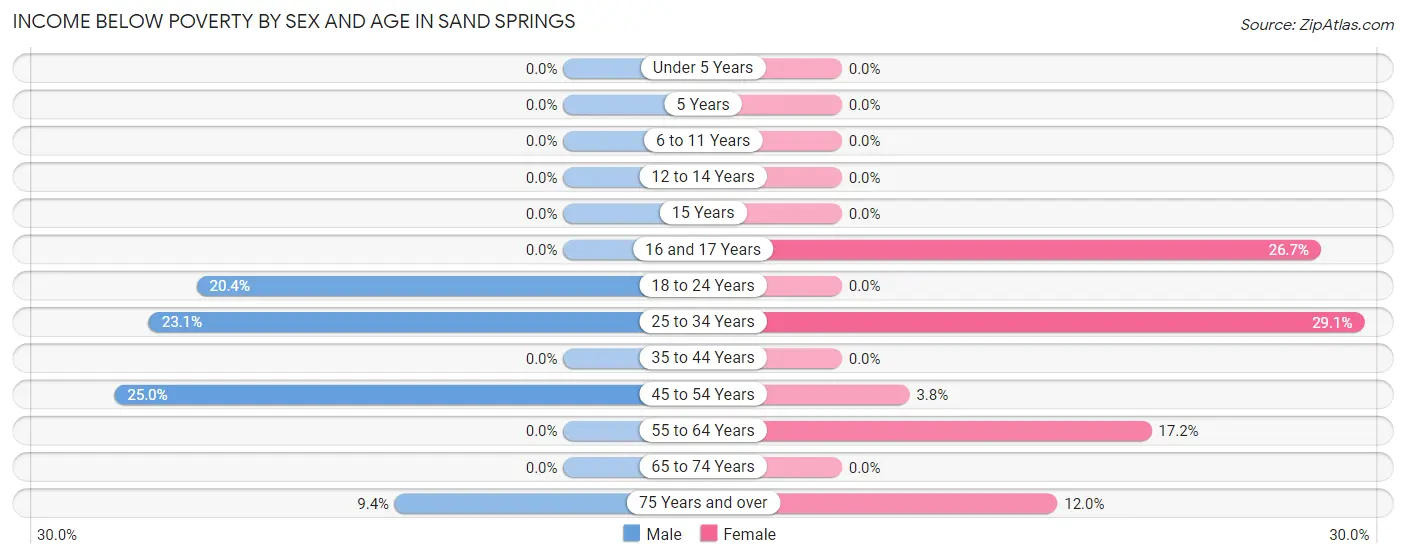
| Age Bracket | Male | Female |
| Under 5 Years | 0 (0.0%) | 0 (0.0%) |
| 5 Years | 0 (0.0%) | 0 (0.0%) |
| 6 to 11 Years | 0 (0.0%) | 0 (0.0%) |
| 12 to 14 Years | 0 (0.0%) | 0 (0.0%) |
| 15 Years | 0 (0.0%) | 0 (0.0%) |
| 16 and 17 Years | 0 (0.0%) | 4 (26.7%) |
| 18 to 24 Years | 29 (20.4%) | 0 (0.0%) |
| 25 to 34 Years | 12 (23.1%) | 16 (29.1%) |
| 35 to 44 Years | 0 (0.0%) | 0 (0.0%) |
| 45 to 54 Years | 28 (25.0%) | 2 (3.8%) |
| 55 to 64 Years | 0 (0.0%) | 5 (17.2%) |
| 65 to 74 Years | 0 (0.0%) | 0 (0.0%) |
| 75 Years and over | 3 (9.4%) | 3 (12.0%) |
| Total | 72 (11.6%) | 30 (7.2%) |
Income Above Poverty by Sex and Age in Sand Springs
According to the poverty statistics in Sand Springs, males aged under 5 years and females aged under 5 years are the age groups that are most secure financially, with 100.0% of males and 100.0% of females in these age groups living above the poverty line.
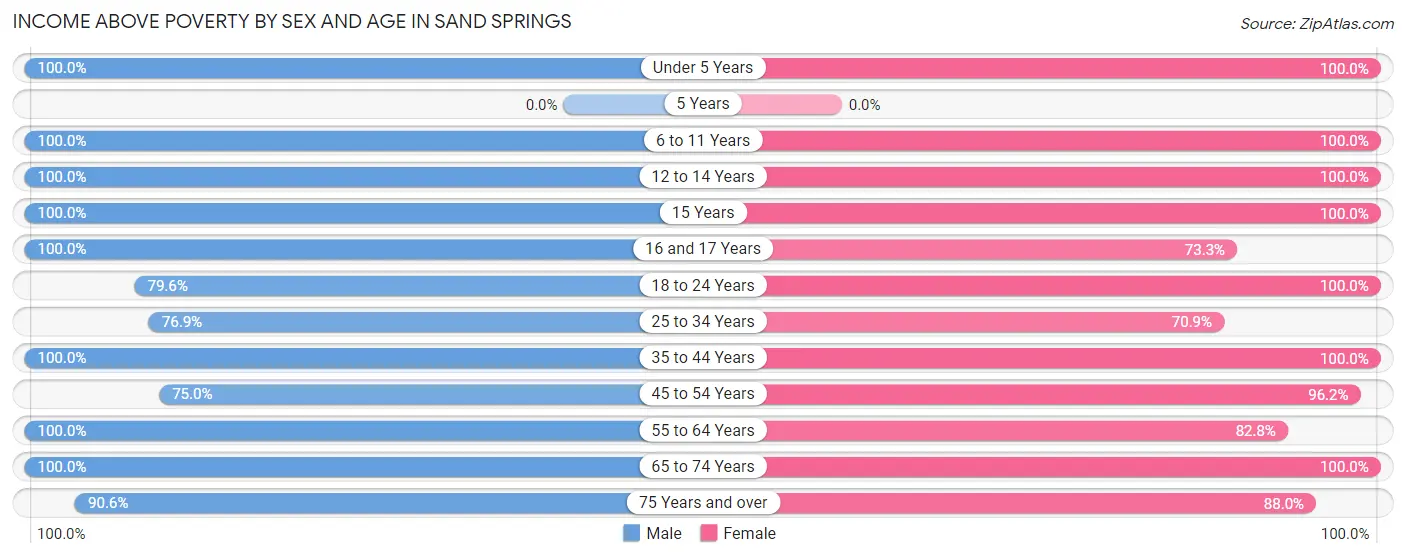
| Age Bracket | Male | Female |
| Under 5 Years | 23 (100.0%) | 10 (100.0%) |
| 5 Years | 0 (0.0%) | 0 (0.0%) |
| 6 to 11 Years | 24 (100.0%) | 62 (100.0%) |
| 12 to 14 Years | 16 (100.0%) | 16 (100.0%) |
| 15 Years | 7 (100.0%) | 20 (100.0%) |
| 16 and 17 Years | 44 (100.0%) | 11 (73.3%) |
| 18 to 24 Years | 113 (79.6%) | 16 (100.0%) |
| 25 to 34 Years | 40 (76.9%) | 39 (70.9%) |
| 35 to 44 Years | 133 (100.0%) | 59 (100.0%) |
| 45 to 54 Years | 84 (75.0%) | 51 (96.2%) |
| 55 to 64 Years | 29 (100.0%) | 24 (82.8%) |
| 65 to 74 Years | 8 (100.0%) | 54 (100.0%) |
| 75 Years and over | 29 (90.6%) | 22 (88.0%) |
| Total | 550 (88.4%) | 384 (92.7%) |
Income Below Poverty Among Married-Couple Families in Sand Springs
The poverty statistics for married-couple families in Sand Springs show that 2.6% or 3 of the total 113 families live below the poverty line. Families with no children have the highest poverty rate of 6.1%, comprising of 3 families. On the other hand, families with 1 or 2 children have the lowest poverty rate of 0.0%, which includes 0 families.
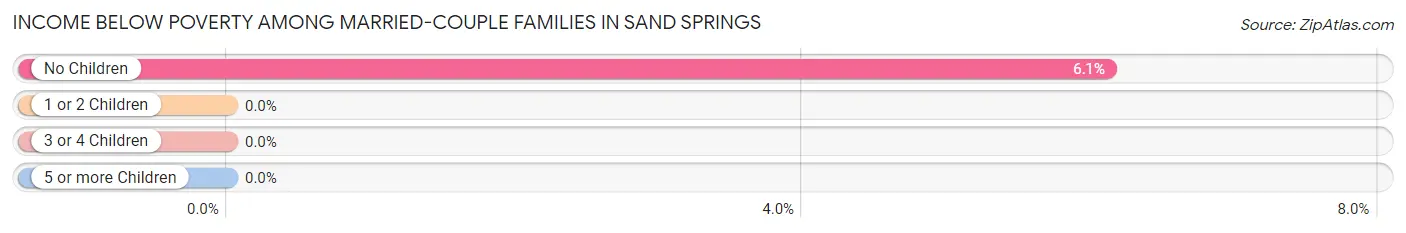
| Children | Above Poverty | Below Poverty |
| No Children | 46 (93.9%) | 3 (6.1%) |
| 1 or 2 Children | 39 (100.0%) | 0 (0.0%) |
| 3 or 4 Children | 25 (100.0%) | 0 (0.0%) |
| 5 or more Children | 0 (0.0%) | 0 (0.0%) |
| Total | 110 (97.4%) | 3 (2.6%) |
Income Below Poverty Among Single-Parent Households in Sand Springs
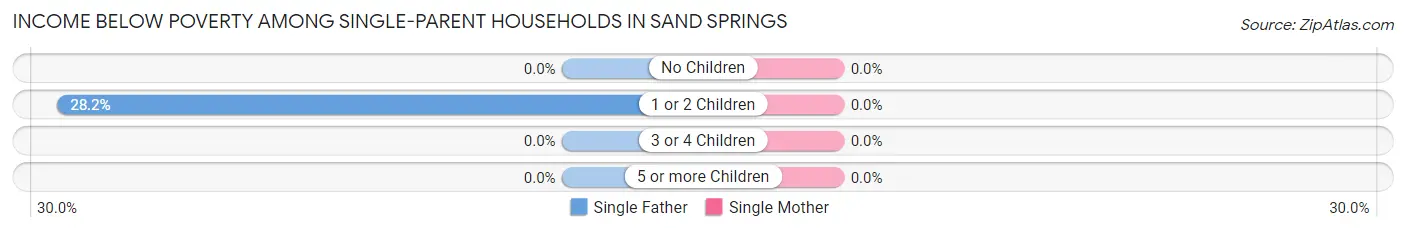
| Children | Single Father | Single Mother |
| No Children | 0 (0.0%) | 0 (0.0%) |
| 1 or 2 Children | 20 (28.2%) | 0 (0.0%) |
| 3 or 4 Children | 0 (0.0%) | 0 (0.0%) |
| 5 or more Children | 0 (0.0%) | 0 (0.0%) |
| Total | 20 (19.1%) | 0 (0.0%) |
Income Below Poverty Among Married-Couple vs Single-Parent Households in Sand Springs
The poverty data for Sand Springs shows that 3 of the married-couple family households (2.6%) and 20 of the single-parent households (13.1%) are living below the poverty level. Within the married-couple family households, those with no children have the highest poverty rate, with 3 households (6.1%) falling below the poverty line. Among the single-parent households, those with 1 or 2 children have the highest poverty rate, with 20 household (22.7%) living below poverty.
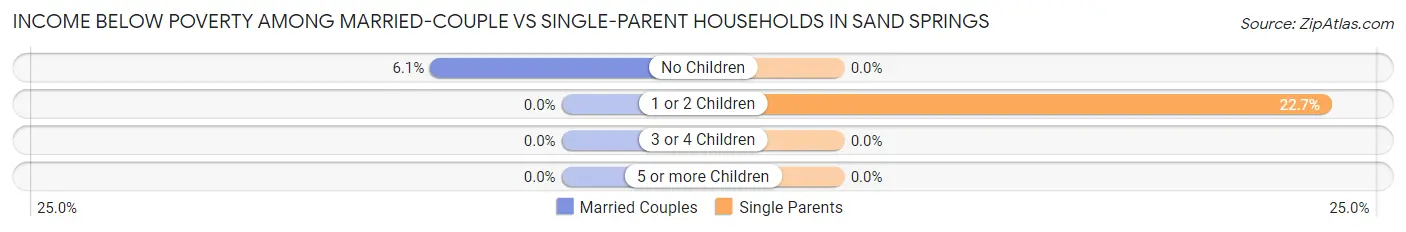
| Children | Married-Couple Families | Single-Parent Households |
| No Children | 3 (6.1%) | 0 (0.0%) |
| 1 or 2 Children | 0 (0.0%) | 20 (22.7%) |
| 3 or 4 Children | 0 (0.0%) | 0 (0.0%) |
| 5 or more Children | 0 (0.0%) | 0 (0.0%) |
| Total | 3 (2.6%) | 20 (13.1%) |
Race in Sand Springs
The most populous races in Sand Springs are White / Caucasian (886 | 85.5%), Hispanic or Latino (443 | 42.8%), and Black / African American (79 | 7.6%).
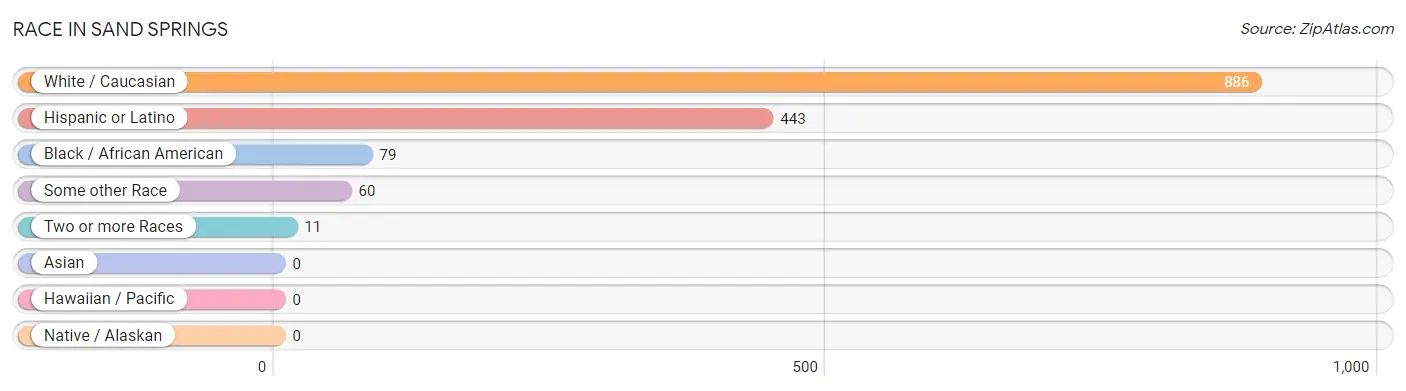
| Race | # Population | % Population |
| Asian | 0 | 0.0% |
| Black / African American | 79 | 7.6% |
| Hawaiian / Pacific | 0 | 0.0% |
| Hispanic or Latino | 443 | 42.8% |
| Native / Alaskan | 0 | 0.0% |
| White / Caucasian | 886 | 85.5% |
| Two or more Races | 11 | 1.1% |
| Some other Race | 60 | 5.8% |
| Total | 1,036 | 100.0% |
Ancestry in Sand Springs
The most populous ancestries reported in Sand Springs are Mexican (443 | 42.8%), American (124 | 12.0%), German (90 | 8.7%), Scotch-Irish (23 | 2.2%), and English (19 | 1.8%), together accounting for 67.5% of all Sand Springs residents.
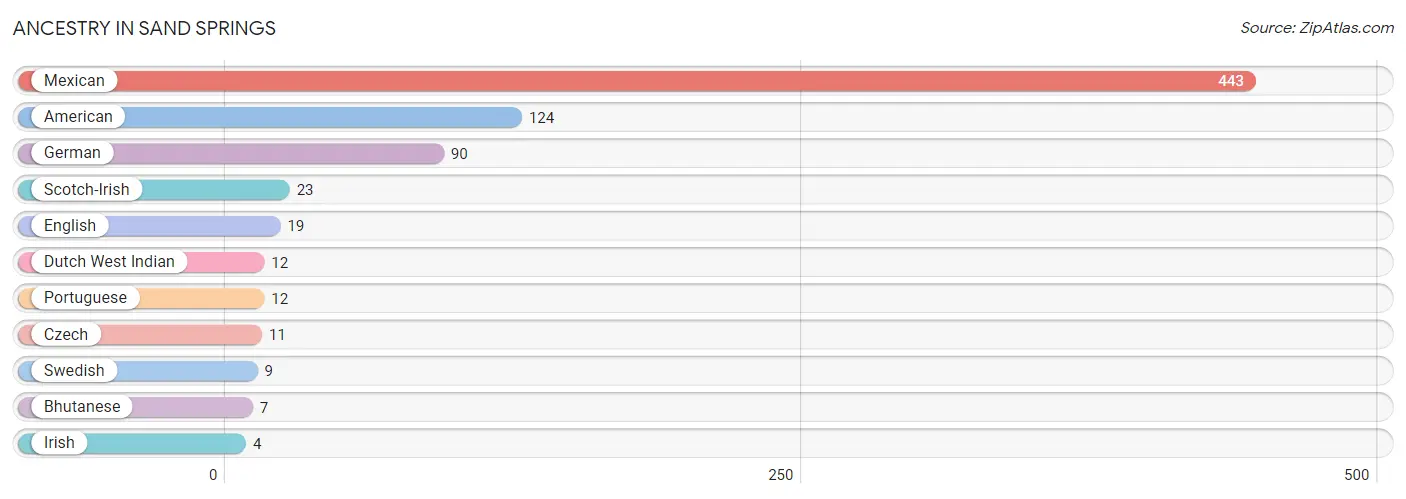
| Ancestry | # Population | % Population |
| American | 124 | 12.0% |
| Bhutanese | 7 | 0.7% |
| Czech | 11 | 1.1% |
| Dutch West Indian | 12 | 1.2% |
| English | 19 | 1.8% |
| German | 90 | 8.7% |
| Irish | 4 | 0.4% |
| Mexican | 443 | 42.8% |
| Portuguese | 12 | 1.2% |
| Scotch-Irish | 23 | 2.2% |
| Swedish | 9 | 0.9% | View All 11 Rows |
Immigrants in Sand Springs
The most numerous immigrant groups reported in Sand Springs came from Latin America (87 | 8.4%), Central America (55 | 5.3%), Mexico (55 | 5.3%), Peru (32 | 3.1%), and South America (32 | 3.1%), together accounting for 25.2% of all Sand Springs residents.
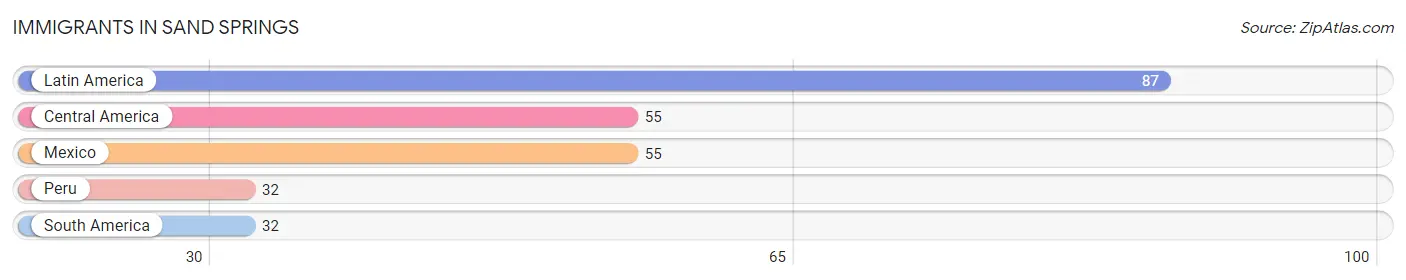
| Immigration Origin | # Population | % Population |
| Central America | 55 | 5.3% |
| Latin America | 87 | 8.4% |
| Mexico | 55 | 5.3% |
| Peru | 32 | 3.1% |
| South America | 32 | 3.1% | View All 5 Rows |
Sex and Age in Sand Springs
Sex and Age in Sand Springs
The most populous age groups in Sand Springs are 40 to 44 Years (120 | 19.3%) for men and 65 to 69 Years (50 | 12.1%) for women.
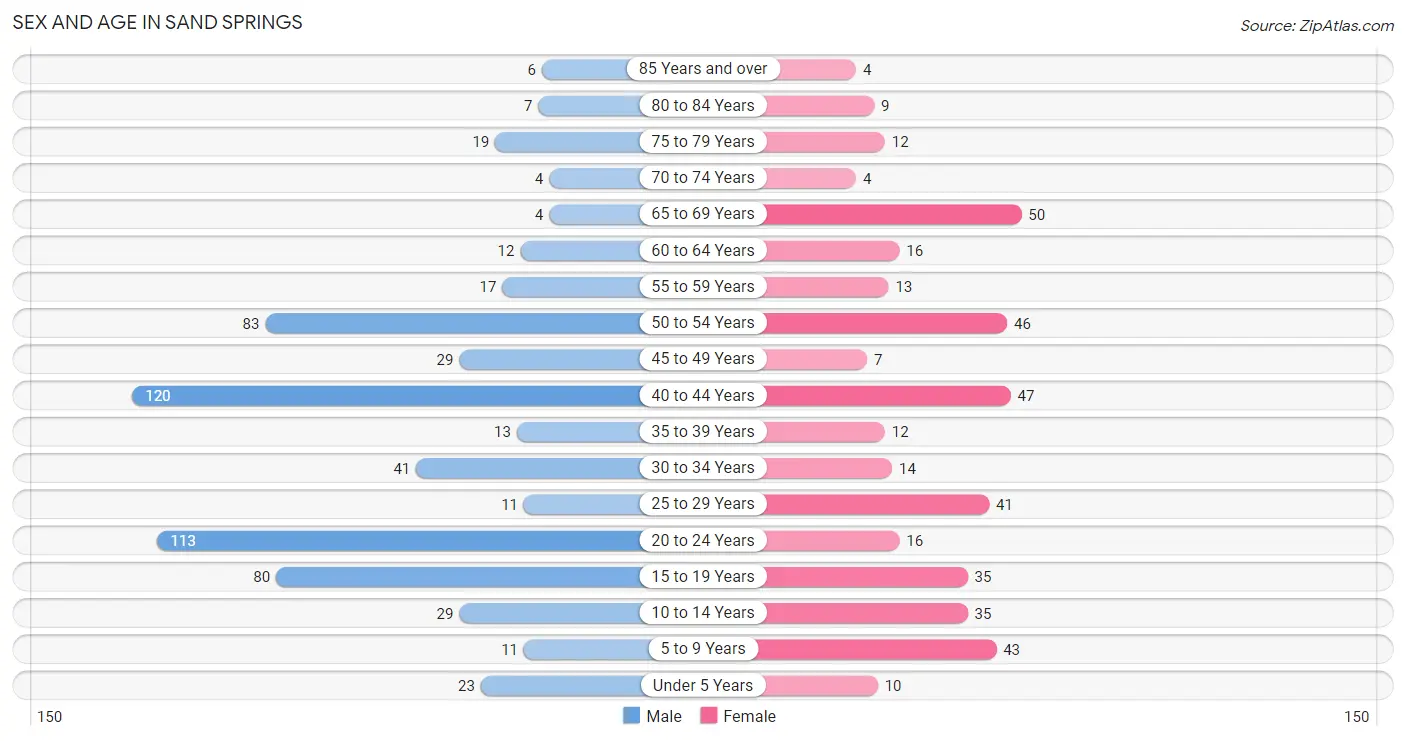
| Age Bracket | Male | Female |
| Under 5 Years | 23 (3.7%) | 10 (2.4%) |
| 5 to 9 Years | 11 (1.8%) | 43 (10.4%) |
| 10 to 14 Years | 29 (4.7%) | 35 (8.5%) |
| 15 to 19 Years | 80 (12.9%) | 35 (8.5%) |
| 20 to 24 Years | 113 (18.2%) | 16 (3.9%) |
| 25 to 29 Years | 11 (1.8%) | 41 (9.9%) |
| 30 to 34 Years | 41 (6.6%) | 14 (3.4%) |
| 35 to 39 Years | 13 (2.1%) | 12 (2.9%) |
| 40 to 44 Years | 120 (19.3%) | 47 (11.4%) |
| 45 to 49 Years | 29 (4.7%) | 7 (1.7%) |
| 50 to 54 Years | 83 (13.3%) | 46 (11.1%) |
| 55 to 59 Years | 17 (2.7%) | 13 (3.1%) |
| 60 to 64 Years | 12 (1.9%) | 16 (3.9%) |
| 65 to 69 Years | 4 (0.6%) | 50 (12.1%) |
| 70 to 74 Years | 4 (0.6%) | 4 (1.0%) |
| 75 to 79 Years | 19 (3.0%) | 12 (2.9%) |
| 80 to 84 Years | 7 (1.1%) | 9 (2.2%) |
| 85 Years and over | 6 (1.0%) | 4 (1.0%) |
| Total | 622 (100.0%) | 414 (100.0%) |
Families and Households in Sand Springs
Median Family Size in Sand Springs
The median family size in Sand Springs is 2.96 persons per family, with single female/mother families (48 | 18.0%) accounting for the largest median family size of 3.98 persons per family. On the other hand, single male/father families (105 | 39.5%) represent the smallest median family size with 2.00 persons per family.
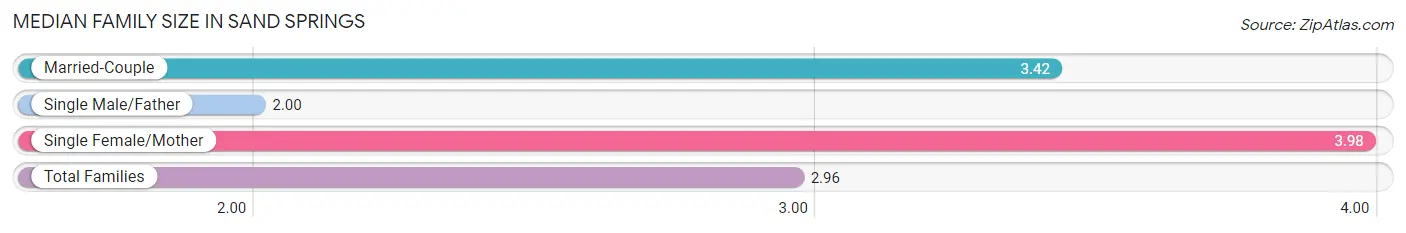
| Family Type | # Families | Family Size |
| Married-Couple | 113 (42.5%) | 3.42 |
| Single Male/Father | 105 (39.5%) | 2.00 |
| Single Female/Mother | 48 (18.0%) | 3.98 |
| Total Families | 266 (100.0%) | 2.96 |
Median Household Size in Sand Springs
The median household size in Sand Springs is 2.34 persons per household, with single female/mother households (48 | 10.8%) accounting for the largest median household size of 4.19 persons per household. non-family households (177 | 40.0%) represent the smallest median household size with 1.16 persons per household.
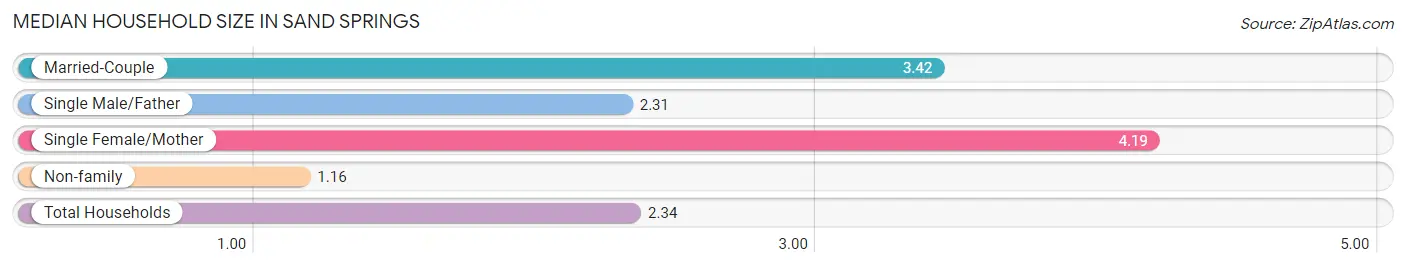
| Household Type | # Households | Household Size |
| Married-Couple | 113 (25.5%) | 3.42 |
| Single Male/Father | 105 (23.7%) | 2.31 |
| Single Female/Mother | 48 (10.8%) | 4.19 |
| Non-family | 177 (40.0%) | 1.16 |
| Total Households | 443 (100.0%) | 2.34 |
Household Size by Marriage Status in Sand Springs
Out of a total of 443 households in Sand Springs, 266 (60.1%) are family households, while 177 (40.0%) are nonfamily households. The most numerous type of family households are 2-person households, comprising 123, and the most common type of nonfamily households are 1-person households, comprising 154.
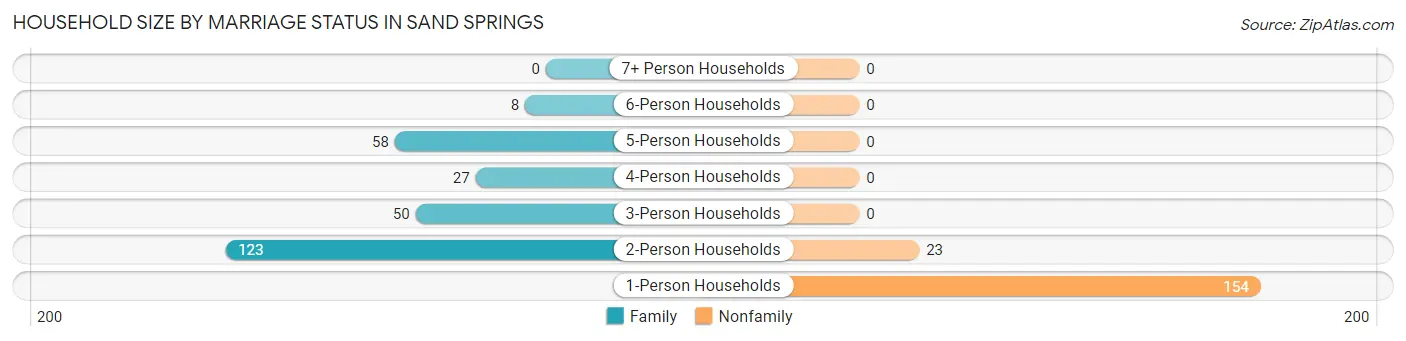
| Household Size | Family Households | Nonfamily Households |
| 1-Person Households | - | 154 (34.8%) |
| 2-Person Households | 123 (27.8%) | 23 (5.2%) |
| 3-Person Households | 50 (11.3%) | 0 (0.0%) |
| 4-Person Households | 27 (6.1%) | 0 (0.0%) |
| 5-Person Households | 58 (13.1%) | 0 (0.0%) |
| 6-Person Households | 8 (1.8%) | 0 (0.0%) |
| 7+ Person Households | 0 (0.0%) | 0 (0.0%) |
| Total | 266 (60.1%) | 177 (40.0%) |
Female Fertility in Sand Springs
Fertility by Age in Sand Springs
| Age Bracket | Women with Births | Births / 1,000 Women |
| 15 to 19 years | 0 (0.0%) | 0.0 |
| 20 to 34 years | 0 (0.0%) | 0.0 |
| 35 to 50 years | 0 (0.0%) | 0.0 |
| Total | 0 (0.0%) | 0.0 |
Fertility by Age by Marriage Status in Sand Springs
| Age Bracket | Married | Unmarried |
| 15 to 19 years | 0 (0.0%) | 0 (0.0%) |
| 20 to 34 years | 0 (0.0%) | 0 (0.0%) |
| 35 to 50 years | 0 (0.0%) | 0 (0.0%) |
| Total | 0 (0.0%) | 0 (0.0%) |
Fertility by Education in Sand Springs
| Educational Attainment | Women with Births | Births / 1,000 Women |
| Less than High School | 0 (0.0%) | 0.0 |
| High School Diploma | 0 (0.0%) | 0.0 |
| College or Associate's Degree | 0 (0.0%) | 0.0 |
| Bachelor's Degree | 0 (0.0%) | 0.0 |
| Graduate Degree | 0 (0.0%) | 0.0 |
| Total | 0 (0.0%) | 0.0 |
Fertility by Education by Marriage Status in Sand Springs
| Educational Attainment | Married | Unmarried |
| Less than High School | 0 (0.0%) | 0 (0.0%) |
| High School Diploma | 0 (0.0%) | 0 (0.0%) |
| College or Associate's Degree | 0 (0.0%) | 0 (0.0%) |
| Bachelor's Degree | 0 (0.0%) | 0 (0.0%) |
| Graduate Degree | 0 (0.0%) | 0 (0.0%) |
| Total | 0 (0.0%) | 0 (0.0%) |
Employment Characteristics in Sand Springs
Employment by Class of Employer in Sand Springs
Among the 581 employed individuals in Sand Springs, private company employees (350 | 60.2%), local government employees (96 | 16.5%), and self-employed (not incorporated) (71 | 12.2%) make up the most common classes of employment.
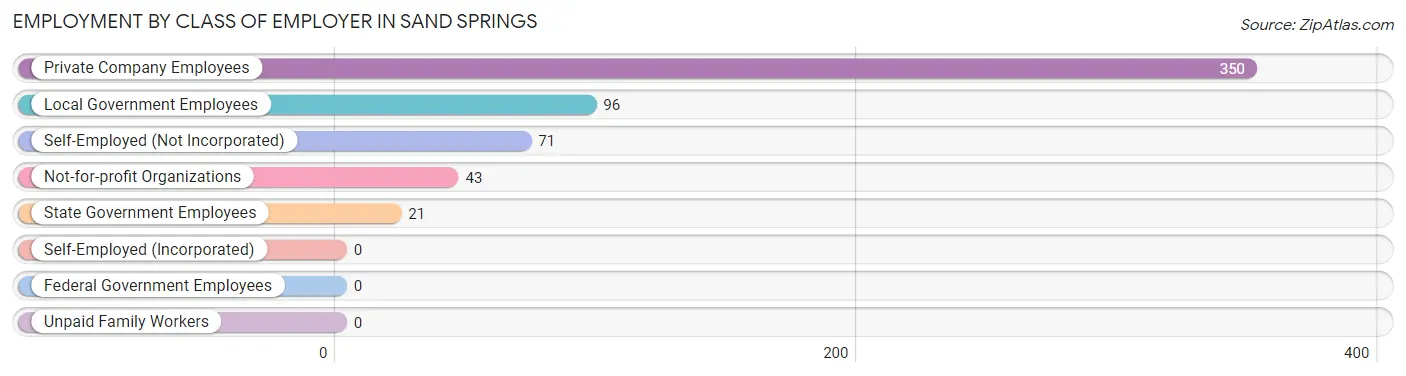
| Employer Class | # Employees | % Employees |
| Private Company Employees | 350 | 60.2% |
| Self-Employed (Incorporated) | 0 | 0.0% |
| Self-Employed (Not Incorporated) | 71 | 12.2% |
| Not-for-profit Organizations | 43 | 7.4% |
| Local Government Employees | 96 | 16.5% |
| State Government Employees | 21 | 3.6% |
| Federal Government Employees | 0 | 0.0% |
| Unpaid Family Workers | 0 | 0.0% |
| Total | 581 | 100.0% |
Employment Status by Age in Sand Springs
According to the labor force statistics for Sand Springs, out of the total population over 16 years of age (858), 69.8% or 599 individuals are in the labor force, with 1.8% or 11 of them unemployed. The age group with the highest labor force participation rate is 55 to 59 years, with 100.0% or 30 individuals in the labor force. Within the labor force, the 25 to 29 years age range has the highest percentage of unemployed individuals, with 25.6% or 11 of them being unemployed.
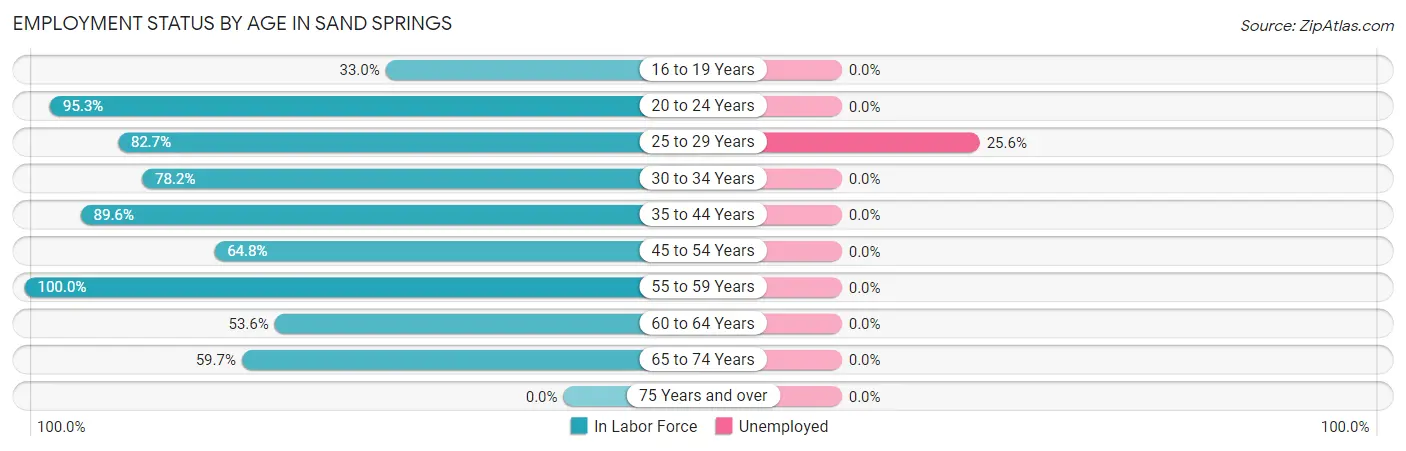
| Age Bracket | In Labor Force | Unemployed |
| 16 to 19 Years | 29 (33.0%) | 0 (0.0%) |
| 20 to 24 Years | 123 (95.3%) | 0 (0.0%) |
| 25 to 29 Years | 43 (82.7%) | 11 (25.6%) |
| 30 to 34 Years | 43 (78.2%) | 0 (0.0%) |
| 35 to 44 Years | 172 (89.6%) | 0 (0.0%) |
| 45 to 54 Years | 107 (64.8%) | 0 (0.0%) |
| 55 to 59 Years | 30 (100.0%) | 0 (0.0%) |
| 60 to 64 Years | 15 (53.6%) | 0 (0.0%) |
| 65 to 74 Years | 37 (59.7%) | 0 (0.0%) |
| 75 Years and over | 0 (0.0%) | 0 (0.0%) |
| Total | 599 (69.8%) | 11 (1.8%) |
Employment Status by Educational Attainment in Sand Springs
According to labor force statistics for Sand Springs, 78.5% of individuals (410) out of the total population between 25 and 64 years of age (522) are in the labor force, with 2.7% or 11 of them being unemployed. The group with the highest labor force participation rate are those with the educational attainment of bachelor's degree or higher, with 100.0% or 115 individuals in the labor force. Within the labor force, individuals with bachelor's degree or higher education have the highest percentage of unemployment, with 9.6% or 11 of them being unemployed.
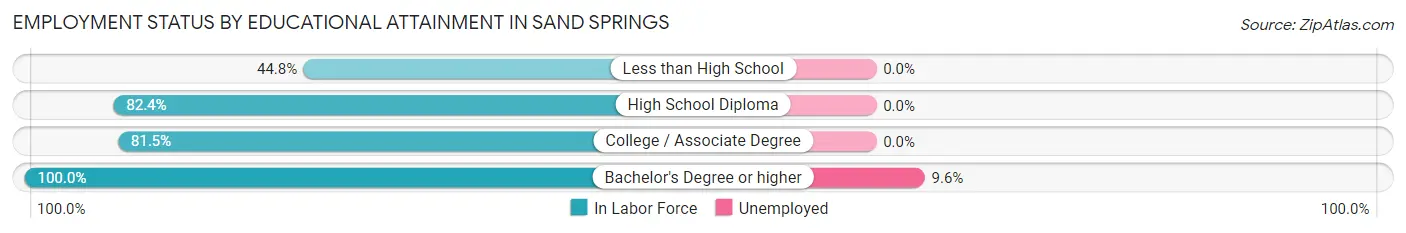
| Educational Attainment | In Labor Force | Unemployed |
| Less than High School | 47 (44.8%) | 0 (0.0%) |
| High School Diploma | 173 (82.4%) | 0 (0.0%) |
| College / Associate Degree | 75 (81.5%) | 0 (0.0%) |
| Bachelor's Degree or higher | 115 (100.0%) | 11 (9.6%) |
| Total | 410 (78.5%) | 14 (2.7%) |
Employment Occupations by Sex in Sand Springs
Management, Business, Science and Arts Occupations
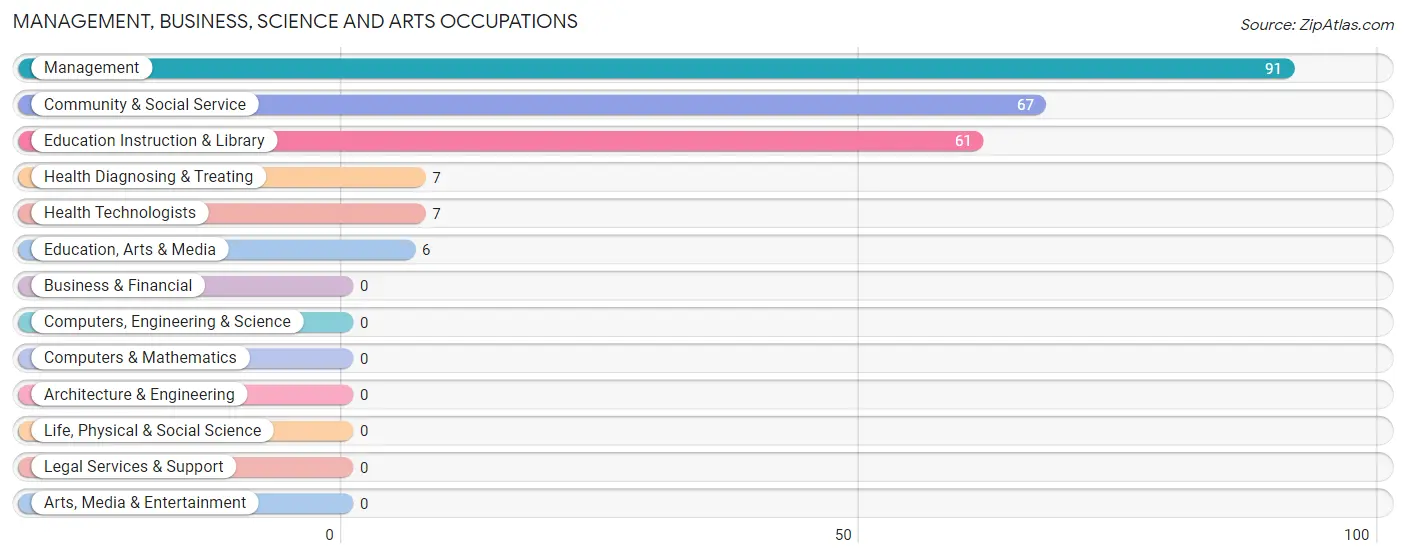
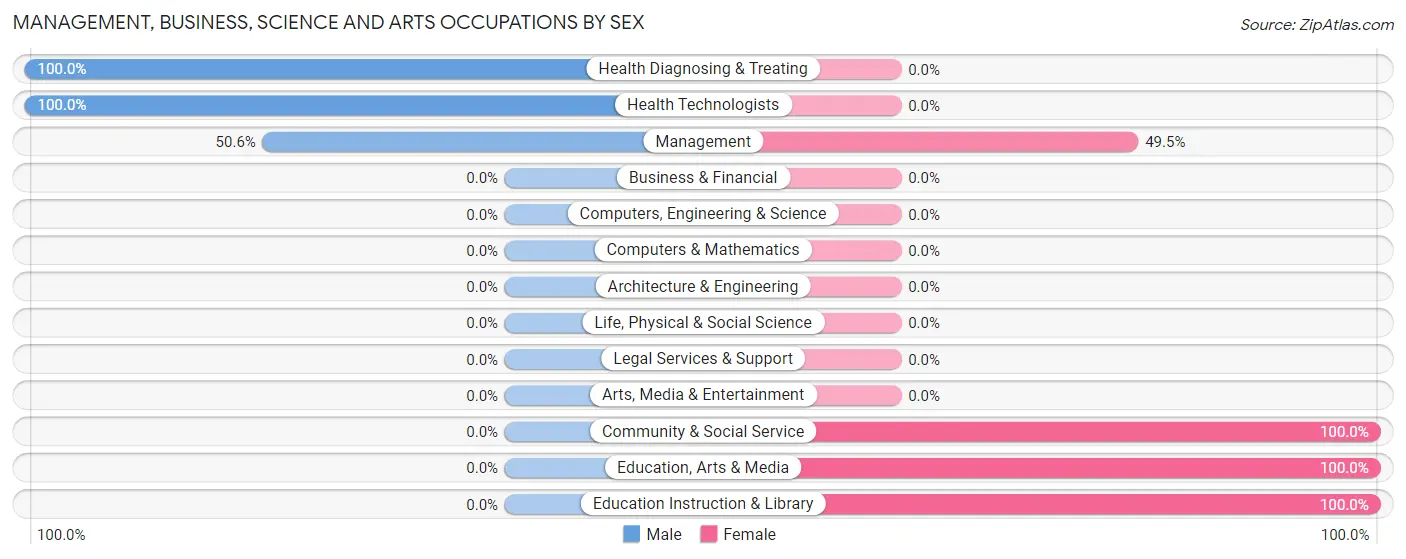
The most common Management, Business, Science and Arts occupations in Sand Springs are Management (91 | 15.5%), Community & Social Service (67 | 11.4%), Education Instruction & Library (61 | 10.4%), Health Diagnosing & Treating (7 | 1.2%), and Health Technologists (7 | 1.2%).
Management, Business, Science and Arts Occupations by Sex
Within the Management, Business, Science and Arts occupations in Sand Springs, the most male-oriented occupations are Health Diagnosing & Treating (100.0%), Health Technologists (100.0%), and Management (50.5%), while the most female-oriented occupations are Community & Social Service (100.0%), Education, Arts & Media (100.0%), and Education Instruction & Library (100.0%).
| Occupation | Male | Female |
| Management | 46 (50.5%) | 45 (49.4%) |
| Business & Financial | 0 (0.0%) | 0 (0.0%) |
| Computers, Engineering & Science | 0 (0.0%) | 0 (0.0%) |
| Computers & Mathematics | 0 (0.0%) | 0 (0.0%) |
| Architecture & Engineering | 0 (0.0%) | 0 (0.0%) |
| Life, Physical & Social Science | 0 (0.0%) | 0 (0.0%) |
| Community & Social Service | 0 (0.0%) | 67 (100.0%) |
| Education, Arts & Media | 0 (0.0%) | 6 (100.0%) |
| Legal Services & Support | 0 (0.0%) | 0 (0.0%) |
| Education Instruction & Library | 0 (0.0%) | 61 (100.0%) |
| Arts, Media & Entertainment | 0 (0.0%) | 0 (0.0%) |
| Health Diagnosing & Treating | 7 (100.0%) | 0 (0.0%) |
| Health Technologists | 7 (100.0%) | 0 (0.0%) |
| Total (Category) | 53 (32.1%) | 112 (67.9%) |
| Total (Overall) | 406 (69.1%) | 182 (30.9%) |
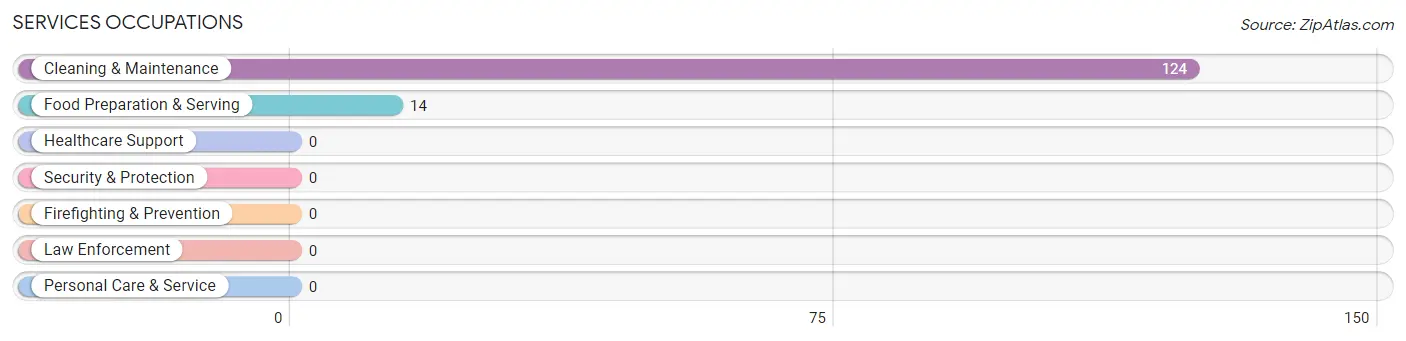
Services Occupations
The most common Services occupations in Sand Springs are Cleaning & Maintenance (124 | 21.1%), and Food Preparation & Serving (14 | 2.4%).
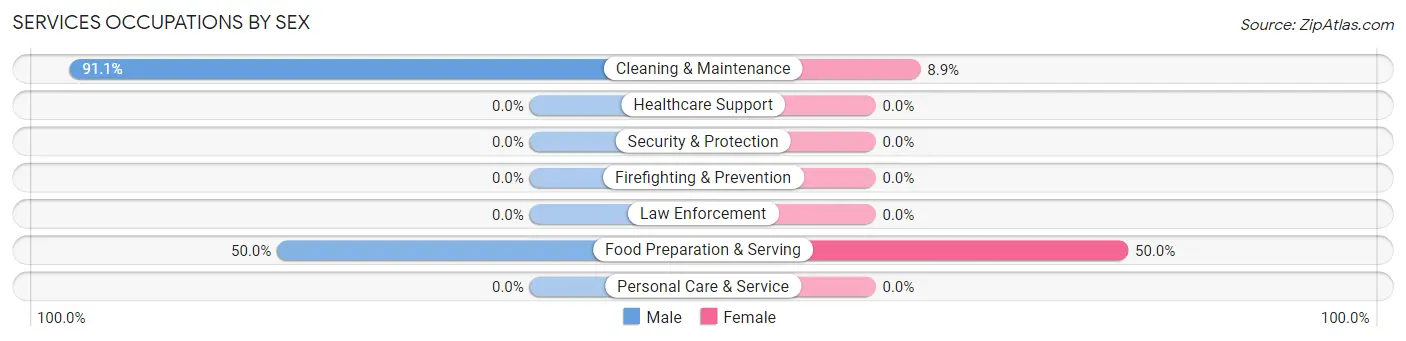
Services Occupations by Sex
Within the Services occupations in Sand Springs, the most male-oriented occupations are Cleaning & Maintenance (91.1%), and Food Preparation & Serving (50.0%), while the most female-oriented occupations are Food Preparation & Serving (50.0%), and Cleaning & Maintenance (8.9%).
| Occupation | Male | Female |
| Healthcare Support | 0 (0.0%) | 0 (0.0%) |
| Security & Protection | 0 (0.0%) | 0 (0.0%) |
| Firefighting & Prevention | 0 (0.0%) | 0 (0.0%) |
| Law Enforcement | 0 (0.0%) | 0 (0.0%) |
| Food Preparation & Serving | 7 (50.0%) | 7 (50.0%) |
| Cleaning & Maintenance | 113 (91.1%) | 11 (8.9%) |
| Personal Care & Service | 0 (0.0%) | 0 (0.0%) |
| Total (Category) | 120 (87.0%) | 18 (13.0%) |
| Total (Overall) | 406 (69.1%) | 182 (30.9%) |
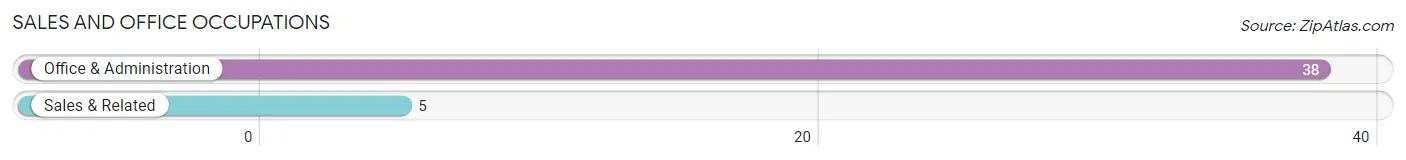
Sales and Office Occupations
The most common Sales and Office occupations in Sand Springs are Office & Administration (38 | 6.5%), and Sales & Related (5 | 0.9%).
Sales and Office Occupations by Sex
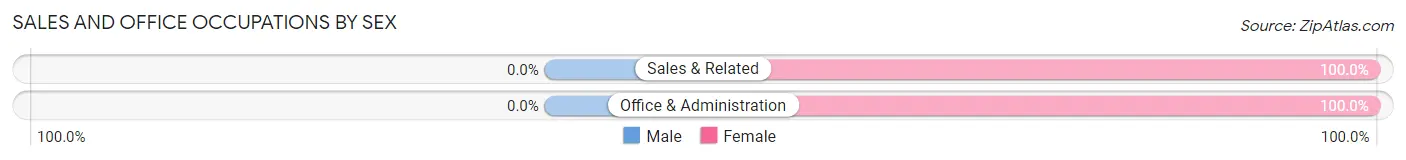
| Occupation | Male | Female |
| Sales & Related | 0 (0.0%) | 5 (100.0%) |
| Office & Administration | 0 (0.0%) | 38 (100.0%) |
| Total (Category) | 0 (0.0%) | 43 (100.0%) |
| Total (Overall) | 406 (69.1%) | 182 (30.9%) |
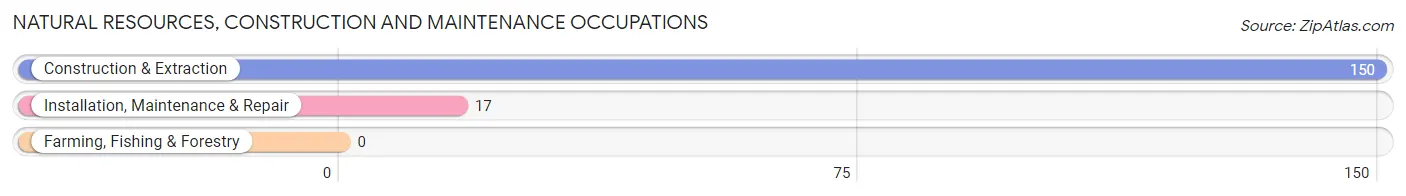
Natural Resources, Construction and Maintenance Occupations
The most common Natural Resources, Construction and Maintenance occupations in Sand Springs are Construction & Extraction (150 | 25.5%), and Installation, Maintenance & Repair (17 | 2.9%).
Natural Resources, Construction and Maintenance Occupations by Sex
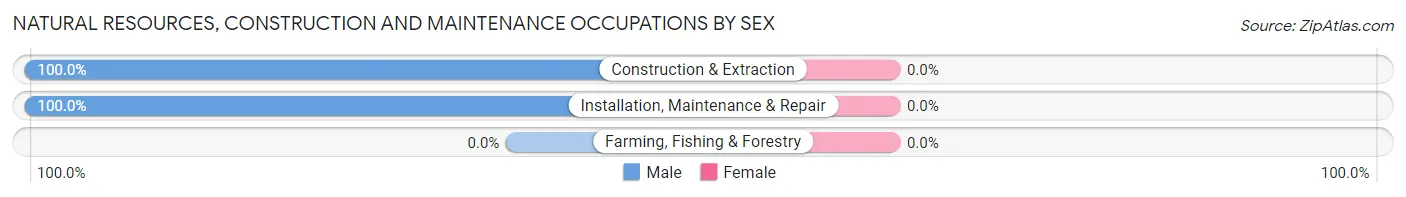
| Occupation | Male | Female |
| Farming, Fishing & Forestry | 0 (0.0%) | 0 (0.0%) |
| Construction & Extraction | 150 (100.0%) | 0 (0.0%) |
| Installation, Maintenance & Repair | 17 (100.0%) | 0 (0.0%) |
| Total (Category) | 167 (100.0%) | 0 (0.0%) |
| Total (Overall) | 406 (69.1%) | 182 (30.9%) |
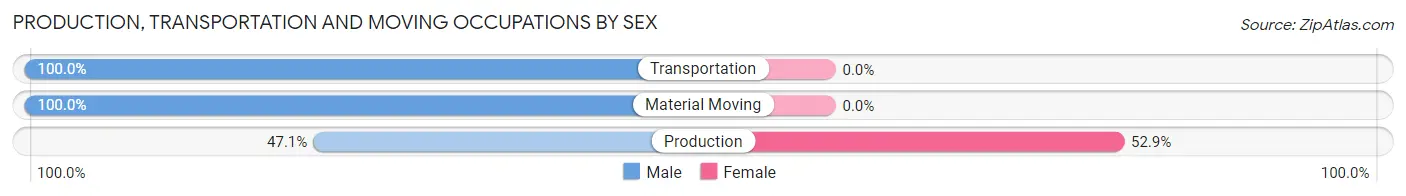
Production, Transportation and Moving Occupations
The most common Production, Transportation and Moving occupations in Sand Springs are Material Moving (38 | 6.5%), Transportation (20 | 3.4%), and Production (17 | 2.9%).
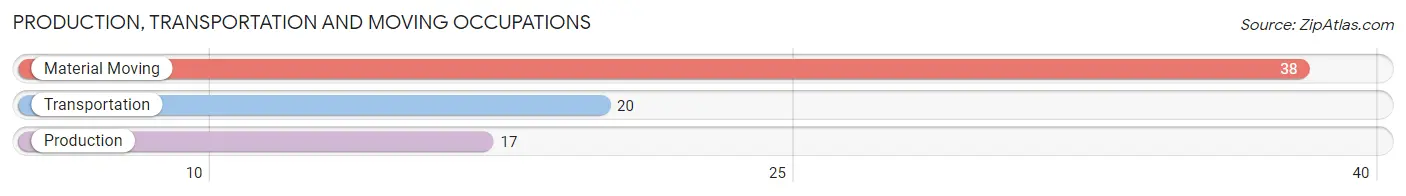
Production, Transportation and Moving Occupations by Sex
| Occupation | Male | Female |
| Production | 8 (47.1%) | 9 (52.9%) |
| Transportation | 20 (100.0%) | 0 (0.0%) |
| Material Moving | 38 (100.0%) | 0 (0.0%) |
| Total (Category) | 66 (88.0%) | 9 (12.0%) |
| Total (Overall) | 406 (69.1%) | 182 (30.9%) |
Employment Industries by Sex in Sand Springs
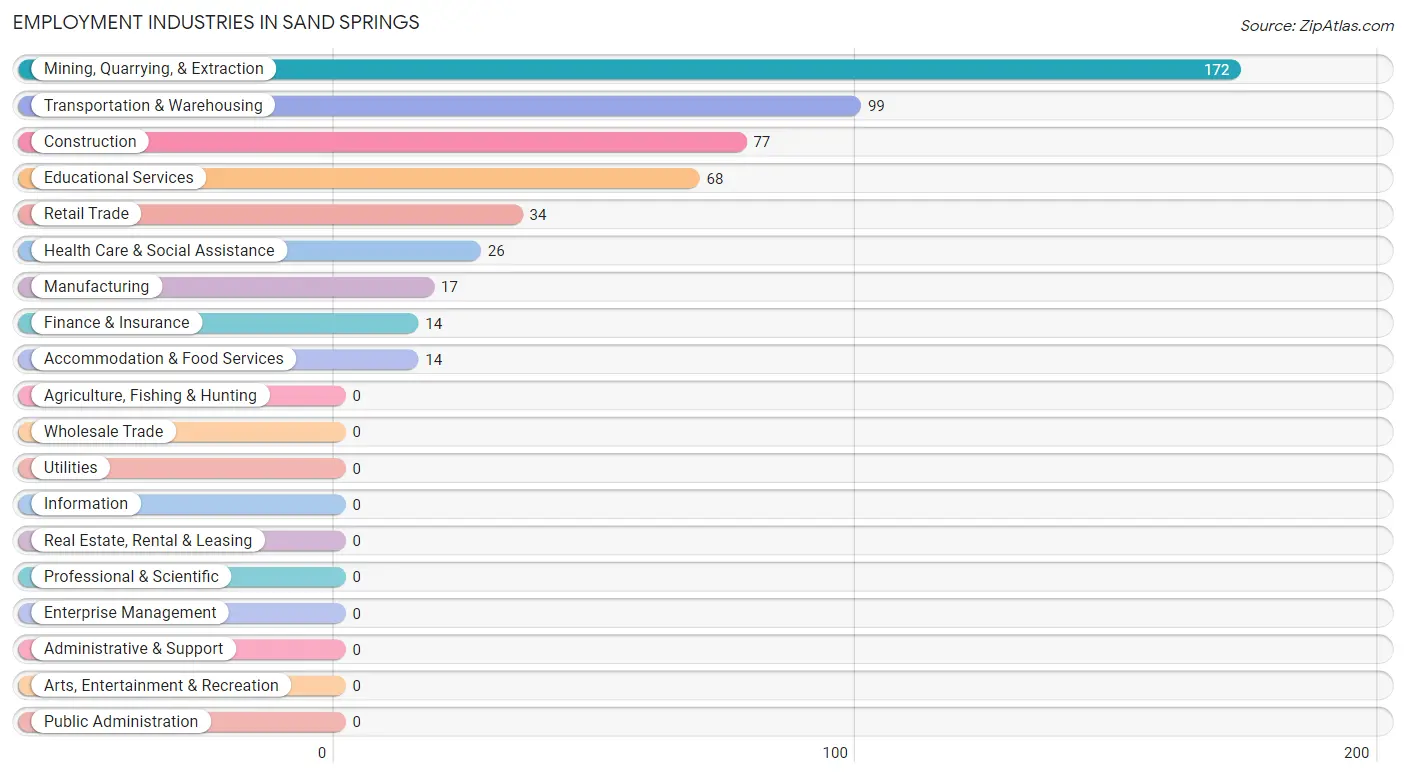
Employment Industries in Sand Springs
The major employment industries in Sand Springs include Mining, Quarrying, & Extraction (172 | 29.2%), Transportation & Warehousing (99 | 16.8%), Construction (77 | 13.1%), Educational Services (68 | 11.6%), and Retail Trade (34 | 5.8%).
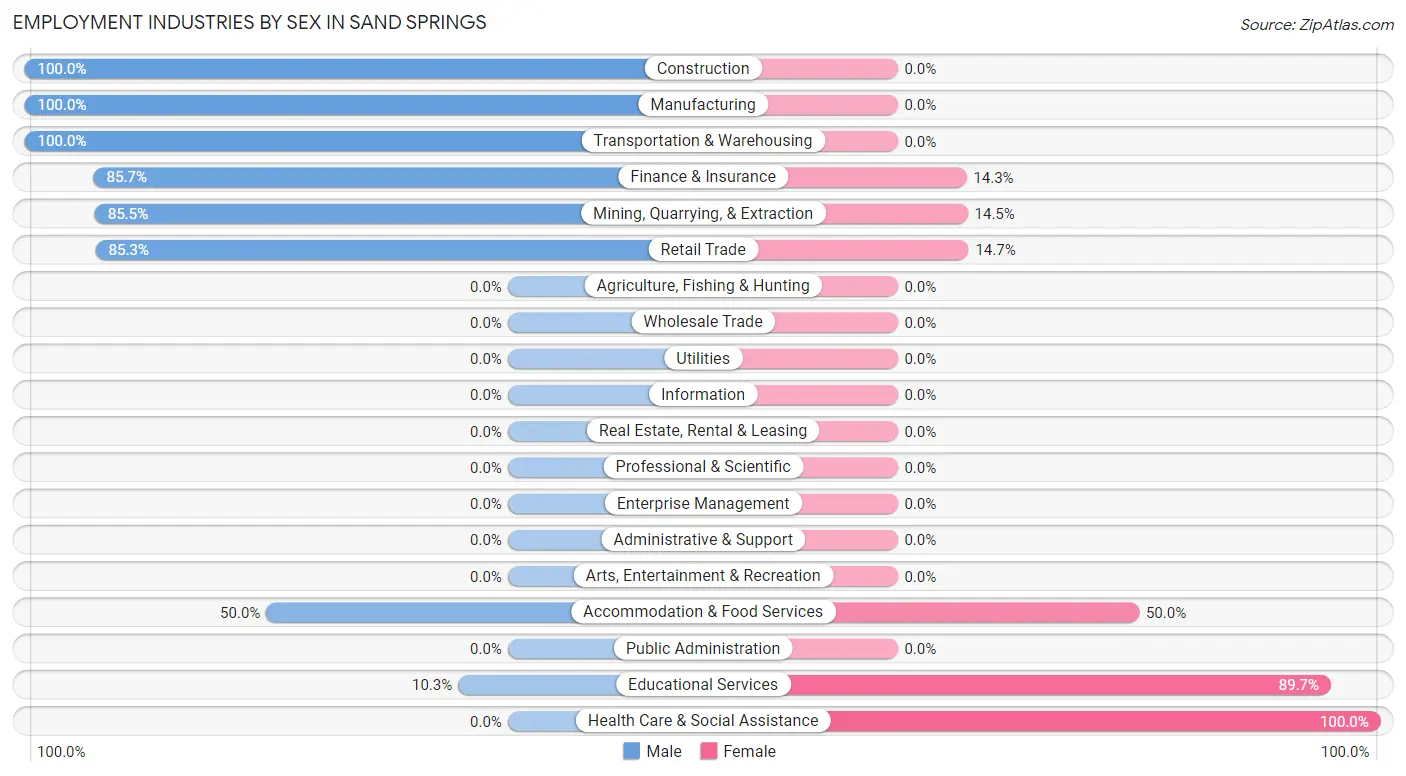
Employment Industries by Sex in Sand Springs
The Sand Springs industries that see more men than women are Construction (100.0%), Manufacturing (100.0%), and Transportation & Warehousing (100.0%), whereas the industries that tend to have a higher number of women are Health Care & Social Assistance (100.0%), Educational Services (89.7%), and Accommodation & Food Services (50.0%).
| Industry | Male | Female |
| Agriculture, Fishing & Hunting | 0 (0.0%) | 0 (0.0%) |
| Mining, Quarrying, & Extraction | 147 (85.5%) | 25 (14.5%) |
| Construction | 77 (100.0%) | 0 (0.0%) |
| Manufacturing | 17 (100.0%) | 0 (0.0%) |
| Wholesale Trade | 0 (0.0%) | 0 (0.0%) |
| Retail Trade | 29 (85.3%) | 5 (14.7%) |
| Transportation & Warehousing | 99 (100.0%) | 0 (0.0%) |
| Utilities | 0 (0.0%) | 0 (0.0%) |
| Information | 0 (0.0%) | 0 (0.0%) |
| Finance & Insurance | 12 (85.7%) | 2 (14.3%) |
| Real Estate, Rental & Leasing | 0 (0.0%) | 0 (0.0%) |
| Professional & Scientific | 0 (0.0%) | 0 (0.0%) |
| Enterprise Management | 0 (0.0%) | 0 (0.0%) |
| Administrative & Support | 0 (0.0%) | 0 (0.0%) |
| Educational Services | 7 (10.3%) | 61 (89.7%) |
| Health Care & Social Assistance | 0 (0.0%) | 26 (100.0%) |
| Arts, Entertainment & Recreation | 0 (0.0%) | 0 (0.0%) |
| Accommodation & Food Services | 7 (50.0%) | 7 (50.0%) |
| Public Administration | 0 (0.0%) | 0 (0.0%) |
| Total | 406 (69.1%) | 182 (30.9%) |
Education in Sand Springs
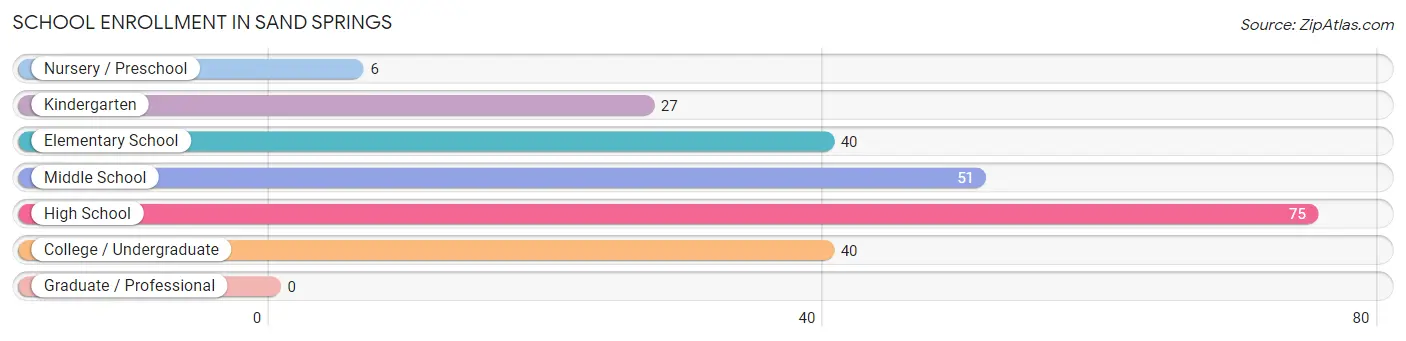
School Enrollment in Sand Springs
The most common levels of schooling among the 239 students in Sand Springs are high school (75 | 31.4%), middle school (51 | 21.3%), and elementary school (40 | 16.7%).
| School Level | # Students | % Students |
| Nursery / Preschool | 6 | 2.5% |
| Kindergarten | 27 | 11.3% |
| Elementary School | 40 | 16.7% |
| Middle School | 51 | 21.3% |
| High School | 75 | 31.4% |
| College / Undergraduate | 40 | 16.7% |
| Graduate / Professional | 0 | 0.0% |
| Total | 239 | 100.0% |
School Enrollment by Age by Funding Source in Sand Springs
Out of a total of 239 students who are enrolled in schools in Sand Springs, 17 (7.1%) attend a private institution, while the remaining 222 (92.9%) are enrolled in public schools. The age group of 3 to 4 year olds has the highest likelihood of being enrolled in private schools, with 6 (100.0% in the age bracket) enrolled. Conversely, the age group of 5 to 9 year old has the lowest likelihood of being enrolled in a private school, with 54 (100.0% in the age bracket) attending a public institution.
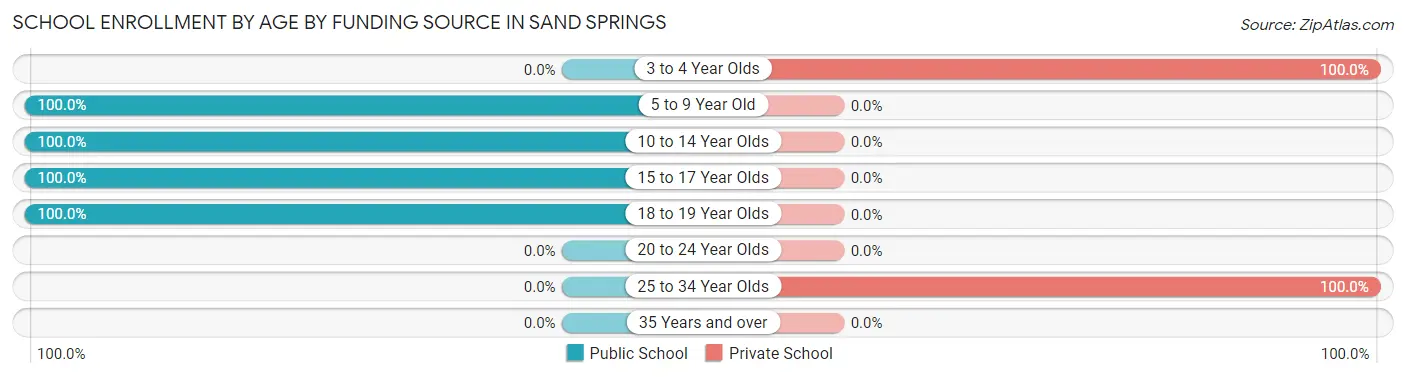
| Age Bracket | Public School | Private School |
| 3 to 4 Year Olds | 0 (0.0%) | 6 (100.0%) |
| 5 to 9 Year Old | 54 (100.0%) | 0 (0.0%) |
| 10 to 14 Year Olds | 64 (100.0%) | 0 (0.0%) |
| 15 to 17 Year Olds | 75 (100.0%) | 0 (0.0%) |
| 18 to 19 Year Olds | 29 (100.0%) | 0 (0.0%) |
| 20 to 24 Year Olds | 0 (0.0%) | 0 (0.0%) |
| 25 to 34 Year Olds | 0 (0.0%) | 11 (100.0%) |
| 35 Years and over | 0 (0.0%) | 0 (0.0%) |
| Total | 222 (92.9%) | 17 (7.1%) |
Educational Attainment by Field of Study in Sand Springs
Arts & humanities (31 | 22.6%), science & technology (27 | 19.7%), business (18 | 13.1%), engineering (15 | 11.0%), and multidisciplinary studies (14 | 10.2%) are the most common fields of study among 137 individuals in Sand Springs who have obtained a bachelor's degree or higher.
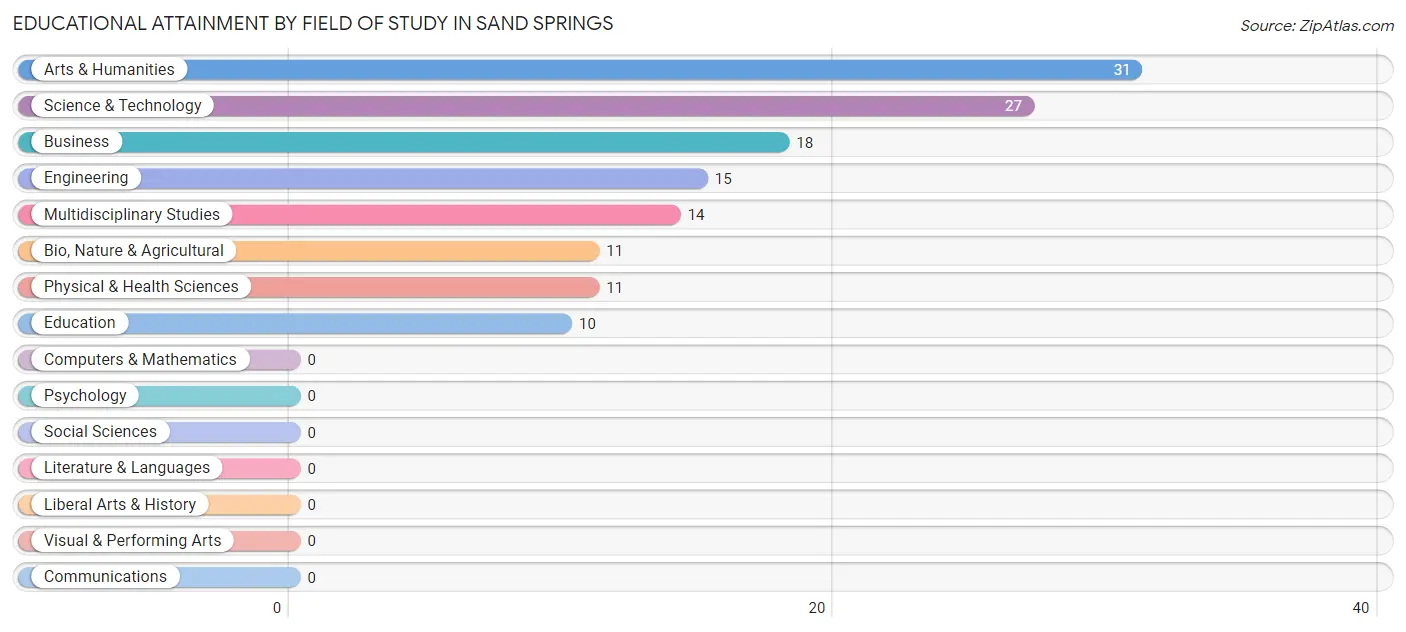
| Field of Study | # Graduates | % Graduates |
| Computers & Mathematics | 0 | 0.0% |
| Bio, Nature & Agricultural | 11 | 8.0% |
| Physical & Health Sciences | 11 | 8.0% |
| Psychology | 0 | 0.0% |
| Social Sciences | 0 | 0.0% |
| Engineering | 15 | 11.0% |
| Multidisciplinary Studies | 14 | 10.2% |
| Science & Technology | 27 | 19.7% |
| Business | 18 | 13.1% |
| Education | 10 | 7.3% |
| Literature & Languages | 0 | 0.0% |
| Liberal Arts & History | 0 | 0.0% |
| Visual & Performing Arts | 0 | 0.0% |
| Communications | 0 | 0.0% |
| Arts & Humanities | 31 | 22.6% |
| Total | 137 | 100.0% |
Transportation & Commute in Sand Springs
Vehicle Availability by Sex in Sand Springs
The most prevalent vehicle ownership categories in Sand Springs are males with 3 vehicles (152, accounting for 37.4%) and females with 3 vehicles (75, making up 86.9%).
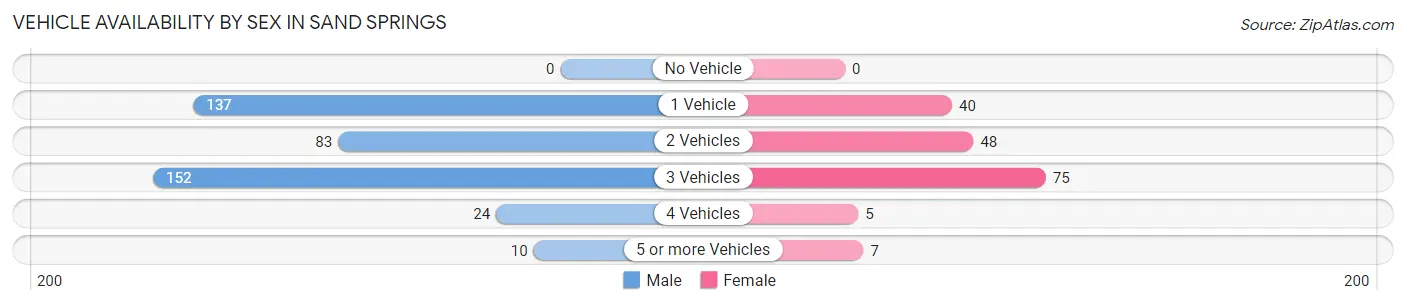
| Vehicles Available | Male | Female |
| No Vehicle | 0 (0.0%) | 0 (0.0%) |
| 1 Vehicle | 137 (33.7%) | 40 (22.9%) |
| 2 Vehicles | 83 (20.4%) | 48 (27.4%) |
| 3 Vehicles | 152 (37.4%) | 75 (42.9%) |
| 4 Vehicles | 24 (5.9%) | 5 (2.9%) |
| 5 or more Vehicles | 10 (2.5%) | 7 (4.0%) |
| Total | 406 (100.0%) | 175 (100.0%) |
Commute Time in Sand Springs
The most frequently occuring commute durations in Sand Springs are 15 to 19 minutes (188 commuters, 33.0%), 45 to 59 minutes (161 commuters, 28.2%), and 5 to 9 minutes (79 commuters, 13.9%).
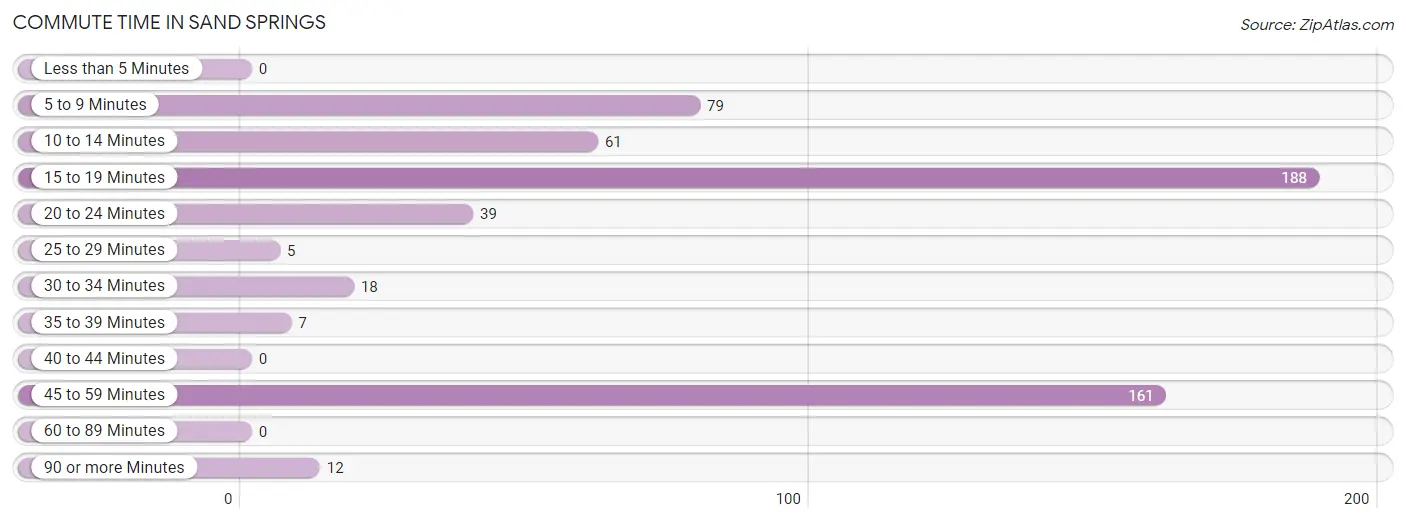
| Commute Time | # Commuters | % Commuters |
| Less than 5 Minutes | 0 | 0.0% |
| 5 to 9 Minutes | 79 | 13.9% |
| 10 to 14 Minutes | 61 | 10.7% |
| 15 to 19 Minutes | 188 | 33.0% |
| 20 to 24 Minutes | 39 | 6.8% |
| 25 to 29 Minutes | 5 | 0.9% |
| 30 to 34 Minutes | 18 | 3.2% |
| 35 to 39 Minutes | 7 | 1.2% |
| 40 to 44 Minutes | 0 | 0.0% |
| 45 to 59 Minutes | 161 | 28.2% |
| 60 to 89 Minutes | 0 | 0.0% |
| 90 or more Minutes | 12 | 2.1% |
Commute Time by Sex in Sand Springs
The most common commute times in Sand Springs are 45 to 59 minutes (146 commuters, 36.0%) for males and 15 to 19 minutes (65 commuters, 39.6%) for females.
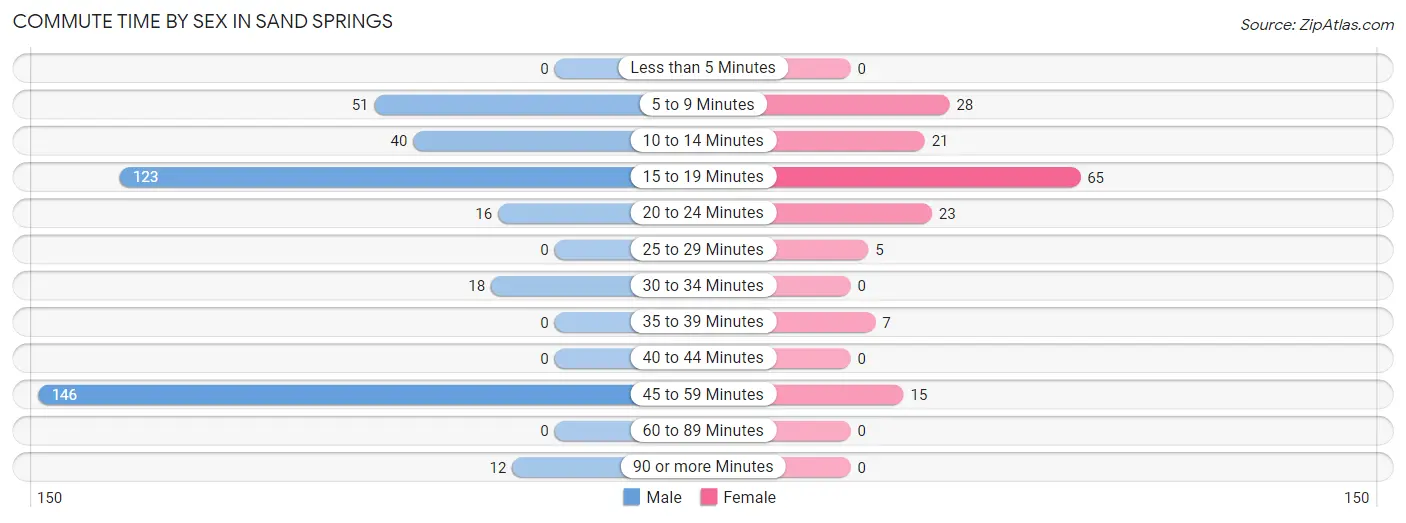
| Commute Time | Male | Female |
| Less than 5 Minutes | 0 (0.0%) | 0 (0.0%) |
| 5 to 9 Minutes | 51 (12.6%) | 28 (17.1%) |
| 10 to 14 Minutes | 40 (9.9%) | 21 (12.8%) |
| 15 to 19 Minutes | 123 (30.3%) | 65 (39.6%) |
| 20 to 24 Minutes | 16 (3.9%) | 23 (14.0%) |
| 25 to 29 Minutes | 0 (0.0%) | 5 (3.0%) |
| 30 to 34 Minutes | 18 (4.4%) | 0 (0.0%) |
| 35 to 39 Minutes | 0 (0.0%) | 7 (4.3%) |
| 40 to 44 Minutes | 0 (0.0%) | 0 (0.0%) |
| 45 to 59 Minutes | 146 (36.0%) | 15 (9.1%) |
| 60 to 89 Minutes | 0 (0.0%) | 0 (0.0%) |
| 90 or more Minutes | 12 (3.0%) | 0 (0.0%) |
Time of Departure to Work by Sex in Sand Springs
The most frequent times of departure to work in Sand Springs are 7:00 AM to 7:29 AM (157, 38.7%) for males and 7:30 AM to 7:59 AM (55, 33.5%) for females.
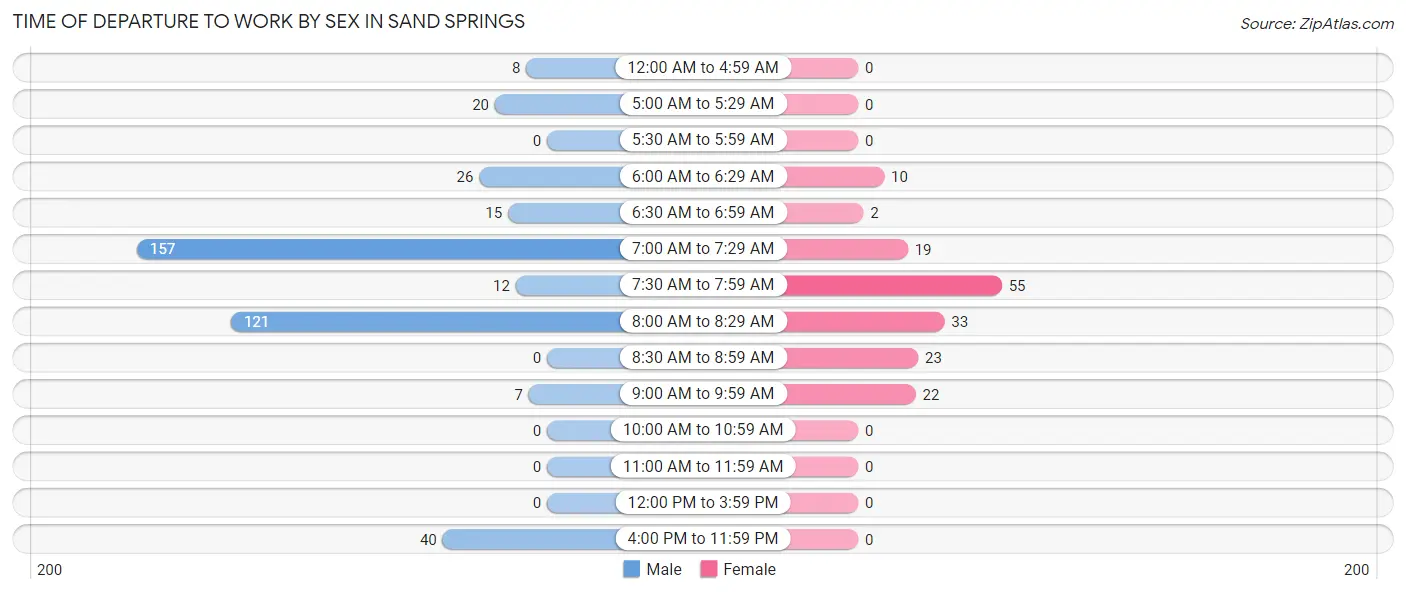
| Time of Departure | Male | Female |
| 12:00 AM to 4:59 AM | 8 (2.0%) | 0 (0.0%) |
| 5:00 AM to 5:29 AM | 20 (4.9%) | 0 (0.0%) |
| 5:30 AM to 5:59 AM | 0 (0.0%) | 0 (0.0%) |
| 6:00 AM to 6:29 AM | 26 (6.4%) | 10 (6.1%) |
| 6:30 AM to 6:59 AM | 15 (3.7%) | 2 (1.2%) |
| 7:00 AM to 7:29 AM | 157 (38.7%) | 19 (11.6%) |
| 7:30 AM to 7:59 AM | 12 (3.0%) | 55 (33.5%) |
| 8:00 AM to 8:29 AM | 121 (29.8%) | 33 (20.1%) |
| 8:30 AM to 8:59 AM | 0 (0.0%) | 23 (14.0%) |
| 9:00 AM to 9:59 AM | 7 (1.7%) | 22 (13.4%) |
| 10:00 AM to 10:59 AM | 0 (0.0%) | 0 (0.0%) |
| 11:00 AM to 11:59 AM | 0 (0.0%) | 0 (0.0%) |
| 12:00 PM to 3:59 PM | 0 (0.0%) | 0 (0.0%) |
| 4:00 PM to 11:59 PM | 40 (9.9%) | 0 (0.0%) |
| Total | 406 (100.0%) | 164 (100.0%) |
Housing Occupancy in Sand Springs
Occupancy by Ownership in Sand Springs
Of the total 443 dwellings in Sand Springs, owner-occupied units account for 331 (74.7%), while renter-occupied units make up 112 (25.3%).
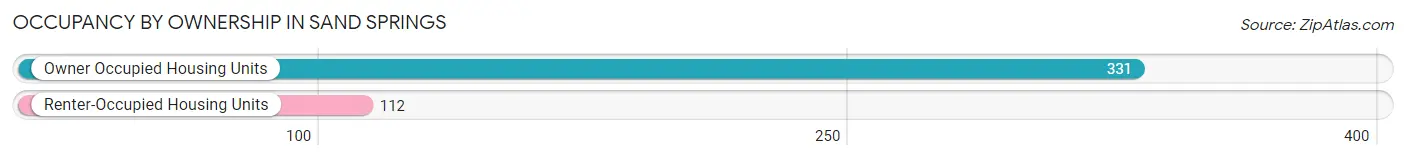
| Occupancy | # Housing Units | % Housing Units |
| Owner Occupied Housing Units | 331 | 74.7% |
| Renter-Occupied Housing Units | 112 | 25.3% |
| Total Occupied Housing Units | 443 | 100.0% |
Occupancy by Household Size in Sand Springs
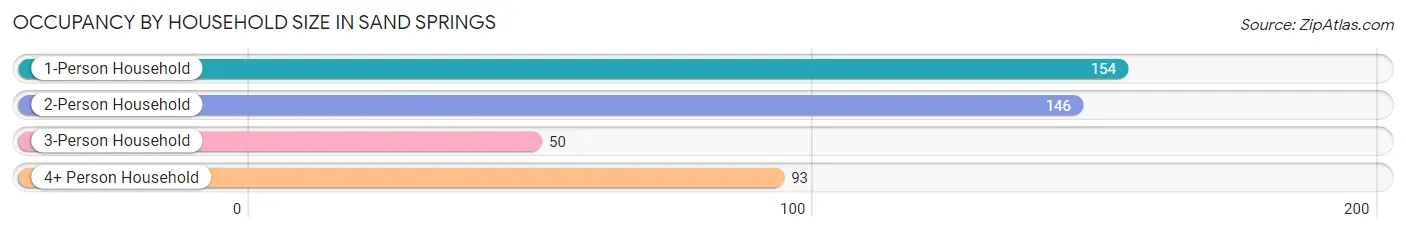
| Household Size | # Housing Units | % Housing Units |
| 1-Person Household | 154 | 34.8% |
| 2-Person Household | 146 | 33.0% |
| 3-Person Household | 50 | 11.3% |
| 4+ Person Household | 93 | 21.0% |
| Total Housing Units | 443 | 100.0% |
Occupancy by Ownership by Household Size in Sand Springs
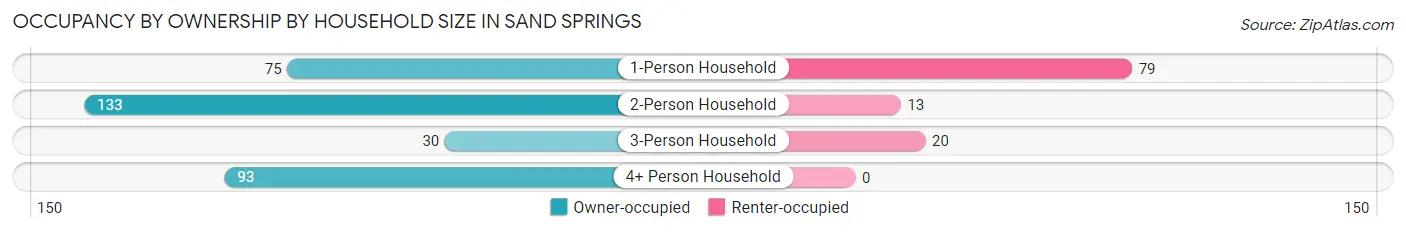
| Household Size | Owner-occupied | Renter-occupied |
| 1-Person Household | 75 (48.7%) | 79 (51.3%) |
| 2-Person Household | 133 (91.1%) | 13 (8.9%) |
| 3-Person Household | 30 (60.0%) | 20 (40.0%) |
| 4+ Person Household | 93 (100.0%) | 0 (0.0%) |
| Total Housing Units | 331 (74.7%) | 112 (25.3%) |
Occupancy by Educational Attainment in Sand Springs
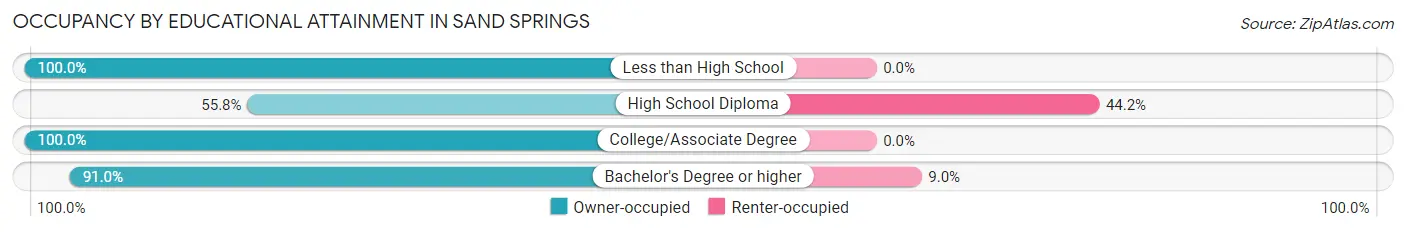
| Household Size | Owner-occupied | Renter-occupied |
| Less than High School | 70 (100.0%) | 0 (0.0%) |
| High School Diploma | 134 (55.8%) | 106 (44.2%) |
| College/Associate Degree | 66 (100.0%) | 0 (0.0%) |
| Bachelor's Degree or higher | 61 (91.0%) | 6 (9.0%) |
Occupancy by Age of Householder in Sand Springs
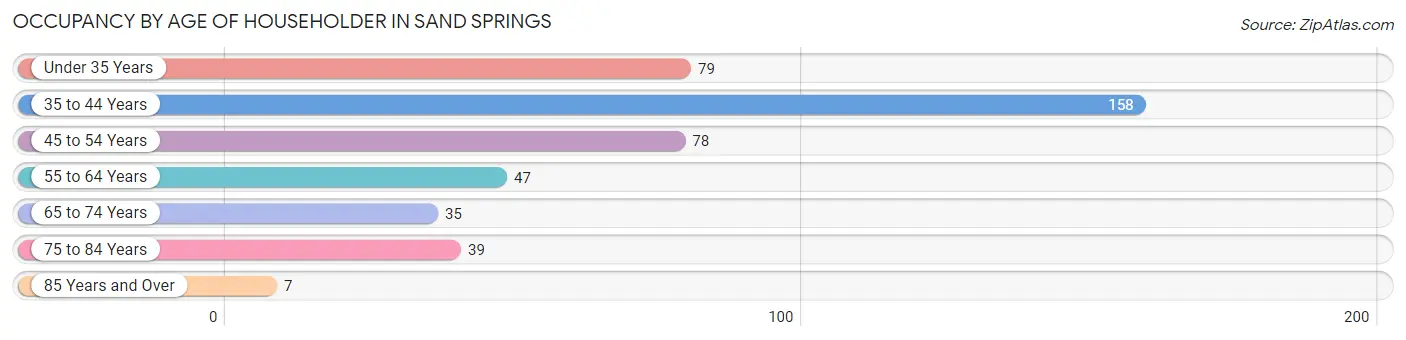
| Age Bracket | # Households | % Households |
| Under 35 Years | 79 | 17.8% |
| 35 to 44 Years | 158 | 35.7% |
| 45 to 54 Years | 78 | 17.6% |
| 55 to 64 Years | 47 | 10.6% |
| 65 to 74 Years | 35 | 7.9% |
| 75 to 84 Years | 39 | 8.8% |
| 85 Years and Over | 7 | 1.6% |
| Total | 443 | 100.0% |
Housing Finances in Sand Springs
Median Income by Occupancy in Sand Springs
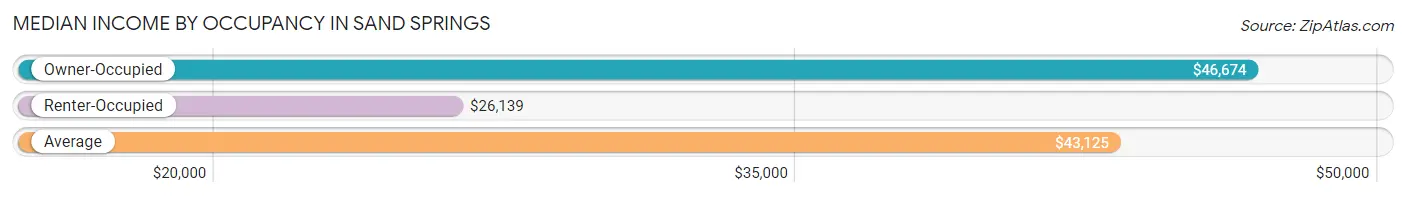
| Occupancy Type | # Households | Median Income |
| Owner-Occupied | 331 (74.7%) | $46,674 |
| Renter-Occupied | 112 (25.3%) | $26,139 |
| Average | 443 (100.0%) | $43,125 |
Occupancy by Householder Income Bracket in Sand Springs
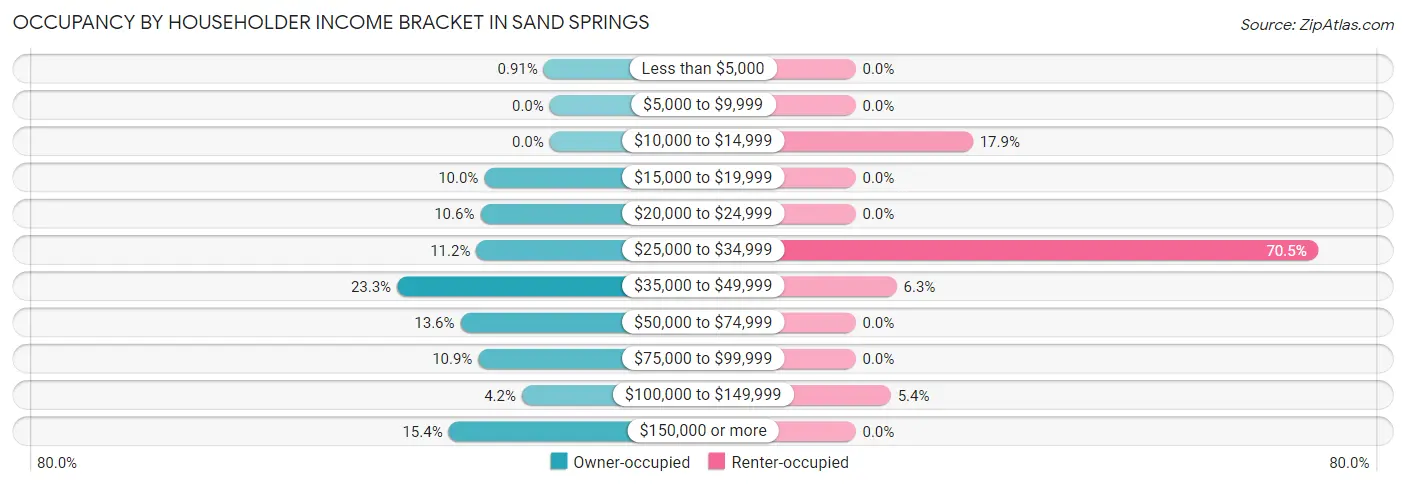
| Income Bracket | Owner-occupied | Renter-occupied |
| Less than $5,000 | 3 (0.9%) | 0 (0.0%) |
| $5,000 to $9,999 | 0 (0.0%) | 0 (0.0%) |
| $10,000 to $14,999 | 0 (0.0%) | 20 (17.9%) |
| $15,000 to $19,999 | 33 (10.0%) | 0 (0.0%) |
| $20,000 to $24,999 | 35 (10.6%) | 0 (0.0%) |
| $25,000 to $34,999 | 37 (11.2%) | 79 (70.5%) |
| $35,000 to $49,999 | 77 (23.3%) | 7 (6.2%) |
| $50,000 to $74,999 | 45 (13.6%) | 0 (0.0%) |
| $75,000 to $99,999 | 36 (10.9%) | 0 (0.0%) |
| $100,000 to $149,999 | 14 (4.2%) | 6 (5.4%) |
| $150,000 or more | 51 (15.4%) | 0 (0.0%) |
| Total | 331 (100.0%) | 112 (100.0%) |
Monthly Housing Cost Tiers in Sand Springs
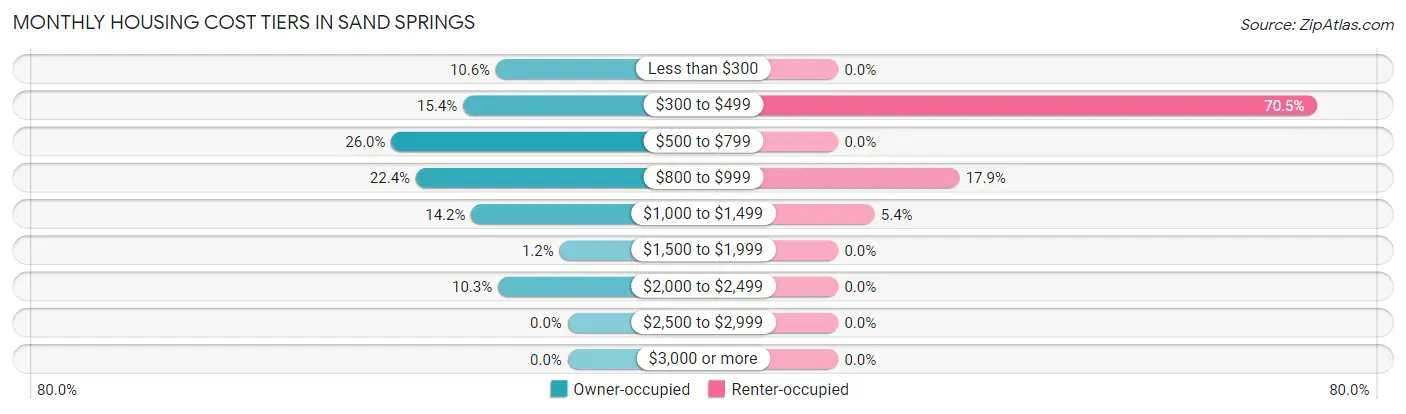
| Monthly Cost | Owner-occupied | Renter-occupied |
| Less than $300 | 35 (10.6%) | 0 (0.0%) |
| $300 to $499 | 51 (15.4%) | 79 (70.5%) |
| $500 to $799 | 86 (26.0%) | 0 (0.0%) |
| $800 to $999 | 74 (22.4%) | 20 (17.9%) |
| $1,000 to $1,499 | 47 (14.2%) | 6 (5.4%) |
| $1,500 to $1,999 | 4 (1.2%) | 0 (0.0%) |
| $2,000 to $2,499 | 34 (10.3%) | 0 (0.0%) |
| $2,500 to $2,999 | 0 (0.0%) | 0 (0.0%) |
| $3,000 or more | 0 (0.0%) | 0 (0.0%) |
| Total | 331 (100.0%) | 112 (100.0%) |
Physical Housing Characteristics in Sand Springs
Housing Structures in Sand Springs
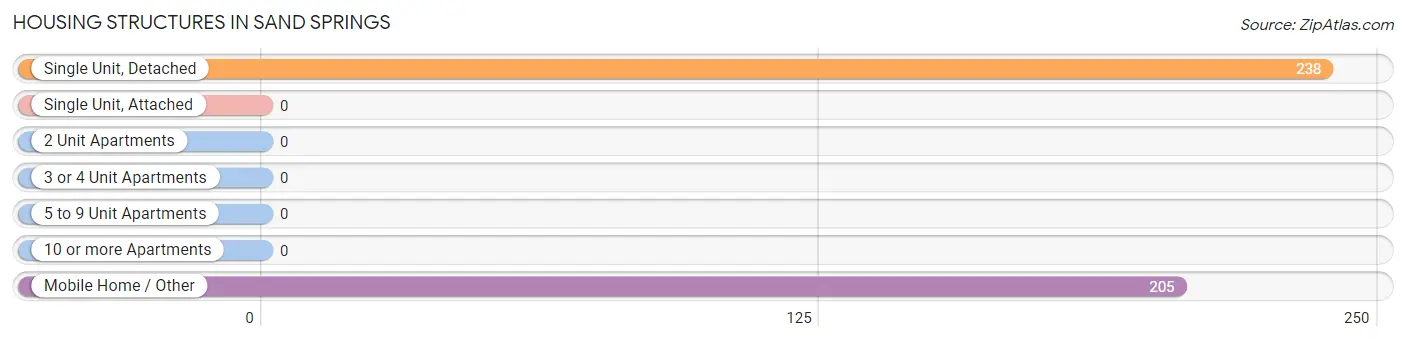
| Structure Type | # Housing Units | % Housing Units |
| Single Unit, Detached | 238 | 53.7% |
| Single Unit, Attached | 0 | 0.0% |
| 2 Unit Apartments | 0 | 0.0% |
| 3 or 4 Unit Apartments | 0 | 0.0% |
| 5 to 9 Unit Apartments | 0 | 0.0% |
| 10 or more Apartments | 0 | 0.0% |
| Mobile Home / Other | 205 | 46.3% |
| Total | 443 | 100.0% |
Housing Structures by Occupancy in Sand Springs
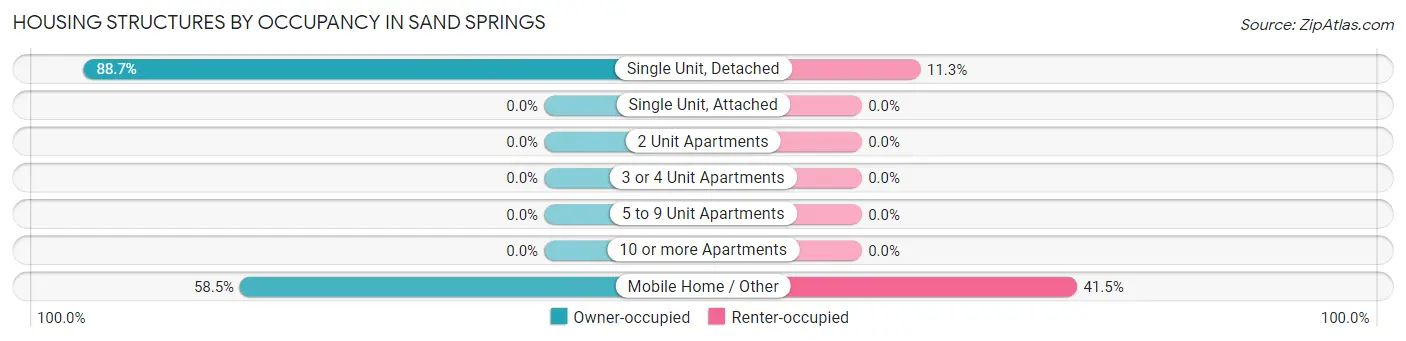
| Structure Type | Owner-occupied | Renter-occupied |
| Single Unit, Detached | 211 (88.7%) | 27 (11.3%) |
| Single Unit, Attached | 0 (0.0%) | 0 (0.0%) |
| 2 Unit Apartments | 0 (0.0%) | 0 (0.0%) |
| 3 or 4 Unit Apartments | 0 (0.0%) | 0 (0.0%) |
| 5 to 9 Unit Apartments | 0 (0.0%) | 0 (0.0%) |
| 10 or more Apartments | 0 (0.0%) | 0 (0.0%) |
| Mobile Home / Other | 120 (58.5%) | 85 (41.5%) |
| Total | 331 (74.7%) | 112 (25.3%) |
Housing Structures by Number of Rooms in Sand Springs
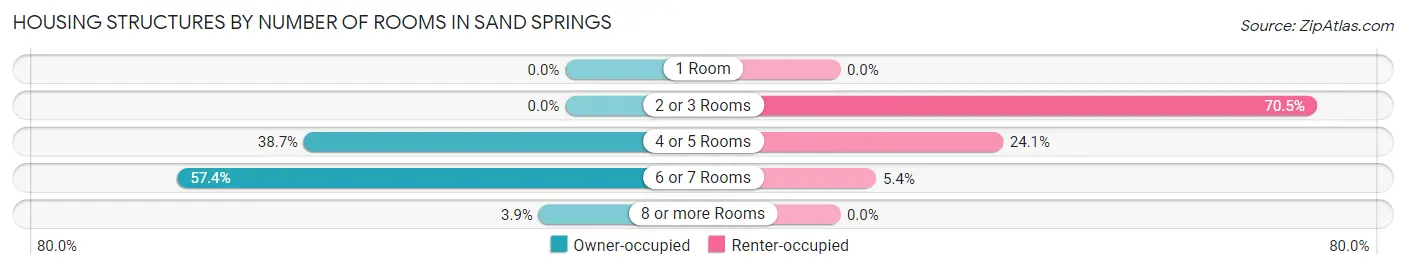
| Number of Rooms | Owner-occupied | Renter-occupied |
| 1 Room | 0 (0.0%) | 0 (0.0%) |
| 2 or 3 Rooms | 0 (0.0%) | 79 (70.5%) |
| 4 or 5 Rooms | 128 (38.7%) | 27 (24.1%) |
| 6 or 7 Rooms | 190 (57.4%) | 6 (5.4%) |
| 8 or more Rooms | 13 (3.9%) | 0 (0.0%) |
| Total | 331 (100.0%) | 112 (100.0%) |
Housing Structure by Heating Type in Sand Springs
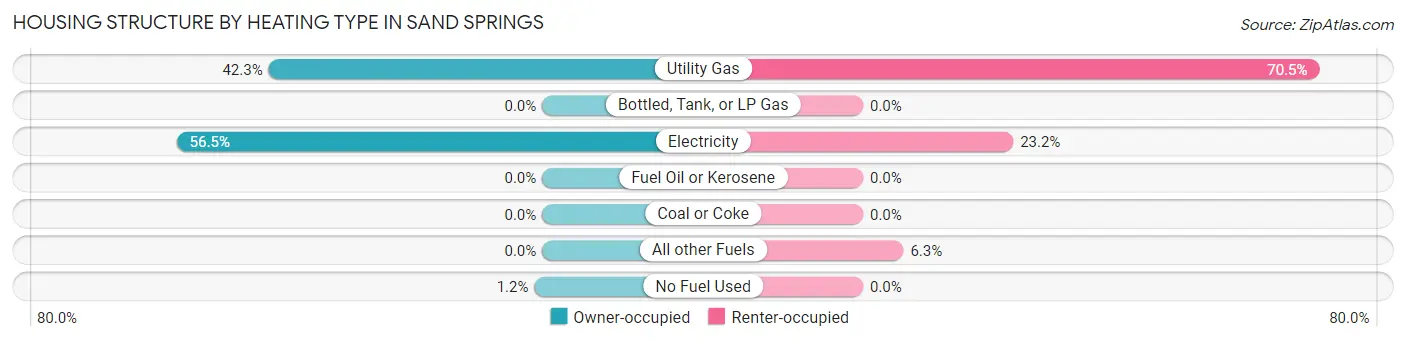
| Heating Type | Owner-occupied | Renter-occupied |
| Utility Gas | 140 (42.3%) | 79 (70.5%) |
| Bottled, Tank, or LP Gas | 0 (0.0%) | 0 (0.0%) |
| Electricity | 187 (56.5%) | 26 (23.2%) |
| Fuel Oil or Kerosene | 0 (0.0%) | 0 (0.0%) |
| Coal or Coke | 0 (0.0%) | 0 (0.0%) |
| All other Fuels | 0 (0.0%) | 7 (6.2%) |
| No Fuel Used | 4 (1.2%) | 0 (0.0%) |
| Total | 331 (100.0%) | 112 (100.0%) |
Household Vehicle Usage in Sand Springs
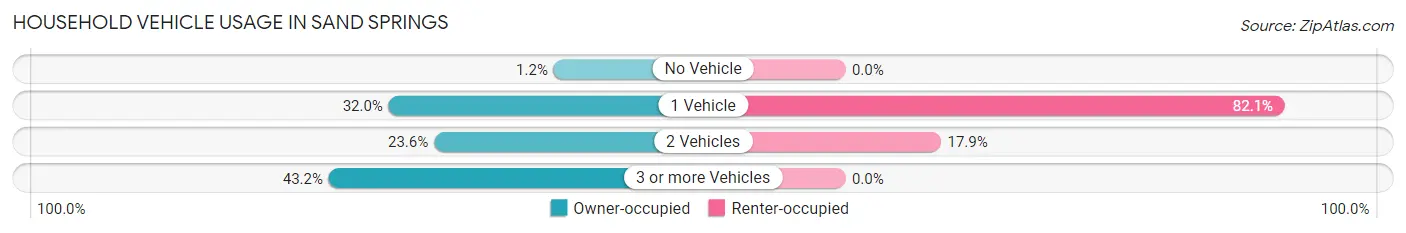
| Vehicles per Household | Owner-occupied | Renter-occupied |
| No Vehicle | 4 (1.2%) | 0 (0.0%) |
| 1 Vehicle | 106 (32.0%) | 92 (82.1%) |
| 2 Vehicles | 78 (23.6%) | 20 (17.9%) |
| 3 or more Vehicles | 143 (43.2%) | 0 (0.0%) |
| Total | 331 (100.0%) | 112 (100.0%) |
Real Estate & Mortgages in Sand Springs
Real Estate and Mortgage Overview in Sand Springs
| Characteristic | Without Mortgage | With Mortgage |
| Housing Units | 145 | 186 |
| Median Property Value | $58,000 | $107,800 |
| Median Household Income | $42,768 | $34 |
| Monthly Housing Costs | $486 | $0 |
| Real Estate Taxes | $767 | $0 |
Property Value by Mortgage Status in Sand Springs
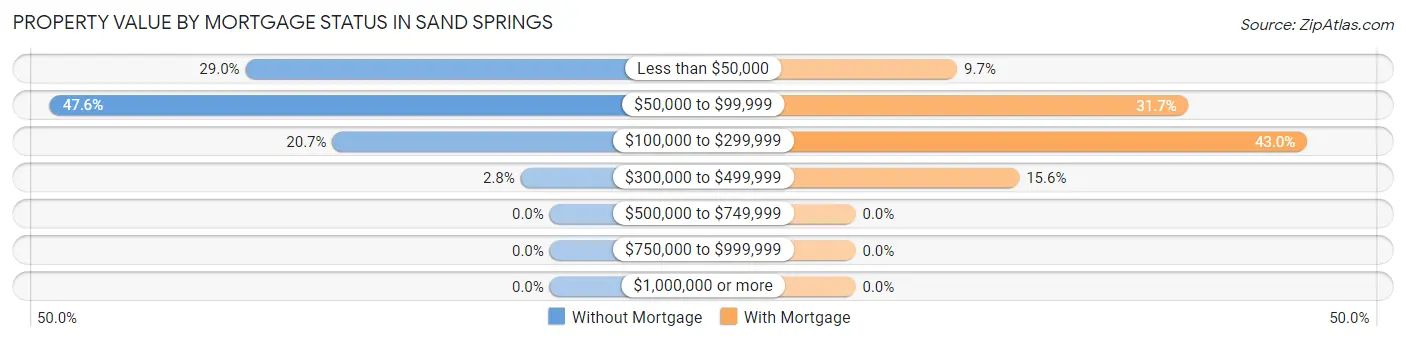
| Property Value | Without Mortgage | With Mortgage |
| Less than $50,000 | 42 (29.0%) | 18 (9.7%) |
| $50,000 to $99,999 | 69 (47.6%) | 59 (31.7%) |
| $100,000 to $299,999 | 30 (20.7%) | 80 (43.0%) |
| $300,000 to $499,999 | 4 (2.8%) | 29 (15.6%) |
| $500,000 to $749,999 | 0 (0.0%) | 0 (0.0%) |
| $750,000 to $999,999 | 0 (0.0%) | 0 (0.0%) |
| $1,000,000 or more | 0 (0.0%) | 0 (0.0%) |
| Total | 145 (100.0%) | 186 (100.0%) |
Household Income by Mortgage Status in Sand Springs
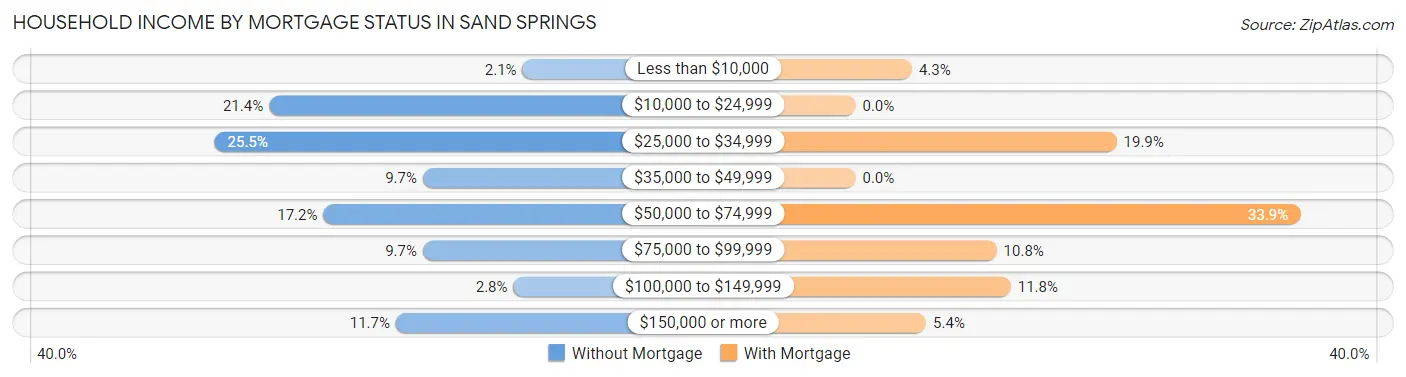
| Household Income | Without Mortgage | With Mortgage |
| Less than $10,000 | 3 (2.1%) | 8 (4.3%) |
| $10,000 to $24,999 | 31 (21.4%) | 0 (0.0%) |
| $25,000 to $34,999 | 37 (25.5%) | 37 (19.9%) |
| $35,000 to $49,999 | 14 (9.7%) | 0 (0.0%) |
| $50,000 to $74,999 | 25 (17.2%) | 63 (33.9%) |
| $75,000 to $99,999 | 14 (9.7%) | 20 (10.7%) |
| $100,000 to $149,999 | 4 (2.8%) | 22 (11.8%) |
| $150,000 or more | 17 (11.7%) | 10 (5.4%) |
| Total | 145 (100.0%) | 186 (100.0%) |
Property Value to Household Income Ratio in Sand Springs
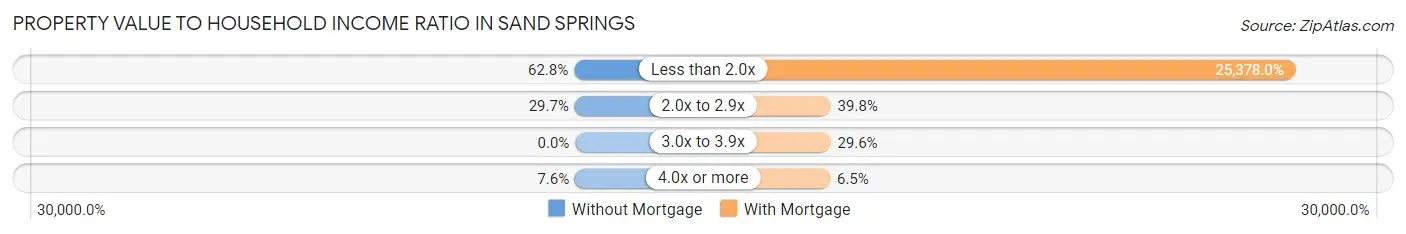
| Value-to-Income Ratio | Without Mortgage | With Mortgage |
| Less than 2.0x | 91 (62.8%) | 47,203 (25,378.0%) |
| 2.0x to 2.9x | 43 (29.7%) | 74 (39.8%) |
| 3.0x to 3.9x | 0 (0.0%) | 55 (29.6%) |
| 4.0x or more | 11 (7.6%) | 12 (6.5%) |
| Total | 145 (100.0%) | 186 (100.0%) |
Real Estate Taxes by Mortgage Status in Sand Springs
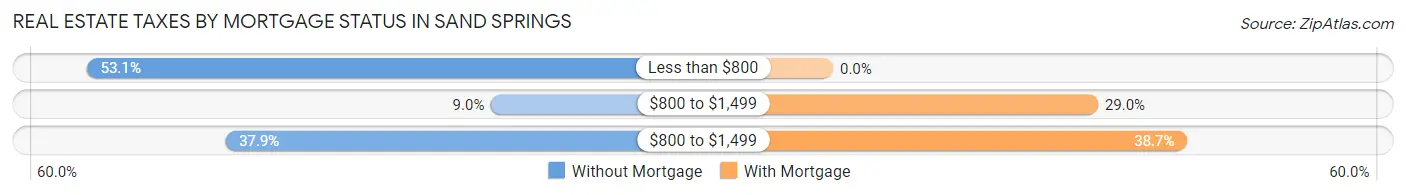
| Property Taxes | Without Mortgage | With Mortgage |
| Less than $800 | 77 (53.1%) | 0 (0.0%) |
| $800 to $1,499 | 13 (9.0%) | 54 (29.0%) |
| $800 to $1,499 | 55 (37.9%) | 72 (38.7%) |
| Total | 145 (100.0%) | 186 (100.0%) |
Health & Disability in Sand Springs
Health Insurance Coverage by Age in Sand Springs
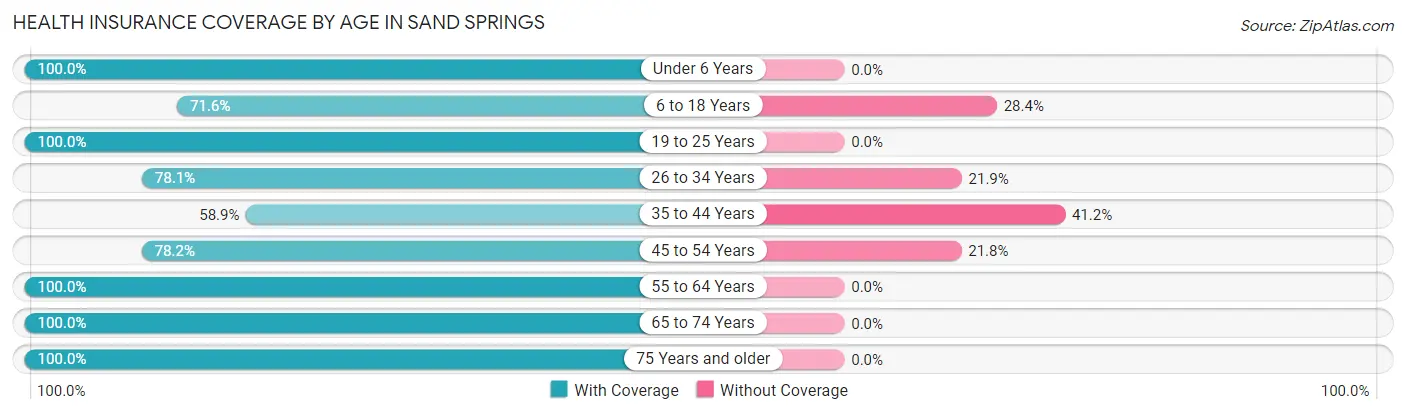
| Age Bracket | With Coverage | Without Coverage |
| Under 6 Years | 33 (100.0%) | 0 (0.0%) |
| 6 to 18 Years | 146 (71.6%) | 58 (28.4%) |
| 19 to 25 Years | 169 (100.0%) | 0 (0.0%) |
| 26 to 34 Years | 75 (78.1%) | 21 (21.9%) |
| 35 to 44 Years | 113 (58.9%) | 79 (41.1%) |
| 45 to 54 Years | 129 (78.2%) | 36 (21.8%) |
| 55 to 64 Years | 58 (100.0%) | 0 (0.0%) |
| 65 to 74 Years | 62 (100.0%) | 0 (0.0%) |
| 75 Years and older | 57 (100.0%) | 0 (0.0%) |
| Total | 842 (81.3%) | 194 (18.7%) |
Health Insurance Coverage by Citizenship Status in Sand Springs
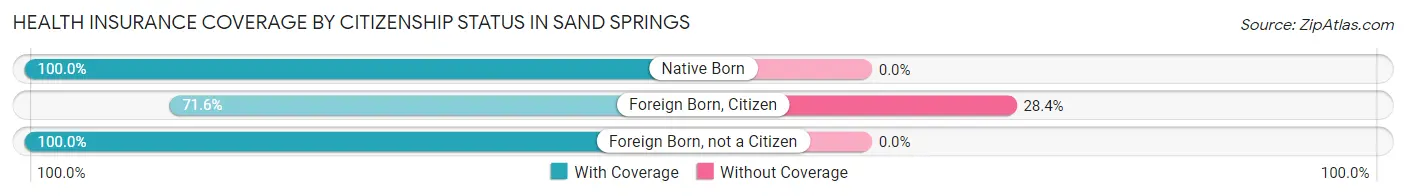
| Citizenship Status | With Coverage | Without Coverage |
| Native Born | 33 (100.0%) | 0 (0.0%) |
| Foreign Born, Citizen | 146 (71.6%) | 58 (28.4%) |
| Foreign Born, not a Citizen | 169 (100.0%) | 0 (0.0%) |
Health Insurance Coverage by Household Income in Sand Springs
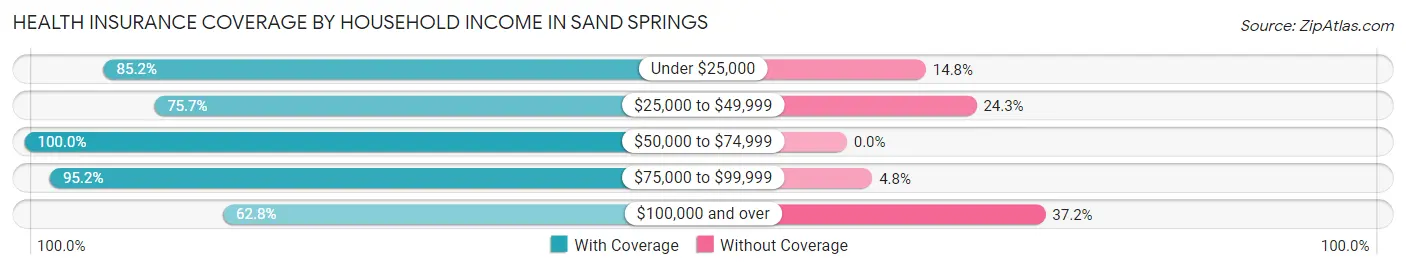
| Household Income | With Coverage | Without Coverage |
| Under $25,000 | 115 (85.2%) | 20 (14.8%) |
| $25,000 to $49,999 | 265 (75.7%) | 85 (24.3%) |
| $50,000 to $74,999 | 147 (100.0%) | 0 (0.0%) |
| $75,000 to $99,999 | 180 (95.2%) | 9 (4.8%) |
| $100,000 and over | 135 (62.8%) | 80 (37.2%) |
Public vs Private Health Insurance Coverage by Age in Sand Springs
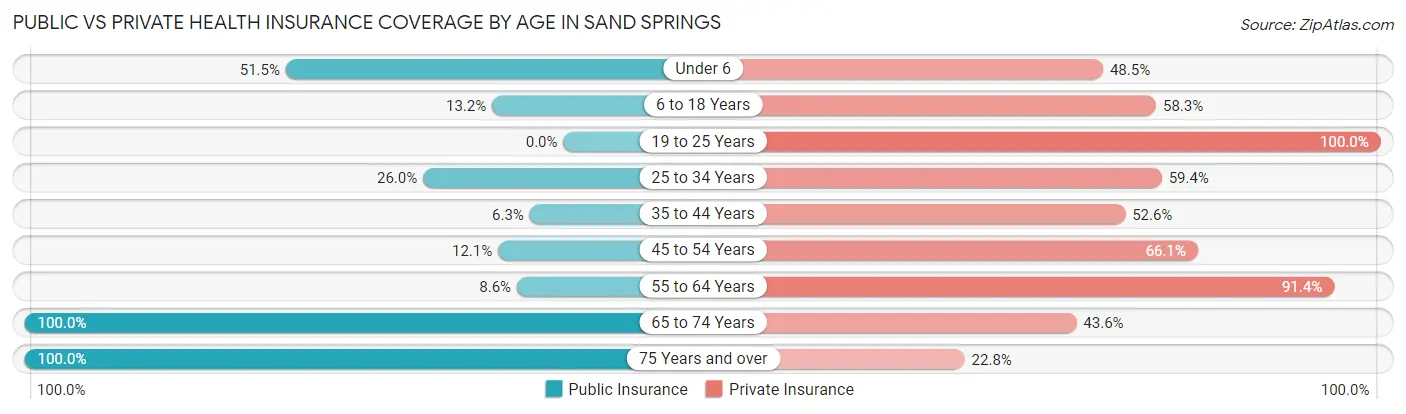
| Age Bracket | Public Insurance | Private Insurance |
| Under 6 | 17 (51.5%) | 16 (48.5%) |
| 6 to 18 Years | 27 (13.2%) | 119 (58.3%) |
| 19 to 25 Years | 0 (0.0%) | 169 (100.0%) |
| 25 to 34 Years | 25 (26.0%) | 57 (59.4%) |
| 35 to 44 Years | 12 (6.2%) | 101 (52.6%) |
| 45 to 54 Years | 20 (12.1%) | 109 (66.1%) |
| 55 to 64 Years | 5 (8.6%) | 53 (91.4%) |
| 65 to 74 Years | 62 (100.0%) | 27 (43.5%) |
| 75 Years and over | 57 (100.0%) | 13 (22.8%) |
| Total | 225 (21.7%) | 664 (64.1%) |
Disability Status by Sex by Age in Sand Springs
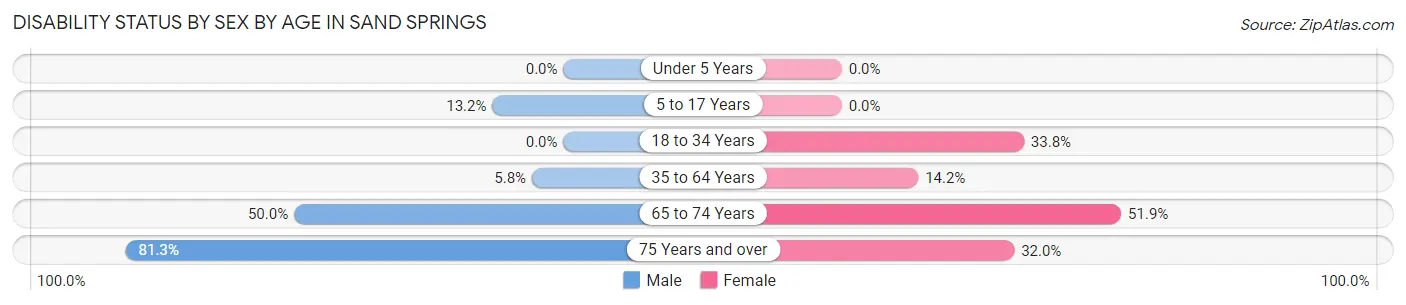
| Age Bracket | Male | Female |
| Under 5 Years | 0 (0.0%) | 0 (0.0%) |
| 5 to 17 Years | 12 (13.2%) | 0 (0.0%) |
| 18 to 34 Years | 0 (0.0%) | 24 (33.8%) |
| 35 to 64 Years | 16 (5.8%) | 20 (14.2%) |
| 65 to 74 Years | 4 (50.0%) | 28 (51.8%) |
| 75 Years and over | 26 (81.2%) | 8 (32.0%) |
Disability Class by Sex by Age in Sand Springs
Disability Class: Hearing Difficulty
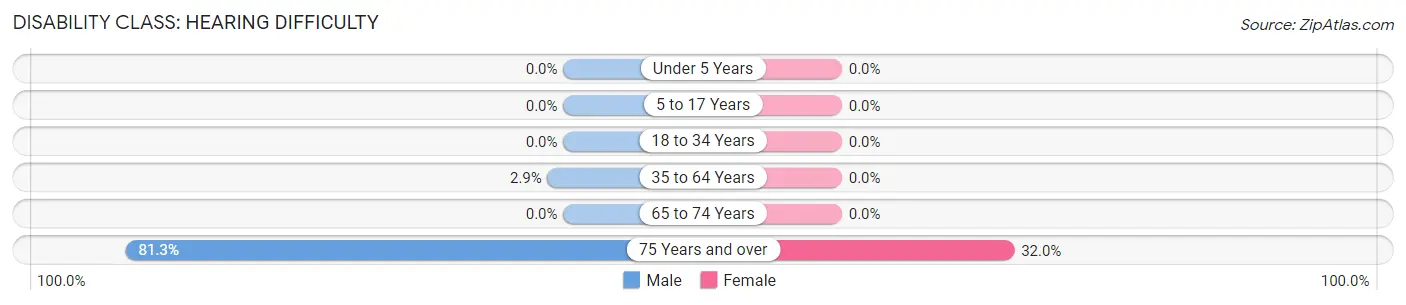
| Age Bracket | Male | Female |
| Under 5 Years | 0 (0.0%) | 0 (0.0%) |
| 5 to 17 Years | 0 (0.0%) | 0 (0.0%) |
| 18 to 34 Years | 0 (0.0%) | 0 (0.0%) |
| 35 to 64 Years | 8 (2.9%) | 0 (0.0%) |
| 65 to 74 Years | 0 (0.0%) | 0 (0.0%) |
| 75 Years and over | 26 (81.2%) | 8 (32.0%) |
Disability Class: Vision Difficulty
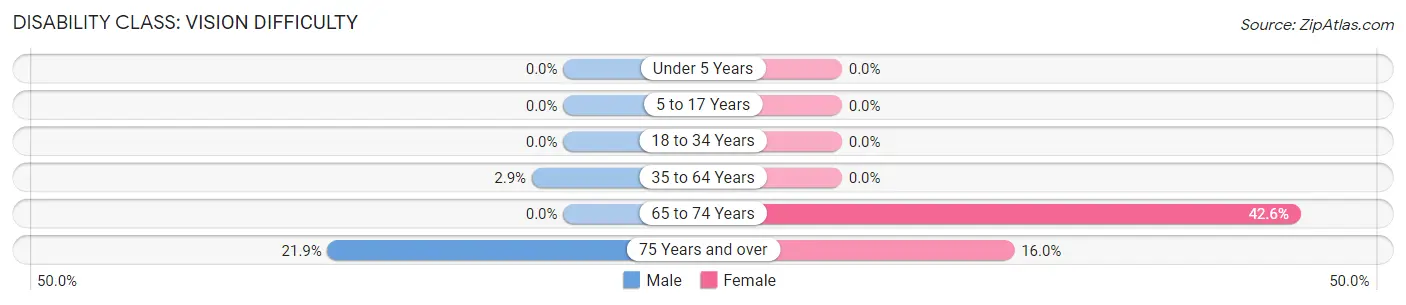
| Age Bracket | Male | Female |
| Under 5 Years | 0 (0.0%) | 0 (0.0%) |
| 5 to 17 Years | 0 (0.0%) | 0 (0.0%) |
| 18 to 34 Years | 0 (0.0%) | 0 (0.0%) |
| 35 to 64 Years | 8 (2.9%) | 0 (0.0%) |
| 65 to 74 Years | 0 (0.0%) | 23 (42.6%) |
| 75 Years and over | 7 (21.9%) | 4 (16.0%) |
Disability Class: Cognitive Difficulty
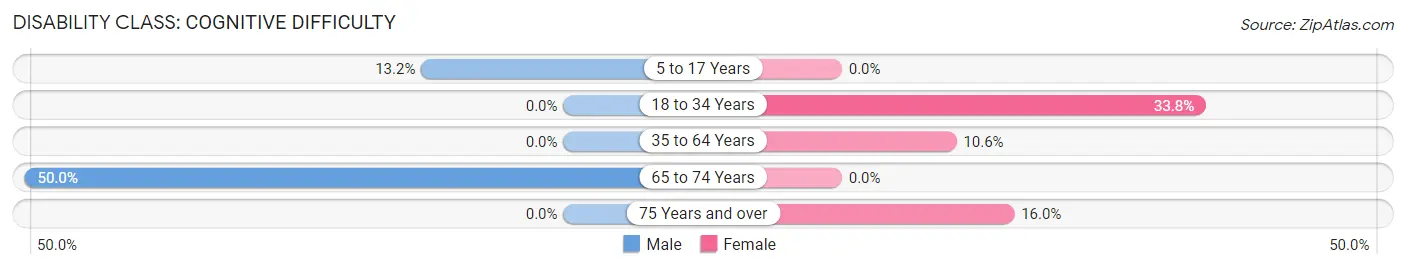
| Age Bracket | Male | Female |
| 5 to 17 Years | 12 (13.2%) | 0 (0.0%) |
| 18 to 34 Years | 0 (0.0%) | 24 (33.8%) |
| 35 to 64 Years | 0 (0.0%) | 15 (10.6%) |
| 65 to 74 Years | 4 (50.0%) | 0 (0.0%) |
| 75 Years and over | 0 (0.0%) | 4 (16.0%) |
Disability Class: Ambulatory Difficulty
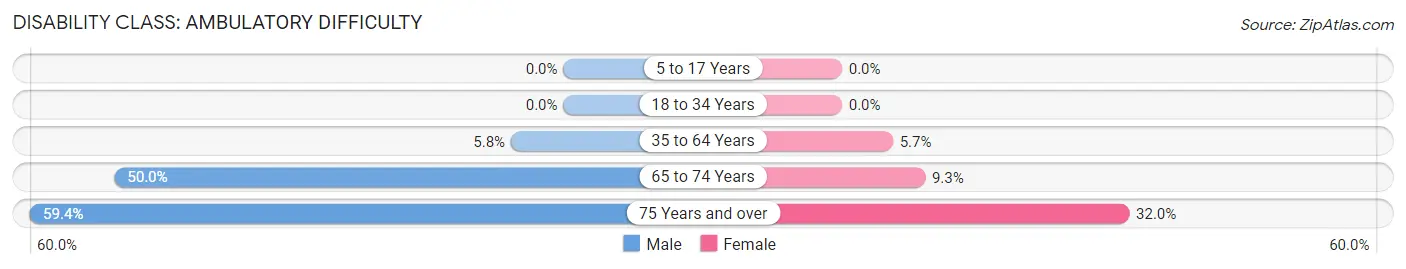
| Age Bracket | Male | Female |
| 5 to 17 Years | 0 (0.0%) | 0 (0.0%) |
| 18 to 34 Years | 0 (0.0%) | 0 (0.0%) |
| 35 to 64 Years | 16 (5.8%) | 8 (5.7%) |
| 65 to 74 Years | 4 (50.0%) | 5 (9.3%) |
| 75 Years and over | 19 (59.4%) | 8 (32.0%) |
Disability Class: Self-Care Difficulty
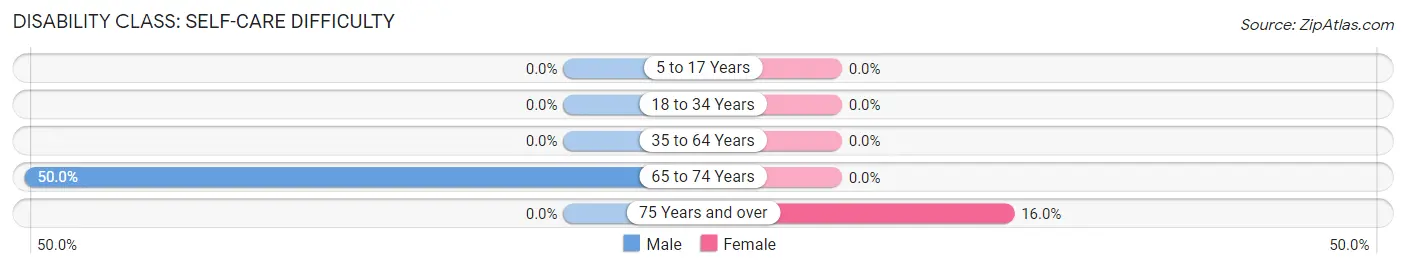
| Age Bracket | Male | Female |
| 5 to 17 Years | 0 (0.0%) | 0 (0.0%) |
| 18 to 34 Years | 0 (0.0%) | 0 (0.0%) |
| 35 to 64 Years | 0 (0.0%) | 0 (0.0%) |
| 65 to 74 Years | 4 (50.0%) | 0 (0.0%) |
| 75 Years and over | 0 (0.0%) | 4 (16.0%) |
Technology Access in Sand Springs
Computing Device Access in Sand Springs
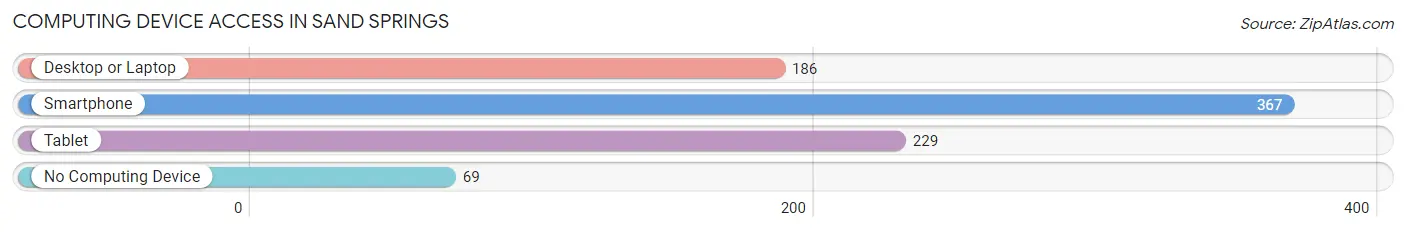
| Device Type | # Households | % Households |
| Desktop or Laptop | 186 | 42.0% |
| Smartphone | 367 | 82.8% |
| Tablet | 229 | 51.7% |
| No Computing Device | 69 | 15.6% |
| Total | 443 | 100.0% |
Internet Access in Sand Springs
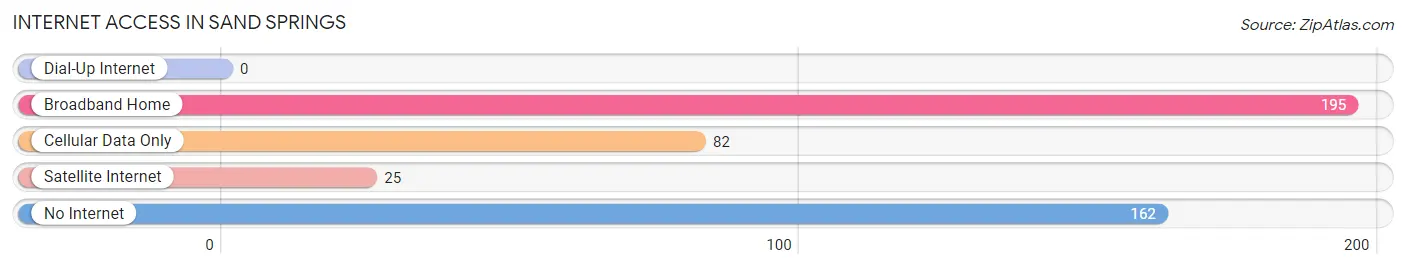
| Internet Type | # Households | % Households |
| Dial-Up Internet | 0 | 0.0% |
| Broadband Home | 195 | 44.0% |
| Cellular Data Only | 82 | 18.5% |
| Satellite Internet | 25 | 5.6% |
| No Internet | 162 | 36.6% |
| Total | 443 | 100.0% |
Sand Springs Summary
Sand Springs, Texas is a small town located in the western part of the state, about 25 miles from the Oklahoma border. It is situated in the heart of the Texas Panhandle, and is part of the Amarillo metropolitan area. The town has a population of just over 1,000 people, and is known for its rural charm and friendly atmosphere.
History
Sand Springs was founded in 1887 by a group of settlers from the nearby town of Amarillo. The settlers were looking for a place to settle and start a new life, and they chose the area around Sand Springs because of its abundance of natural resources. The town was named after the nearby sand dunes, which were created by the wind blowing sand from the nearby plains.
The town quickly grew, and by the early 1900s it had become a thriving community. The town was home to a variety of businesses, including a general store, a blacksmith shop, a livery stable, and a hotel. The town also had a school, a post office, and a church.
In the 1920s, the town began to decline as the nearby oil fields began to dry up. The population dropped from over 1,000 to just over 500 by the 1940s. However, the town was able to survive and eventually began to grow again in the 1950s.
Geography
Sand Springs is located in the western part of Texas, about 25 miles from the Oklahoma border. It is situated in the heart of the Texas Panhandle, and is part of the Amarillo metropolitan area. The town is located in the High Plains region of Texas, and is surrounded by flat, open plains. The town is located at an elevation of 3,000 feet, and the climate is semi-arid, with hot summers and cold winters.
Economy
The economy of Sand Springs is largely based on agriculture and oil production. The town is home to several large farms, which produce a variety of crops, including wheat, corn, and cotton. The town is also home to several oil wells, which produce a significant amount of oil for the region.
In addition to agriculture and oil production, the town is also home to several small businesses, including restaurants, retail stores, and service providers. The town is also home to a small airport, which serves the surrounding area.
Demographics
As of the 2010 census, the population of Sand Springs was 1,072. The racial makeup of the town was 94.3% White, 0.7% African American, 0.3% Native American, 0.2% Asian, 0.1% Pacific Islander, 2.7% from other races, and 1.9% from two or more races. Hispanic or Latino of any race were 5.2% of the population.
The median income for a household in the town was $37,500, and the median income for a family was $41,250. The per capita income for the town was $17,845. About 11.2% of families and 13.2% of the population were below the poverty line, including 16.2% of those under age 18 and 8.3% of those age 65 or over.
Conclusion
Sand Springs, Texas is a small town located in the western part of the state, about 25 miles from the Oklahoma border. It is situated in the heart of the Texas Panhandle, and is part of the Amarillo metropolitan area. The town has a population of just over 1,000 people, and is known for its rural charm and friendly atmosphere. The economy of the town is largely based on agriculture and oil production, and the town is home to several small businesses. The population of the town is mostly white, with a small percentage of African Americans, Native Americans, Asians, and Pacific Islanders. The median income for a household in the town is $37,500, and the per capita income is $17,845. Sand Springs is a small town with a rich history and a bright future.
Common Questions
What is Per Capita Income in Sand Springs?
Per Capita income in Sand Springs is $28,093.
What is the Median Family Income in Sand Springs?
Median Family Income in Sand Springs is $54,167.
What is the Median Household income in Sand Springs?
Median Household Income in Sand Springs is $43,125.
What is Income or Wage Gap in Sand Springs?
Income or Wage Gap in Sand Springs is 23.3%.
Women in Sand Springs earn 76.7 cents for every dollar earned by a man.
What is Inequality or Gini Index in Sand Springs?
Inequality or Gini Index in Sand Springs is 0.44.
What is the Total Population of Sand Springs?
Total Population of Sand Springs is 1,036.
What is the Total Male Population of Sand Springs?
Total Male Population of Sand Springs is 622.
What is the Total Female Population of Sand Springs?
Total Female Population of Sand Springs is 414.
What is the Ratio of Males per 100 Females in Sand Springs?
There are 150.24 Males per 100 Females in Sand Springs.
What is the Ratio of Females per 100 Males in Sand Springs?
There are 66.56 Females per 100 Males in Sand Springs.
What is the Median Population Age in Sand Springs?
Median Population Age in Sand Springs is 38.6 Years.
What is the Average Family Size in Sand Springs
Average Family Size in Sand Springs is 3.0 People.
What is the Average Household Size in Sand Springs
Average Household Size in Sand Springs is 2.3 People.
How Large is the Labor Force in Sand Springs?
There are 599 People in the Labor Forcein in Sand Springs.
What is the Percentage of People in the Labor Force in Sand Springs?
69.8% of People are in the Labor Force in Sand Springs.
What is the Unemployment Rate in Sand Springs?
Unemployment Rate in Sand Springs is 1.8%.