Zip Codes with the Highest Poverty Level Among Children Under the Age of 5 in Tennessee
RELATED REPORTS & OPTIONS
Highest Poverty | Child 0-5
Tennessee
Compare Zip Codes
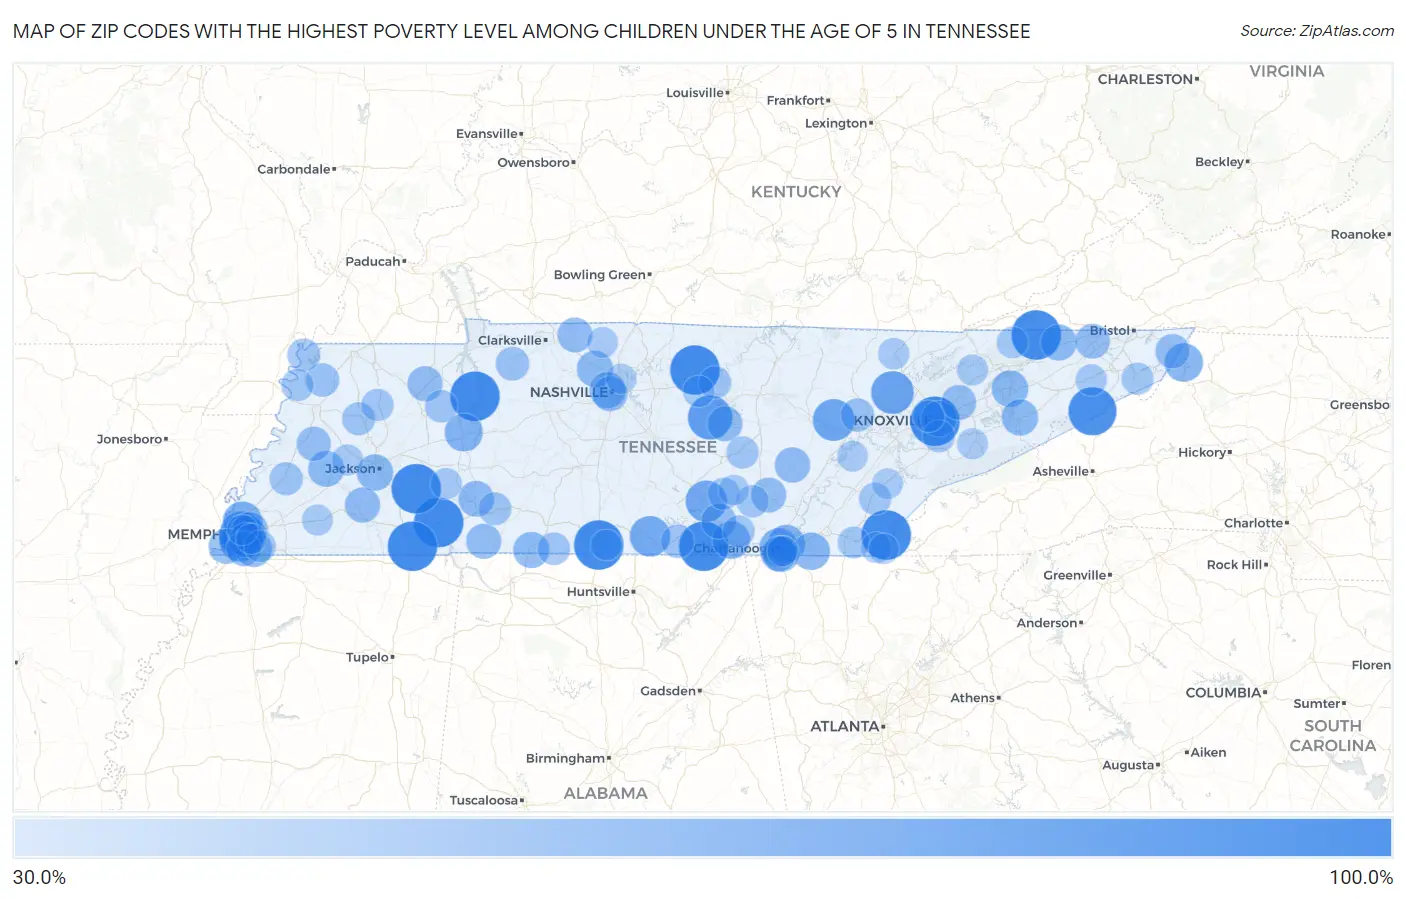
Map of Zip Codes with the Highest Poverty Level Among Children Under the Age of 5 in Tennessee
30.0%
100.0%
Zip Codes with the Highest Poverty Level Among Children Under the Age of 5 in Tennessee
| Zip Code | Child Poverty | vs State | vs National | |
| 1. | 37916 | 100.0% | 21.4%(+78.6)#1 | 18.1%(+81.9)#1 |
| 2. | 37765 | 100.0% | 21.4%(+78.6)#2 | 18.1%(+81.9)#150 |
| 3. | 38327 | 100.0% | 21.4%(+78.6)#3 | 18.1%(+81.9)#211 |
| 4. | 38347 | 100.0% | 21.4%(+78.6)#4 | 18.1%(+81.9)#218 |
| 5. | 37333 | 100.0% | 21.4%(+78.6)#5 | 18.1%(+81.9)#246 |
| 6. | 37151 | 100.0% | 21.4%(+78.6)#6 | 18.1%(+81.9)#260 |
| 7. | 38339 | 100.0% | 21.4%(+78.6)#7 | 18.1%(+81.9)#267 |
| 8. | 37376 | 100.0% | 21.4%(+78.6)#8 | 18.1%(+81.9)#334 |
| 9. | 38333 | 100.0% | 21.4%(+78.6)#9 | 18.1%(+81.9)#440 |
| 10. | 38455 | 100.0% | 21.4%(+78.6)#10 | 18.1%(+81.9)#457 |
| 11. | 37657 | 95.1% | 21.4%(+73.7)#11 | 18.1%(+77.0)#580 |
| 12. | 37059 | 82.7% | 21.4%(+61.3)#12 | 18.1%(+64.6)#753 |
| 13. | 37710 | 77.8% | 21.4%(+56.4)#13 | 18.1%(+59.7)#875 |
| 14. | 38105 | 76.4% | 21.4%(+55.0)#14 | 18.1%(+58.4)#914 |
| 15. | 37723 | 75.0% | 21.4%(+53.6)#15 | 18.1%(+56.9)#957 |
| 16. | 37342 | 72.9% | 21.4%(+51.5)#16 | 18.1%(+54.8)#1,053 |
| 17. | 38126 | 72.4% | 21.4%(+51.0)#17 | 18.1%(+54.3)#1,070 |
| 18. | 38106 | 71.4% | 21.4%(+50.0)#18 | 18.1%(+53.4)#1,097 |
| 19. | 37348 | 70.5% | 21.4%(+49.1)#19 | 18.1%(+52.5)#1,132 |
| 20. | 38127 | 66.9% | 21.4%(+45.5)#20 | 18.1%(+48.8)#1,274 |
| 21. | 37402 | 64.5% | 21.4%(+43.1)#21 | 18.1%(+46.4)#1,412 |
| 22. | 37691 | 64.4% | 21.4%(+43.0)#22 | 18.1%(+46.3)#1,417 |
| 23. | 38341 | 62.5% | 21.4%(+41.1)#23 | 18.1%(+44.4)#1,522 |
| 24. | 37380 | 62.1% | 21.4%(+40.7)#24 | 18.1%(+44.0)#1,553 |
| 25. | 37406 | 61.6% | 21.4%(+40.2)#25 | 18.1%(+43.5)#1,585 |
| 26. | 37302 | 60.8% | 21.4%(+39.5)#26 | 18.1%(+42.8)#1,633 |
| 27. | 37813 | 58.0% | 21.4%(+36.6)#27 | 18.1%(+40.0)#1,825 |
| 28. | 38118 | 57.6% | 21.4%(+36.3)#28 | 18.1%(+39.6)#1,854 |
| 29. | 38301 | 57.5% | 21.4%(+36.1)#29 | 18.1%(+39.5)#1,861 |
| 30. | 37407 | 57.4% | 21.4%(+36.0)#30 | 18.1%(+39.3)#1,871 |
| 31. | 37821 | 57.0% | 21.4%(+35.6)#31 | 18.1%(+38.9)#1,905 |
| 32. | 38112 | 56.9% | 21.4%(+35.5)#32 | 18.1%(+38.8)#1,920 |
| 33. | 37080 | 56.8% | 21.4%(+35.4)#33 | 18.1%(+38.7)#1,924 |
| 34. | 37873 | 56.7% | 21.4%(+35.3)#34 | 18.1%(+38.6)#1,933 |
| 35. | 37208 | 56.6% | 21.4%(+35.2)#35 | 18.1%(+38.6)#1,936 |
| 36. | 38481 | 56.5% | 21.4%(+35.1)#36 | 18.1%(+38.5)#1,944 |
| 37. | 38012 | 56.4% | 21.4%(+35.1)#37 | 18.1%(+38.4)#1,953 |
| 38. | 38108 | 55.7% | 21.4%(+34.3)#38 | 18.1%(+37.6)#2,014 |
| 39. | 38425 | 55.6% | 21.4%(+34.2)#39 | 18.1%(+37.5)#2,021 |
| 40. | 37915 | 55.5% | 21.4%(+34.1)#40 | 18.1%(+37.4)#2,048 |
| 41. | 37367 | 54.4% | 21.4%(+33.0)#41 | 18.1%(+36.4)#2,111 |
| 42. | 37410 | 53.9% | 21.4%(+32.5)#42 | 18.1%(+35.8)#2,151 |
| 43. | 38381 | 53.8% | 21.4%(+32.4)#43 | 18.1%(+35.7)#2,163 |
| 44. | 38109 | 53.7% | 21.4%(+32.3)#44 | 18.1%(+35.6)#2,177 |
| 45. | 37203 | 53.6% | 21.4%(+32.2)#45 | 18.1%(+35.5)#2,183 |
| 46. | 37356 | 53.5% | 21.4%(+32.1)#46 | 18.1%(+35.4)#2,192 |
| 47. | 37166 | 53.3% | 21.4%(+32.0)#47 | 18.1%(+35.3)#2,207 |
| 48. | 38231 | 53.3% | 21.4%(+31.9)#48 | 18.1%(+35.3)#2,215 |
| 49. | 38471 | 53.3% | 21.4%(+31.9)#49 | 18.1%(+35.3)#2,226 |
| 50. | 37327 | 53.0% | 21.4%(+31.6)#50 | 18.1%(+35.0)#2,247 |
| 51. | 37806 | 52.8% | 21.4%(+31.4)#51 | 18.1%(+34.7)#2,270 |
| 52. | 37010 | 52.7% | 21.4%(+31.3)#52 | 18.1%(+34.6)#2,280 |
| 53. | 37660 | 52.3% | 21.4%(+31.0)#53 | 18.1%(+34.3)#2,316 |
| 54. | 38114 | 52.3% | 21.4%(+30.9)#54 | 18.1%(+34.2)#2,323 |
| 55. | 38116 | 52.1% | 21.4%(+30.7)#55 | 18.1%(+34.0)#2,335 |
| 56. | 37683 | 51.2% | 21.4%(+29.8)#56 | 18.1%(+33.1)#2,410 |
| 57. | 38037 | 50.9% | 21.4%(+29.5)#57 | 18.1%(+32.8)#2,435 |
| 58. | 37050 | 48.6% | 21.4%(+27.2)#58 | 18.1%(+30.5)#2,742 |
| 59. | 38240 | 48.3% | 21.4%(+26.9)#59 | 18.1%(+30.3)#2,781 |
| 60. | 37829 | 47.6% | 21.4%(+26.2)#60 | 18.1%(+29.6)#2,856 |
| 61. | 37306 | 47.4% | 21.4%(+26.0)#61 | 18.1%(+29.3)#2,880 |
| 62. | 38019 | 47.2% | 21.4%(+25.8)#62 | 18.1%(+29.2)#2,892 |
| 63. | 38382 | 46.9% | 21.4%(+25.5)#63 | 18.1%(+28.8)#2,929 |
| 64. | 38079 | 46.3% | 21.4%(+24.9)#64 | 18.1%(+28.2)#3,004 |
| 65. | 38485 | 46.2% | 21.4%(+24.8)#65 | 18.1%(+28.2)#3,014 |
| 66. | 38457 | 45.5% | 21.4%(+24.1)#66 | 18.1%(+27.4)#3,116 |
| 67. | 38317 | 45.2% | 21.4%(+23.8)#67 | 18.1%(+27.1)#3,152 |
| 68. | 38560 | 45.2% | 21.4%(+23.8)#68 | 18.1%(+27.1)#3,161 |
| 69. | 38080 | 44.6% | 21.4%(+23.2)#69 | 18.1%(+26.5)#3,237 |
| 70. | 38581 | 44.5% | 21.4%(+23.1)#70 | 18.1%(+26.4)#3,249 |
| 71. | 37365 | 44.4% | 21.4%(+23.1)#71 | 18.1%(+26.4)#3,259 |
| 72. | 38316 | 44.4% | 21.4%(+23.0)#72 | 18.1%(+26.3)#3,286 |
| 73. | 37853 | 44.2% | 21.4%(+22.8)#73 | 18.1%(+26.2)#3,306 |
| 74. | 37329 | 44.2% | 21.4%(+22.8)#74 | 18.1%(+26.1)#3,315 |
| 75. | 37658 | 43.6% | 21.4%(+22.2)#75 | 18.1%(+25.5)#3,397 |
| 76. | 37301 | 43.5% | 21.4%(+22.2)#76 | 18.1%(+25.5)#3,403 |
| 77. | 37361 | 43.3% | 21.4%(+21.9)#77 | 18.1%(+25.3)#3,432 |
| 78. | 37374 | 43.1% | 21.4%(+21.7)#78 | 18.1%(+25.0)#3,467 |
| 79. | 38115 | 42.9% | 21.4%(+21.5)#79 | 18.1%(+24.8)#3,522 |
| 80. | 37921 | 42.6% | 21.4%(+21.2)#80 | 18.1%(+24.5)#3,557 |
| 81. | 38547 | 42.1% | 21.4%(+20.7)#81 | 18.1%(+24.0)#3,639 |
| 82. | 37869 | 41.9% | 21.4%(+20.5)#82 | 18.1%(+23.9)#3,669 |
| 83. | 37690 | 41.8% | 21.4%(+20.4)#83 | 18.1%(+23.7)#3,687 |
| 84. | 38374 | 41.5% | 21.4%(+20.1)#84 | 18.1%(+23.4)#3,745 |
| 85. | 37847 | 41.3% | 21.4%(+19.9)#85 | 18.1%(+23.2)#3,786 |
| 86. | 38006 | 40.7% | 21.4%(+19.3)#86 | 18.1%(+22.7)#3,889 |
| 87. | 37888 | 40.4% | 21.4%(+19.0)#87 | 18.1%(+22.3)#3,950 |
| 88. | 38068 | 40.2% | 21.4%(+18.8)#88 | 18.1%(+22.1)#3,981 |
| 89. | 37172 | 40.0% | 21.4%(+18.7)#89 | 18.1%(+22.0)#4,000 |
| 90. | 38449 | 39.8% | 21.4%(+18.4)#90 | 18.1%(+21.8)#4,062 |
| 91. | 37862 | 39.8% | 21.4%(+18.4)#91 | 18.1%(+21.7)#4,064 |
| 92. | 37354 | 39.7% | 21.4%(+18.3)#92 | 18.1%(+21.7)#4,080 |
| 93. | 37317 | 39.5% | 21.4%(+18.2)#93 | 18.1%(+21.5)#4,112 |
| 94. | 37880 | 39.5% | 21.4%(+18.1)#94 | 18.1%(+21.4)#4,121 |
| 95. | 38107 | 38.9% | 21.4%(+17.5)#95 | 18.1%(+20.9)#4,221 |
| 96. | 37305 | 38.6% | 21.4%(+17.2)#96 | 18.1%(+20.6)#4,278 |
| 97. | 37326 | 38.5% | 21.4%(+17.1)#97 | 18.1%(+20.4)#4,318 |
| 98. | 37404 | 38.4% | 21.4%(+17.0)#98 | 18.1%(+20.4)#4,322 |
| 99. | 37115 | 38.3% | 21.4%(+17.0)#99 | 18.1%(+20.3)#4,337 |
| 100. | 38111 | 38.3% | 21.4%(+16.9)#100 | 18.1%(+20.3)#4,338 |
Common Questions
What are the Top 10 Zip Codes with the Highest Poverty Level Among Children Under the Age of 5 in Tennessee?
Top 10 Zip Codes with the Highest Poverty Level Among Children Under the Age of 5 in Tennessee are:
What zip code has the Highest Poverty Level Among Children Under the Age of 5 in Tennessee?
37916 has the Highest Poverty Level Among Children Under the Age of 5 in Tennessee with 100.0%.
What is the Poverty Level Among Children Under the Age of 5 in the State of Tennessee?
Poverty Level Among Children Under the Age of 5 in Tennessee is 21.4%.
What is the Poverty Level Among Children Under the Age of 5 in the United States?
Poverty Level Among Children Under the Age of 5 in the United States is 18.1%.