Zip Codes with the Highest Percentage of Population Employed in Food Preparation & Serving in South Dakota
RELATED REPORTS & OPTIONS
Food Preparation & Serving
South Dakota
Compare Zip Codes
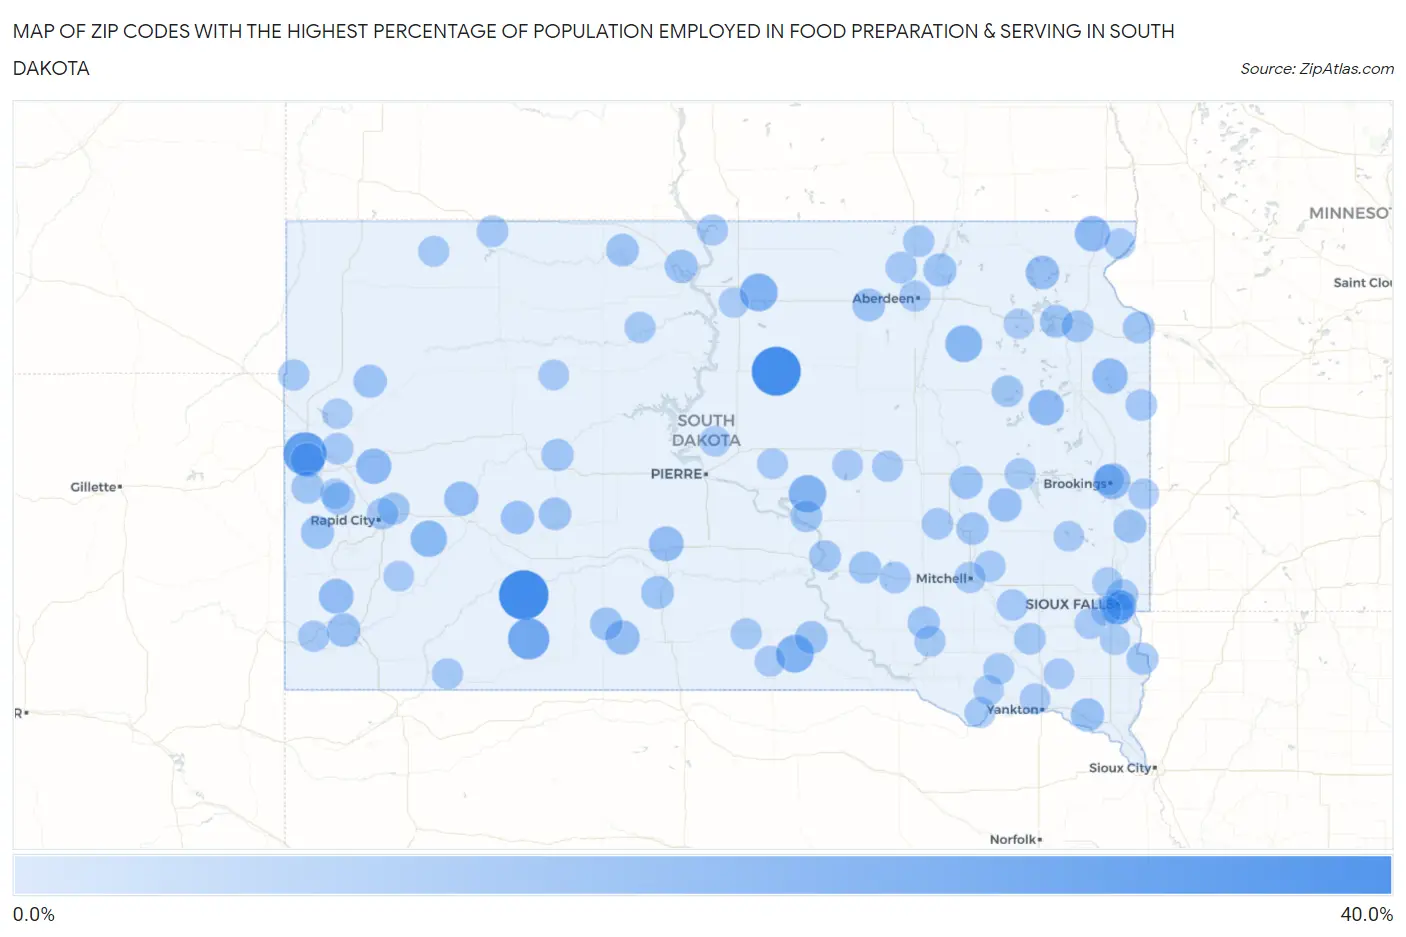
Map of Zip Codes with the Highest Percentage of Population Employed in Food Preparation & Serving in South Dakota
0.0%
40.0%
Zip Codes with the Highest Percentage of Population Employed in Food Preparation & Serving in South Dakota
| Zip Code | % Employed | vs State | vs National | |
| 1. | 57750 | 37.3% | 5.7%(+31.6)#1 | 5.3%(+32.0)#127 |
| 2. | 57455 | 36.4% | 5.7%(+30.7)#2 | 5.3%(+31.1)#134 |
| 3. | 57799 | 26.5% | 5.7%(+20.9)#3 | 5.3%(+21.3)#271 |
| 4. | 57714 | 23.6% | 5.7%(+18.0)#4 | 5.3%(+18.3)#359 |
| 5. | 57452 | 17.7% | 5.7%(+12.0)#5 | 5.3%(+12.4)#681 |
| 6. | 57529 | 17.6% | 5.7%(+12.0)#6 | 5.3%(+12.3)#693 |
| 7. | 57346 | 17.1% | 5.7%(+11.5)#7 | 5.3%(+11.9)#732 |
| 8. | 57434 | 16.1% | 5.7%(+10.4)#8 | 5.3%(+10.8)#855 |
| 9. | 57725 | 15.3% | 5.7%(+9.64)#9 | 5.3%(+10.0)#943 |
| 10. | 57007 | 14.6% | 5.7%(+8.90)#10 | 5.3%(+9.28)#1,046 |
| 11. | 57242 | 14.0% | 5.7%(+8.31)#11 | 5.3%(+8.69)#1,167 |
| 12. | 57265 | 13.9% | 5.7%(+8.23)#12 | 5.3%(+8.60)#1,186 |
| 13. | 57255 | 13.9% | 5.7%(+8.19)#13 | 5.3%(+8.57)#1,194 |
| 14. | 57785 | 13.7% | 5.7%(+8.08)#14 | 5.3%(+8.46)#1,222 |
| 15. | 57197 | 13.2% | 5.7%(+7.53)#15 | 5.3%(+7.90)#1,341 |
| 16. | 57773 | 12.9% | 5.7%(+7.24)#16 | 5.3%(+7.62)#1,418 |
| 17. | 57559 | 12.8% | 5.7%(+7.15)#17 | 5.3%(+7.52)#1,441 |
| 18. | 57791 | 12.2% | 5.7%(+6.56)#18 | 5.3%(+6.94)#1,592 |
| 19. | 57566 | 12.1% | 5.7%(+6.48)#19 | 5.3%(+6.86)#1,616 |
| 20. | 57783 | 11.8% | 5.7%(+6.14)#20 | 5.3%(+6.51)#1,736 |
| 21. | 57232 | 11.3% | 5.7%(+5.62)#21 | 5.3%(+6.00)#1,924 |
| 22. | 57747 | 11.0% | 5.7%(+5.29)#22 | 5.3%(+5.67)#2,078 |
| 23. | 57323 | 10.7% | 5.7%(+5.05)#23 | 5.3%(+5.43)#2,201 |
| 24. | 57069 | 10.6% | 5.7%(+4.95)#24 | 5.3%(+5.32)#2,260 |
| 25. | 57775 | 10.5% | 5.7%(+4.84)#25 | 5.3%(+5.21)#2,328 |
| 26. | 57658 | 10.2% | 5.7%(+4.51)#26 | 5.3%(+4.88)#2,504 |
| 27. | 57433 | 10.2% | 5.7%(+4.49)#27 | 5.3%(+4.87)#2,521 |
| 28. | 57760 | 10.1% | 5.7%(+4.49)#28 | 5.3%(+4.86)#2,522 |
| 29. | 57745 | 10.1% | 5.7%(+4.43)#29 | 5.3%(+4.80)#2,564 |
| 30. | 57579 | 9.9% | 5.7%(+4.22)#30 | 5.3%(+4.59)#2,730 |
| 31. | 57324 | 9.9% | 5.7%(+4.21)#31 | 5.3%(+4.59)#2,735 |
| 32. | 57451 | 9.8% | 5.7%(+4.14)#32 | 5.3%(+4.52)#2,796 |
| 33. | 57028 | 9.8% | 5.7%(+4.10)#33 | 5.3%(+4.47)#2,834 |
| 34. | 57533 | 9.6% | 5.7%(+3.96)#34 | 5.3%(+4.33)#2,953 |
| 35. | 57273 | 9.6% | 5.7%(+3.93)#35 | 5.3%(+4.31)#2,976 |
| 36. | 57567 | 9.3% | 5.7%(+3.67)#36 | 5.3%(+4.05)#3,207 |
| 37. | 57621 | 9.3% | 5.7%(+3.64)#37 | 5.3%(+4.02)#3,236 |
| 38. | 57560 | 9.3% | 5.7%(+3.60)#38 | 5.3%(+3.97)#3,272 |
| 39. | 57759 | 9.1% | 5.7%(+3.43)#39 | 5.3%(+3.80)#3,431 |
| 40. | 57314 | 9.0% | 5.7%(+3.29)#40 | 5.3%(+3.67)#3,572 |
| 41. | 57553 | 8.8% | 5.7%(+3.13)#41 | 5.3%(+3.51)#3,739 |
| 42. | 57754 | 8.7% | 5.7%(+3.08)#42 | 5.3%(+3.45)#3,794 |
| 43. | 57328 | 8.7% | 5.7%(+3.03)#43 | 5.3%(+3.40)#3,867 |
| 44. | 57355 | 8.6% | 5.7%(+2.93)#44 | 5.3%(+3.31)#3,975 |
| 45. | 57325 | 8.3% | 5.7%(+2.68)#45 | 5.3%(+3.06)#4,245 |
| 46. | 57027 | 8.3% | 5.7%(+2.67)#46 | 5.3%(+3.05)#4,271 |
| 47. | 57266 | 8.3% | 5.7%(+2.64)#47 | 5.3%(+3.02)#4,317 |
| 48. | 57339 | 8.3% | 5.7%(+2.63)#48 | 5.3%(+3.00)#4,329 |
| 49. | 57706 | 8.2% | 5.7%(+2.57)#49 | 5.3%(+2.94)#4,397 |
| 50. | 57216 | 8.1% | 5.7%(+2.40)#50 | 5.3%(+2.78)#4,635 |
| 51. | 57225 | 8.0% | 5.7%(+2.38)#51 | 5.3%(+2.75)#4,675 |
| 52. | 57104 | 7.9% | 5.7%(+2.22)#52 | 5.3%(+2.60)#4,912 |
| 53. | 57029 | 7.9% | 5.7%(+2.22)#53 | 5.3%(+2.59)#4,917 |
| 54. | 57105 | 7.9% | 5.7%(+2.21)#54 | 5.3%(+2.58)#4,933 |
| 55. | 57481 | 7.9% | 5.7%(+2.20)#55 | 5.3%(+2.58)#4,940 |
| 56. | 57793 | 7.9% | 5.7%(+2.20)#56 | 5.3%(+2.57)#4,954 |
| 57. | 57237 | 7.8% | 5.7%(+2.14)#57 | 5.3%(+2.52)#5,042 |
| 58. | 57638 | 7.7% | 5.7%(+2.08)#58 | 5.3%(+2.45)#5,157 |
| 59. | 57383 | 7.7% | 5.7%(+2.03)#59 | 5.3%(+2.41)#5,214 |
| 60. | 57701 | 7.7% | 5.7%(+2.02)#60 | 5.3%(+2.40)#5,240 |
| 61. | 57385 | 7.5% | 5.7%(+1.86)#61 | 5.3%(+2.23)#5,520 |
| 62. | 57441 | 7.5% | 5.7%(+1.80)#62 | 5.3%(+2.18)#5,630 |
| 63. | 57735 | 7.3% | 5.7%(+1.65)#63 | 5.3%(+2.02)#5,907 |
| 64. | 57332 | 7.3% | 5.7%(+1.64)#64 | 5.3%(+2.01)#5,924 |
| 65. | 57717 | 7.2% | 5.7%(+1.59)#65 | 5.3%(+1.96)#6,031 |
| 66. | 57401 | 7.2% | 5.7%(+1.56)#66 | 5.3%(+1.94)#6,082 |
| 67. | 57231 | 7.2% | 5.7%(+1.51)#67 | 5.3%(+1.88)#6,195 |
| 68. | 57313 | 7.1% | 5.7%(+1.48)#68 | 5.3%(+1.86)#6,243 |
| 69. | 57340 | 7.1% | 5.7%(+1.48)#69 | 5.3%(+1.86)#6,253 |
| 70. | 57301 | 7.1% | 5.7%(+1.44)#70 | 5.3%(+1.81)#6,345 |
| 71. | 57661 | 7.0% | 5.7%(+1.38)#71 | 5.3%(+1.76)#6,454 |
| 72. | 57580 | 7.0% | 5.7%(+1.34)#72 | 5.3%(+1.72)#6,551 |
| 73. | 57059 | 6.9% | 5.7%(+1.24)#73 | 5.3%(+1.62)#6,814 |
| 74. | 57648 | 6.9% | 5.7%(+1.19)#74 | 5.3%(+1.57)#6,925 |
| 75. | 57770 | 6.9% | 5.7%(+1.19)#75 | 5.3%(+1.57)#6,934 |
| 76. | 57381 | 6.8% | 5.7%(+1.18)#76 | 5.3%(+1.55)#6,965 |
| 77. | 57062 | 6.7% | 5.7%(+1.07)#77 | 5.3%(+1.45)#7,253 |
| 78. | 57640 | 6.7% | 5.7%(+1.01)#78 | 5.3%(+1.38)#7,440 |
| 79. | 57362 | 6.6% | 5.7%(+0.904)#79 | 5.3%(+1.28)#7,686 |
| 80. | 57623 | 6.5% | 5.7%(+0.820)#80 | 5.3%(+1.20)#7,932 |
| 81. | 57744 | 6.4% | 5.7%(+0.697)#81 | 5.3%(+1.07)#8,249 |
| 82. | 57006 | 6.3% | 5.7%(+0.676)#82 | 5.3%(+1.05)#8,318 |
| 83. | 57528 | 6.3% | 5.7%(+0.606)#83 | 5.3%(+0.981)#8,520 |
| 84. | 57042 | 6.2% | 5.7%(+0.589)#84 | 5.3%(+0.964)#8,576 |
| 85. | 57536 | 6.2% | 5.7%(+0.589)#85 | 5.3%(+0.964)#8,587 |
| 86. | 57501 | 6.2% | 5.7%(+0.587)#86 | 5.3%(+0.963)#8,598 |
| 87. | 57078 | 6.2% | 5.7%(+0.536)#87 | 5.3%(+0.912)#8,734 |
| 88. | 57015 | 6.2% | 5.7%(+0.531)#88 | 5.3%(+0.907)#8,757 |
| 89. | 57026 | 6.1% | 5.7%(+0.488)#89 | 5.3%(+0.864)#8,881 |
| 90. | 57260 | 6.1% | 5.7%(+0.477)#90 | 5.3%(+0.853)#8,901 |
| 91. | 57037 | 6.1% | 5.7%(+0.405)#91 | 5.3%(+0.780)#9,121 |
| 92. | 57020 | 6.1% | 5.7%(+0.397)#92 | 5.3%(+0.772)#9,151 |
| 93. | 57472 | 6.0% | 5.7%(+0.334)#93 | 5.3%(+0.709)#9,358 |
| 94. | 57732 | 6.0% | 5.7%(+0.330)#94 | 5.3%(+0.706)#9,369 |
| 95. | 57103 | 6.0% | 5.7%(+0.311)#95 | 5.3%(+0.686)#9,437 |
| 96. | 57762 | 5.9% | 5.7%(+0.221)#96 | 5.3%(+0.596)#9,743 |
| 97. | 57106 | 5.9% | 5.7%(+0.192)#97 | 5.3%(+0.567)#9,854 |
| 98. | 57274 | 5.8% | 5.7%(+0.160)#98 | 5.3%(+0.536)#9,964 |
| 99. | 57066 | 5.8% | 5.7%(+0.111)#99 | 5.3%(+0.486)#10,112 |
| 100. | 57077 | 5.7% | 5.7%(+0.045)#100 | 5.3%(+0.420)#10,309 |
Common Questions
What are the Top 10 Zip Codes with the Highest Percentage of Population Employed in Food Preparation & Serving in South Dakota?
Top 10 Zip Codes with the Highest Percentage of Population Employed in Food Preparation & Serving in South Dakota are:
What zip code has the Highest Percentage of Population Employed in Food Preparation & Serving in South Dakota?
57750 has the Highest Percentage of Population Employed in Food Preparation & Serving in South Dakota with 37.3%.
What is the Percentage of Population Employed in Food Preparation & Serving in the State of South Dakota?
Percentage of Population Employed in Food Preparation & Serving in South Dakota is 5.7%.
What is the Percentage of Population Employed in Food Preparation & Serving in the United States?
Percentage of Population Employed in Food Preparation & Serving in the United States is 5.3%.