Morristown, SD Map & Demographics
Morristown Map
Morristown Overview
$29,211
PER CAPITA INCOME
$51,875
AVG FAMILY INCOME
$43,438
AVG HOUSEHOLD INCOME
0.37
INEQUALITY / GINI INDEX
65
TOTAL POPULATION
38
MALE POPULATION
27
FEMALE POPULATION
140.74
MALES / 100 FEMALES
71.05
FEMALES / 100 MALES
38.6
MEDIAN AGE
2.5
AVG FAMILY SIZE
1.7
AVG HOUSEHOLD SIZE
37
LABOR FORCE [ PEOPLE ]
72.5%
PERCENT IN LABOR FORCE
Morristown Zip Codes
Morristown Area Codes
Income in Morristown
Income Overview in Morristown
Per Capita Income in Morristown is $29,211, while median incomes of families and households are $51,875 and $43,438 respectively.
| Characteristic | Number | Measure |
| Per Capita Income | 65 | $29,211 |
| Median Family Income | 16 | $51,875 |
| Mean Family Income | 16 | $71,325 |
| Median Household Income | 39 | $43,438 |
| Mean Household Income | 39 | $51,472 |
| Income Deficit | 16 | $0 |
| Wage / Income Gap (%) | 65 | 0.00% |
| Wage / Income Gap ($) | 65 | 100.00¢ per $1 |
| Gini / Inequality Index | 65 | 0.37 |
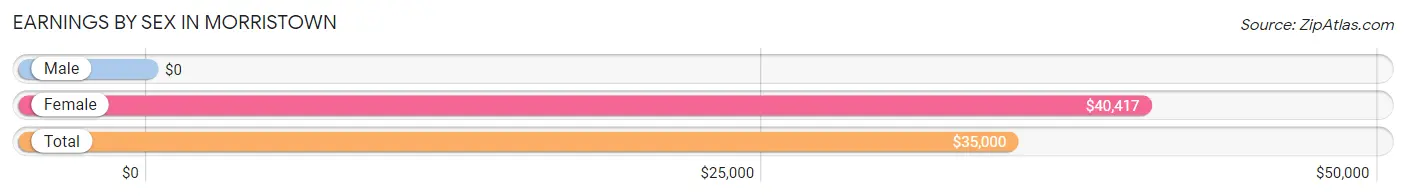
Earnings by Sex in Morristown
| Sex | Number | Average Earnings |
| Male | 23 (57.5%) | $0 |
| Female | 17 (42.5%) | $40,417 |
| Total | 40 (100.0%) | $35,000 |
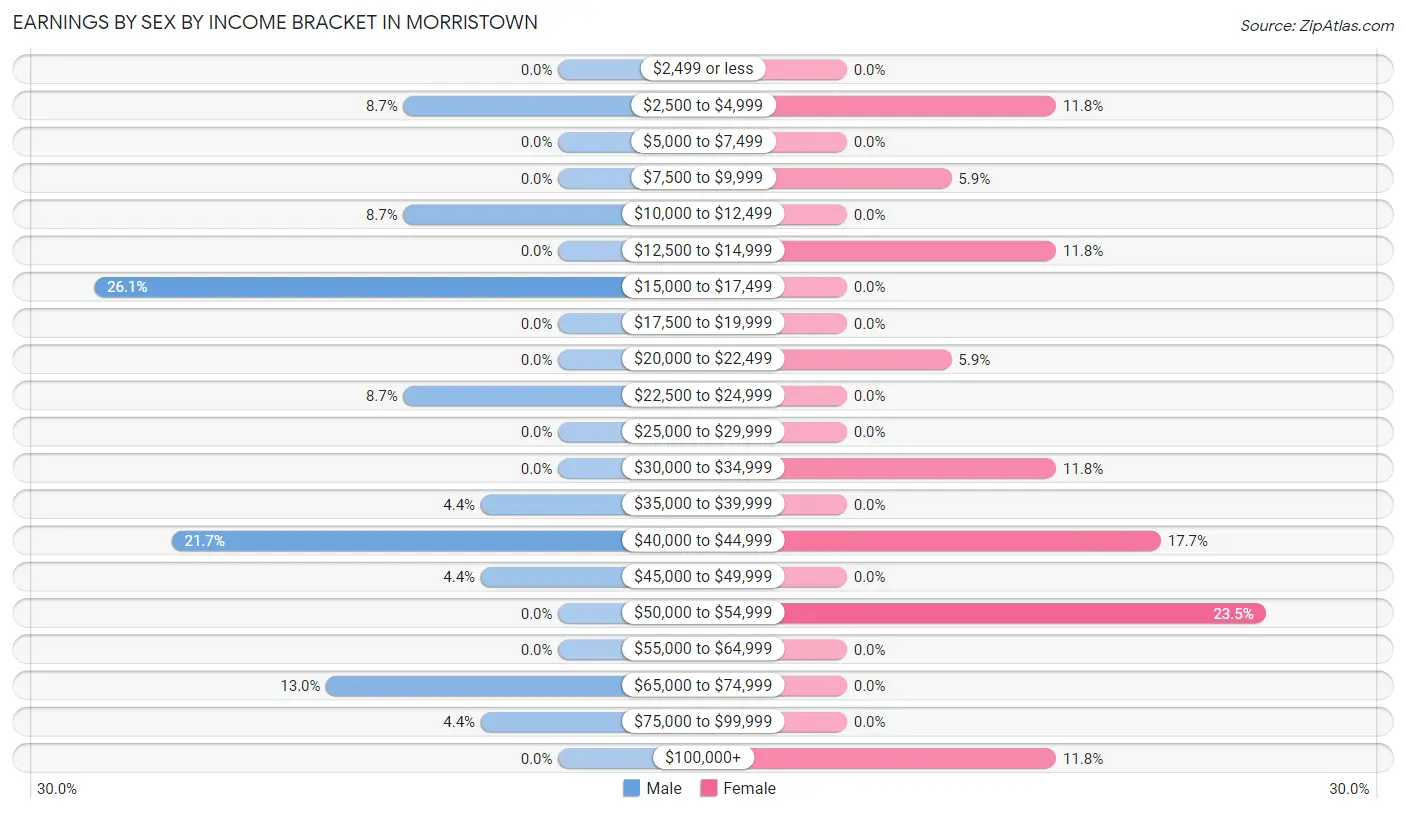
Earnings by Sex by Income Bracket in Morristown
The most common earnings brackets in Morristown are $15,000 to $17,499 for men (6 | 26.1%) and $50,000 to $54,999 for women (4 | 23.5%).
| Income | Male | Female |
| $2,499 or less | 0 (0.0%) | 0 (0.0%) |
| $2,500 to $4,999 | 2 (8.7%) | 2 (11.8%) |
| $5,000 to $7,499 | 0 (0.0%) | 0 (0.0%) |
| $7,500 to $9,999 | 0 (0.0%) | 1 (5.9%) |
| $10,000 to $12,499 | 2 (8.7%) | 0 (0.0%) |
| $12,500 to $14,999 | 0 (0.0%) | 2 (11.8%) |
| $15,000 to $17,499 | 6 (26.1%) | 0 (0.0%) |
| $17,500 to $19,999 | 0 (0.0%) | 0 (0.0%) |
| $20,000 to $22,499 | 0 (0.0%) | 1 (5.9%) |
| $22,500 to $24,999 | 2 (8.7%) | 0 (0.0%) |
| $25,000 to $29,999 | 0 (0.0%) | 0 (0.0%) |
| $30,000 to $34,999 | 0 (0.0%) | 2 (11.8%) |
| $35,000 to $39,999 | 1 (4.3%) | 0 (0.0%) |
| $40,000 to $44,999 | 5 (21.7%) | 3 (17.6%) |
| $45,000 to $49,999 | 1 (4.3%) | 0 (0.0%) |
| $50,000 to $54,999 | 0 (0.0%) | 4 (23.5%) |
| $55,000 to $64,999 | 0 (0.0%) | 0 (0.0%) |
| $65,000 to $74,999 | 3 (13.0%) | 0 (0.0%) |
| $75,000 to $99,999 | 1 (4.3%) | 0 (0.0%) |
| $100,000+ | 0 (0.0%) | 2 (11.8%) |
| Total | 23 (100.0%) | 17 (100.0%) |
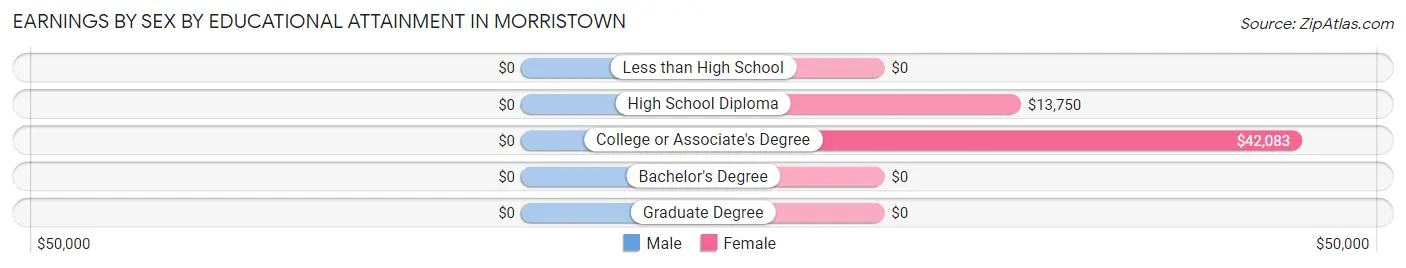
Earnings by Sex by Educational Attainment in Morristown
| Educational Attainment | Male Income | Female Income |
| Less than High School | - | - |
| High School Diploma | - | - |
| College or Associate's Degree | - | - |
| Bachelor's Degree | - | - |
| Graduate Degree | - | - |
| Total | $20,000 | $41,250 |
Family Income in Morristown
Family Income Brackets in Morristown
According to the Morristown family income data, there are 7 families falling into the $50,000 to $74,999 income range, which is the most common income bracket and makes up 43.8% of all families.
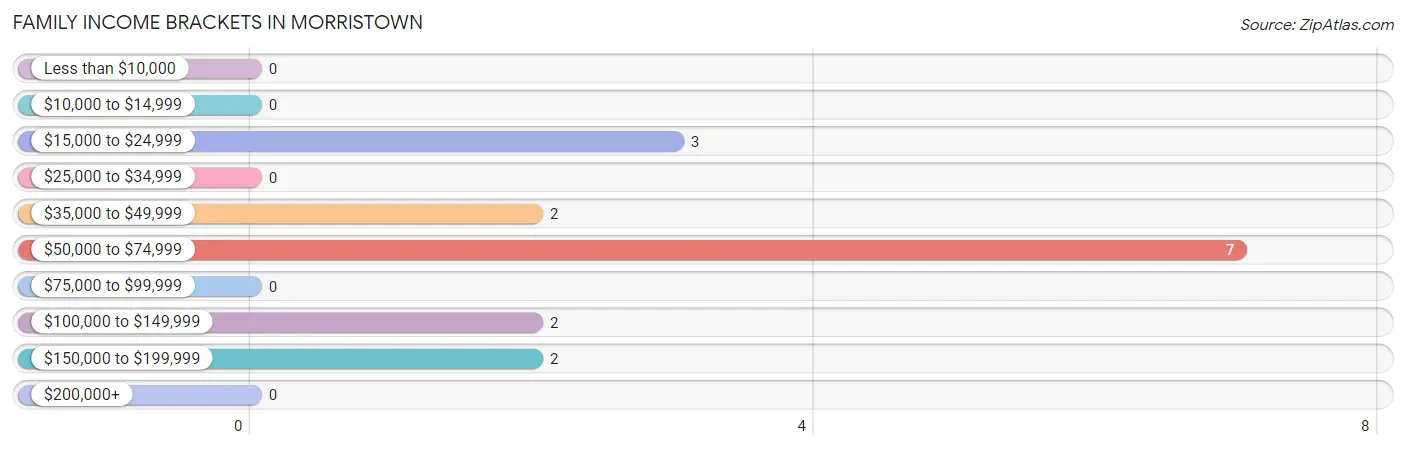
| Income Bracket | # Families | % Families |
| Less than $10,000 | 0 | 0.0% |
| $10,000 to $14,999 | 0 | 0.0% |
| $15,000 to $24,999 | 3 | 18.8% |
| $25,000 to $34,999 | 0 | 0.0% |
| $35,000 to $49,999 | 2 | 12.5% |
| $50,000 to $74,999 | 7 | 43.8% |
| $75,000 to $99,999 | 0 | 0.0% |
| $100,000 to $149,999 | 2 | 12.5% |
| $150,000 to $199,999 | 2 | 12.5% |
| $200,000+ | 0 | 0.0% |
Family Income by Famaliy Size in Morristown
2-person families (7 | 43.8%) account for the highest median family income in Morristown with $73,125 per family, while 2-person families (7 | 43.8%) have the highest median income of $36,562 per family member.
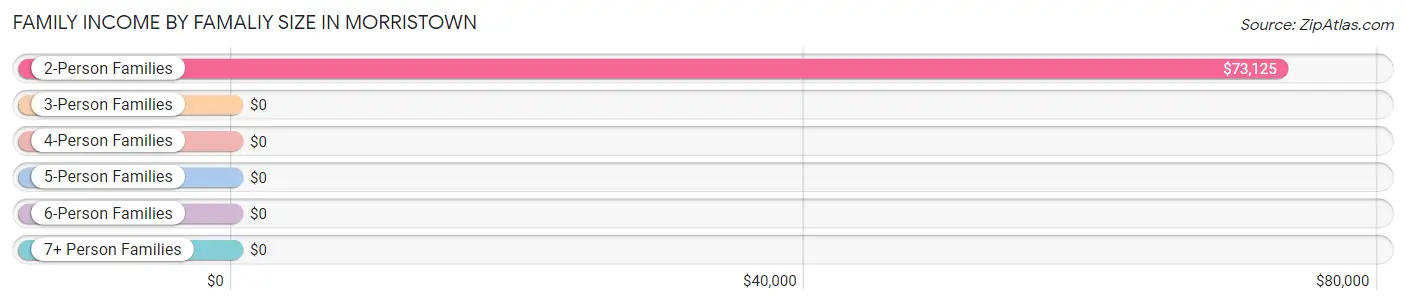
| Income Bracket | # Families | Median Income |
| 2-Person Families | 7 (43.8%) | $73,125 |
| 3-Person Families | 5 (31.2%) | $0 |
| 4-Person Families | 4 (25.0%) | $0 |
| 5-Person Families | 0 (0.0%) | $0 |
| 6-Person Families | 0 (0.0%) | $0 |
| 7+ Person Families | 0 (0.0%) | $0 |
| Total | 16 (100.0%) | $51,875 |
Family Income by Number of Earners in Morristown
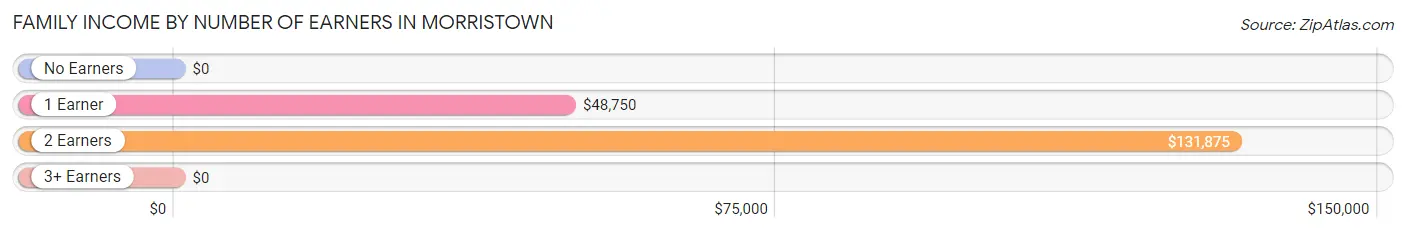
| Number of Earners | # Families | Median Income |
| No Earners | 3 (18.8%) | $0 |
| 1 Earner | 8 (50.0%) | $48,750 |
| 2 Earners | 5 (31.2%) | $131,875 |
| 3+ Earners | 0 (0.0%) | $0 |
| Total | 16 (100.0%) | $51,875 |
Household Income in Morristown
Household Income Brackets in Morristown
With 12 households falling in the category, the $50,000 to $74,999 income range is the most frequent in Morristown, accounting for 30.8% of all households.
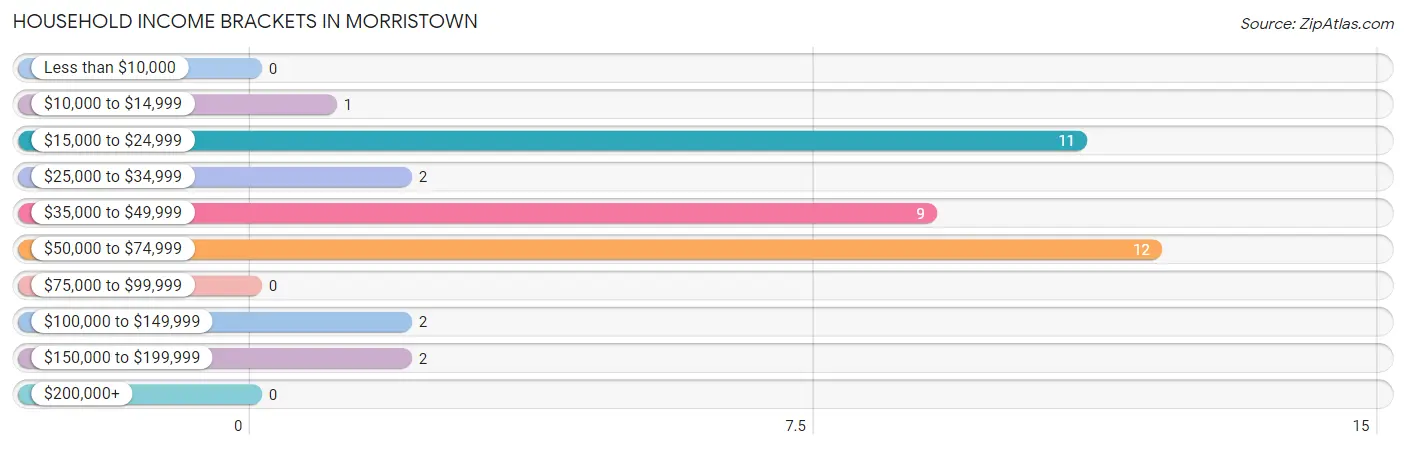
| Income Bracket | # Households | % Households |
| Less than $10,000 | 0 | 0.0% |
| $10,000 to $14,999 | 1 | 2.6% |
| $15,000 to $24,999 | 11 | 28.2% |
| $25,000 to $34,999 | 2 | 5.1% |
| $35,000 to $49,999 | 9 | 23.1% |
| $50,000 to $74,999 | 12 | 30.8% |
| $75,000 to $99,999 | 0 | 0.0% |
| $100,000 to $149,999 | 2 | 5.1% |
| $150,000 to $199,999 | 2 | 5.1% |
| $200,000+ | 0 | 0.0% |
Household Income by Householder Age in Morristown
The median household income in Morristown is $43,438, with the highest median household income of $56,250 found in the 45 to 64 years age bracket for the primary householder. A total of 15 households (38.5%) fall into this category. Meanwhile, the 15 to 24 years age bracket for the primary householder has the lowest median household income of $0, with 3 households (7.7%) in this group.
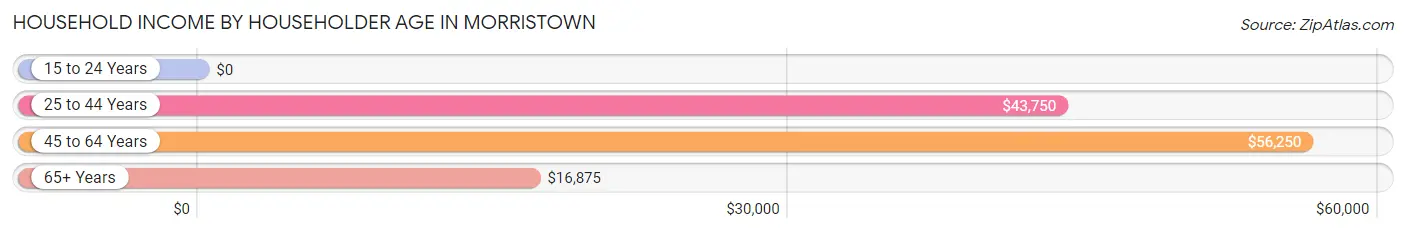
| Income Bracket | # Households | Median Income |
| 15 to 24 Years | 3 (7.7%) | $0 |
| 25 to 44 Years | 13 (33.3%) | $43,750 |
| 45 to 64 Years | 15 (38.5%) | $56,250 |
| 65+ Years | 8 (20.5%) | $16,875 |
| Total | 39 (100.0%) | $43,438 |
Poverty in Morristown
Income Below Poverty by Sex and Age in Morristown
With 13.2% poverty level for males and 25.9% for females among the residents of Morristown, 6 to 11 year old males and 18 to 24 year old females are the most vulnerable to poverty, with 4 males (66.7%) and 2 females (100.0%) in their respective age groups living below the poverty level.
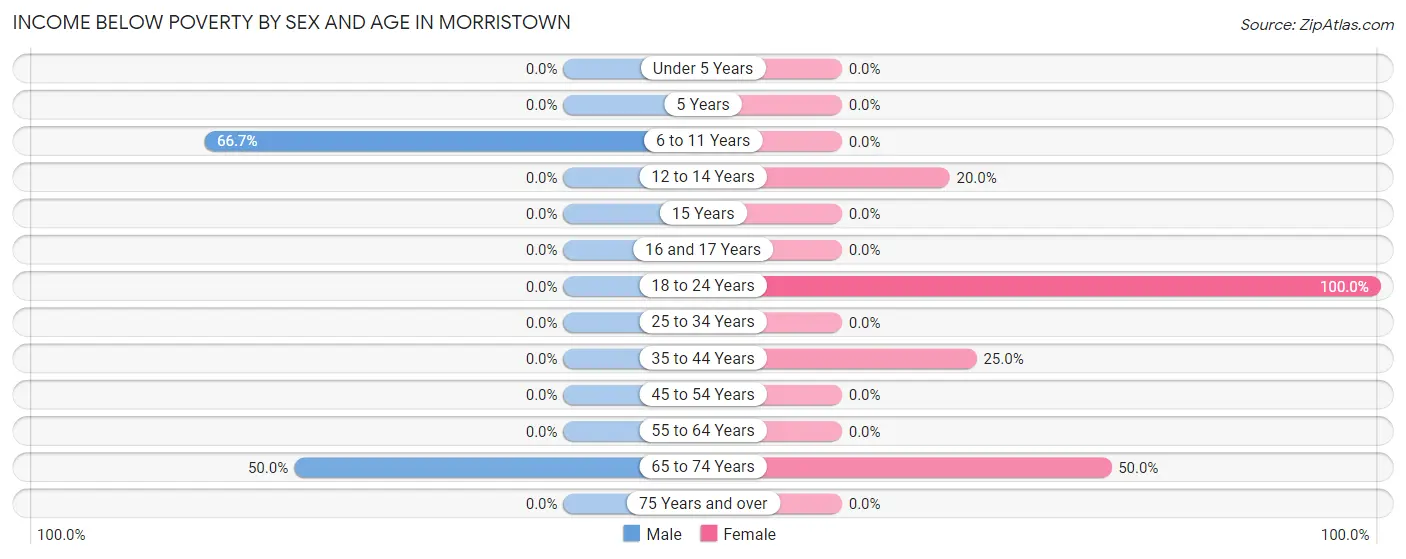
| Age Bracket | Male | Female |
| Under 5 Years | 0 (0.0%) | 0 (0.0%) |
| 5 Years | 0 (0.0%) | 0 (0.0%) |
| 6 to 11 Years | 4 (66.7%) | 0 (0.0%) |
| 12 to 14 Years | 0 (0.0%) | 1 (20.0%) |
| 15 Years | 0 (0.0%) | 0 (0.0%) |
| 16 and 17 Years | 0 (0.0%) | 0 (0.0%) |
| 18 to 24 Years | 0 (0.0%) | 2 (100.0%) |
| 25 to 34 Years | 0 (0.0%) | 0 (0.0%) |
| 35 to 44 Years | 0 (0.0%) | 2 (25.0%) |
| 45 to 54 Years | 0 (0.0%) | 0 (0.0%) |
| 55 to 64 Years | 0 (0.0%) | 0 (0.0%) |
| 65 to 74 Years | 1 (50.0%) | 2 (50.0%) |
| 75 Years and over | 0 (0.0%) | 0 (0.0%) |
| Total | 5 (13.2%) | 7 (25.9%) |
Income Above Poverty by Sex and Age in Morristown
According to the poverty statistics in Morristown, males aged 12 to 14 years and females aged 6 to 11 years are the age groups that are most secure financially, with 100.0% of males and 100.0% of females in these age groups living above the poverty line.
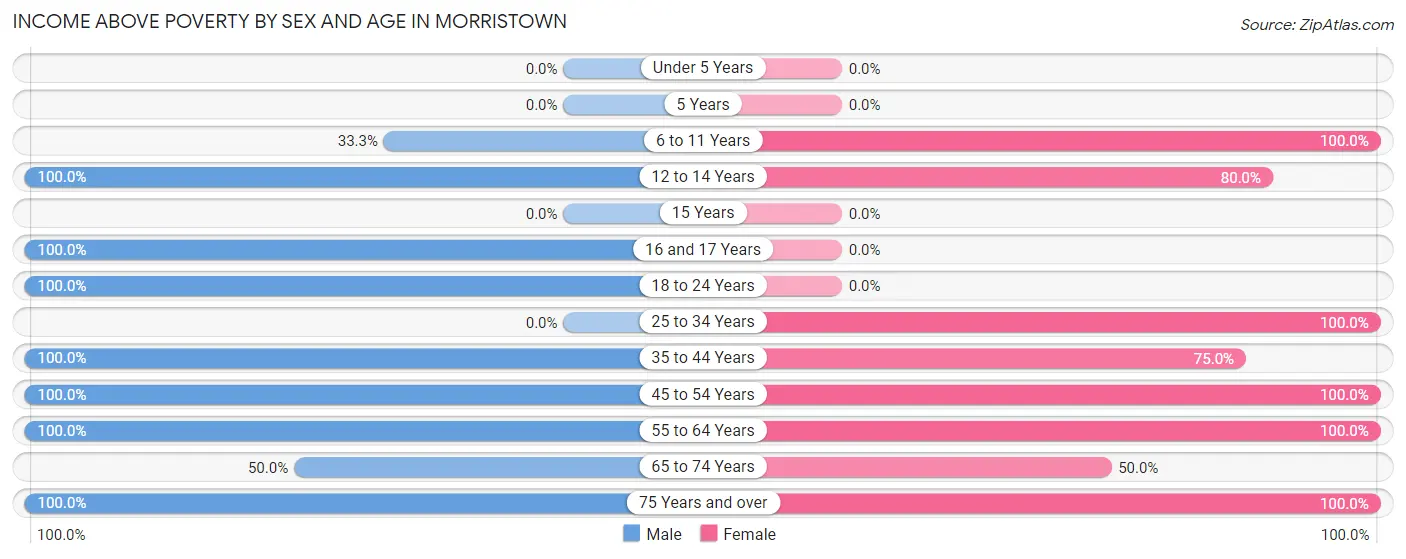
| Age Bracket | Male | Female |
| Under 5 Years | 0 (0.0%) | 0 (0.0%) |
| 5 Years | 0 (0.0%) | 0 (0.0%) |
| 6 to 11 Years | 2 (33.3%) | 1 (100.0%) |
| 12 to 14 Years | 2 (100.0%) | 4 (80.0%) |
| 15 Years | 0 (0.0%) | 0 (0.0%) |
| 16 and 17 Years | 3 (100.0%) | 0 (0.0%) |
| 18 to 24 Years | 3 (100.0%) | 0 (0.0%) |
| 25 to 34 Years | 0 (0.0%) | 1 (100.0%) |
| 35 to 44 Years | 4 (100.0%) | 6 (75.0%) |
| 45 to 54 Years | 7 (100.0%) | 3 (100.0%) |
| 55 to 64 Years | 7 (100.0%) | 2 (100.0%) |
| 65 to 74 Years | 1 (50.0%) | 2 (50.0%) |
| 75 Years and over | 4 (100.0%) | 1 (100.0%) |
| Total | 33 (86.8%) | 20 (74.1%) |
Income Below Poverty Among Married-Couple Families in Morristown
The poverty statistics for married-couple families in Morristown show that 11.1% or 1 of the total 9 families live below the poverty line. Families with no children have the highest poverty rate of 14.3%, comprising of 1 families. On the other hand, families with 1 or 2 children have the lowest poverty rate of 0.0%, which includes 0 families.
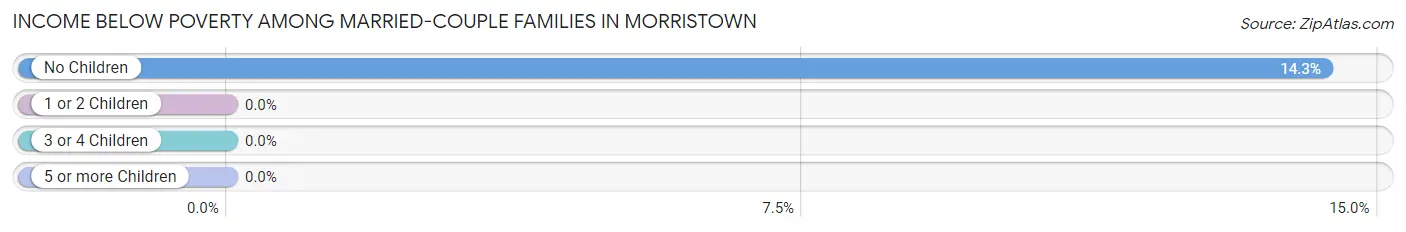
| Children | Above Poverty | Below Poverty |
| No Children | 6 (85.7%) | 1 (14.3%) |
| 1 or 2 Children | 2 (100.0%) | 0 (0.0%) |
| 3 or 4 Children | 0 (0.0%) | 0 (0.0%) |
| 5 or more Children | 0 (0.0%) | 0 (0.0%) |
| Total | 8 (88.9%) | 1 (11.1%) |
Income Below Poverty Among Single-Parent Households in Morristown
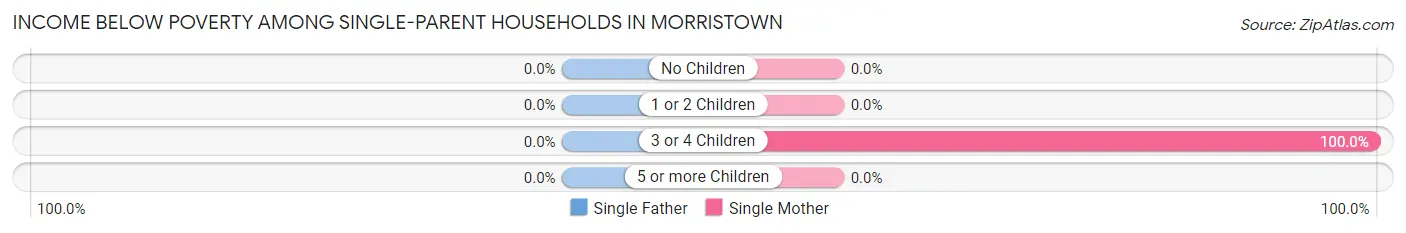
| Children | Single Father | Single Mother |
| No Children | 0 (0.0%) | 0 (0.0%) |
| 1 or 2 Children | 0 (0.0%) | 0 (0.0%) |
| 3 or 4 Children | 0 (0.0%) | 2 (100.0%) |
| 5 or more Children | 0 (0.0%) | 0 (0.0%) |
| Total | 0 (0.0%) | 2 (28.6%) |
Income Below Poverty Among Married-Couple vs Single-Parent Households in Morristown
The poverty data for Morristown shows that 1 of the married-couple family households (11.1%) and 2 of the single-parent households (28.6%) are living below the poverty level. Within the married-couple family households, those with no children have the highest poverty rate, with 1 households (14.3%) falling below the poverty line. Among the single-parent households, those with 3 or 4 children have the highest poverty rate, with 2 household (100.0%) living below poverty.
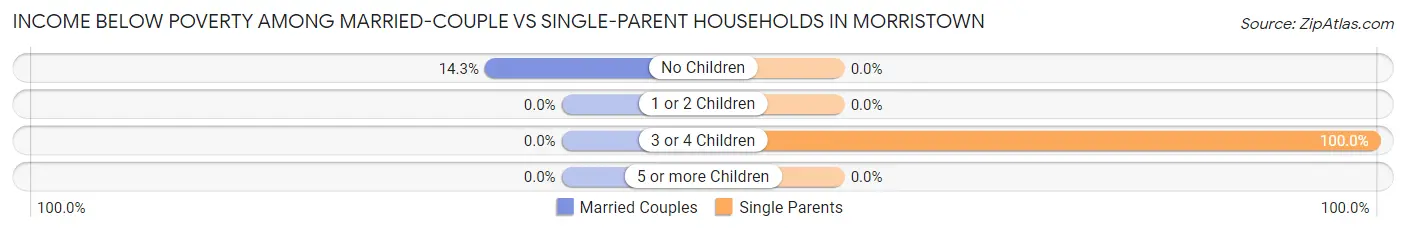
| Children | Married-Couple Families | Single-Parent Households |
| No Children | 1 (14.3%) | 0 (0.0%) |
| 1 or 2 Children | 0 (0.0%) | 0 (0.0%) |
| 3 or 4 Children | 0 (0.0%) | 2 (100.0%) |
| 5 or more Children | 0 (0.0%) | 0 (0.0%) |
| Total | 1 (11.1%) | 2 (28.6%) |
Race in Morristown
The most populous races in Morristown are White / Caucasian (49 | 75.4%), Native / Alaskan (14 | 21.5%), and Two or more Races (2 | 3.1%).
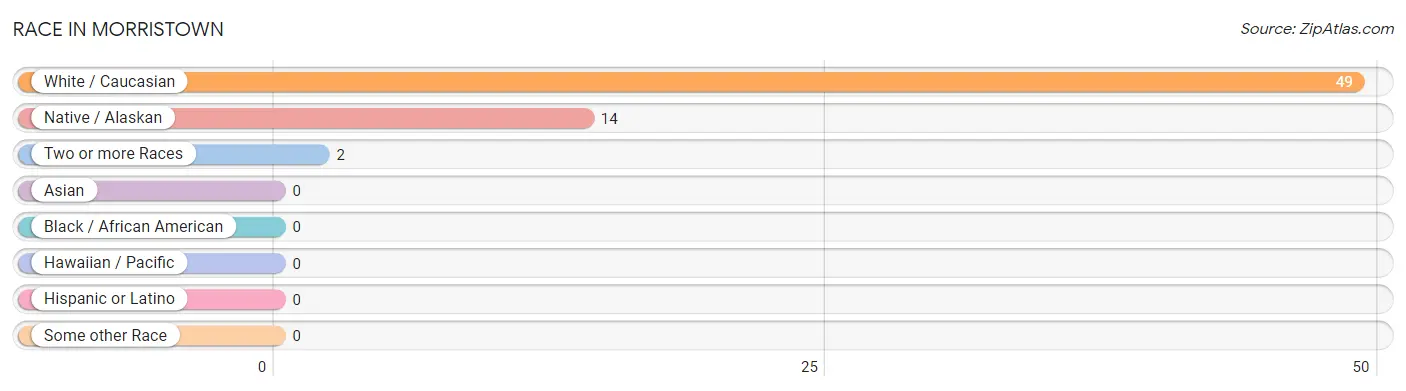
| Race | # Population | % Population |
| Asian | 0 | 0.0% |
| Black / African American | 0 | 0.0% |
| Hawaiian / Pacific | 0 | 0.0% |
| Hispanic or Latino | 0 | 0.0% |
| Native / Alaskan | 14 | 21.5% |
| White / Caucasian | 49 | 75.4% |
| Two or more Races | 2 | 3.1% |
| Some other Race | 0 | 0.0% |
| Total | 65 | 100.0% |
Ancestry in Morristown
The most populous ancestries reported in Morristown are German (33 | 50.8%), Irish (18 | 27.7%), Sioux (14 | 21.5%), American (8 | 12.3%), and Norwegian (3 | 4.6%), together accounting for 116.9% of all Morristown residents.
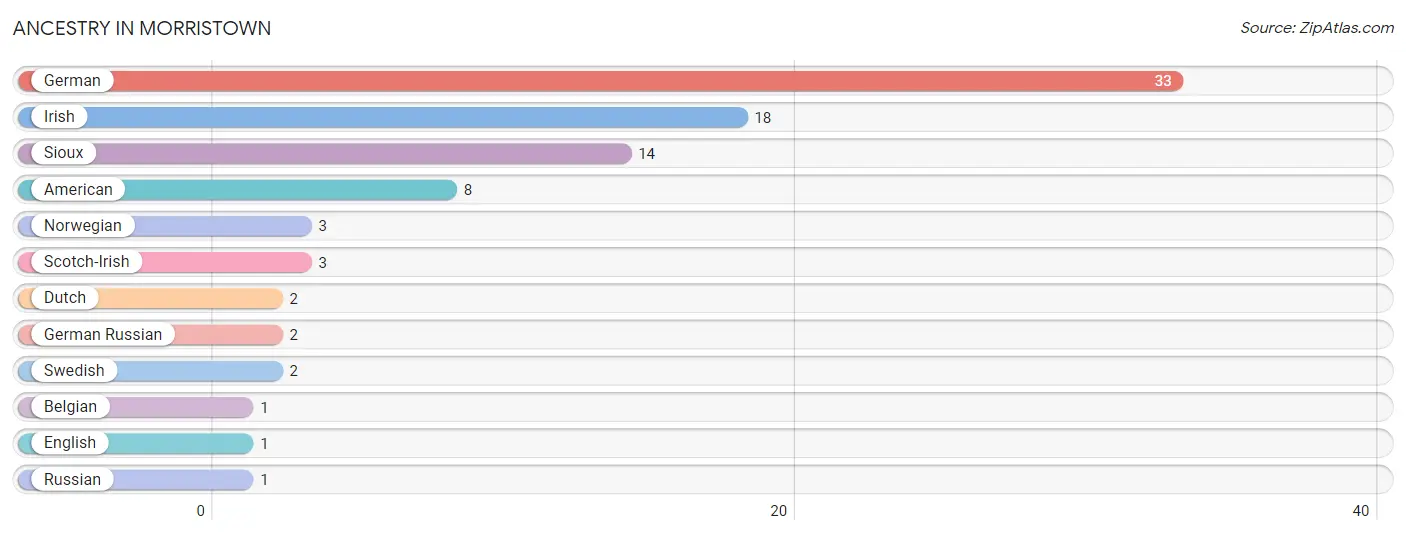
| Ancestry | # Population | % Population |
| American | 8 | 12.3% |
| Belgian | 1 | 1.5% |
| Dutch | 2 | 3.1% |
| English | 1 | 1.5% |
| German | 33 | 50.8% |
| German Russian | 2 | 3.1% |
| Irish | 18 | 27.7% |
| Norwegian | 3 | 4.6% |
| Russian | 1 | 1.5% |
| Scotch-Irish | 3 | 4.6% |
| Sioux | 14 | 21.5% |
| Swedish | 2 | 3.1% | View All 12 Rows |
Immigrants in Morristown

| Immigration Origin | # Population | % Population | View All 0 Rows |
Sex and Age in Morristown
Sex and Age in Morristown
The most populous age groups in Morristown are 10 to 14 Years (6 | 15.8%) for men and 35 to 39 Years (8 | 29.6%) for women.
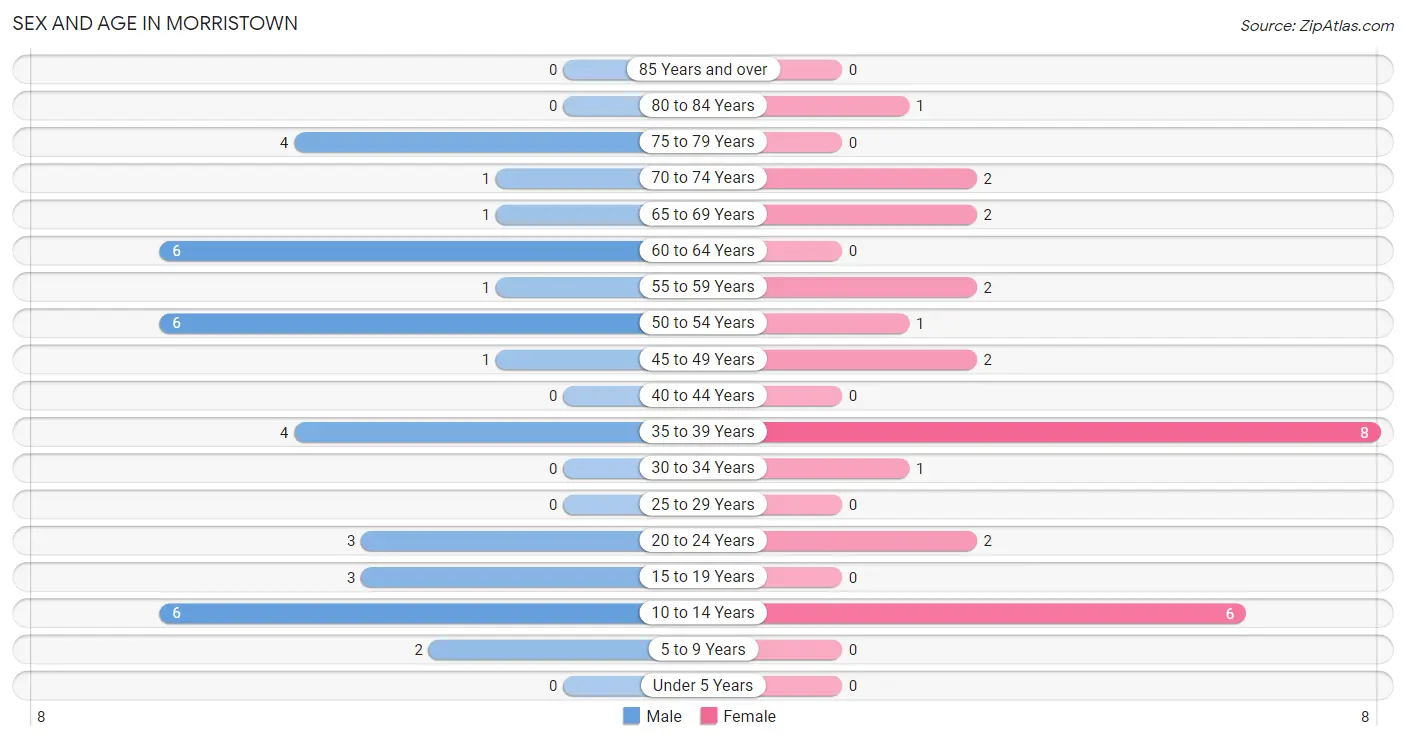
| Age Bracket | Male | Female |
| Under 5 Years | 0 (0.0%) | 0 (0.0%) |
| 5 to 9 Years | 2 (5.3%) | 0 (0.0%) |
| 10 to 14 Years | 6 (15.8%) | 6 (22.2%) |
| 15 to 19 Years | 3 (7.9%) | 0 (0.0%) |
| 20 to 24 Years | 3 (7.9%) | 2 (7.4%) |
| 25 to 29 Years | 0 (0.0%) | 0 (0.0%) |
| 30 to 34 Years | 0 (0.0%) | 1 (3.7%) |
| 35 to 39 Years | 4 (10.5%) | 8 (29.6%) |
| 40 to 44 Years | 0 (0.0%) | 0 (0.0%) |
| 45 to 49 Years | 1 (2.6%) | 2 (7.4%) |
| 50 to 54 Years | 6 (15.8%) | 1 (3.7%) |
| 55 to 59 Years | 1 (2.6%) | 2 (7.4%) |
| 60 to 64 Years | 6 (15.8%) | 0 (0.0%) |
| 65 to 69 Years | 1 (2.6%) | 2 (7.4%) |
| 70 to 74 Years | 1 (2.6%) | 2 (7.4%) |
| 75 to 79 Years | 4 (10.5%) | 0 (0.0%) |
| 80 to 84 Years | 0 (0.0%) | 1 (3.7%) |
| 85 Years and over | 0 (0.0%) | 0 (0.0%) |
| Total | 38 (100.0%) | 27 (100.0%) |
Families and Households in Morristown
Median Family Size in Morristown
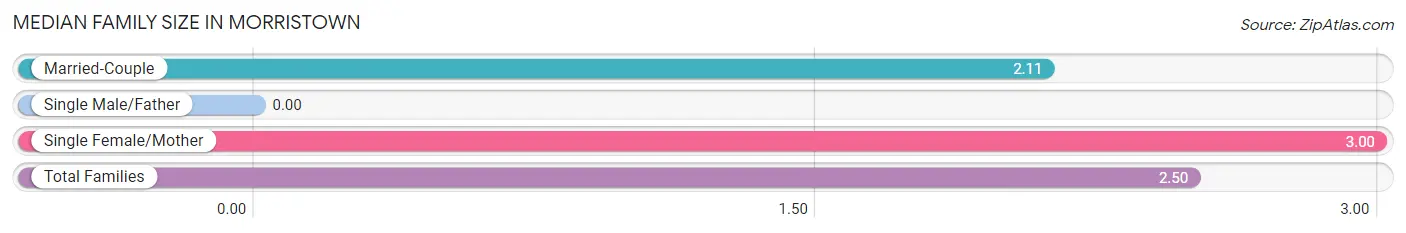
| Family Type | # Families | Family Size |
| Married-Couple | 9 (56.2%) | 2.11 |
| Single Male/Father | 0 (0.0%) | - |
| Single Female/Mother | 7 (43.8%) | 3.00 |
| Total Families | 16 (100.0%) | 2.50 |
Median Household Size in Morristown
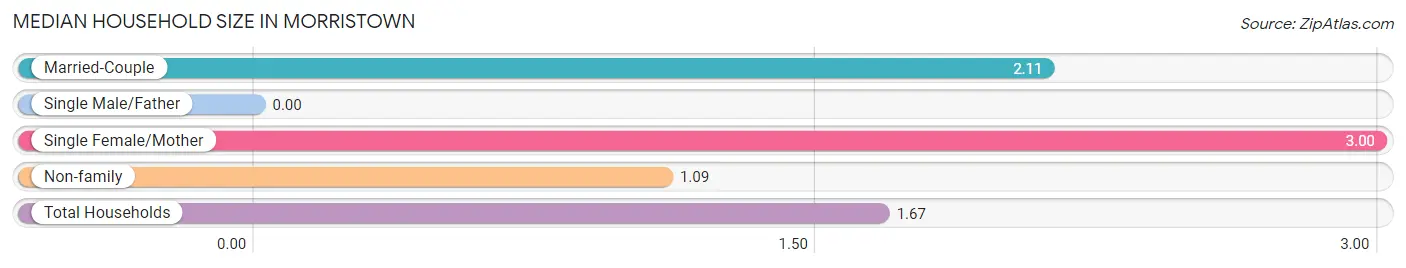
| Household Type | # Households | Household Size |
| Married-Couple | 9 (23.1%) | 2.11 |
| Single Male/Father | 0 (0.0%) | - |
| Single Female/Mother | 7 (17.9%) | 3.00 |
| Non-family | 23 (59.0%) | 1.09 |
| Total Households | 39 (100.0%) | 1.67 |
Household Size by Marriage Status in Morristown
Out of a total of 39 households in Morristown, 16 (41.0%) are family households, while 23 (59.0%) are nonfamily households. The most numerous type of family households are 2-person households, comprising 7, and the most common type of nonfamily households are 1-person households, comprising 20.
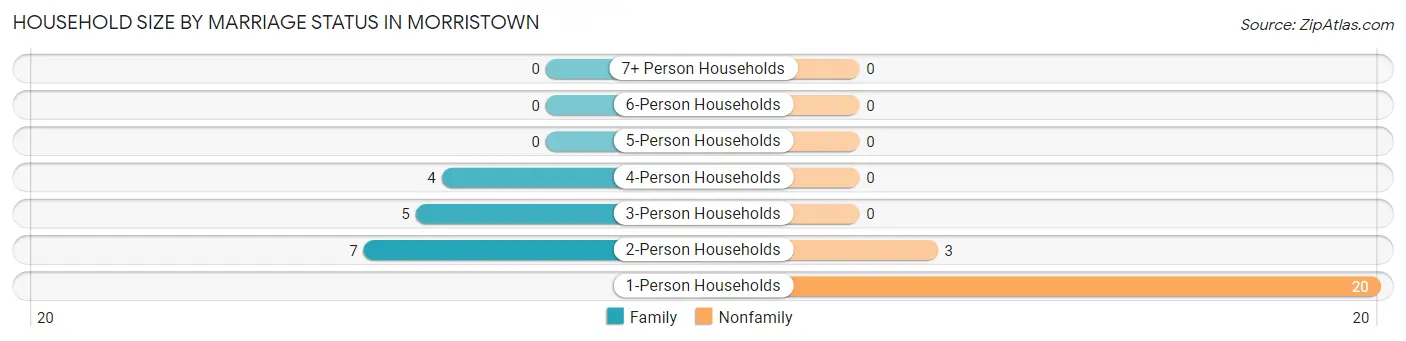
| Household Size | Family Households | Nonfamily Households |
| 1-Person Households | - | 20 (51.3%) |
| 2-Person Households | 7 (17.9%) | 3 (7.7%) |
| 3-Person Households | 5 (12.8%) | 0 (0.0%) |
| 4-Person Households | 4 (10.3%) | 0 (0.0%) |
| 5-Person Households | 0 (0.0%) | 0 (0.0%) |
| 6-Person Households | 0 (0.0%) | 0 (0.0%) |
| 7+ Person Households | 0 (0.0%) | 0 (0.0%) |
| Total | 16 (41.0%) | 23 (59.0%) |
Female Fertility in Morristown
Fertility by Age in Morristown
| Age Bracket | Women with Births | Births / 1,000 Women |
| 15 to 19 years | 0 (0.0%) | 0.0 |
| 20 to 34 years | 0 (0.0%) | 0.0 |
| 35 to 50 years | 0 (0.0%) | 0.0 |
| Total | 0 (0.0%) | 0.0 |
Fertility by Age by Marriage Status in Morristown
| Age Bracket | Married | Unmarried |
| 15 to 19 years | 0 (0.0%) | 0 (0.0%) |
| 20 to 34 years | 0 (0.0%) | 0 (0.0%) |
| 35 to 50 years | 0 (0.0%) | 0 (0.0%) |
| Total | 0 (0.0%) | 0 (0.0%) |
Fertility by Education in Morristown
| Educational Attainment | Women with Births | Births / 1,000 Women |
| Less than High School | 0 (0.0%) | 0.0 |
| High School Diploma | 0 (0.0%) | 0.0 |
| College or Associate's Degree | 0 (0.0%) | 0.0 |
| Bachelor's Degree | 0 (0.0%) | 0.0 |
| Graduate Degree | 0 (0.0%) | 0.0 |
| Total | 0 (0.0%) | 0.0 |
Fertility by Education by Marriage Status in Morristown
| Educational Attainment | Married | Unmarried |
| Less than High School | 0 (0.0%) | 0 (0.0%) |
| High School Diploma | 0 (0.0%) | 0 (0.0%) |
| College or Associate's Degree | 0 (0.0%) | 0 (0.0%) |
| Bachelor's Degree | 0 (0.0%) | 0 (0.0%) |
| Graduate Degree | 0 (0.0%) | 0 (0.0%) |
| Total | 0 (0.0%) | 0 (0.0%) |
Employment Characteristics in Morristown
Employment by Class of Employer in Morristown
Among the 37 employed individuals in Morristown, private company employees (15 | 40.5%), self-employed (not incorporated) (10 | 27.0%), and local government employees (8 | 21.6%) make up the most common classes of employment.
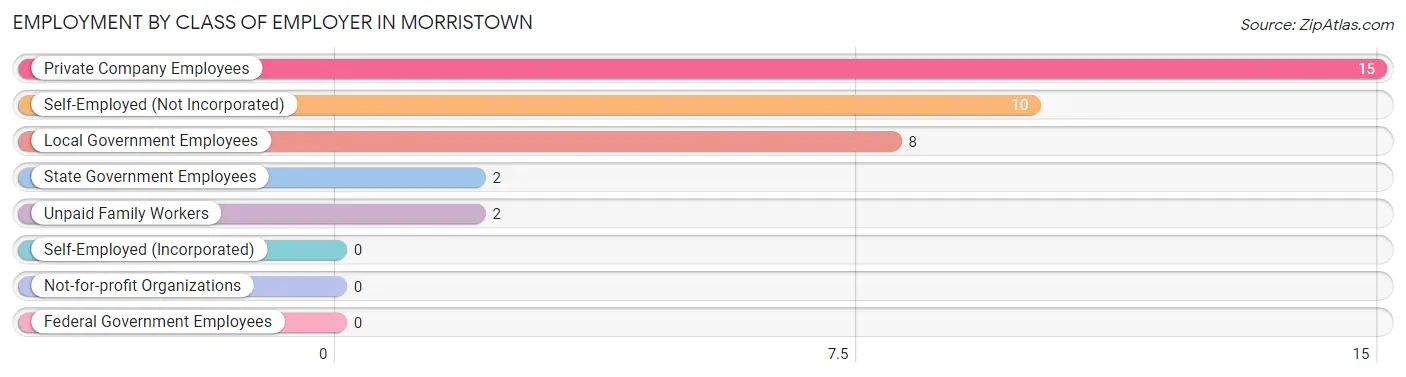
| Employer Class | # Employees | % Employees |
| Private Company Employees | 15 | 40.5% |
| Self-Employed (Incorporated) | 0 | 0.0% |
| Self-Employed (Not Incorporated) | 10 | 27.0% |
| Not-for-profit Organizations | 0 | 0.0% |
| Local Government Employees | 8 | 21.6% |
| State Government Employees | 2 | 5.4% |
| Federal Government Employees | 0 | 0.0% |
| Unpaid Family Workers | 2 | 5.4% |
| Total | 37 | 100.0% |
Employment Status by Age in Morristown
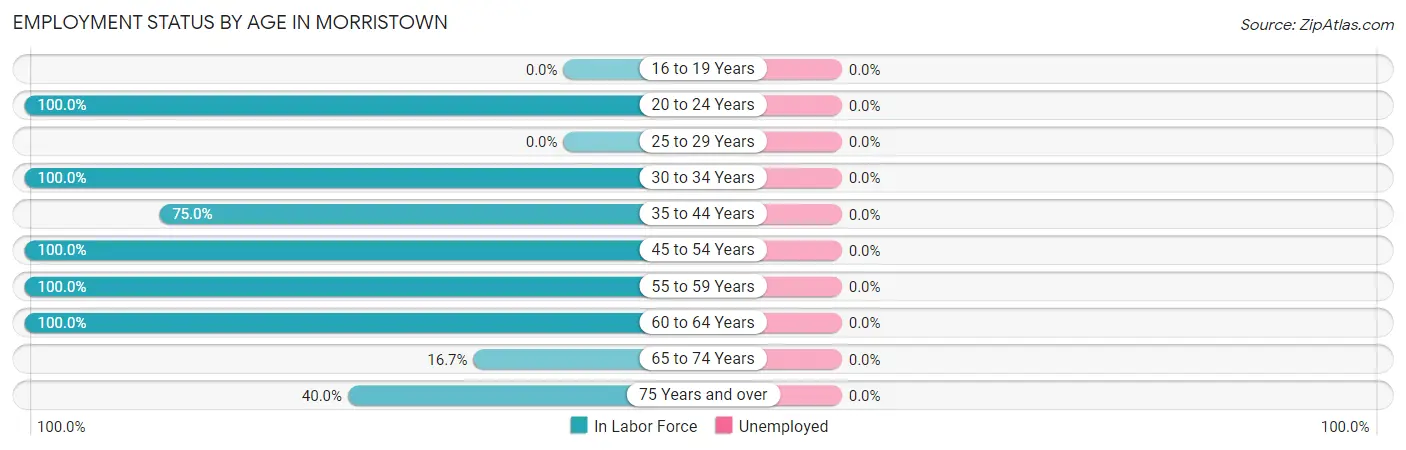
| Age Bracket | In Labor Force | Unemployed |
| 16 to 19 Years | 0 (0.0%) | 0 (0.0%) |
| 20 to 24 Years | 5 (100.0%) | 0 (0.0%) |
| 25 to 29 Years | 0 (0.0%) | 0 (0.0%) |
| 30 to 34 Years | 1 (100.0%) | 0 (0.0%) |
| 35 to 44 Years | 9 (75.0%) | 0 (0.0%) |
| 45 to 54 Years | 10 (100.0%) | 0 (0.0%) |
| 55 to 59 Years | 3 (100.0%) | 0 (0.0%) |
| 60 to 64 Years | 6 (100.0%) | 0 (0.0%) |
| 65 to 74 Years | 1 (16.7%) | 0 (0.0%) |
| 75 Years and over | 2 (40.0%) | 0 (0.0%) |
| Total | 37 (72.5%) | 0 (0.0%) |
Employment Status by Educational Attainment in Morristown
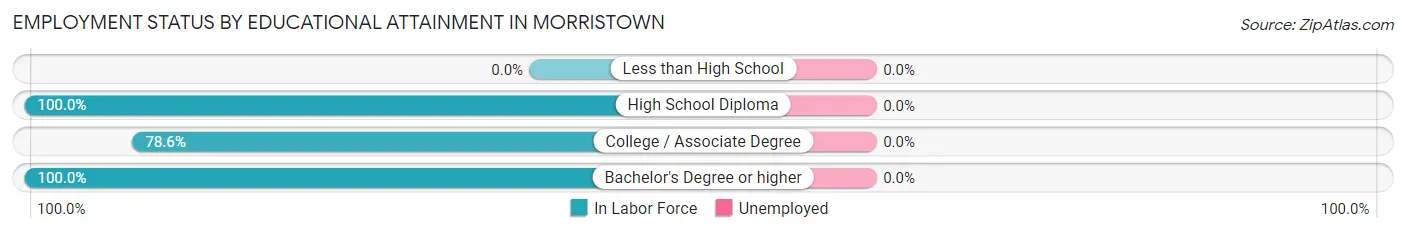
| Educational Attainment | In Labor Force | Unemployed |
| Less than High School | 0 (0.0%) | 0 (0.0%) |
| High School Diploma | 14 (100.0%) | 0 (0.0%) |
| College / Associate Degree | 11 (78.6%) | 0 (0.0%) |
| Bachelor's Degree or higher | 4 (100.0%) | 0 (0.0%) |
| Total | 29 (90.6%) | 0 (0.0%) |
Employment Occupations by Sex in Morristown
Management, Business, Science and Arts Occupations
The most common Management, Business, Science and Arts occupations in Morristown are Management (5 | 13.5%), Community & Social Service (5 | 13.5%), Education Instruction & Library (4 | 10.8%), Health Diagnosing & Treating (2 | 5.4%), and Health Technologists (2 | 5.4%).
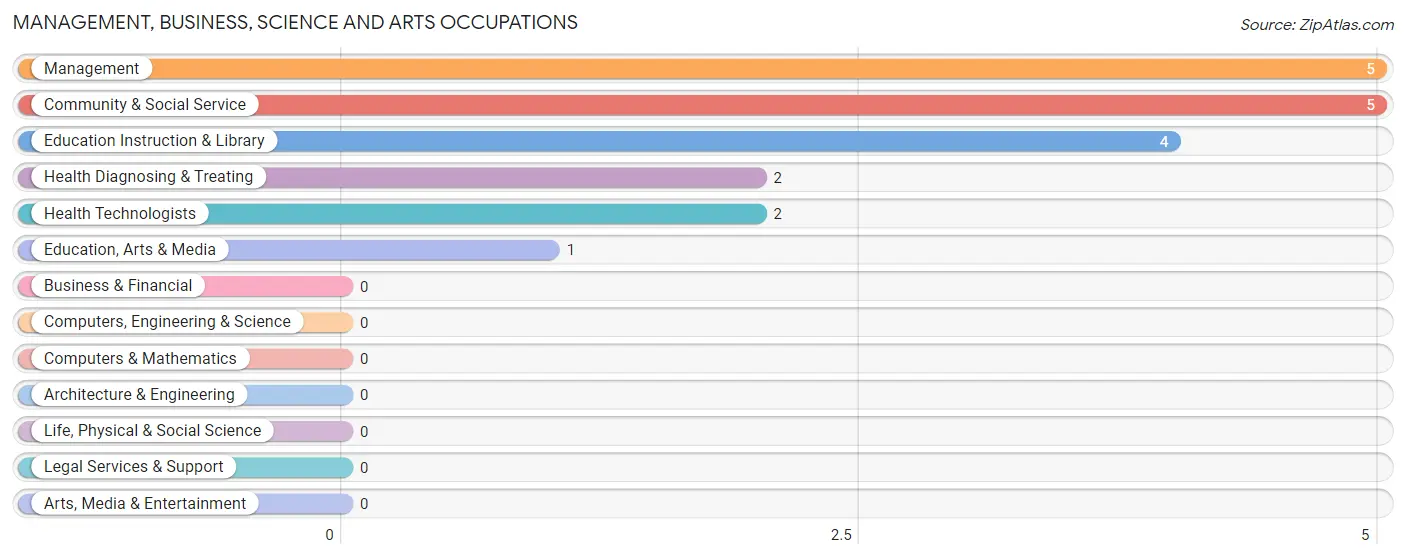
Management, Business, Science and Arts Occupations by Sex
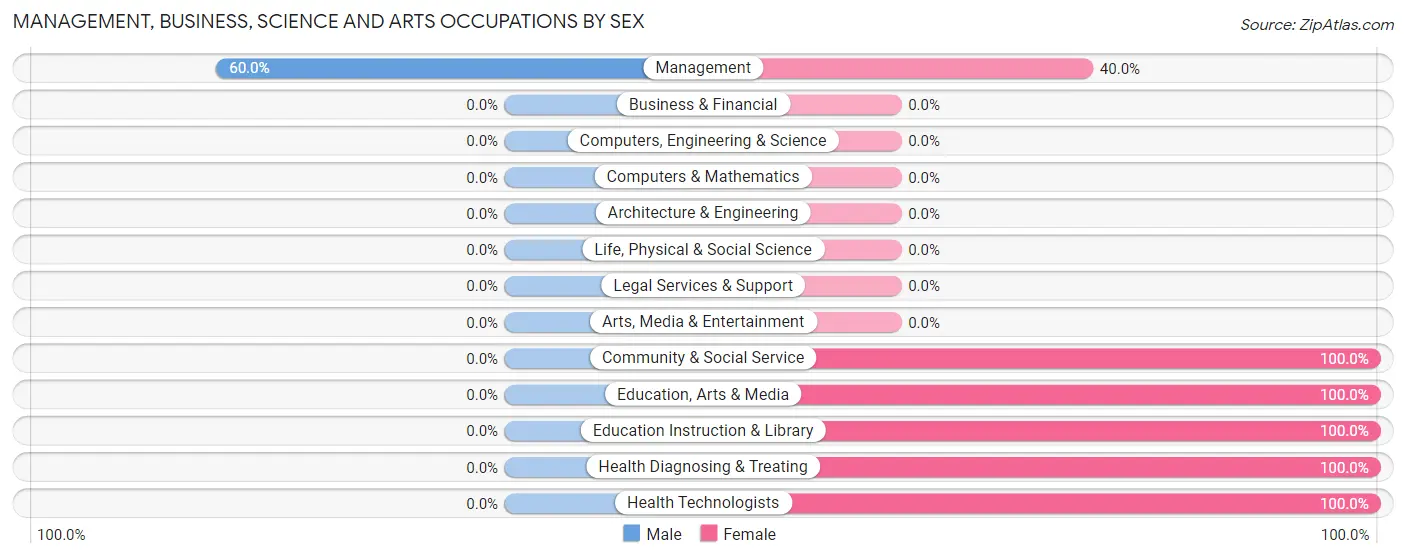
| Occupation | Male | Female |
| Management | 3 (60.0%) | 2 (40.0%) |
| Business & Financial | 0 (0.0%) | 0 (0.0%) |
| Computers, Engineering & Science | 0 (0.0%) | 0 (0.0%) |
| Computers & Mathematics | 0 (0.0%) | 0 (0.0%) |
| Architecture & Engineering | 0 (0.0%) | 0 (0.0%) |
| Life, Physical & Social Science | 0 (0.0%) | 0 (0.0%) |
| Community & Social Service | 0 (0.0%) | 5 (100.0%) |
| Education, Arts & Media | 0 (0.0%) | 1 (100.0%) |
| Legal Services & Support | 0 (0.0%) | 0 (0.0%) |
| Education Instruction & Library | 0 (0.0%) | 4 (100.0%) |
| Arts, Media & Entertainment | 0 (0.0%) | 0 (0.0%) |
| Health Diagnosing & Treating | 0 (0.0%) | 2 (100.0%) |
| Health Technologists | 0 (0.0%) | 2 (100.0%) |
| Total (Category) | 3 (25.0%) | 9 (75.0%) |
| Total (Overall) | 20 (54.0%) | 17 (46.0%) |
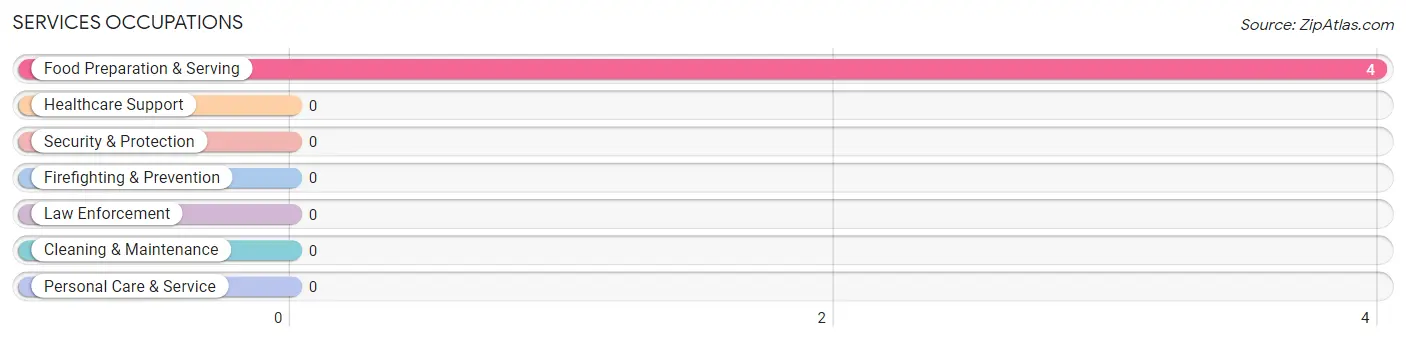
Services Occupations
The most common Services occupations in Morristown are , and Food Preparation & Serving (4 | 10.8%).
Services Occupations by Sex
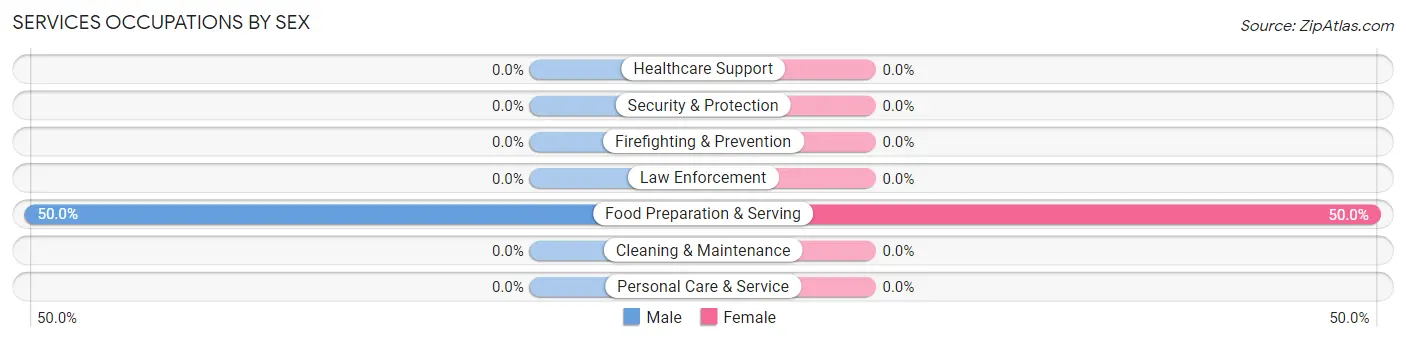
| Occupation | Male | Female |
| Healthcare Support | 0 (0.0%) | 0 (0.0%) |
| Security & Protection | 0 (0.0%) | 0 (0.0%) |
| Firefighting & Prevention | 0 (0.0%) | 0 (0.0%) |
| Law Enforcement | 0 (0.0%) | 0 (0.0%) |
| Food Preparation & Serving | 2 (50.0%) | 2 (50.0%) |
| Cleaning & Maintenance | 0 (0.0%) | 0 (0.0%) |
| Personal Care & Service | 0 (0.0%) | 0 (0.0%) |
| Total (Category) | 2 (50.0%) | 2 (50.0%) |
| Total (Overall) | 20 (54.0%) | 17 (46.0%) |
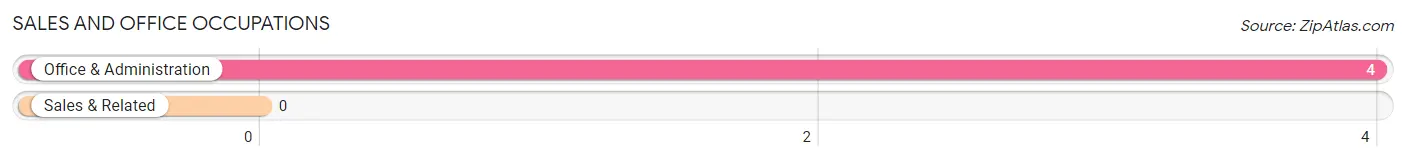
Sales and Office Occupations
The most common Sales and Office occupations in Morristown are , and Office & Administration (4 | 10.8%).
Sales and Office Occupations by Sex
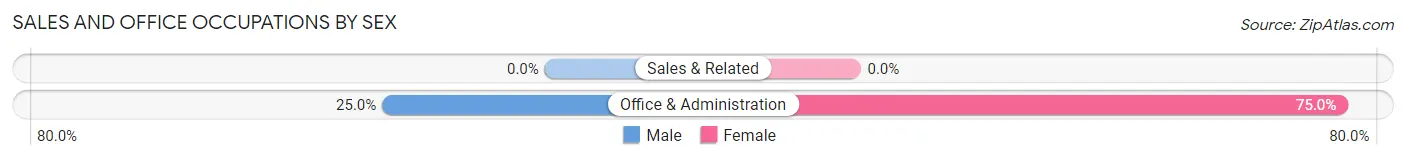
| Occupation | Male | Female |
| Sales & Related | 0 (0.0%) | 0 (0.0%) |
| Office & Administration | 1 (25.0%) | 3 (75.0%) |
| Total (Category) | 1 (25.0%) | 3 (75.0%) |
| Total (Overall) | 20 (54.0%) | 17 (46.0%) |
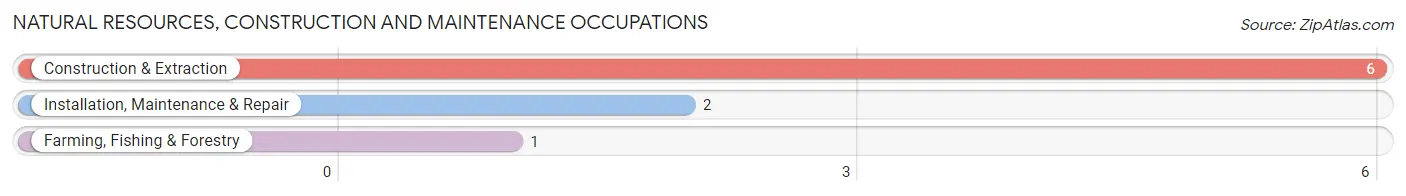
Natural Resources, Construction and Maintenance Occupations
The most common Natural Resources, Construction and Maintenance occupations in Morristown are Construction & Extraction (6 | 16.2%), Installation, Maintenance & Repair (2 | 5.4%), and Farming, Fishing & Forestry (1 | 2.7%).
Natural Resources, Construction and Maintenance Occupations by Sex
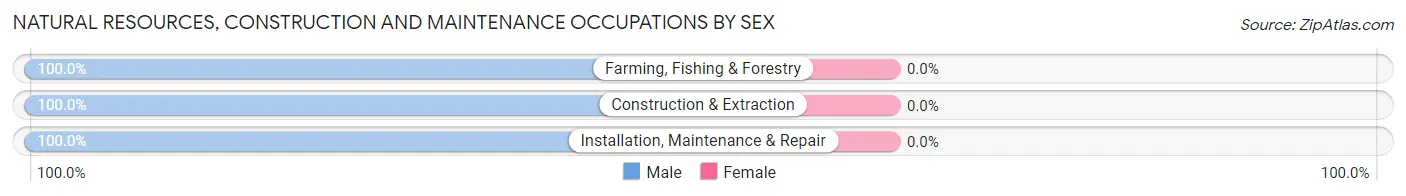
| Occupation | Male | Female |
| Farming, Fishing & Forestry | 1 (100.0%) | 0 (0.0%) |
| Construction & Extraction | 6 (100.0%) | 0 (0.0%) |
| Installation, Maintenance & Repair | 2 (100.0%) | 0 (0.0%) |
| Total (Category) | 9 (100.0%) | 0 (0.0%) |
| Total (Overall) | 20 (54.0%) | 17 (46.0%) |
Production, Transportation and Moving Occupations
The most common Production, Transportation and Moving occupations in Morristown are Transportation (6 | 16.2%), and Production (2 | 5.4%).
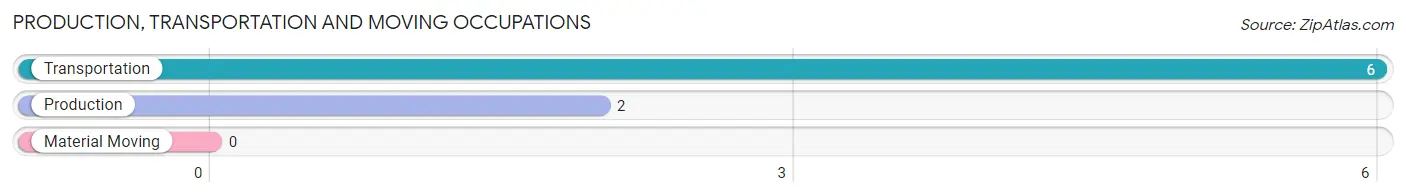
Production, Transportation and Moving Occupations by Sex
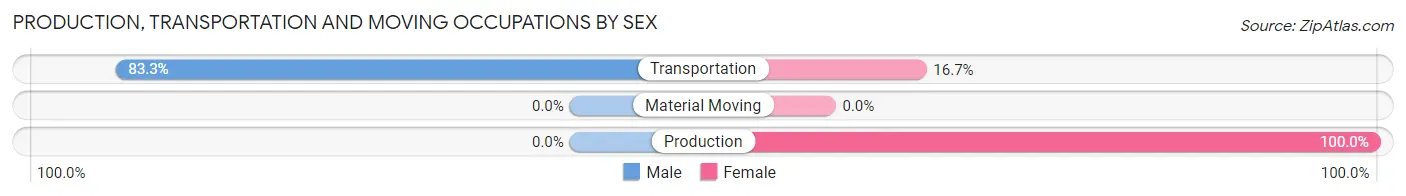
| Occupation | Male | Female |
| Production | 0 (0.0%) | 2 (100.0%) |
| Transportation | 5 (83.3%) | 1 (16.7%) |
| Material Moving | 0 (0.0%) | 0 (0.0%) |
| Total (Category) | 5 (62.5%) | 3 (37.5%) |
| Total (Overall) | 20 (54.0%) | 17 (46.0%) |
Employment Industries by Sex in Morristown
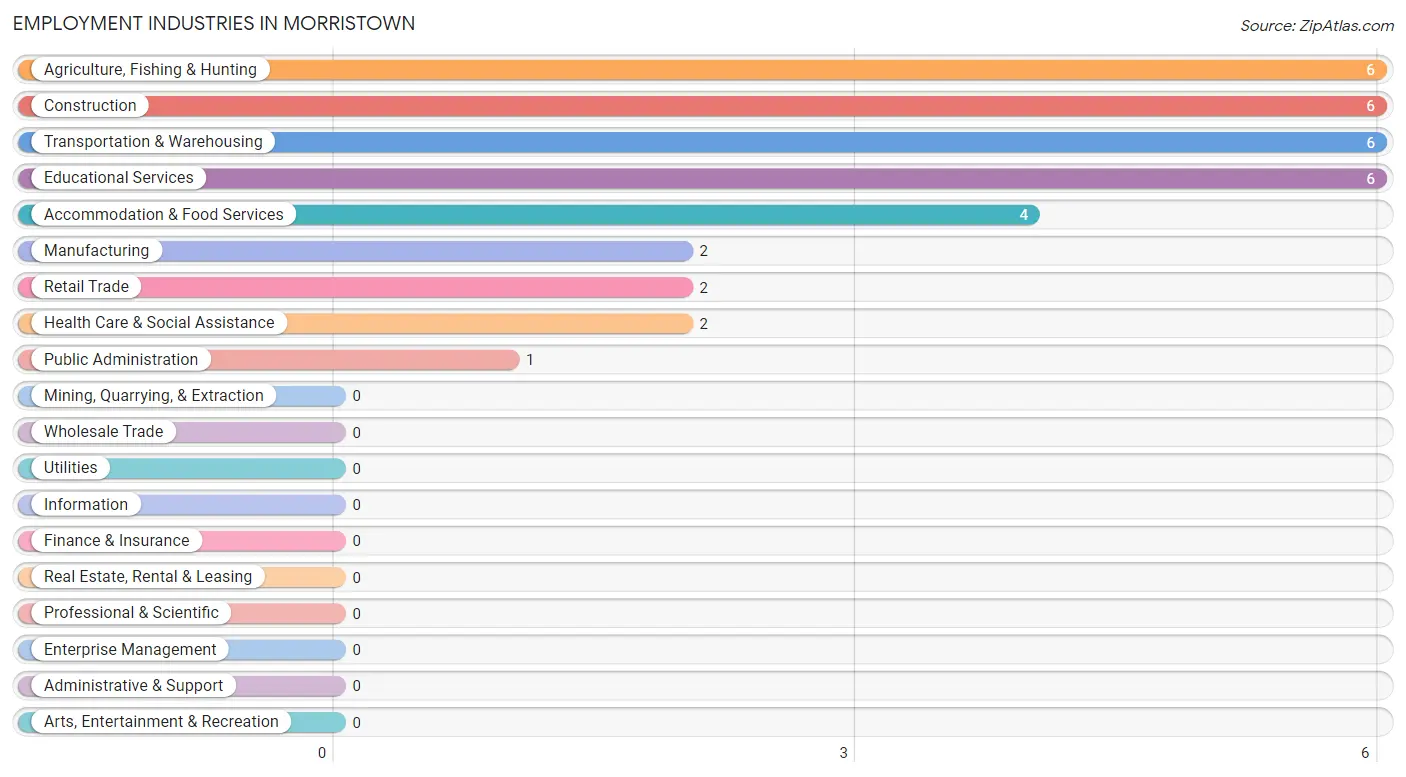
Employment Industries in Morristown
The major employment industries in Morristown include Agriculture, Fishing & Hunting (6 | 16.2%), Construction (6 | 16.2%), Transportation & Warehousing (6 | 16.2%), Educational Services (6 | 16.2%), and Accommodation & Food Services (4 | 10.8%).
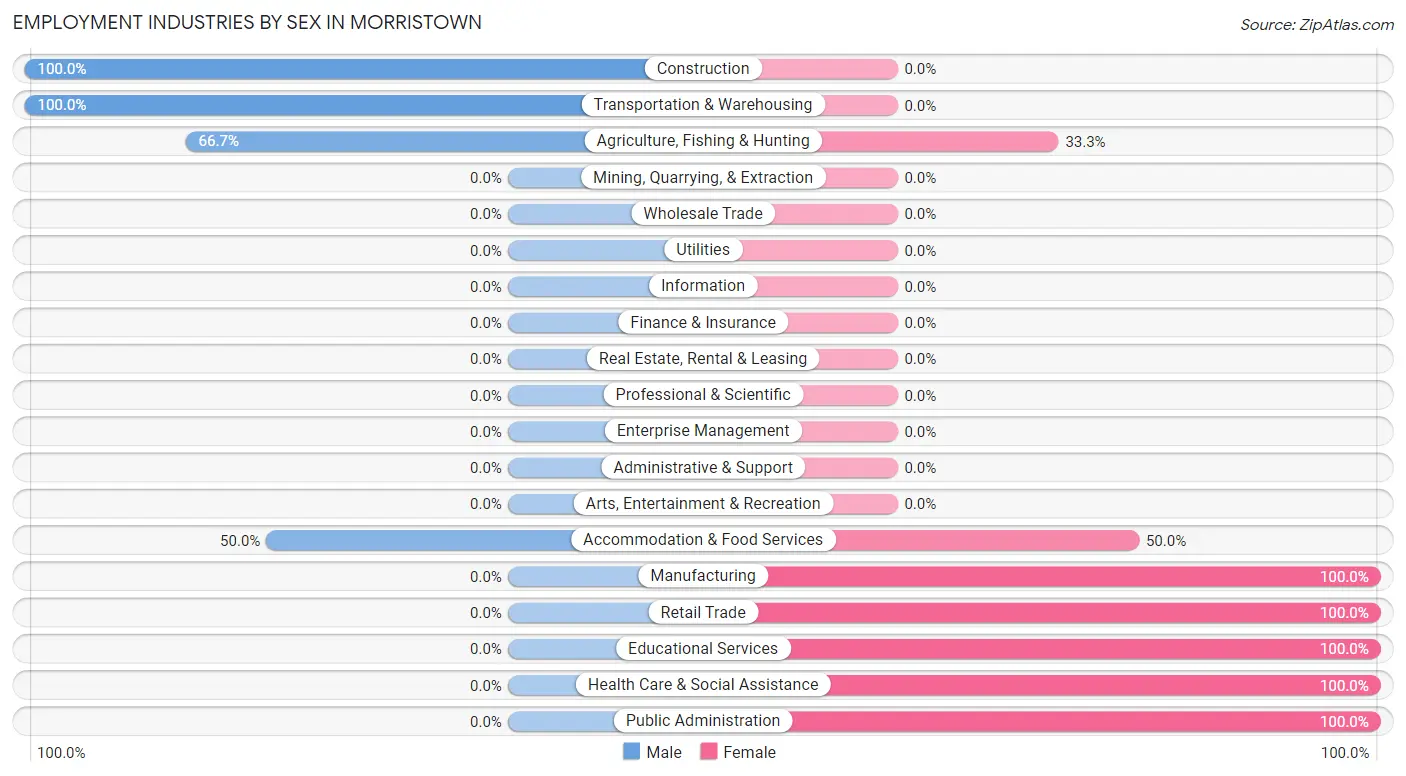
Employment Industries by Sex in Morristown
The Morristown industries that see more men than women are Construction (100.0%), Transportation & Warehousing (100.0%), and Agriculture, Fishing & Hunting (66.7%), whereas the industries that tend to have a higher number of women are Manufacturing (100.0%), Retail Trade (100.0%), and Educational Services (100.0%).
| Industry | Male | Female |
| Agriculture, Fishing & Hunting | 4 (66.7%) | 2 (33.3%) |
| Mining, Quarrying, & Extraction | 0 (0.0%) | 0 (0.0%) |
| Construction | 6 (100.0%) | 0 (0.0%) |
| Manufacturing | 0 (0.0%) | 2 (100.0%) |
| Wholesale Trade | 0 (0.0%) | 0 (0.0%) |
| Retail Trade | 0 (0.0%) | 2 (100.0%) |
| Transportation & Warehousing | 6 (100.0%) | 0 (0.0%) |
| Utilities | 0 (0.0%) | 0 (0.0%) |
| Information | 0 (0.0%) | 0 (0.0%) |
| Finance & Insurance | 0 (0.0%) | 0 (0.0%) |
| Real Estate, Rental & Leasing | 0 (0.0%) | 0 (0.0%) |
| Professional & Scientific | 0 (0.0%) | 0 (0.0%) |
| Enterprise Management | 0 (0.0%) | 0 (0.0%) |
| Administrative & Support | 0 (0.0%) | 0 (0.0%) |
| Educational Services | 0 (0.0%) | 6 (100.0%) |
| Health Care & Social Assistance | 0 (0.0%) | 2 (100.0%) |
| Arts, Entertainment & Recreation | 0 (0.0%) | 0 (0.0%) |
| Accommodation & Food Services | 2 (50.0%) | 2 (50.0%) |
| Public Administration | 0 (0.0%) | 1 (100.0%) |
| Total | 20 (54.0%) | 17 (46.0%) |
Education in Morristown
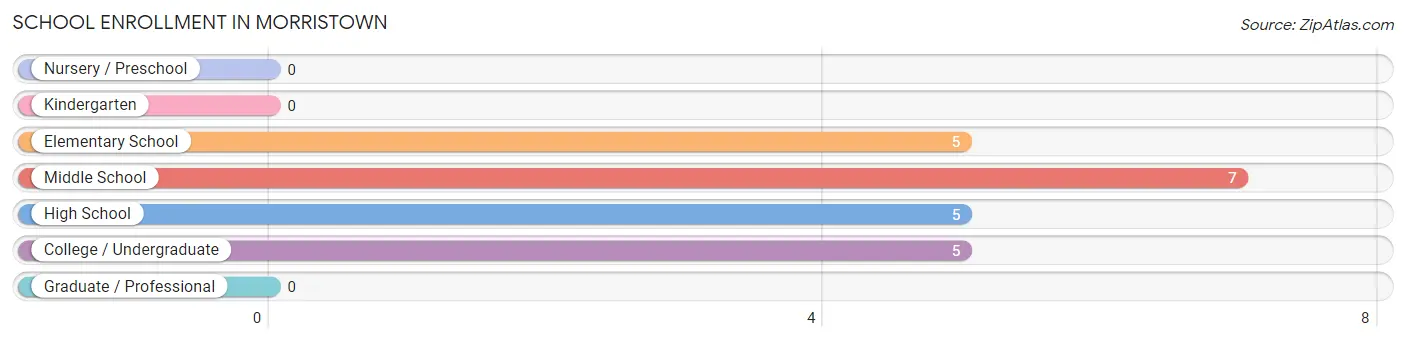
School Enrollment in Morristown
The most common levels of schooling among the 22 students in Morristown are middle school (7 | 31.8%), elementary school (5 | 22.7%), and high school (5 | 22.7%).
| School Level | # Students | % Students |
| Nursery / Preschool | 0 | 0.0% |
| Kindergarten | 0 | 0.0% |
| Elementary School | 5 | 22.7% |
| Middle School | 7 | 31.8% |
| High School | 5 | 22.7% |
| College / Undergraduate | 5 | 22.7% |
| Graduate / Professional | 0 | 0.0% |
| Total | 22 | 100.0% |
School Enrollment by Age by Funding Source in Morristown
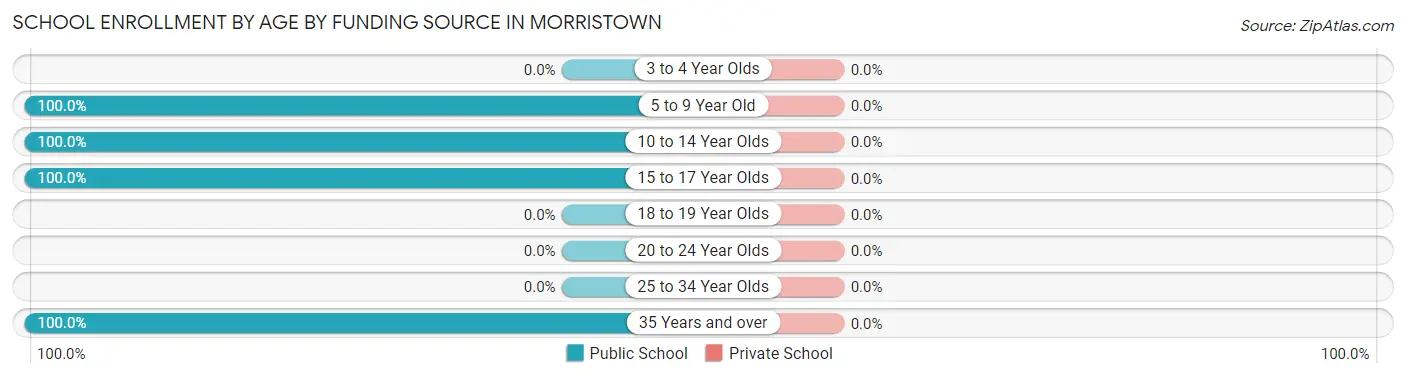
| Age Bracket | Public School | Private School |
| 3 to 4 Year Olds | 0 (0.0%) | 0 (0.0%) |
| 5 to 9 Year Old | 2 (100.0%) | 0 (0.0%) |
| 10 to 14 Year Olds | 12 (100.0%) | 0 (0.0%) |
| 15 to 17 Year Olds | 3 (100.0%) | 0 (0.0%) |
| 18 to 19 Year Olds | 0 (0.0%) | 0 (0.0%) |
| 20 to 24 Year Olds | 0 (0.0%) | 0 (0.0%) |
| 25 to 34 Year Olds | 0 (0.0%) | 0 (0.0%) |
| 35 Years and over | 5 (100.0%) | 0 (0.0%) |
| Total | 22 (100.0%) | 0 (0.0%) |
Educational Attainment by Field of Study in Morristown
Science & technology (2 | 28.6%), business (2 | 28.6%), education (2 | 28.6%), and social sciences (1 | 14.3%) are the most common fields of study among 7 individuals in Morristown who have obtained a bachelor's degree or higher.
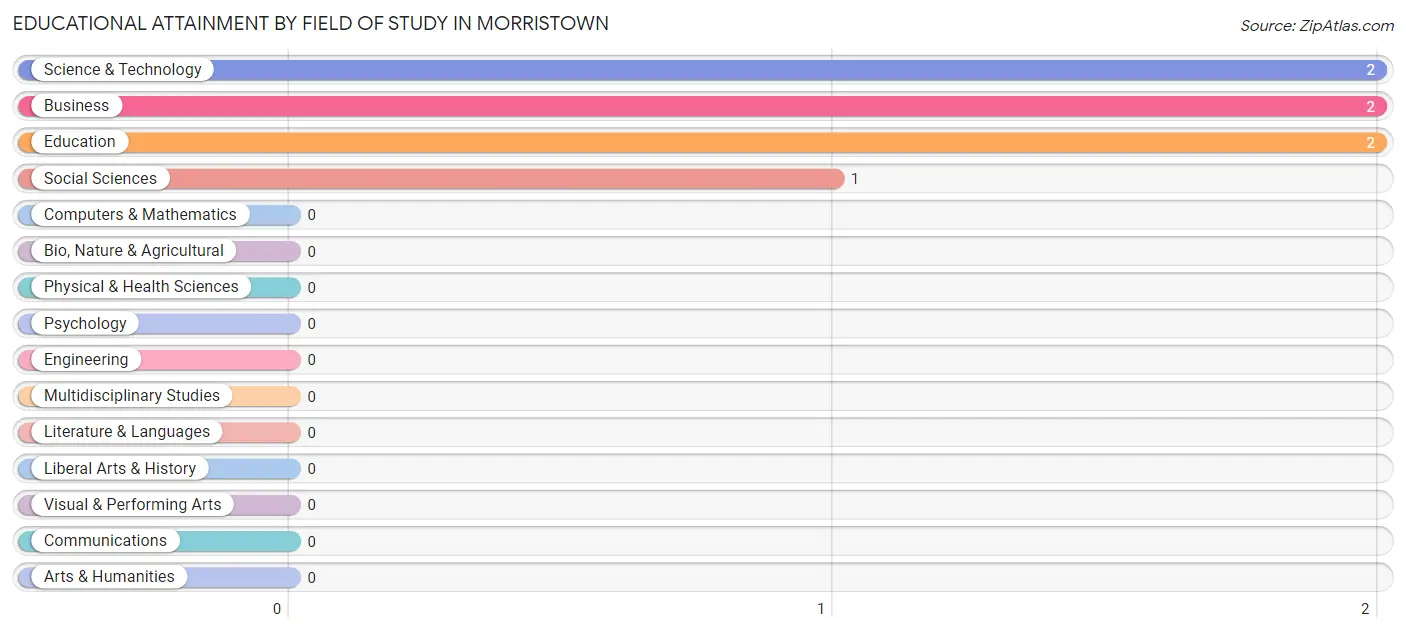
| Field of Study | # Graduates | % Graduates |
| Computers & Mathematics | 0 | 0.0% |
| Bio, Nature & Agricultural | 0 | 0.0% |
| Physical & Health Sciences | 0 | 0.0% |
| Psychology | 0 | 0.0% |
| Social Sciences | 1 | 14.3% |
| Engineering | 0 | 0.0% |
| Multidisciplinary Studies | 0 | 0.0% |
| Science & Technology | 2 | 28.6% |
| Business | 2 | 28.6% |
| Education | 2 | 28.6% |
| Literature & Languages | 0 | 0.0% |
| Liberal Arts & History | 0 | 0.0% |
| Visual & Performing Arts | 0 | 0.0% |
| Communications | 0 | 0.0% |
| Arts & Humanities | 0 | 0.0% |
| Total | 7 | 100.0% |
Transportation & Commute in Morristown
Vehicle Availability by Sex in Morristown
The most prevalent vehicle ownership categories in Morristown are males with 1 vehicle (8, accounting for 40.0%) and females with 1 vehicle (2, making up 47.1%).
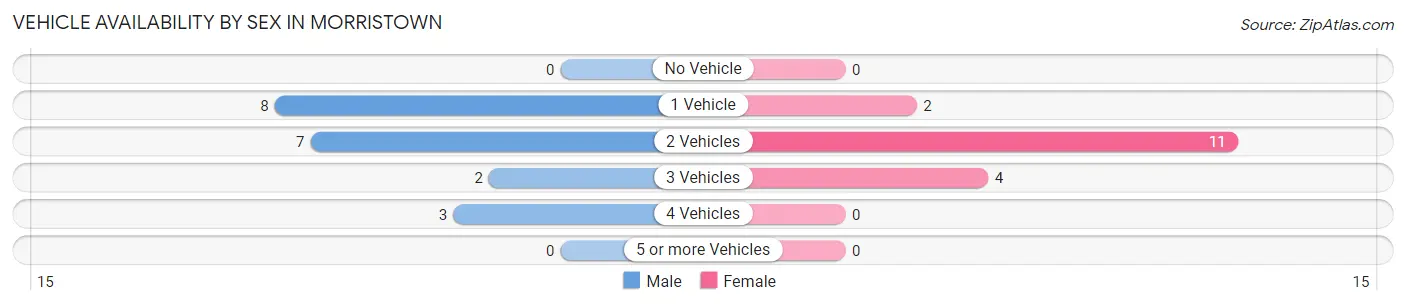
| Vehicles Available | Male | Female |
| No Vehicle | 0 (0.0%) | 0 (0.0%) |
| 1 Vehicle | 8 (40.0%) | 2 (11.8%) |
| 2 Vehicles | 7 (35.0%) | 11 (64.7%) |
| 3 Vehicles | 2 (10.0%) | 4 (23.5%) |
| 4 Vehicles | 3 (15.0%) | 0 (0.0%) |
| 5 or more Vehicles | 0 (0.0%) | 0 (0.0%) |
| Total | 20 (100.0%) | 17 (100.0%) |
Commute Time in Morristown
The most frequently occuring commute durations in Morristown are 20 to 24 minutes (7 commuters, 21.9%), 15 to 19 minutes (6 commuters, 18.8%), and 5 to 9 minutes (5 commuters, 15.6%).
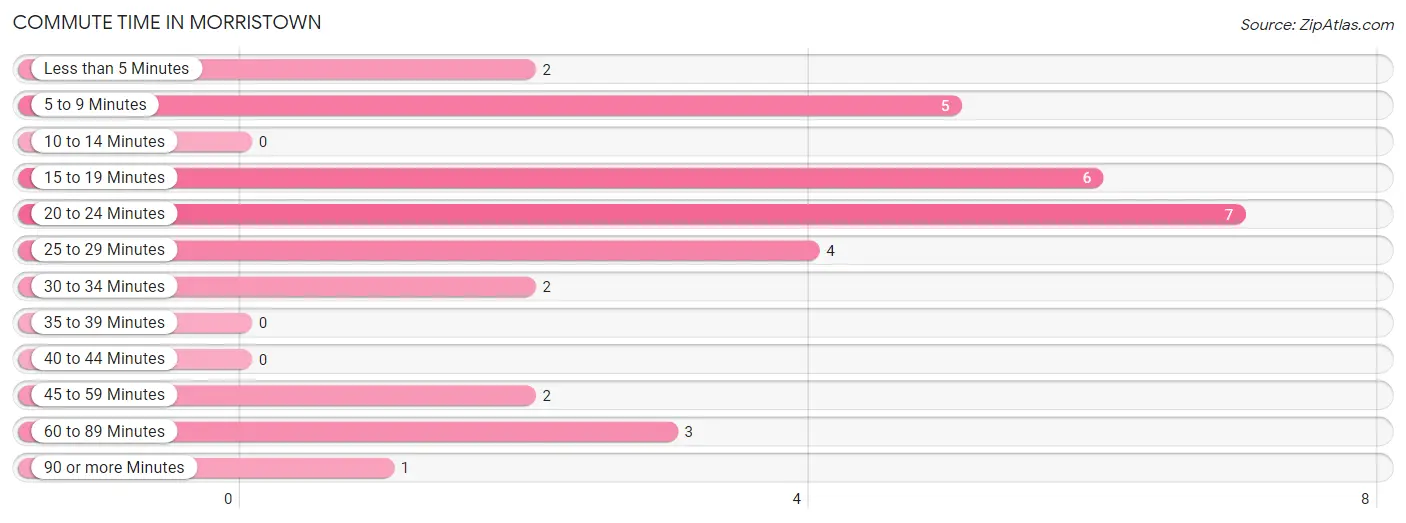
| Commute Time | # Commuters | % Commuters |
| Less than 5 Minutes | 2 | 6.2% |
| 5 to 9 Minutes | 5 | 15.6% |
| 10 to 14 Minutes | 0 | 0.0% |
| 15 to 19 Minutes | 6 | 18.8% |
| 20 to 24 Minutes | 7 | 21.9% |
| 25 to 29 Minutes | 4 | 12.5% |
| 30 to 34 Minutes | 2 | 6.2% |
| 35 to 39 Minutes | 0 | 0.0% |
| 40 to 44 Minutes | 0 | 0.0% |
| 45 to 59 Minutes | 2 | 6.2% |
| 60 to 89 Minutes | 3 | 9.4% |
| 90 or more Minutes | 1 | 3.1% |
Commute Time by Sex in Morristown
The most common commute times in Morristown are 5 to 9 minutes (4 commuters, 26.7%) for males and 20 to 24 minutes (5 commuters, 29.4%) for females.
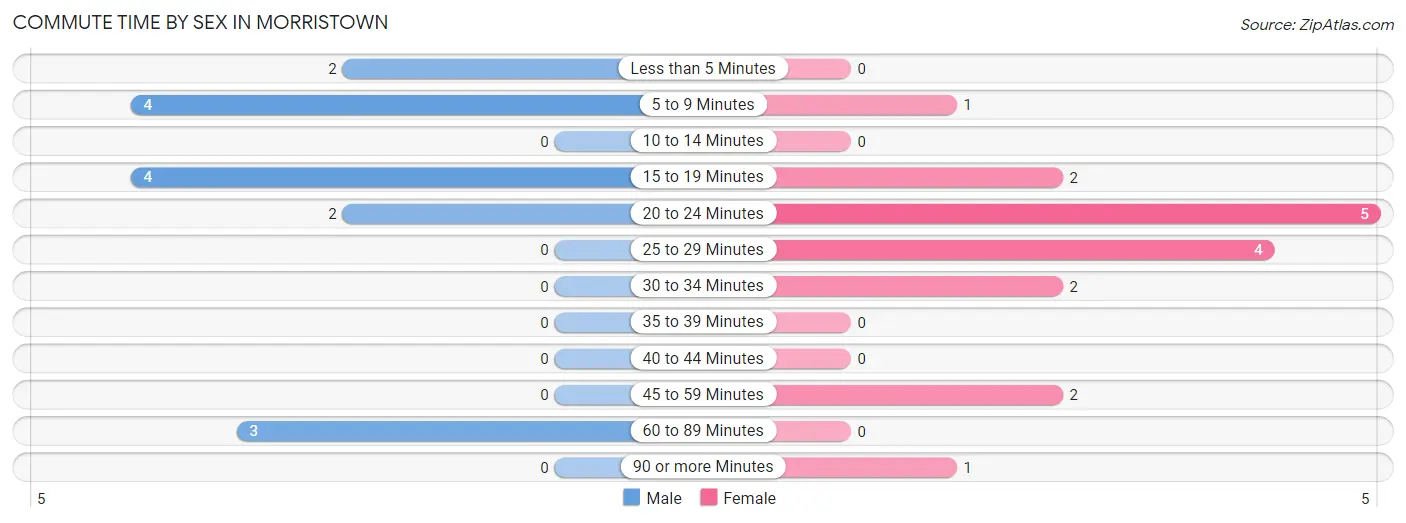
| Commute Time | Male | Female |
| Less than 5 Minutes | 2 (13.3%) | 0 (0.0%) |
| 5 to 9 Minutes | 4 (26.7%) | 1 (5.9%) |
| 10 to 14 Minutes | 0 (0.0%) | 0 (0.0%) |
| 15 to 19 Minutes | 4 (26.7%) | 2 (11.8%) |
| 20 to 24 Minutes | 2 (13.3%) | 5 (29.4%) |
| 25 to 29 Minutes | 0 (0.0%) | 4 (23.5%) |
| 30 to 34 Minutes | 0 (0.0%) | 2 (11.8%) |
| 35 to 39 Minutes | 0 (0.0%) | 0 (0.0%) |
| 40 to 44 Minutes | 0 (0.0%) | 0 (0.0%) |
| 45 to 59 Minutes | 0 (0.0%) | 2 (11.8%) |
| 60 to 89 Minutes | 3 (20.0%) | 0 (0.0%) |
| 90 or more Minutes | 0 (0.0%) | 1 (5.9%) |
Time of Departure to Work by Sex in Morristown
The most frequent times of departure to work in Morristown are 10:00 AM to 10:59 AM (5, 33.3%) for males and 6:30 AM to 6:59 AM (5, 29.4%) for females.
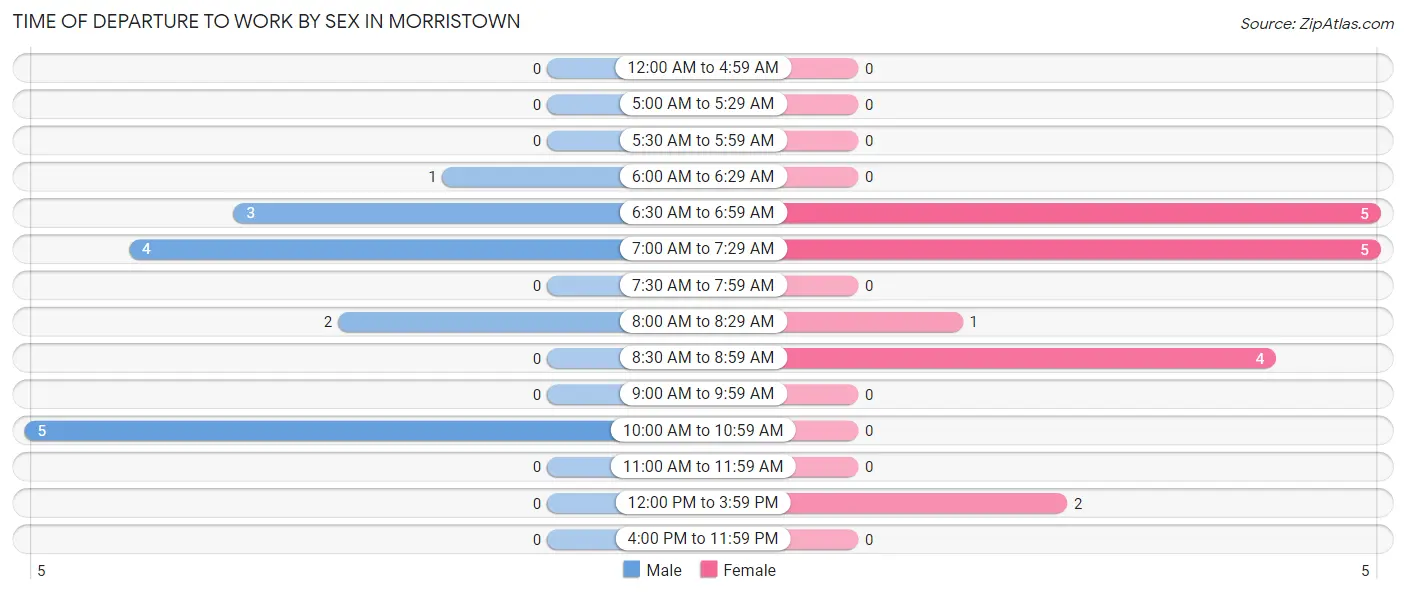
| Time of Departure | Male | Female |
| 12:00 AM to 4:59 AM | 0 (0.0%) | 0 (0.0%) |
| 5:00 AM to 5:29 AM | 0 (0.0%) | 0 (0.0%) |
| 5:30 AM to 5:59 AM | 0 (0.0%) | 0 (0.0%) |
| 6:00 AM to 6:29 AM | 1 (6.7%) | 0 (0.0%) |
| 6:30 AM to 6:59 AM | 3 (20.0%) | 5 (29.4%) |
| 7:00 AM to 7:29 AM | 4 (26.7%) | 5 (29.4%) |
| 7:30 AM to 7:59 AM | 0 (0.0%) | 0 (0.0%) |
| 8:00 AM to 8:29 AM | 2 (13.3%) | 1 (5.9%) |
| 8:30 AM to 8:59 AM | 0 (0.0%) | 4 (23.5%) |
| 9:00 AM to 9:59 AM | 0 (0.0%) | 0 (0.0%) |
| 10:00 AM to 10:59 AM | 5 (33.3%) | 0 (0.0%) |
| 11:00 AM to 11:59 AM | 0 (0.0%) | 0 (0.0%) |
| 12:00 PM to 3:59 PM | 0 (0.0%) | 2 (11.8%) |
| 4:00 PM to 11:59 PM | 0 (0.0%) | 0 (0.0%) |
| Total | 15 (100.0%) | 17 (100.0%) |
Housing Occupancy in Morristown
Occupancy by Ownership in Morristown
Of the total 39 dwellings in Morristown, owner-occupied units account for 36 (92.3%), while renter-occupied units make up 3 (7.7%).
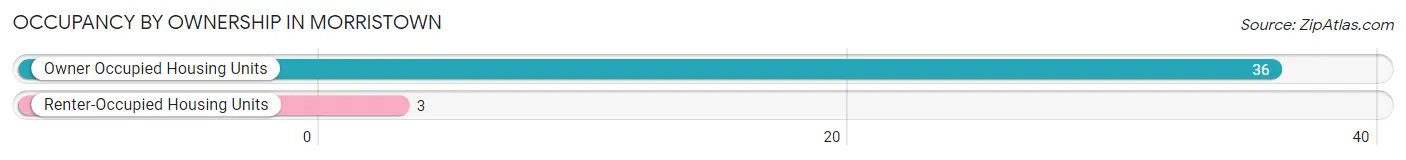
| Occupancy | # Housing Units | % Housing Units |
| Owner Occupied Housing Units | 36 | 92.3% |
| Renter-Occupied Housing Units | 3 | 7.7% |
| Total Occupied Housing Units | 39 | 100.0% |
Occupancy by Household Size in Morristown
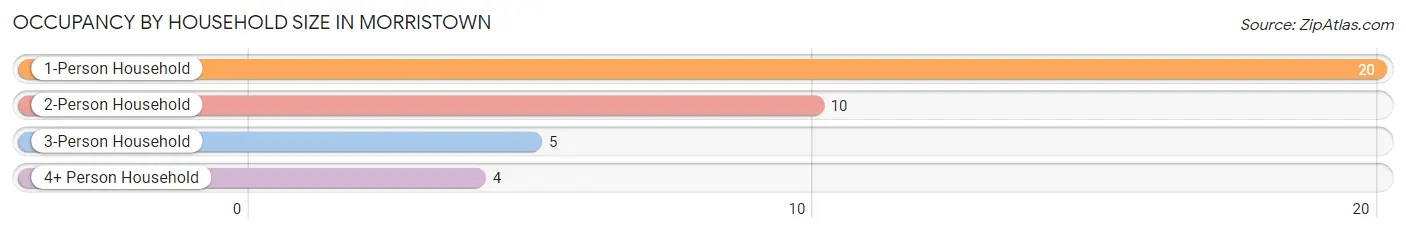
| Household Size | # Housing Units | % Housing Units |
| 1-Person Household | 20 | 51.3% |
| 2-Person Household | 10 | 25.6% |
| 3-Person Household | 5 | 12.8% |
| 4+ Person Household | 4 | 10.3% |
| Total Housing Units | 39 | 100.0% |
Occupancy by Ownership by Household Size in Morristown
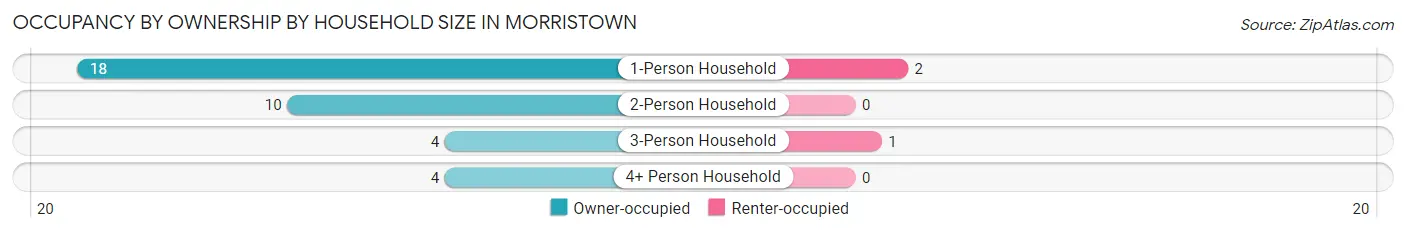
| Household Size | Owner-occupied | Renter-occupied |
| 1-Person Household | 18 (90.0%) | 2 (10.0%) |
| 2-Person Household | 10 (100.0%) | 0 (0.0%) |
| 3-Person Household | 4 (80.0%) | 1 (20.0%) |
| 4+ Person Household | 4 (100.0%) | 0 (0.0%) |
| Total Housing Units | 36 (92.3%) | 3 (7.7%) |
Occupancy by Educational Attainment in Morristown
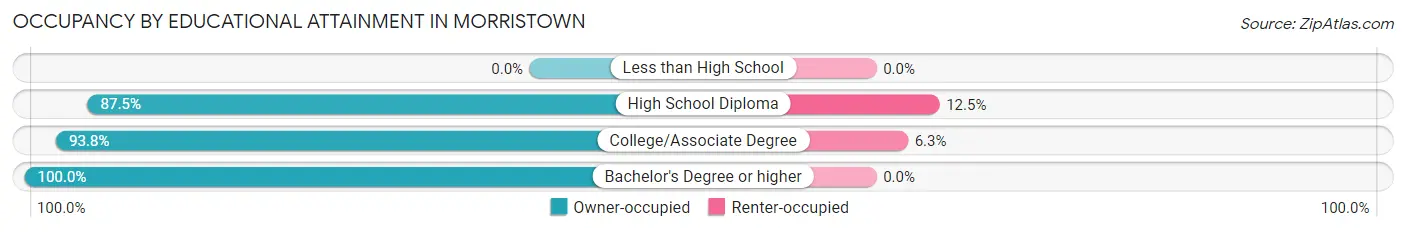
| Household Size | Owner-occupied | Renter-occupied |
| Less than High School | 0 (0.0%) | 0 (0.0%) |
| High School Diploma | 14 (87.5%) | 2 (12.5%) |
| College/Associate Degree | 15 (93.8%) | 1 (6.2%) |
| Bachelor's Degree or higher | 7 (100.0%) | 0 (0.0%) |
Occupancy by Age of Householder in Morristown
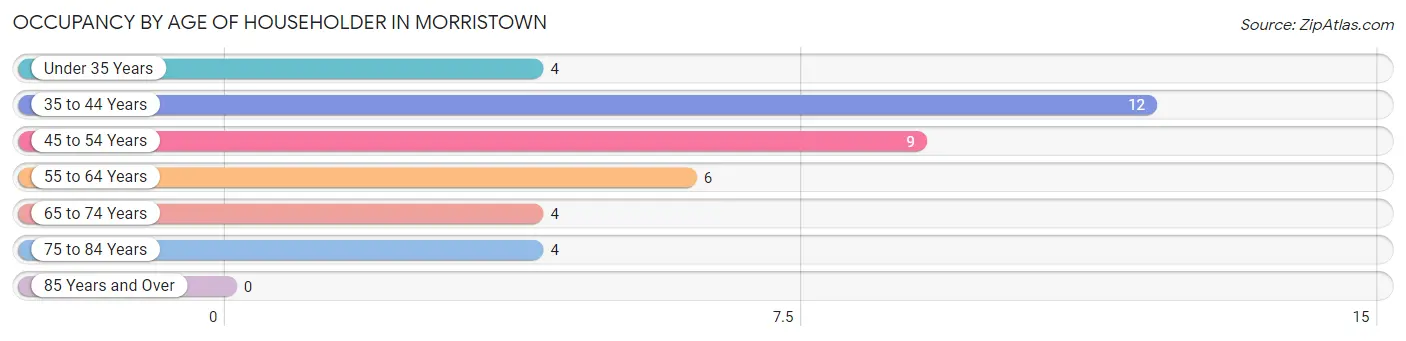
| Age Bracket | # Households | % Households |
| Under 35 Years | 4 | 10.3% |
| 35 to 44 Years | 12 | 30.8% |
| 45 to 54 Years | 9 | 23.1% |
| 55 to 64 Years | 6 | 15.4% |
| 65 to 74 Years | 4 | 10.3% |
| 75 to 84 Years | 4 | 10.3% |
| 85 Years and Over | 0 | 0.0% |
| Total | 39 | 100.0% |
Housing Finances in Morristown
Median Income by Occupancy in Morristown
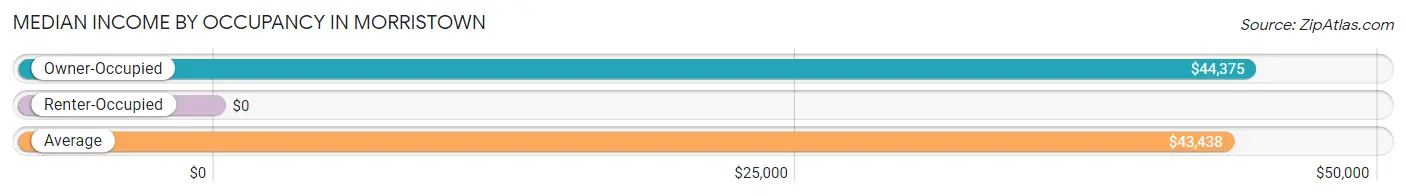
| Occupancy Type | # Households | Median Income |
| Owner-Occupied | 36 (92.3%) | $44,375 |
| Renter-Occupied | 3 (7.7%) | $0 |
| Average | 39 (100.0%) | $43,438 |
Occupancy by Householder Income Bracket in Morristown
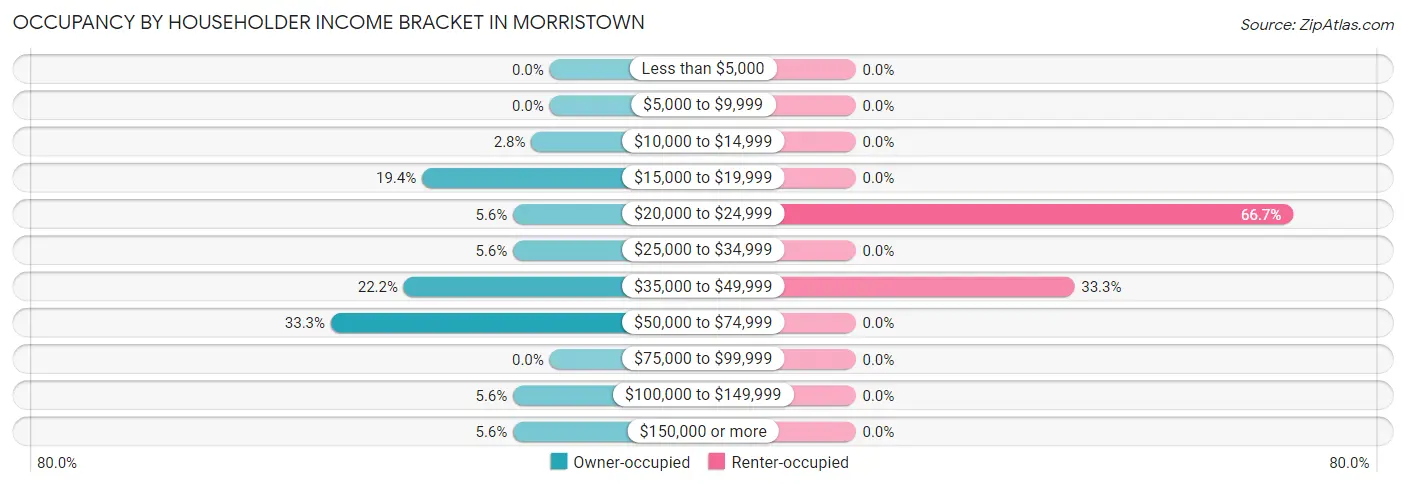
| Income Bracket | Owner-occupied | Renter-occupied |
| Less than $5,000 | 0 (0.0%) | 0 (0.0%) |
| $5,000 to $9,999 | 0 (0.0%) | 0 (0.0%) |
| $10,000 to $14,999 | 1 (2.8%) | 0 (0.0%) |
| $15,000 to $19,999 | 7 (19.4%) | 0 (0.0%) |
| $20,000 to $24,999 | 2 (5.6%) | 2 (66.7%) |
| $25,000 to $34,999 | 2 (5.6%) | 0 (0.0%) |
| $35,000 to $49,999 | 8 (22.2%) | 1 (33.3%) |
| $50,000 to $74,999 | 12 (33.3%) | 0 (0.0%) |
| $75,000 to $99,999 | 0 (0.0%) | 0 (0.0%) |
| $100,000 to $149,999 | 2 (5.6%) | 0 (0.0%) |
| $150,000 or more | 2 (5.6%) | 0 (0.0%) |
| Total | 36 (100.0%) | 3 (100.0%) |
Monthly Housing Cost Tiers in Morristown
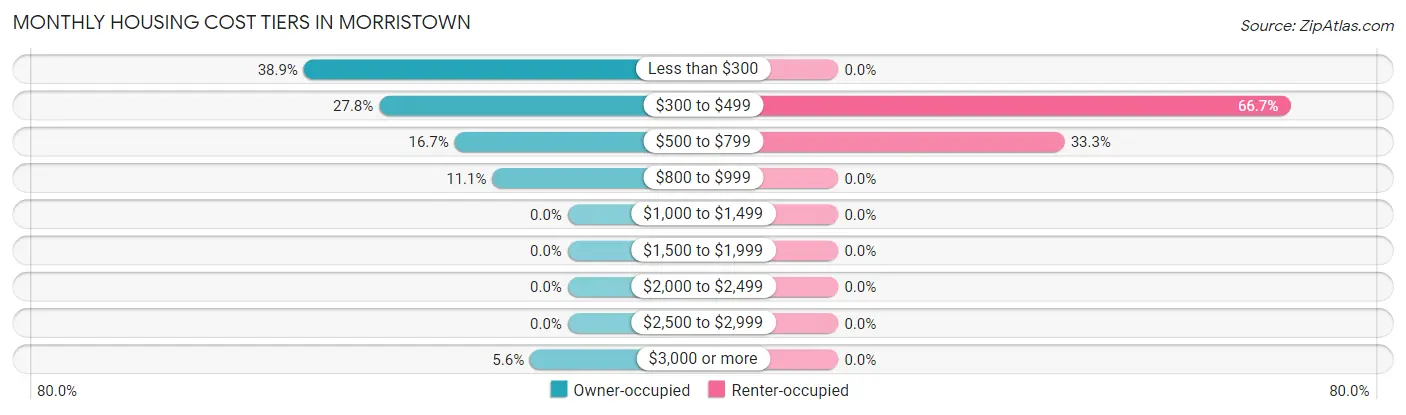
| Monthly Cost | Owner-occupied | Renter-occupied |
| Less than $300 | 14 (38.9%) | 0 (0.0%) |
| $300 to $499 | 10 (27.8%) | 2 (66.7%) |
| $500 to $799 | 6 (16.7%) | 1 (33.3%) |
| $800 to $999 | 4 (11.1%) | 0 (0.0%) |
| $1,000 to $1,499 | 0 (0.0%) | 0 (0.0%) |
| $1,500 to $1,999 | 0 (0.0%) | 0 (0.0%) |
| $2,000 to $2,499 | 0 (0.0%) | 0 (0.0%) |
| $2,500 to $2,999 | 0 (0.0%) | 0 (0.0%) |
| $3,000 or more | 2 (5.6%) | 0 (0.0%) |
| Total | 36 (100.0%) | 3 (100.0%) |
Physical Housing Characteristics in Morristown
Housing Structures in Morristown
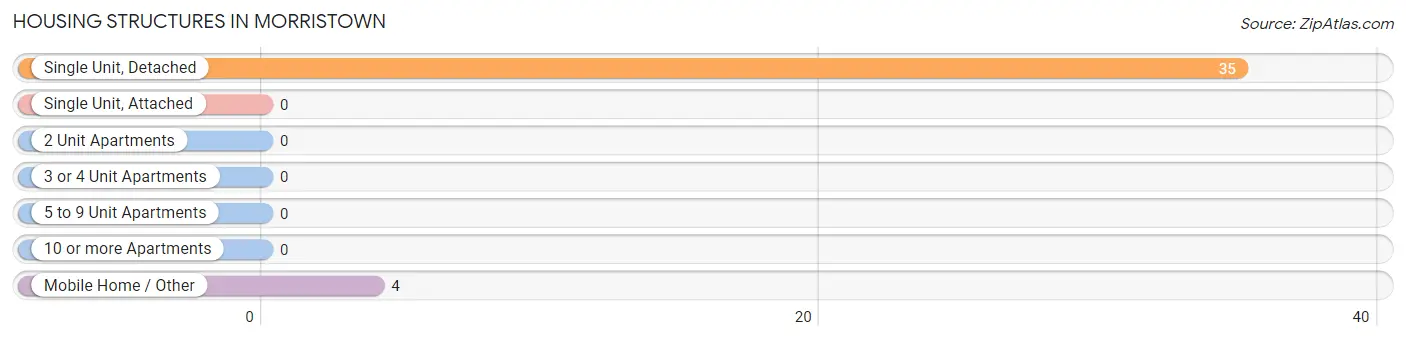
| Structure Type | # Housing Units | % Housing Units |
| Single Unit, Detached | 35 | 89.7% |
| Single Unit, Attached | 0 | 0.0% |
| 2 Unit Apartments | 0 | 0.0% |
| 3 or 4 Unit Apartments | 0 | 0.0% |
| 5 to 9 Unit Apartments | 0 | 0.0% |
| 10 or more Apartments | 0 | 0.0% |
| Mobile Home / Other | 4 | 10.3% |
| Total | 39 | 100.0% |
Housing Structures by Occupancy in Morristown
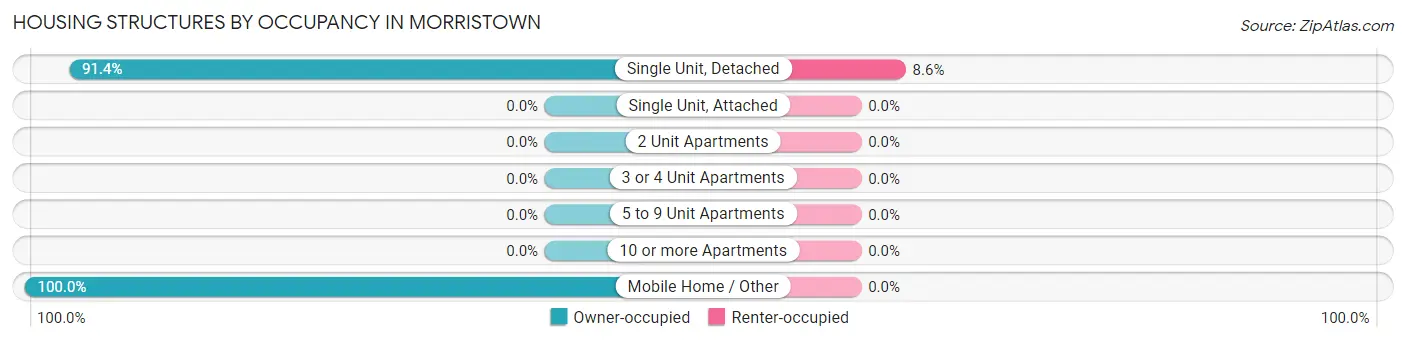
| Structure Type | Owner-occupied | Renter-occupied |
| Single Unit, Detached | 32 (91.4%) | 3 (8.6%) |
| Single Unit, Attached | 0 (0.0%) | 0 (0.0%) |
| 2 Unit Apartments | 0 (0.0%) | 0 (0.0%) |
| 3 or 4 Unit Apartments | 0 (0.0%) | 0 (0.0%) |
| 5 to 9 Unit Apartments | 0 (0.0%) | 0 (0.0%) |
| 10 or more Apartments | 0 (0.0%) | 0 (0.0%) |
| Mobile Home / Other | 4 (100.0%) | 0 (0.0%) |
| Total | 36 (92.3%) | 3 (7.7%) |
Housing Structures by Number of Rooms in Morristown
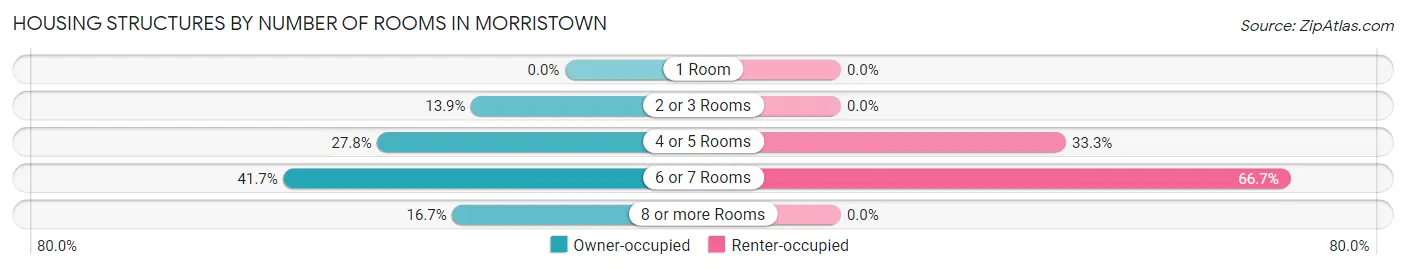
| Number of Rooms | Owner-occupied | Renter-occupied |
| 1 Room | 0 (0.0%) | 0 (0.0%) |
| 2 or 3 Rooms | 5 (13.9%) | 0 (0.0%) |
| 4 or 5 Rooms | 10 (27.8%) | 1 (33.3%) |
| 6 or 7 Rooms | 15 (41.7%) | 2 (66.7%) |
| 8 or more Rooms | 6 (16.7%) | 0 (0.0%) |
| Total | 36 (100.0%) | 3 (100.0%) |
Housing Structure by Heating Type in Morristown
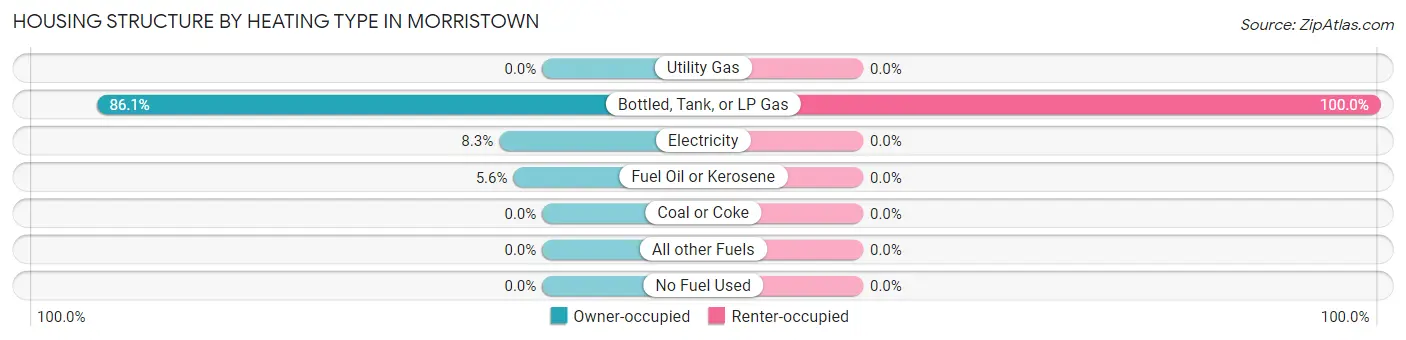
| Heating Type | Owner-occupied | Renter-occupied |
| Utility Gas | 0 (0.0%) | 0 (0.0%) |
| Bottled, Tank, or LP Gas | 31 (86.1%) | 3 (100.0%) |
| Electricity | 3 (8.3%) | 0 (0.0%) |
| Fuel Oil or Kerosene | 2 (5.6%) | 0 (0.0%) |
| Coal or Coke | 0 (0.0%) | 0 (0.0%) |
| All other Fuels | 0 (0.0%) | 0 (0.0%) |
| No Fuel Used | 0 (0.0%) | 0 (0.0%) |
| Total | 36 (100.0%) | 3 (100.0%) |
Household Vehicle Usage in Morristown
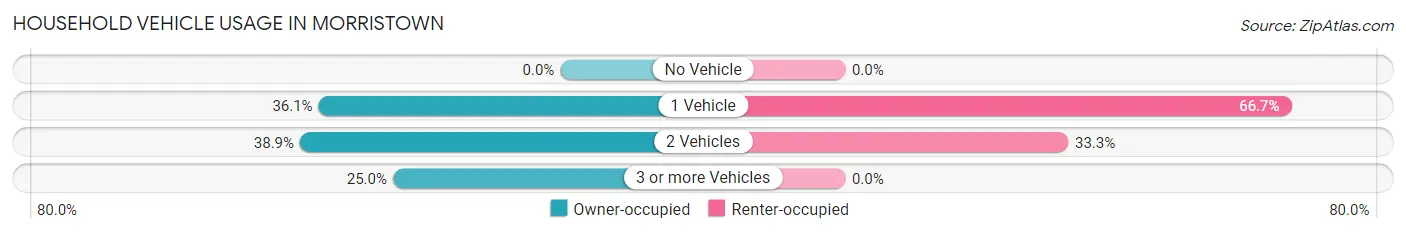
| Vehicles per Household | Owner-occupied | Renter-occupied |
| No Vehicle | 0 (0.0%) | 0 (0.0%) |
| 1 Vehicle | 13 (36.1%) | 2 (66.7%) |
| 2 Vehicles | 14 (38.9%) | 1 (33.3%) |
| 3 or more Vehicles | 9 (25.0%) | 0 (0.0%) |
| Total | 36 (100.0%) | 3 (100.0%) |
Real Estate & Mortgages in Morristown
Real Estate and Mortgage Overview in Morristown
| Characteristic | Without Mortgage | With Mortgage |
| Housing Units | 27 | 9 |
| Median Property Value | $23,100 | $0 |
| Median Household Income | $38,750 | $0 |
| Monthly Housing Costs | $296 | $2 |
| Real Estate Taxes | $344 | $0 |
Property Value by Mortgage Status in Morristown
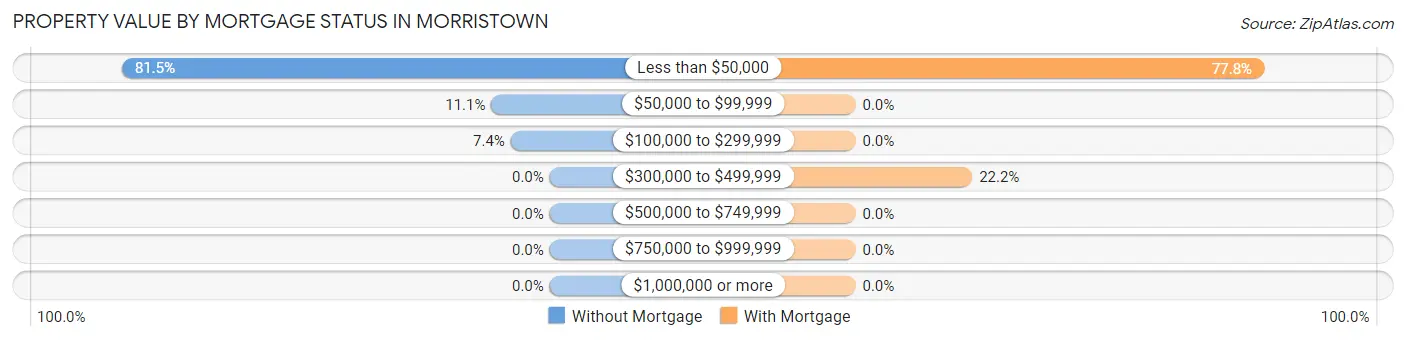
| Property Value | Without Mortgage | With Mortgage |
| Less than $50,000 | 22 (81.5%) | 7 (77.8%) |
| $50,000 to $99,999 | 3 (11.1%) | 0 (0.0%) |
| $100,000 to $299,999 | 2 (7.4%) | 0 (0.0%) |
| $300,000 to $499,999 | 0 (0.0%) | 2 (22.2%) |
| $500,000 to $749,999 | 0 (0.0%) | 0 (0.0%) |
| $750,000 to $999,999 | 0 (0.0%) | 0 (0.0%) |
| $1,000,000 or more | 0 (0.0%) | 0 (0.0%) |
| Total | 27 (100.0%) | 9 (100.0%) |
Household Income by Mortgage Status in Morristown
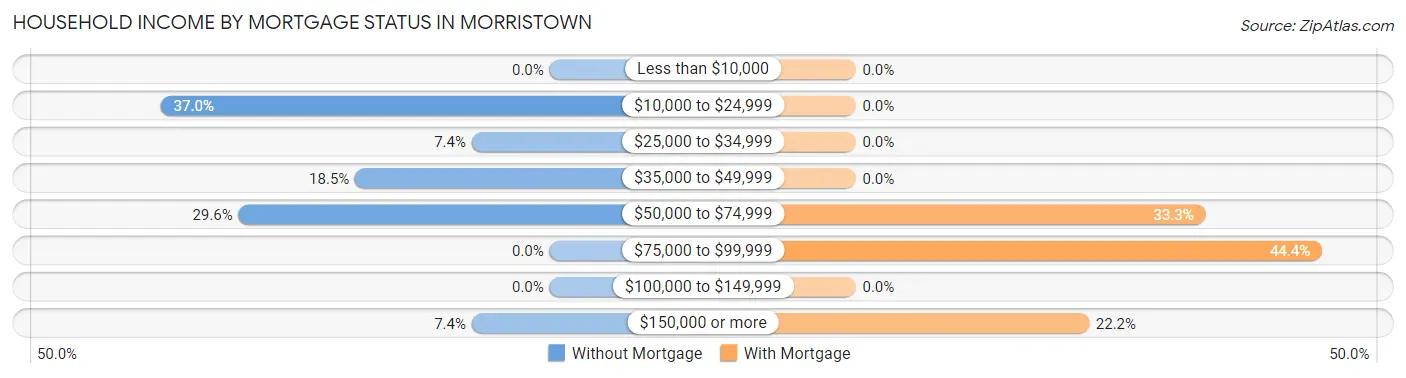
| Household Income | Without Mortgage | With Mortgage |
| Less than $10,000 | 0 (0.0%) | 0 (0.0%) |
| $10,000 to $24,999 | 10 (37.0%) | 0 (0.0%) |
| $25,000 to $34,999 | 2 (7.4%) | 0 (0.0%) |
| $35,000 to $49,999 | 5 (18.5%) | 0 (0.0%) |
| $50,000 to $74,999 | 8 (29.6%) | 3 (33.3%) |
| $75,000 to $99,999 | 0 (0.0%) | 4 (44.4%) |
| $100,000 to $149,999 | 0 (0.0%) | 0 (0.0%) |
| $150,000 or more | 2 (7.4%) | 2 (22.2%) |
| Total | 27 (100.0%) | 9 (100.0%) |
Property Value to Household Income Ratio in Morristown
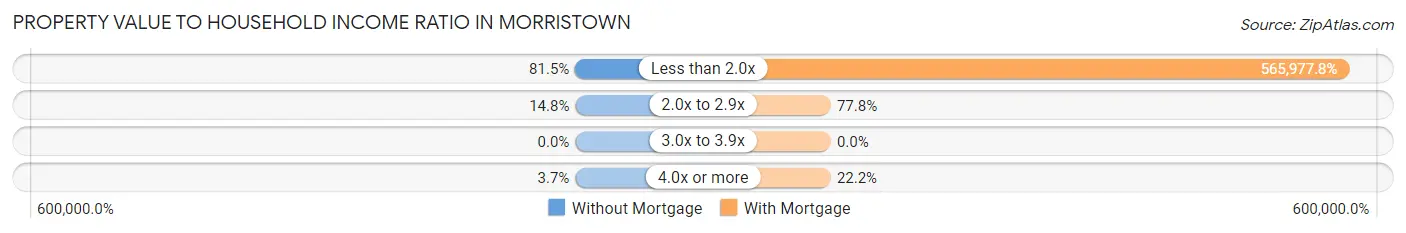
| Value-to-Income Ratio | Without Mortgage | With Mortgage |
| Less than 2.0x | 22 (81.5%) | 50,938 (565,977.8%) |
| 2.0x to 2.9x | 4 (14.8%) | 7 (77.8%) |
| 3.0x to 3.9x | 0 (0.0%) | 0 (0.0%) |
| 4.0x or more | 1 (3.7%) | 2 (22.2%) |
| Total | 27 (100.0%) | 9 (100.0%) |
Real Estate Taxes by Mortgage Status in Morristown
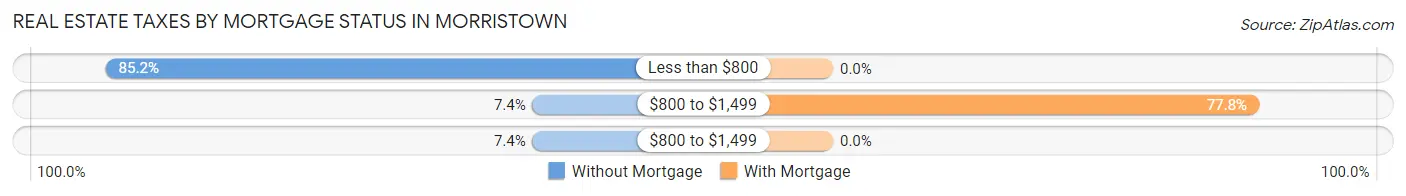
| Property Taxes | Without Mortgage | With Mortgage |
| Less than $800 | 23 (85.2%) | 0 (0.0%) |
| $800 to $1,499 | 2 (7.4%) | 7 (77.8%) |
| $800 to $1,499 | 2 (7.4%) | 0 (0.0%) |
| Total | 27 (100.0%) | 9 (100.0%) |
Health & Disability in Morristown
Health Insurance Coverage by Age in Morristown
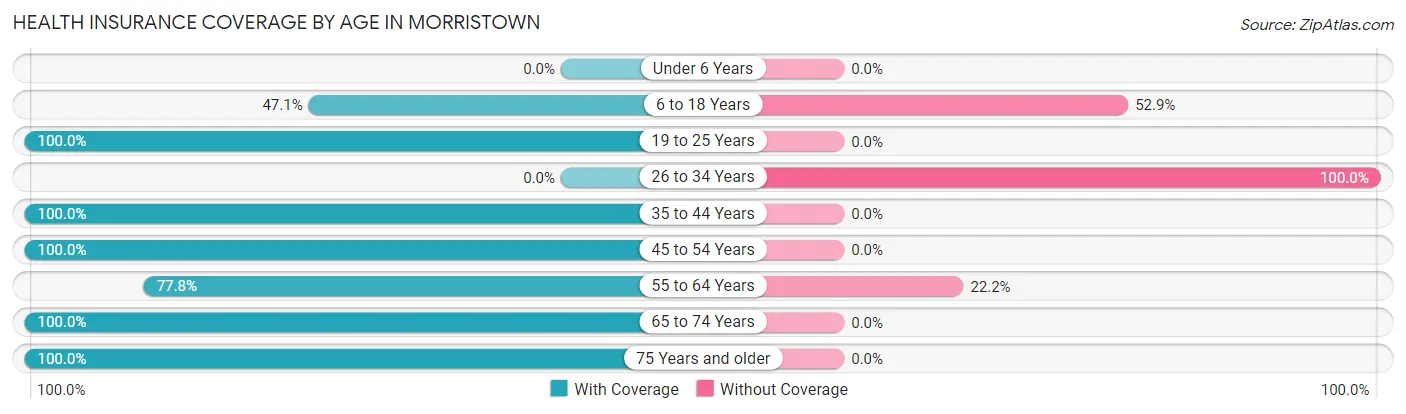
| Age Bracket | With Coverage | Without Coverage |
| Under 6 Years | 0 (0.0%) | 0 (0.0%) |
| 6 to 18 Years | 8 (47.1%) | 9 (52.9%) |
| 19 to 25 Years | 5 (100.0%) | 0 (0.0%) |
| 26 to 34 Years | 0 (0.0%) | 1 (100.0%) |
| 35 to 44 Years | 12 (100.0%) | 0 (0.0%) |
| 45 to 54 Years | 10 (100.0%) | 0 (0.0%) |
| 55 to 64 Years | 7 (77.8%) | 2 (22.2%) |
| 65 to 74 Years | 6 (100.0%) | 0 (0.0%) |
| 75 Years and older | 5 (100.0%) | 0 (0.0%) |
| Total | 53 (81.5%) | 12 (18.5%) |
Health Insurance Coverage by Citizenship Status in Morristown
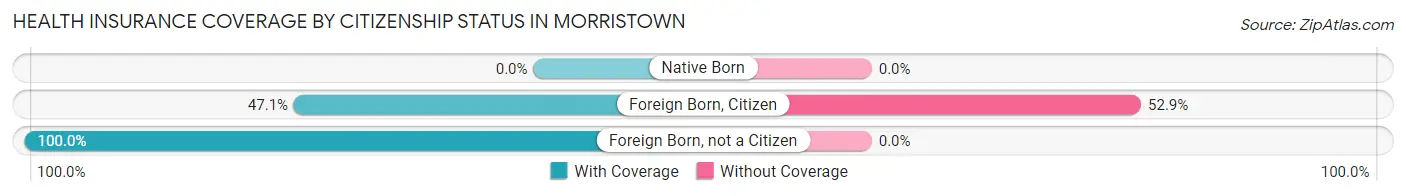
| Citizenship Status | With Coverage | Without Coverage |
| Native Born | 0 (0.0%) | 0 (0.0%) |
| Foreign Born, Citizen | 8 (47.1%) | 9 (52.9%) |
| Foreign Born, not a Citizen | 5 (100.0%) | 0 (0.0%) |
Health Insurance Coverage by Household Income in Morristown
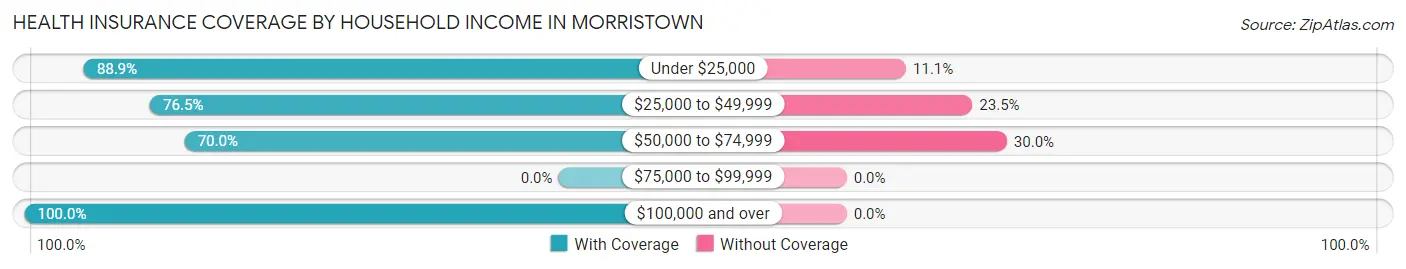
| Household Income | With Coverage | Without Coverage |
| Under $25,000 | 16 (88.9%) | 2 (11.1%) |
| $25,000 to $49,999 | 13 (76.5%) | 4 (23.5%) |
| $50,000 to $74,999 | 14 (70.0%) | 6 (30.0%) |
| $75,000 to $99,999 | 0 (0.0%) | 0 (0.0%) |
| $100,000 and over | 10 (100.0%) | 0 (0.0%) |
Public vs Private Health Insurance Coverage by Age in Morristown
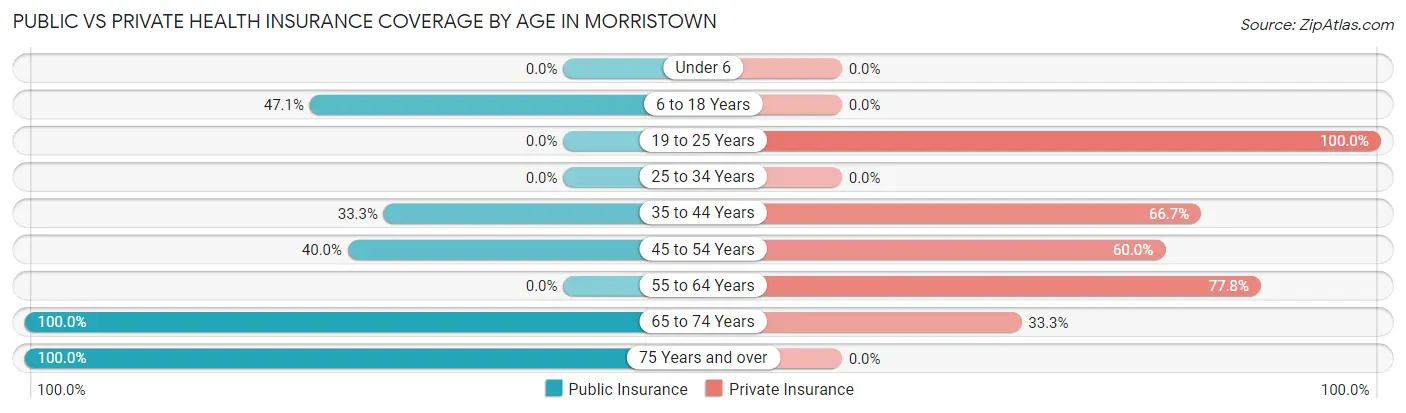
| Age Bracket | Public Insurance | Private Insurance |
| Under 6 | 0 (0.0%) | 0 (0.0%) |
| 6 to 18 Years | 8 (47.1%) | 0 (0.0%) |
| 19 to 25 Years | 0 (0.0%) | 5 (100.0%) |
| 25 to 34 Years | 0 (0.0%) | 0 (0.0%) |
| 35 to 44 Years | 4 (33.3%) | 8 (66.7%) |
| 45 to 54 Years | 4 (40.0%) | 6 (60.0%) |
| 55 to 64 Years | 0 (0.0%) | 7 (77.8%) |
| 65 to 74 Years | 6 (100.0%) | 2 (33.3%) |
| 75 Years and over | 5 (100.0%) | 0 (0.0%) |
| Total | 27 (41.5%) | 28 (43.1%) |
Disability Status by Sex by Age in Morristown
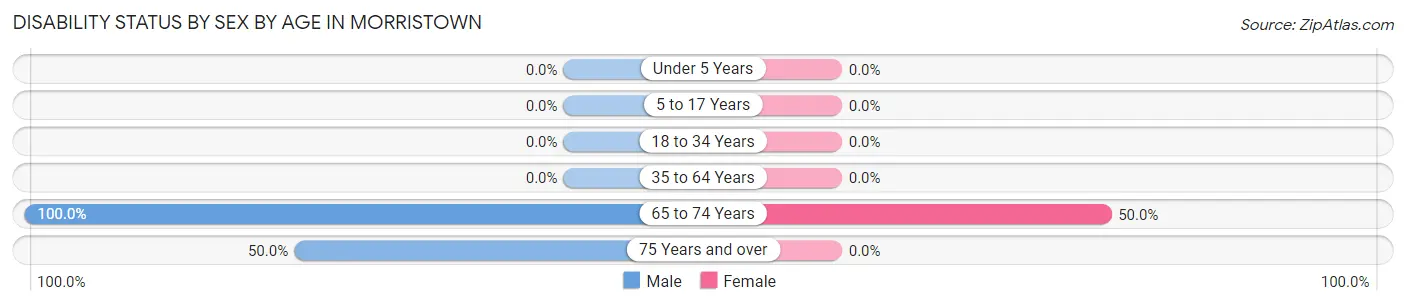
| Age Bracket | Male | Female |
| Under 5 Years | 0 (0.0%) | 0 (0.0%) |
| 5 to 17 Years | 0 (0.0%) | 0 (0.0%) |
| 18 to 34 Years | 0 (0.0%) | 0 (0.0%) |
| 35 to 64 Years | 0 (0.0%) | 0 (0.0%) |
| 65 to 74 Years | 2 (100.0%) | 2 (50.0%) |
| 75 Years and over | 2 (50.0%) | 0 (0.0%) |
Disability Class by Sex by Age in Morristown
Disability Class: Hearing Difficulty
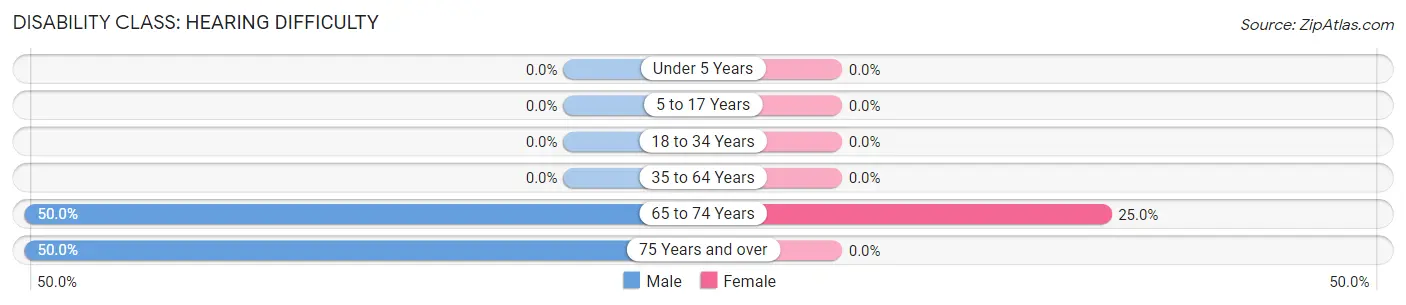
| Age Bracket | Male | Female |
| Under 5 Years | 0 (0.0%) | 0 (0.0%) |
| 5 to 17 Years | 0 (0.0%) | 0 (0.0%) |
| 18 to 34 Years | 0 (0.0%) | 0 (0.0%) |
| 35 to 64 Years | 0 (0.0%) | 0 (0.0%) |
| 65 to 74 Years | 1 (50.0%) | 1 (25.0%) |
| 75 Years and over | 2 (50.0%) | 0 (0.0%) |
Disability Class: Vision Difficulty
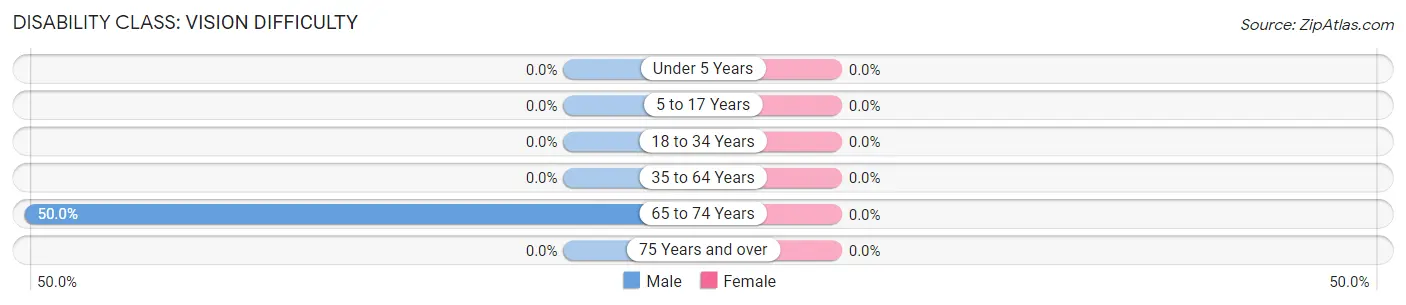
| Age Bracket | Male | Female |
| Under 5 Years | 0 (0.0%) | 0 (0.0%) |
| 5 to 17 Years | 0 (0.0%) | 0 (0.0%) |
| 18 to 34 Years | 0 (0.0%) | 0 (0.0%) |
| 35 to 64 Years | 0 (0.0%) | 0 (0.0%) |
| 65 to 74 Years | 1 (50.0%) | 0 (0.0%) |
| 75 Years and over | 0 (0.0%) | 0 (0.0%) |
Disability Class: Cognitive Difficulty
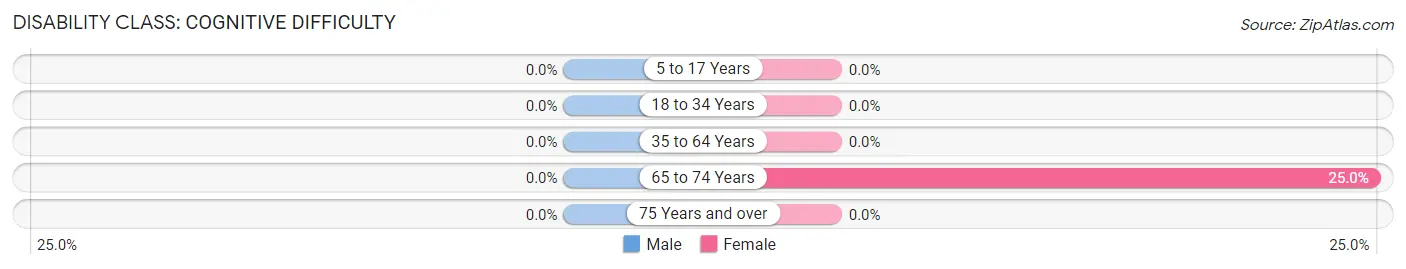
| Age Bracket | Male | Female |
| 5 to 17 Years | 0 (0.0%) | 0 (0.0%) |
| 18 to 34 Years | 0 (0.0%) | 0 (0.0%) |
| 35 to 64 Years | 0 (0.0%) | 0 (0.0%) |
| 65 to 74 Years | 0 (0.0%) | 1 (25.0%) |
| 75 Years and over | 0 (0.0%) | 0 (0.0%) |
Disability Class: Ambulatory Difficulty
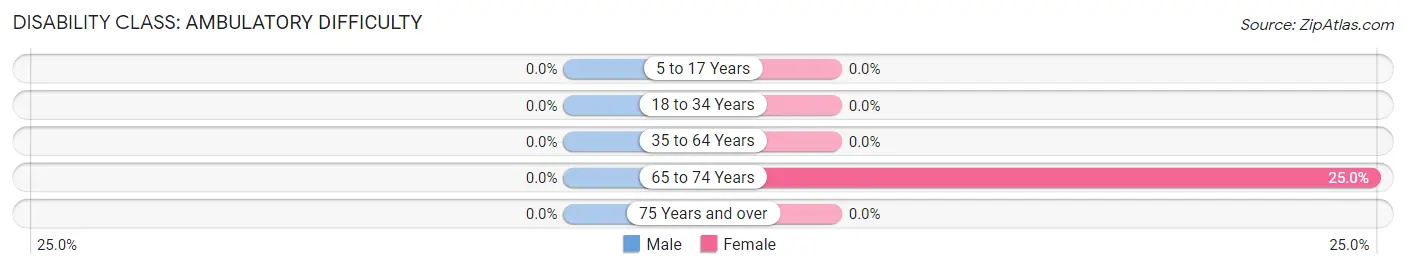
| Age Bracket | Male | Female |
| 5 to 17 Years | 0 (0.0%) | 0 (0.0%) |
| 18 to 34 Years | 0 (0.0%) | 0 (0.0%) |
| 35 to 64 Years | 0 (0.0%) | 0 (0.0%) |
| 65 to 74 Years | 0 (0.0%) | 1 (25.0%) |
| 75 Years and over | 0 (0.0%) | 0 (0.0%) |
Disability Class: Self-Care Difficulty
| Age Bracket | Male | Female |
| 5 to 17 Years | 0 (0.0%) | 0 (0.0%) |
| 18 to 34 Years | 0 (0.0%) | 0 (0.0%) |
| 35 to 64 Years | 0 (0.0%) | 0 (0.0%) |
| 65 to 74 Years | 0 (0.0%) | 0 (0.0%) |
| 75 Years and over | 0 (0.0%) | 0 (0.0%) |
Technology Access in Morristown
Computing Device Access in Morristown
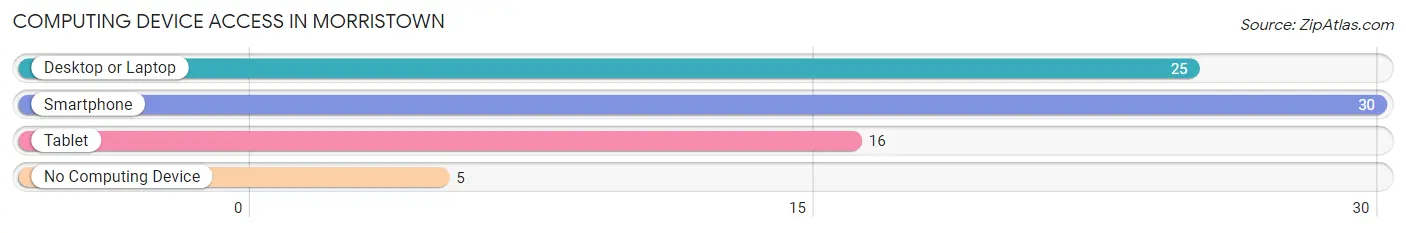
| Device Type | # Households | % Households |
| Desktop or Laptop | 25 | 64.1% |
| Smartphone | 30 | 76.9% |
| Tablet | 16 | 41.0% |
| No Computing Device | 5 | 12.8% |
| Total | 39 | 100.0% |
Internet Access in Morristown
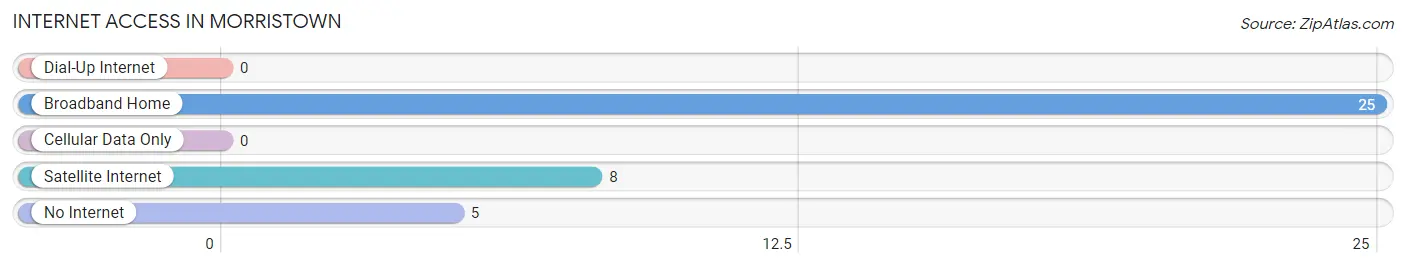
| Internet Type | # Households | % Households |
| Dial-Up Internet | 0 | 0.0% |
| Broadband Home | 25 | 64.1% |
| Cellular Data Only | 0 | 0.0% |
| Satellite Internet | 8 | 20.5% |
| No Internet | 5 | 12.8% |
| Total | 39 | 100.0% |
Morristown Summary
Morristown, South Dakota is a small town located in the southeastern corner of the state. It is situated in the rolling hills of the Missouri River Valley, and is surrounded by the scenic beauty of the Black Hills. The town was founded in 1883 by a group of settlers from Wisconsin, and was named after the nearby Morristown Township.
Geography
Morristown is located in the southeastern corner of South Dakota, in the Missouri River Valley. It is situated in the rolling hills of the Black Hills, and is surrounded by the scenic beauty of the area. The town is located at an elevation of 2,845 feet, and has a total area of 0.6 square miles. The climate in Morristown is semi-arid, with hot summers and cold winters.
Economy
The economy of Morristown is largely based on agriculture and tourism. The town is home to several small businesses, including a grocery store, a hardware store, and a few restaurants. The town also has a small airport, which serves as a hub for recreational and business travelers.
Agriculture is the main source of income for many of the town's residents. The area is known for its production of wheat, corn, and soybeans. The town also has a large dairy industry, and is home to several large dairy farms.
Tourism is also an important part of the local economy. The town is home to several attractions, including the Black Hills National Forest, the Badlands National Park, and the Crazy Horse Memorial. The town also hosts several festivals and events throughout the year, including the annual Morristown Days celebration.
Demographics
As of the 2010 census, the population of Morristown was 545. The racial makeup of the town was 97.3% White, 0.2% African American, 0.2% Native American, 0.2% Asian, 0.2% from other races, and 1.9% from two or more races. Hispanic or Latino of any race were 0.7% of the population.
The median income for a household in Morristown was $37,500, and the median income for a family was $45,000. The per capita income for the town was $18,845. About 8.3% of families and 10.2% of the population were below the poverty line, including 11.3% of those under age 18 and 8.3% of those age 65 or over.
Morristown is a small town with a rich history and a vibrant economy. The town is home to a diverse population, and is surrounded by the beauty of the Black Hills. The town is a great place to live, work, and visit, and is sure to provide a unique and enjoyable experience for all who visit.
Common Questions
What is Per Capita Income in Morristown?
Per Capita income in Morristown is $29,211.
What is the Median Family Income in Morristown?
Median Family Income in Morristown is $51,875.
What is the Median Household income in Morristown?
Median Household Income in Morristown is $43,438.
What is Inequality or Gini Index in Morristown?
Inequality or Gini Index in Morristown is 0.37.
What is the Total Population of Morristown?
Total Population of Morristown is 65.
What is the Total Male Population of Morristown?
Total Male Population of Morristown is 38.
What is the Total Female Population of Morristown?
Total Female Population of Morristown is 27.
What is the Ratio of Males per 100 Females in Morristown?
There are 140.74 Males per 100 Females in Morristown.
What is the Ratio of Females per 100 Males in Morristown?
There are 71.05 Females per 100 Males in Morristown.
What is the Median Population Age in Morristown?
Median Population Age in Morristown is 38.6 Years.
What is the Average Family Size in Morristown
Average Family Size in Morristown is 2.5 People.
What is the Average Household Size in Morristown
Average Household Size in Morristown is 1.7 People.
How Large is the Labor Force in Morristown?
There are 37 People in the Labor Forcein in Morristown.
What is the Percentage of People in the Labor Force in Morristown?
72.5% of People are in the Labor Force in Morristown.