Philip, SD Map & Demographics
Philip Map
Philip Overview
$24,295
PER CAPITA INCOME
$43,854
AVG FAMILY INCOME
$39,063
AVG HOUSEHOLD INCOME
50.5%
WAGE / INCOME GAP [ % ]
49.5¢/ $1
WAGE / INCOME GAP [ $ ]
0.54
INEQUALITY / GINI INDEX
503
TOTAL POPULATION
197
MALE POPULATION
306
FEMALE POPULATION
64.38
MALES / 100 FEMALES
155.33
FEMALES / 100 MALES
58.2
MEDIAN AGE
2.8
AVG FAMILY SIZE
1.9
AVG HOUSEHOLD SIZE
229
LABOR FORCE [ PEOPLE ]
50.4%
PERCENT IN LABOR FORCE
Philip Zip Codes
Philip Area Codes
Income in Philip
Income Overview in Philip
Per Capita Income in Philip is $24,295, while median incomes of families and households are $43,854 and $39,063 respectively.
| Characteristic | Number | Measure |
| Per Capita Income | 503 | $24,295 |
| Median Family Income | 115 | $43,854 |
| Mean Family Income | 115 | $66,835 |
| Median Household Income | 244 | $39,063 |
| Mean Household Income | 244 | $43,909 |
| Income Deficit | 115 | $0 |
| Wage / Income Gap (%) | 503 | 50.49% |
| Wage / Income Gap ($) | 503 | 49.51¢ per $1 |
| Gini / Inequality Index | 503 | 0.54 |
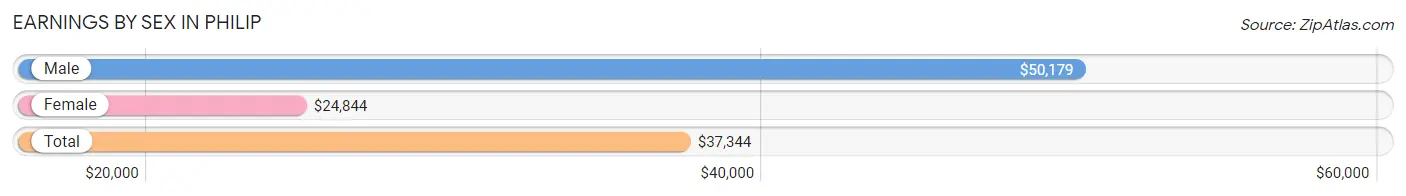
Earnings by Sex in Philip
Average Earnings in Philip are $37,344, $50,179 for men and $24,844 for women, a difference of 50.5%.
| Sex | Number | Average Earnings |
| Male | 123 (53.7%) | $50,179 |
| Female | 106 (46.3%) | $24,844 |
| Total | 229 (100.0%) | $37,344 |
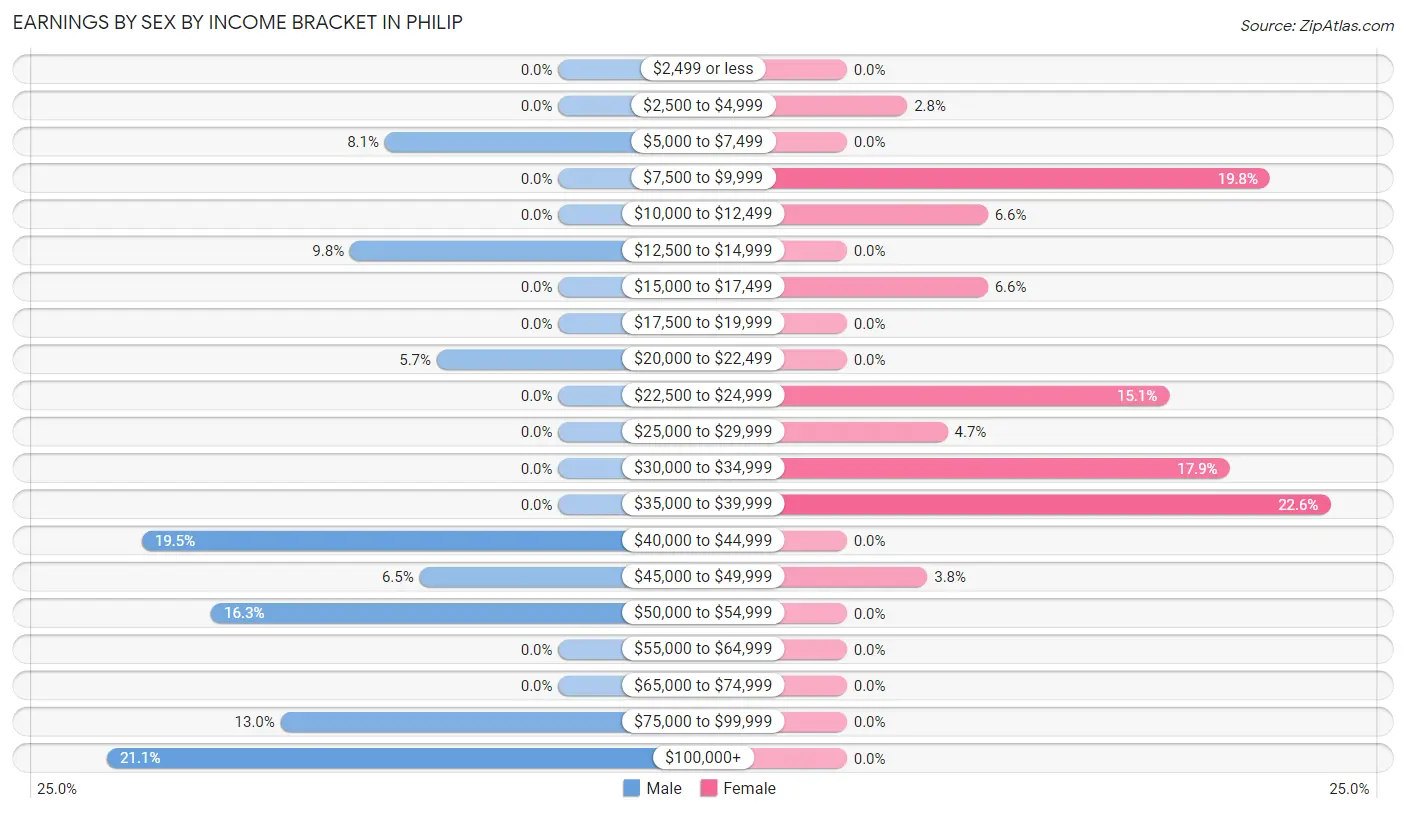
Earnings by Sex by Income Bracket in Philip
The most common earnings brackets in Philip are $100,000+ for men (26 | 21.1%) and $35,000 to $39,999 for women (24 | 22.6%).
| Income | Male | Female |
| $2,499 or less | 0 (0.0%) | 0 (0.0%) |
| $2,500 to $4,999 | 0 (0.0%) | 3 (2.8%) |
| $5,000 to $7,499 | 10 (8.1%) | 0 (0.0%) |
| $7,500 to $9,999 | 0 (0.0%) | 21 (19.8%) |
| $10,000 to $12,499 | 0 (0.0%) | 7 (6.6%) |
| $12,500 to $14,999 | 12 (9.8%) | 0 (0.0%) |
| $15,000 to $17,499 | 0 (0.0%) | 7 (6.6%) |
| $17,500 to $19,999 | 0 (0.0%) | 0 (0.0%) |
| $20,000 to $22,499 | 7 (5.7%) | 0 (0.0%) |
| $22,500 to $24,999 | 0 (0.0%) | 16 (15.1%) |
| $25,000 to $29,999 | 0 (0.0%) | 5 (4.7%) |
| $30,000 to $34,999 | 0 (0.0%) | 19 (17.9%) |
| $35,000 to $39,999 | 0 (0.0%) | 24 (22.6%) |
| $40,000 to $44,999 | 24 (19.5%) | 0 (0.0%) |
| $45,000 to $49,999 | 8 (6.5%) | 4 (3.8%) |
| $50,000 to $54,999 | 20 (16.3%) | 0 (0.0%) |
| $55,000 to $64,999 | 0 (0.0%) | 0 (0.0%) |
| $65,000 to $74,999 | 0 (0.0%) | 0 (0.0%) |
| $75,000 to $99,999 | 16 (13.0%) | 0 (0.0%) |
| $100,000+ | 26 (21.1%) | 0 (0.0%) |
| Total | 123 (100.0%) | 106 (100.0%) |
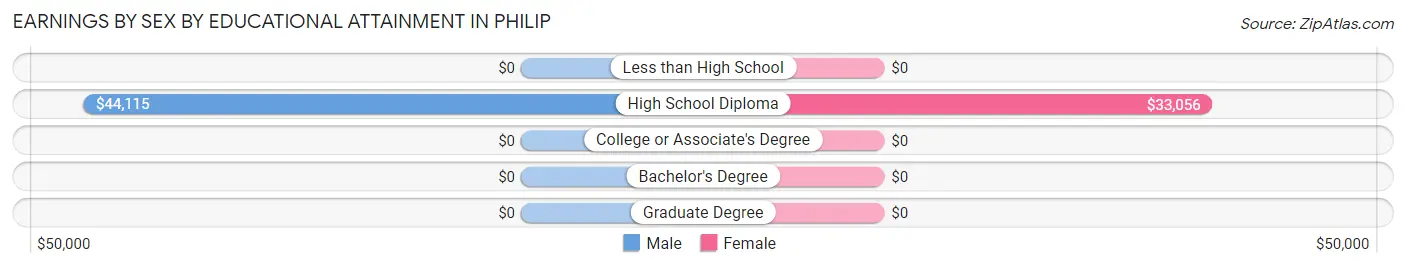
Earnings by Sex by Educational Attainment in Philip
Average earnings in Philip are $44,375 for men and $24,844 for women, a difference of 44.0%. Men with an educational attainment of high school diploma enjoy the highest average annual earnings of $44,115, while those with high school diploma education earn the least with $44,115. Women with an educational attainment of high school diploma earn the most with the average annual earnings of $33,056, while those with high school diploma education have the smallest earnings of $33,056.
| Educational Attainment | Male Income | Female Income |
| Less than High School | - | - |
| High School Diploma | $44,115 | $33,056 |
| College or Associate's Degree | - | - |
| Bachelor's Degree | - | - |
| Graduate Degree | - | - |
| Total | $44,375 | $24,844 |
Family Income in Philip
Family Income Brackets in Philip
According to the Philip family income data, there are 36 families falling into the $35,000 to $49,999 income range, which is the most common income bracket and makes up 31.3% of all families.
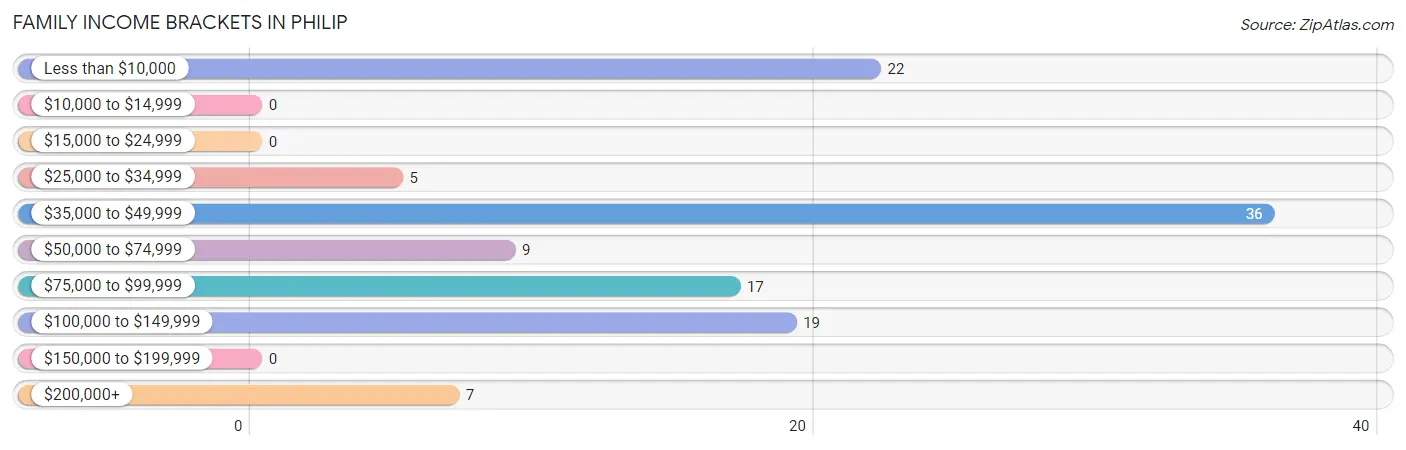
| Income Bracket | # Families | % Families |
| Less than $10,000 | 22 | 19.1% |
| $10,000 to $14,999 | 0 | 0.0% |
| $15,000 to $24,999 | 0 | 0.0% |
| $25,000 to $34,999 | 5 | 4.3% |
| $35,000 to $49,999 | 36 | 31.3% |
| $50,000 to $74,999 | 9 | 7.8% |
| $75,000 to $99,999 | 17 | 14.8% |
| $100,000 to $149,999 | 19 | 16.5% |
| $150,000 to $199,999 | 0 | 0.0% |
| $200,000+ | 7 | 6.1% |
Family Income by Famaliy Size in Philip
2-person families (91 | 79.1%) account for the highest median family income in Philip with $52,639 per family, while 2-person families (91 | 79.1%) have the highest median income of $26,320 per family member.
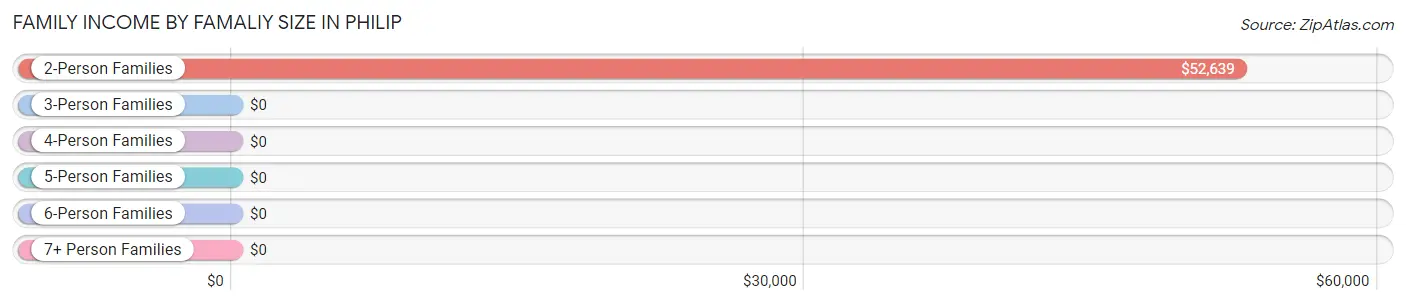
| Income Bracket | # Families | Median Income |
| 2-Person Families | 91 (79.1%) | $52,639 |
| 3-Person Families | 11 (9.6%) | $0 |
| 4-Person Families | 6 (5.2%) | $0 |
| 5-Person Families | 7 (6.1%) | $0 |
| 6-Person Families | 0 (0.0%) | $0 |
| 7+ Person Families | 0 (0.0%) | $0 |
| Total | 115 (100.0%) | $43,854 |
Family Income by Number of Earners in Philip
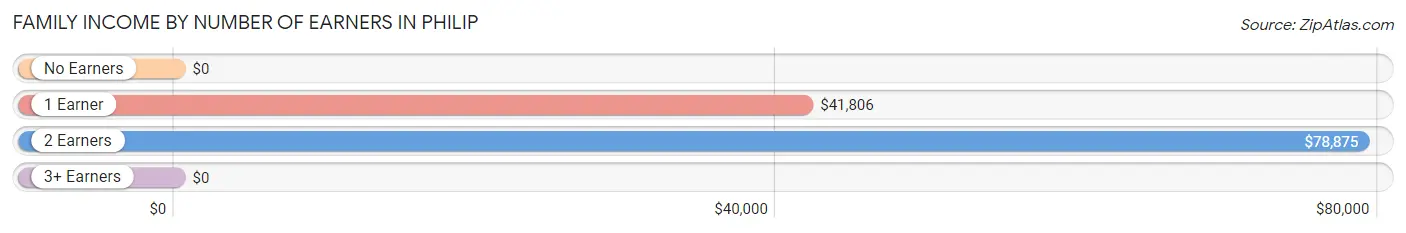
| Number of Earners | # Families | Median Income |
| No Earners | 11 (9.6%) | $0 |
| 1 Earner | 61 (53.0%) | $41,806 |
| 2 Earners | 43 (37.4%) | $78,875 |
| 3+ Earners | 0 (0.0%) | $0 |
| Total | 115 (100.0%) | $43,854 |
Household Income in Philip
Household Income Brackets in Philip
With 69 households falling in the category, the less than $10,000 income range is the most frequent in Philip, accounting for 28.3% of all households.
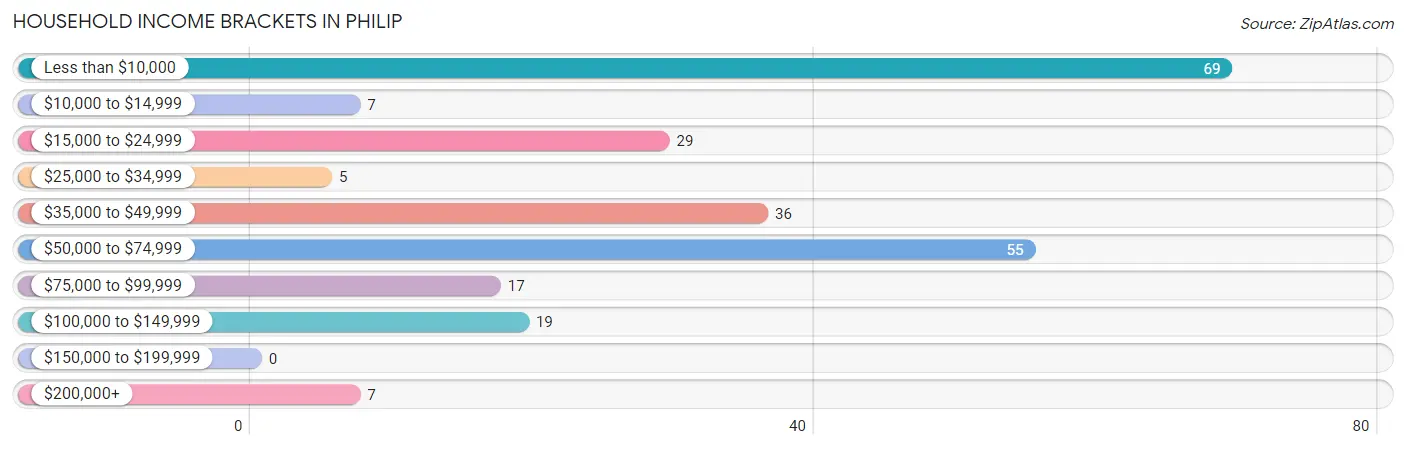
| Income Bracket | # Households | % Households |
| Less than $10,000 | 69 | 28.3% |
| $10,000 to $14,999 | 7 | 2.9% |
| $15,000 to $24,999 | 29 | 11.9% |
| $25,000 to $34,999 | 5 | 2.0% |
| $35,000 to $49,999 | 36 | 14.8% |
| $50,000 to $74,999 | 55 | 22.5% |
| $75,000 to $99,999 | 17 | 7.0% |
| $100,000 to $149,999 | 19 | 7.8% |
| $150,000 to $199,999 | 0 | 0.0% |
| $200,000+ | 7 | 2.9% |
Household Income by Householder Age in Philip
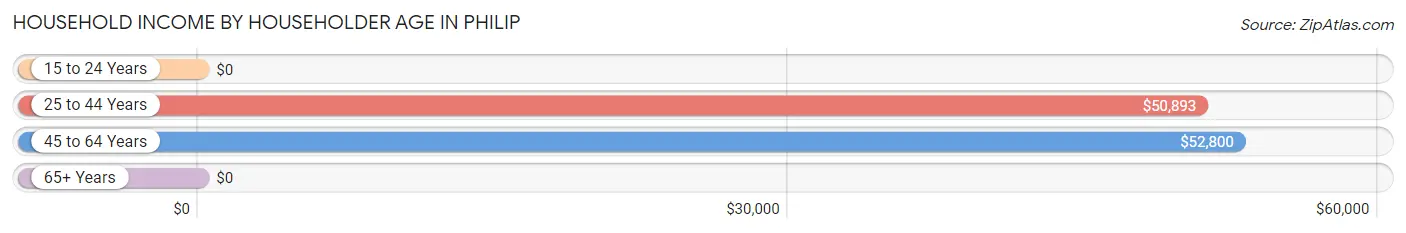
The median household income in Philip is $39,063, with the highest median household income of $52,800 found in the 45 to 64 years age bracket for the primary householder. A total of 98 households (40.2%) fall into this category. Meanwhile, the 15 to 24 years age bracket for the primary householder has the lowest median household income of $0, with 13 households (5.3%) in this group.
| Income Bracket | # Households | Median Income |
| 15 to 24 Years | 13 (5.3%) | $0 |
| 25 to 44 Years | 41 (16.8%) | $50,893 |
| 45 to 64 Years | 98 (40.2%) | $52,800 |
| 65+ Years | 92 (37.7%) | $0 |
| Total | 244 (100.0%) | $39,063 |
Poverty in Philip
Income Below Poverty by Sex and Age in Philip
With 20.6% poverty level for males and 30.1% for females among the residents of Philip, 6 to 11 year old males and 45 to 54 year old females are the most vulnerable to poverty, with 11 males (100.0%) and 15 females (75.0%) in their respective age groups living below the poverty level.
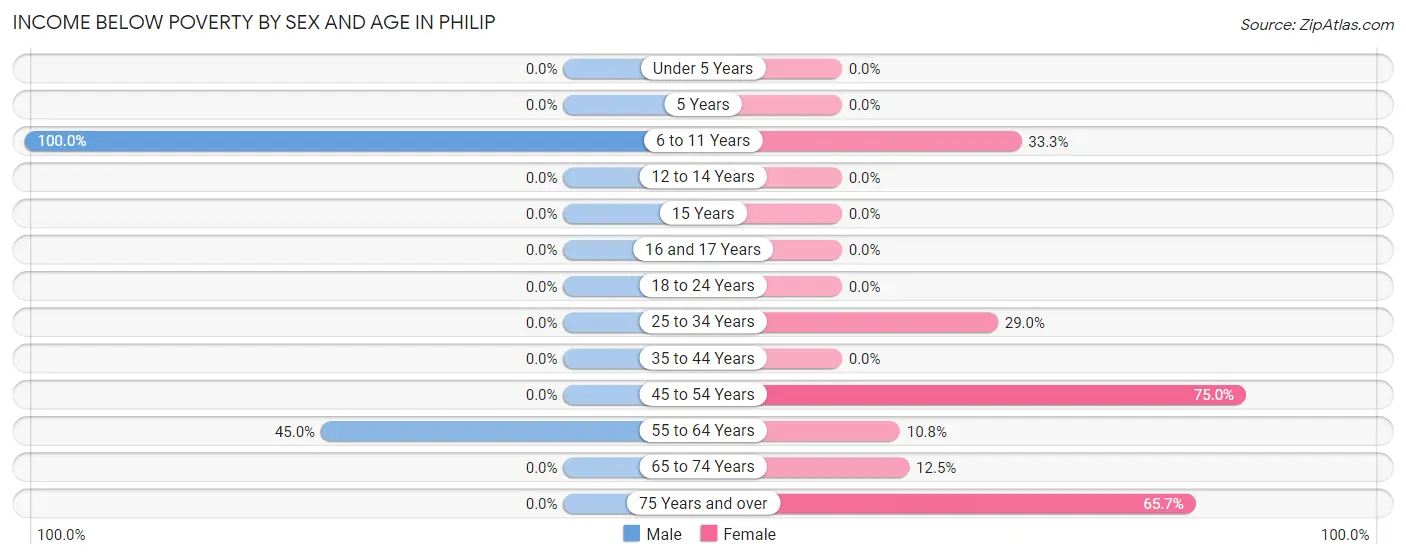
| Age Bracket | Male | Female |
| Under 5 Years | 0 (0.0%) | 0 (0.0%) |
| 5 Years | 0 (0.0%) | 0 (0.0%) |
| 6 to 11 Years | 11 (100.0%) | 4 (33.3%) |
| 12 to 14 Years | 0 (0.0%) | 0 (0.0%) |
| 15 Years | 0 (0.0%) | 0 (0.0%) |
| 16 and 17 Years | 0 (0.0%) | 0 (0.0%) |
| 18 to 24 Years | 0 (0.0%) | 0 (0.0%) |
| 25 to 34 Years | 0 (0.0%) | 11 (28.9%) |
| 35 to 44 Years | 0 (0.0%) | 0 (0.0%) |
| 45 to 54 Years | 0 (0.0%) | 15 (75.0%) |
| 55 to 64 Years | 27 (45.0%) | 7 (10.8%) |
| 65 to 74 Years | 0 (0.0%) | 3 (12.5%) |
| 75 Years and over | 0 (0.0%) | 44 (65.7%) |
| Total | 38 (20.6%) | 84 (30.1%) |
Income Above Poverty by Sex and Age in Philip
According to the poverty statistics in Philip, males aged under 5 years and females aged 15 years are the age groups that are most secure financially, with 100.0% of males and 100.0% of females in these age groups living above the poverty line.
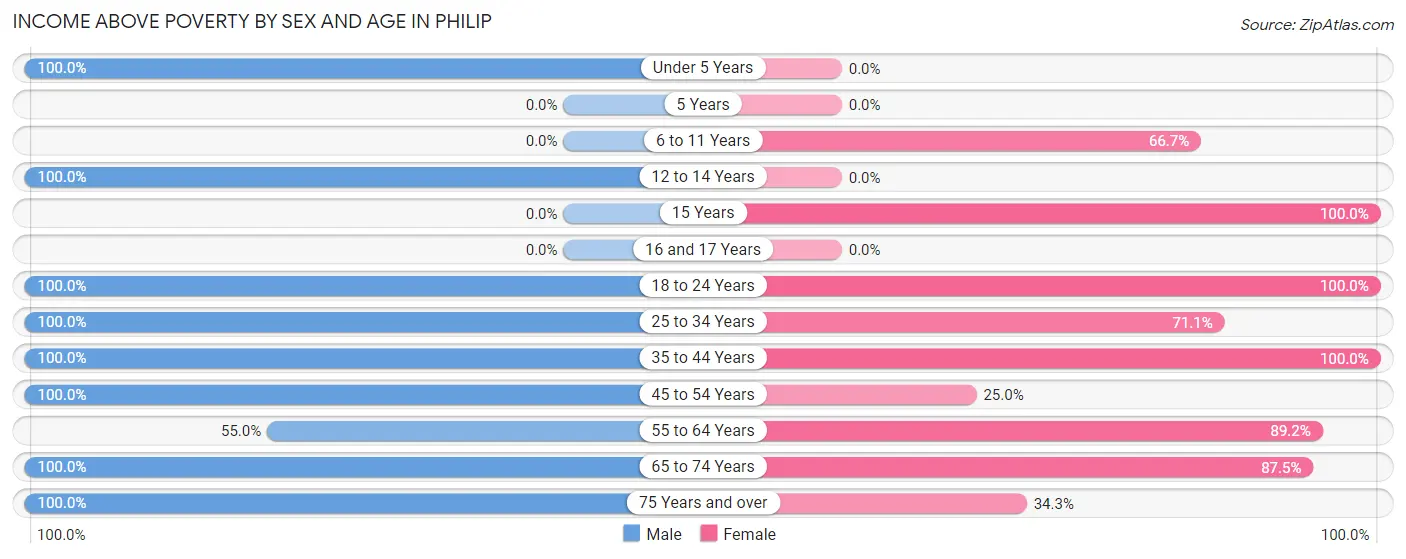
| Age Bracket | Male | Female |
| Under 5 Years | 18 (100.0%) | 0 (0.0%) |
| 5 Years | 0 (0.0%) | 0 (0.0%) |
| 6 to 11 Years | 0 (0.0%) | 8 (66.7%) |
| 12 to 14 Years | 3 (100.0%) | 0 (0.0%) |
| 15 Years | 0 (0.0%) | 5 (100.0%) |
| 16 and 17 Years | 0 (0.0%) | 0 (0.0%) |
| 18 to 24 Years | 29 (100.0%) | 31 (100.0%) |
| 25 to 34 Years | 13 (100.0%) | 27 (71.1%) |
| 35 to 44 Years | 7 (100.0%) | 17 (100.0%) |
| 45 to 54 Years | 21 (100.0%) | 5 (25.0%) |
| 55 to 64 Years | 33 (55.0%) | 58 (89.2%) |
| 65 to 74 Years | 12 (100.0%) | 21 (87.5%) |
| 75 Years and over | 10 (100.0%) | 23 (34.3%) |
| Total | 146 (79.3%) | 195 (69.9%) |
Income Below Poverty Among Married-Couple Families in Philip
The poverty statistics for married-couple families in Philip show that 7.6% or 7 of the total 92 families live below the poverty line. Families with no children have the highest poverty rate of 8.9%, comprising of 7 families. On the other hand, families with 1 or 2 children have the lowest poverty rate of 0.0%, which includes 0 families.
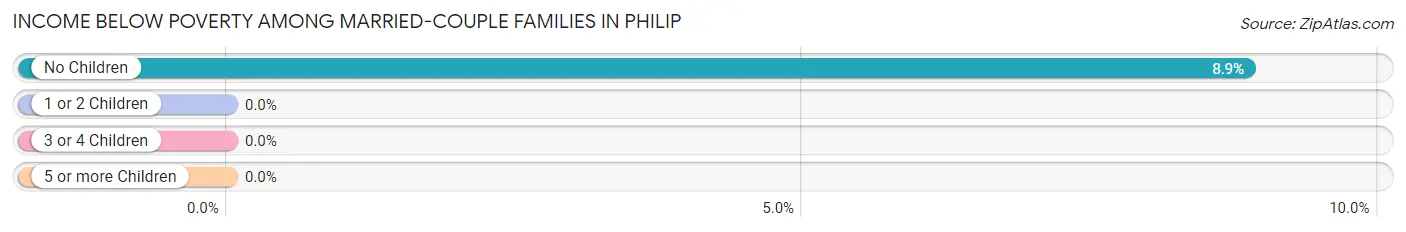
| Children | Above Poverty | Below Poverty |
| No Children | 72 (91.1%) | 7 (8.9%) |
| 1 or 2 Children | 6 (100.0%) | 0 (0.0%) |
| 3 or 4 Children | 7 (100.0%) | 0 (0.0%) |
| 5 or more Children | 0 (0.0%) | 0 (0.0%) |
| Total | 85 (92.4%) | 7 (7.6%) |
Income Below Poverty Among Single-Parent Households in Philip
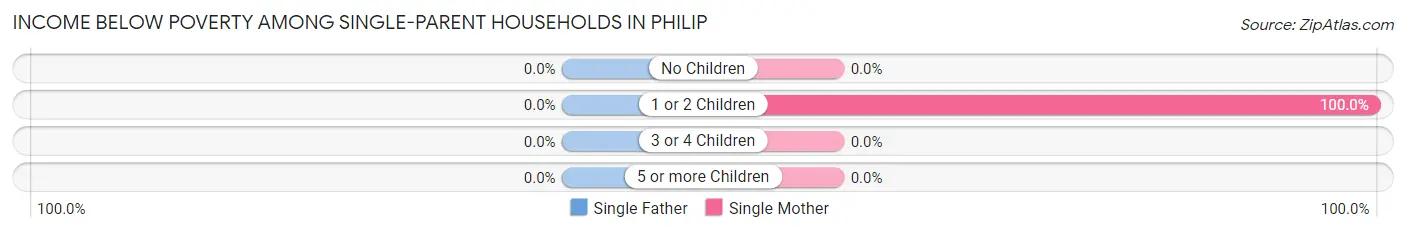
| Children | Single Father | Single Mother |
| No Children | 0 (0.0%) | 0 (0.0%) |
| 1 or 2 Children | 0 (0.0%) | 15 (100.0%) |
| 3 or 4 Children | 0 (0.0%) | 0 (0.0%) |
| 5 or more Children | 0 (0.0%) | 0 (0.0%) |
| Total | 0 (0.0%) | 15 (65.2%) |
Income Below Poverty Among Married-Couple vs Single-Parent Households in Philip
The poverty data for Philip shows that 7 of the married-couple family households (7.6%) and 15 of the single-parent households (65.2%) are living below the poverty level. Within the married-couple family households, those with no children have the highest poverty rate, with 7 households (8.9%) falling below the poverty line. Among the single-parent households, those with 1 or 2 children have the highest poverty rate, with 15 household (100.0%) living below poverty.
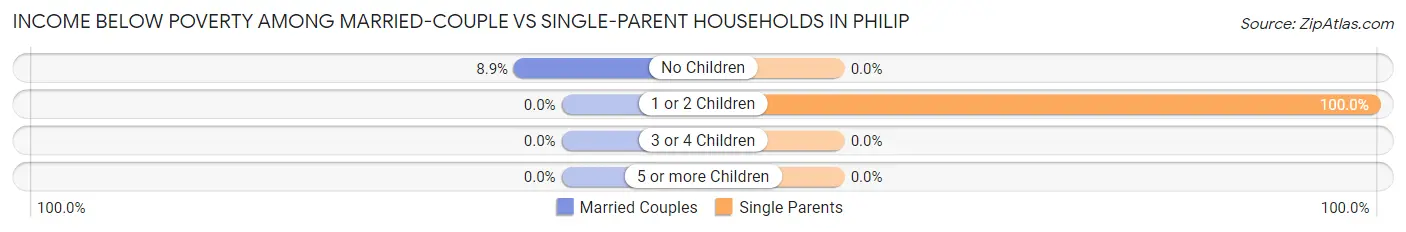
| Children | Married-Couple Families | Single-Parent Households |
| No Children | 7 (8.9%) | 0 (0.0%) |
| 1 or 2 Children | 0 (0.0%) | 15 (100.0%) |
| 3 or 4 Children | 0 (0.0%) | 0 (0.0%) |
| 5 or more Children | 0 (0.0%) | 0 (0.0%) |
| Total | 7 (7.6%) | 15 (65.2%) |
Race in Philip
The most populous races in Philip are White / Caucasian (421 | 83.7%), Native / Alaskan (49 | 9.7%), and Black / African American (32 | 6.4%).
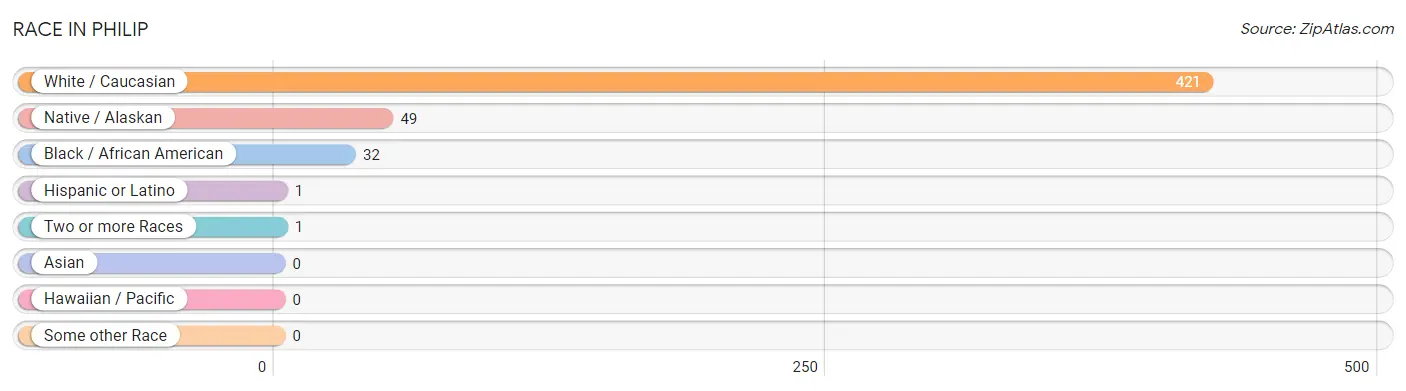
| Race | # Population | % Population |
| Asian | 0 | 0.0% |
| Black / African American | 32 | 6.4% |
| Hawaiian / Pacific | 0 | 0.0% |
| Hispanic or Latino | 1 | 0.2% |
| Native / Alaskan | 49 | 9.7% |
| White / Caucasian | 421 | 83.7% |
| Two or more Races | 1 | 0.2% |
| Some other Race | 0 | 0.0% |
| Total | 503 | 100.0% |
Ancestry in Philip
The most populous ancestries reported in Philip are German (225 | 44.7%), Norwegian (142 | 28.2%), Irish (55 | 10.9%), Sioux (49 | 9.7%), and African (31 | 6.2%), together accounting for 99.8% of all Philip residents.
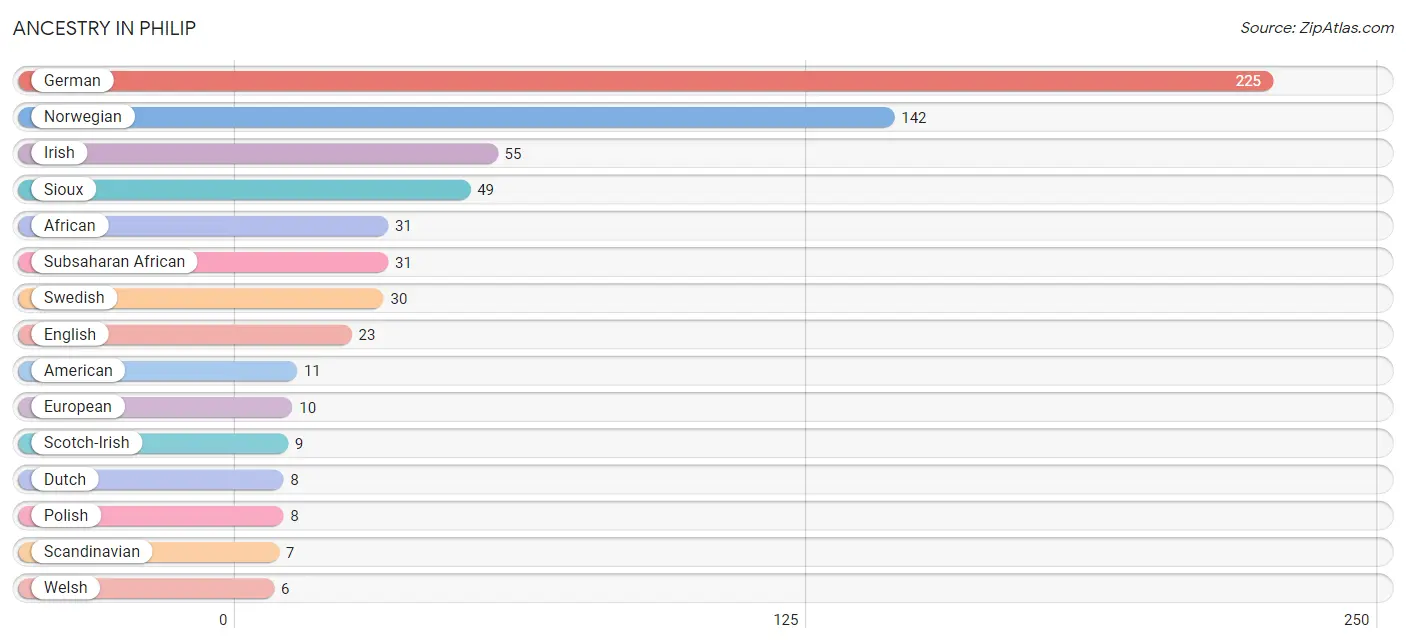
| Ancestry | # Population | % Population |
| African | 31 | 6.2% |
| American | 11 | 2.2% |
| Dutch | 8 | 1.6% |
| English | 23 | 4.6% |
| European | 10 | 2.0% |
| French | 2 | 0.4% |
| French Canadian | 4 | 0.8% |
| German | 225 | 44.7% |
| Irish | 55 | 10.9% |
| Mexican | 1 | 0.2% |
| Norwegian | 142 | 28.2% |
| Polish | 8 | 1.6% |
| Scandinavian | 7 | 1.4% |
| Scotch-Irish | 9 | 1.8% |
| Sioux | 49 | 9.7% |
| Subsaharan African | 31 | 6.2% |
| Swedish | 30 | 6.0% |
| Welsh | 6 | 1.2% | View All 18 Rows |
Immigrants in Philip
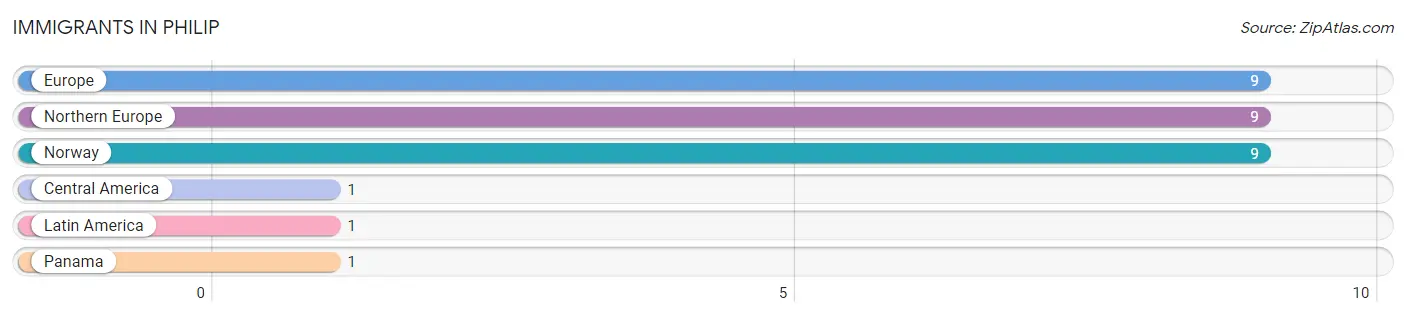
The most numerous immigrant groups reported in Philip came from Europe (9 | 1.8%), Northern Europe (9 | 1.8%), Norway (9 | 1.8%), Central America (1 | 0.2%), and Latin America (1 | 0.2%), together accounting for 5.8% of all Philip residents.
| Immigration Origin | # Population | % Population |
| Central America | 1 | 0.2% |
| Europe | 9 | 1.8% |
| Latin America | 1 | 0.2% |
| Northern Europe | 9 | 1.8% |
| Norway | 9 | 1.8% |
| Panama | 1 | 0.2% | View All 6 Rows |
Sex and Age in Philip
Sex and Age in Philip
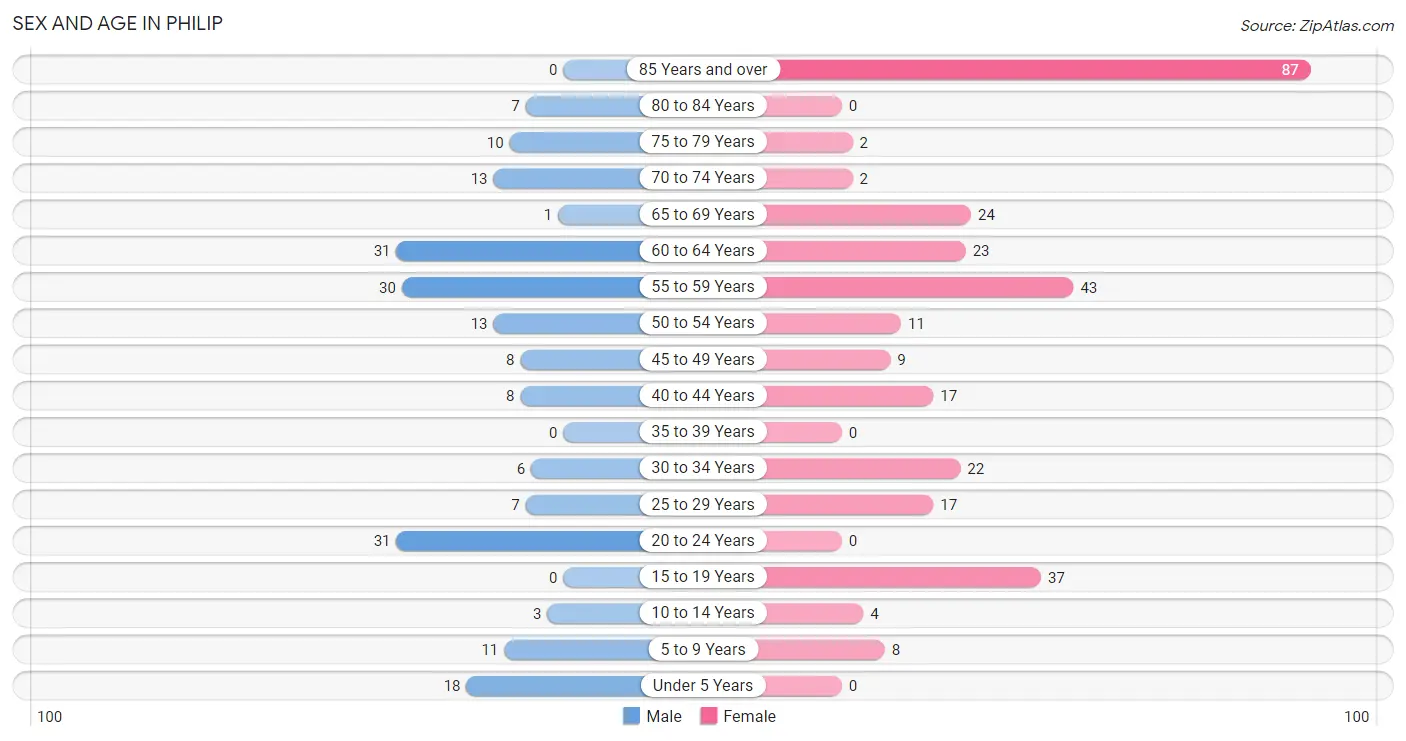
The most populous age groups in Philip are 20 to 24 Years (31 | 15.7%) for men and 85 Years and over (87 | 28.4%) for women.
| Age Bracket | Male | Female |
| Under 5 Years | 18 (9.1%) | 0 (0.0%) |
| 5 to 9 Years | 11 (5.6%) | 8 (2.6%) |
| 10 to 14 Years | 3 (1.5%) | 4 (1.3%) |
| 15 to 19 Years | 0 (0.0%) | 37 (12.1%) |
| 20 to 24 Years | 31 (15.7%) | 0 (0.0%) |
| 25 to 29 Years | 7 (3.5%) | 17 (5.6%) |
| 30 to 34 Years | 6 (3.0%) | 22 (7.2%) |
| 35 to 39 Years | 0 (0.0%) | 0 (0.0%) |
| 40 to 44 Years | 8 (4.1%) | 17 (5.6%) |
| 45 to 49 Years | 8 (4.1%) | 9 (2.9%) |
| 50 to 54 Years | 13 (6.6%) | 11 (3.6%) |
| 55 to 59 Years | 30 (15.2%) | 43 (14.1%) |
| 60 to 64 Years | 31 (15.7%) | 23 (7.5%) |
| 65 to 69 Years | 1 (0.5%) | 24 (7.8%) |
| 70 to 74 Years | 13 (6.6%) | 2 (0.6%) |
| 75 to 79 Years | 10 (5.1%) | 2 (0.6%) |
| 80 to 84 Years | 7 (3.5%) | 0 (0.0%) |
| 85 Years and over | 0 (0.0%) | 87 (28.4%) |
| Total | 197 (100.0%) | 306 (100.0%) |
Families and Households in Philip
Median Family Size in Philip
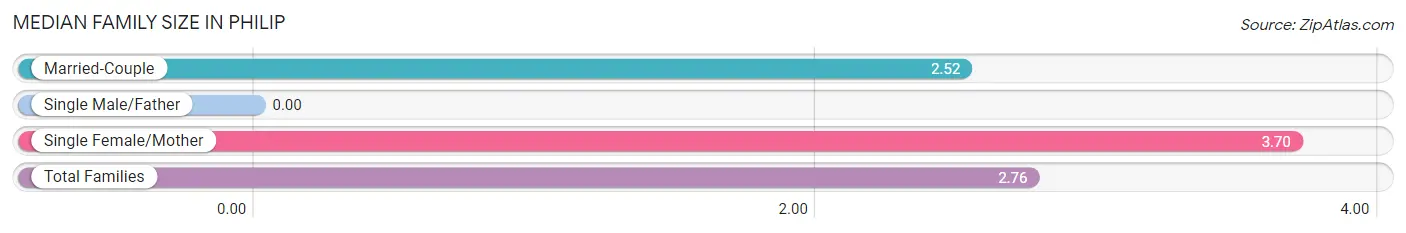
| Family Type | # Families | Family Size |
| Married-Couple | 92 (80.0%) | 2.52 |
| Single Male/Father | 0 (0.0%) | - |
| Single Female/Mother | 23 (20.0%) | 3.70 |
| Total Families | 115 (100.0%) | 2.76 |
Median Household Size in Philip
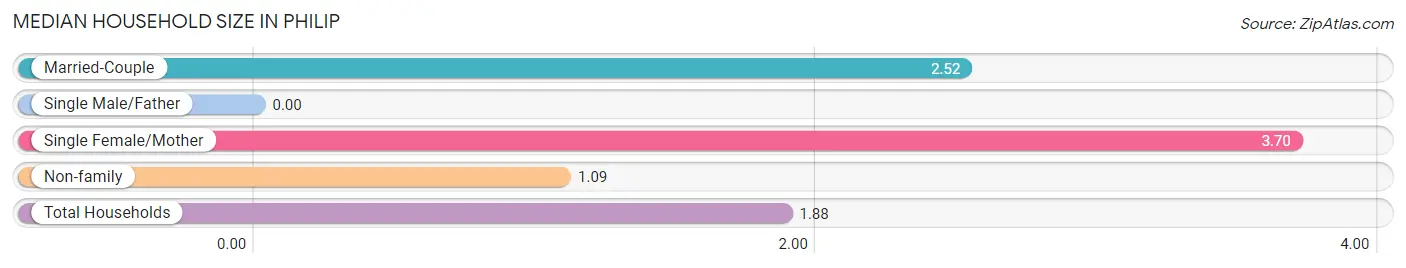
| Household Type | # Households | Household Size |
| Married-Couple | 92 (37.7%) | 2.52 |
| Single Male/Father | 0 (0.0%) | - |
| Single Female/Mother | 23 (9.4%) | 3.70 |
| Non-family | 129 (52.9%) | 1.09 |
| Total Households | 244 (100.0%) | 1.88 |
Household Size by Marriage Status in Philip
Out of a total of 244 households in Philip, 115 (47.1%) are family households, while 129 (52.9%) are nonfamily households. The most numerous type of family households are 2-person households, comprising 91, and the most common type of nonfamily households are 1-person households, comprising 113.
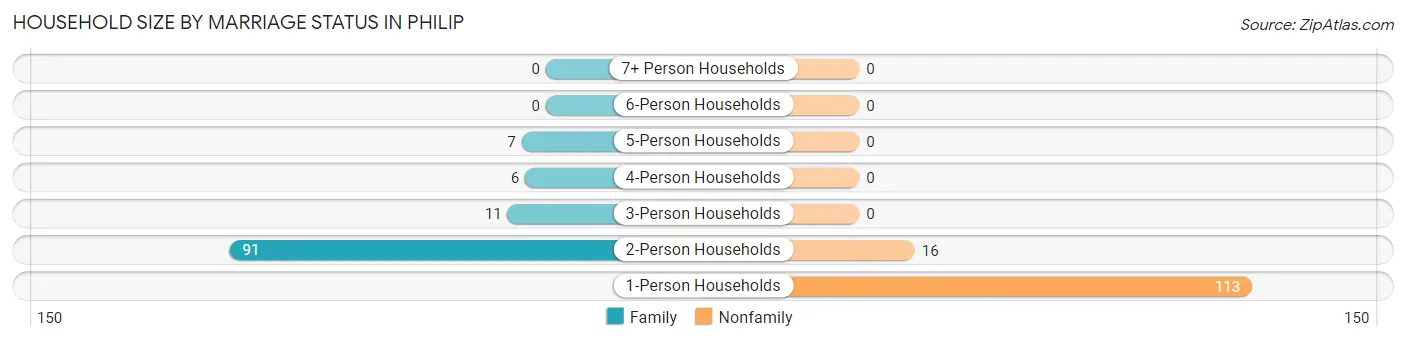
| Household Size | Family Households | Nonfamily Households |
| 1-Person Households | - | 113 (46.3%) |
| 2-Person Households | 91 (37.3%) | 16 (6.6%) |
| 3-Person Households | 11 (4.5%) | 0 (0.0%) |
| 4-Person Households | 6 (2.5%) | 0 (0.0%) |
| 5-Person Households | 7 (2.9%) | 0 (0.0%) |
| 6-Person Households | 0 (0.0%) | 0 (0.0%) |
| 7+ Person Households | 0 (0.0%) | 0 (0.0%) |
| Total | 115 (47.1%) | 129 (52.9%) |
Female Fertility in Philip
Fertility by Age in Philip
| Age Bracket | Women with Births | Births / 1,000 Women |
| 15 to 19 years | 0 (0.0%) | 0.0 |
| 20 to 34 years | 0 (0.0%) | 0.0 |
| 35 to 50 years | 0 (0.0%) | 0.0 |
| Total | 0 (0.0%) | 0.0 |
Fertility by Age by Marriage Status in Philip
| Age Bracket | Married | Unmarried |
| 15 to 19 years | 0 (0.0%) | 0 (0.0%) |
| 20 to 34 years | 0 (0.0%) | 0 (0.0%) |
| 35 to 50 years | 0 (0.0%) | 0 (0.0%) |
| Total | 0 (0.0%) | 0 (0.0%) |
Fertility by Education in Philip
| Educational Attainment | Women with Births | Births / 1,000 Women |
| Less than High School | 0 (0.0%) | 0.0 |
| High School Diploma | 0 (0.0%) | 0.0 |
| College or Associate's Degree | 0 (0.0%) | 0.0 |
| Bachelor's Degree | 0 (0.0%) | 0.0 |
| Graduate Degree | 0 (0.0%) | 0.0 |
| Total | 0 (0.0%) | 0.0 |
Fertility by Education by Marriage Status in Philip
| Educational Attainment | Married | Unmarried |
| Less than High School | 0 (0.0%) | 0 (0.0%) |
| High School Diploma | 0 (0.0%) | 0 (0.0%) |
| College or Associate's Degree | 0 (0.0%) | 0 (0.0%) |
| Bachelor's Degree | 0 (0.0%) | 0 (0.0%) |
| Graduate Degree | 0 (0.0%) | 0 (0.0%) |
| Total | 0 (0.0%) | 0 (0.0%) |
Employment Characteristics in Philip
Employment by Class of Employer in Philip
Among the 229 employed individuals in Philip, private company employees (159 | 69.4%), local government employees (33 | 14.4%), and self-employed (not incorporated) (13 | 5.7%) make up the most common classes of employment.
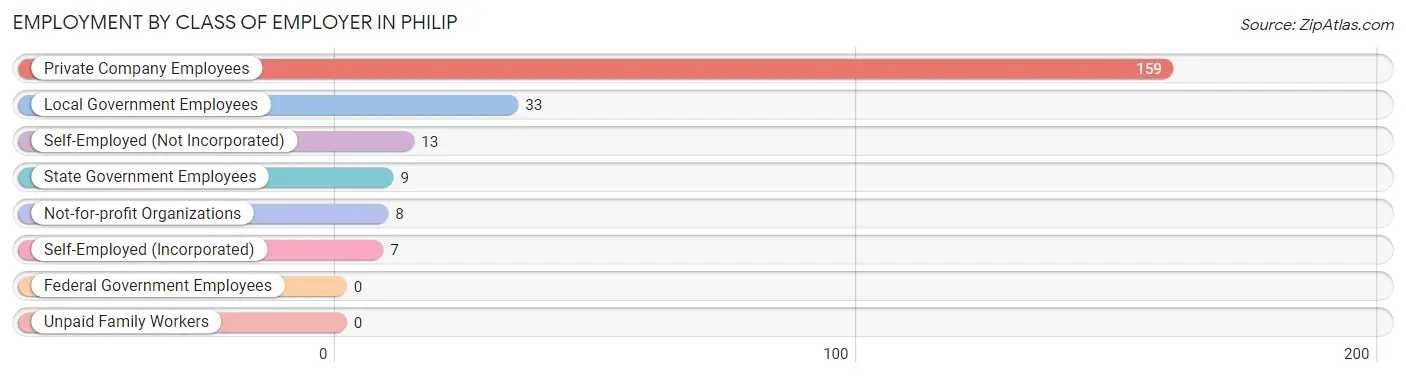
| Employer Class | # Employees | % Employees |
| Private Company Employees | 159 | 69.4% |
| Self-Employed (Incorporated) | 7 | 3.1% |
| Self-Employed (Not Incorporated) | 13 | 5.7% |
| Not-for-profit Organizations | 8 | 3.5% |
| Local Government Employees | 33 | 14.4% |
| State Government Employees | 9 | 3.9% |
| Federal Government Employees | 0 | 0.0% |
| Unpaid Family Workers | 0 | 0.0% |
| Total | 229 | 100.0% |
Employment Status by Age in Philip
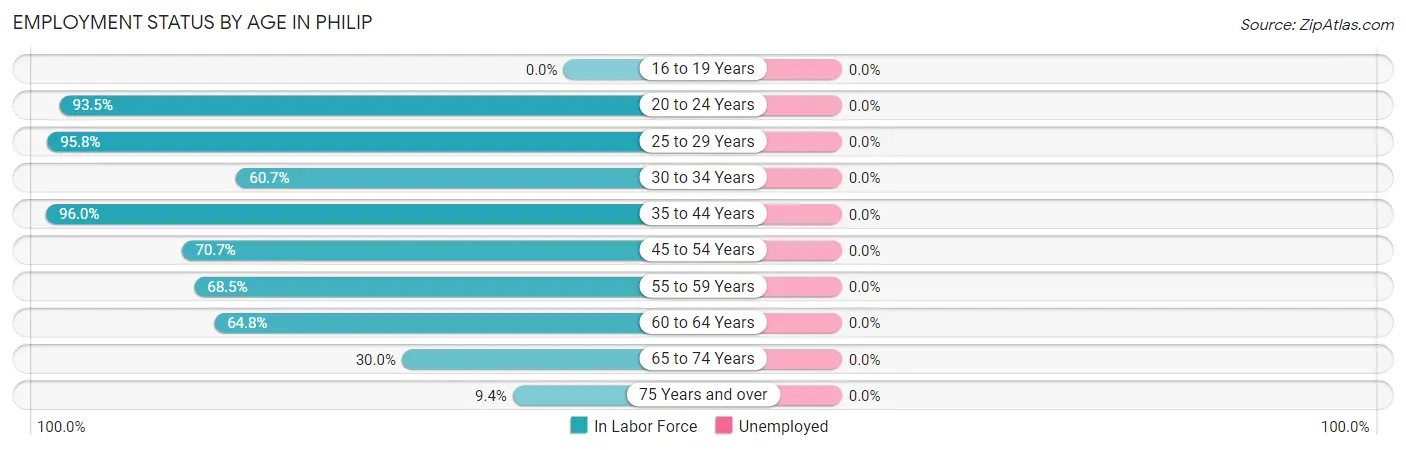
| Age Bracket | In Labor Force | Unemployed |
| 16 to 19 Years | 0 (0.0%) | 0 (0.0%) |
| 20 to 24 Years | 29 (93.5%) | 0 (0.0%) |
| 25 to 29 Years | 23 (95.8%) | 0 (0.0%) |
| 30 to 34 Years | 17 (60.7%) | 0 (0.0%) |
| 35 to 44 Years | 24 (96.0%) | 0 (0.0%) |
| 45 to 54 Years | 29 (70.7%) | 0 (0.0%) |
| 55 to 59 Years | 50 (68.5%) | 0 (0.0%) |
| 60 to 64 Years | 35 (64.8%) | 0 (0.0%) |
| 65 to 74 Years | 12 (30.0%) | 0 (0.0%) |
| 75 Years and over | 10 (9.4%) | 0 (0.0%) |
| Total | 229 (50.4%) | 0 (0.0%) |
Employment Status by Educational Attainment in Philip
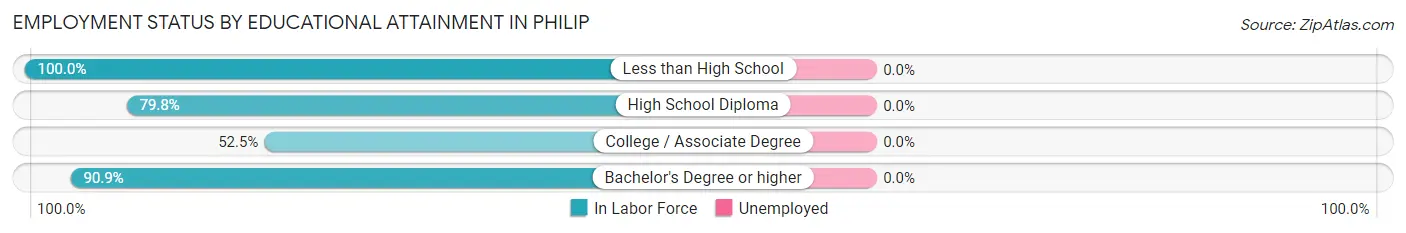
| Educational Attainment | In Labor Force | Unemployed |
| Less than High School | 3 (100.0%) | 0 (0.0%) |
| High School Diploma | 103 (79.8%) | 0 (0.0%) |
| College / Associate Degree | 42 (52.5%) | 0 (0.0%) |
| Bachelor's Degree or higher | 30 (90.9%) | 0 (0.0%) |
| Total | 178 (72.7%) | 0 (0.0%) |
Employment Occupations by Sex in Philip
Management, Business, Science and Arts Occupations
The most common Management, Business, Science and Arts occupations in Philip are Management (32 | 14.0%), Business & Financial (16 | 7.0%), Health Diagnosing & Treating (7 | 3.1%), and Health Technologists (7 | 3.1%).
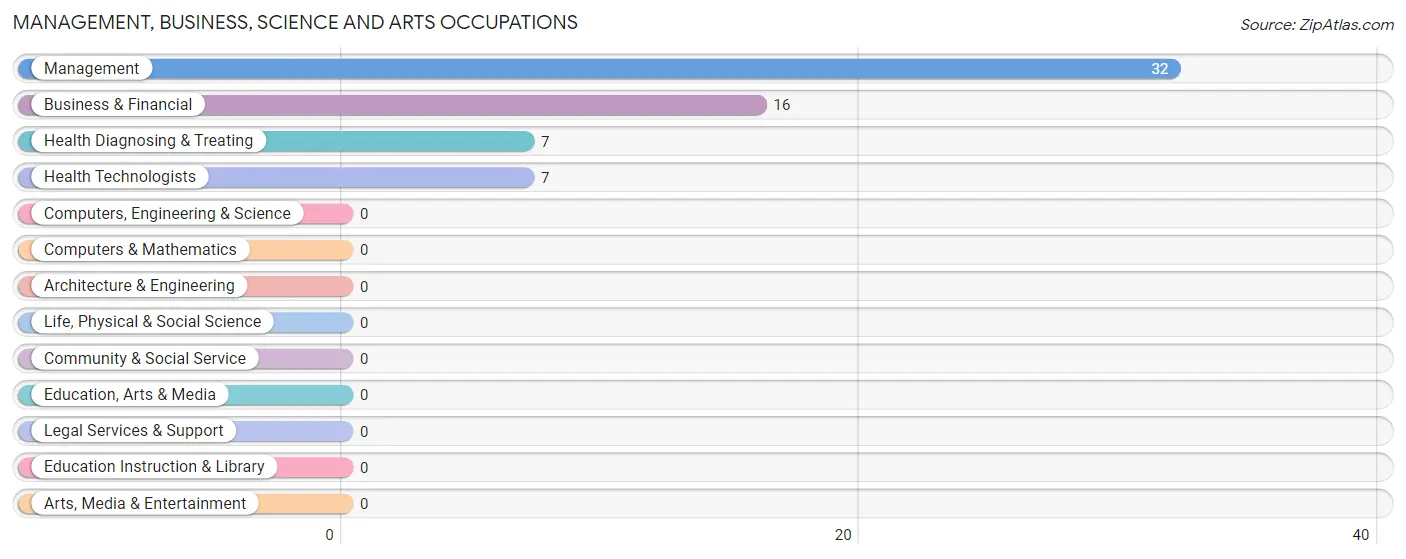
Management, Business, Science and Arts Occupations by Sex
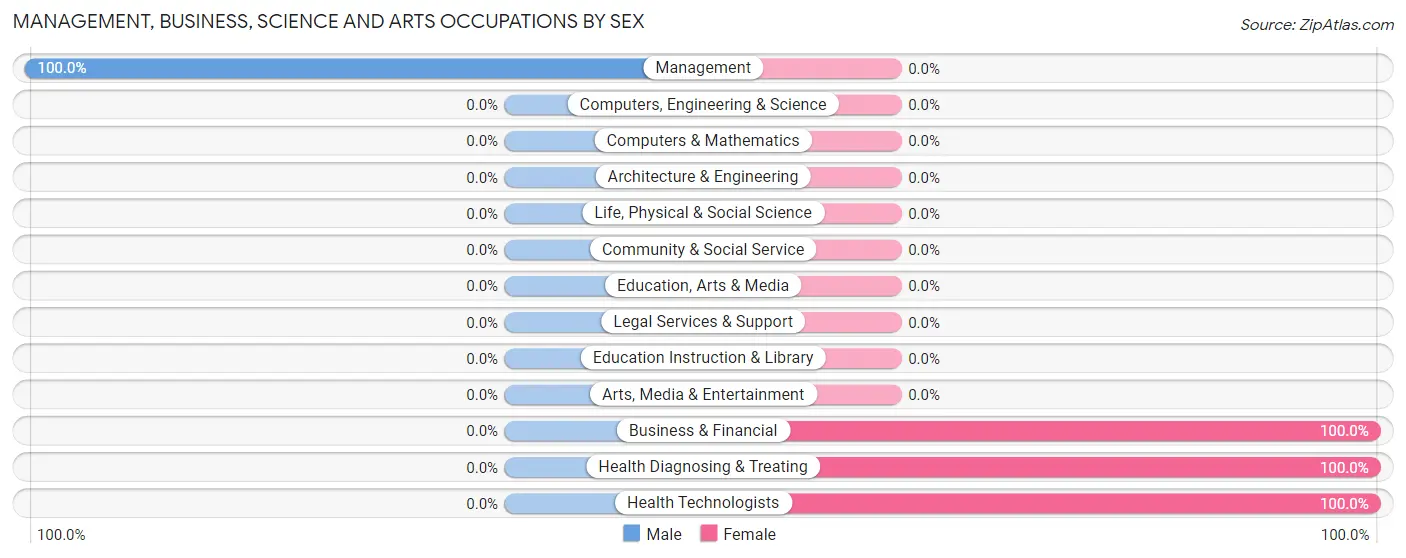
| Occupation | Male | Female |
| Management | 32 (100.0%) | 0 (0.0%) |
| Business & Financial | 0 (0.0%) | 16 (100.0%) |
| Computers, Engineering & Science | 0 (0.0%) | 0 (0.0%) |
| Computers & Mathematics | 0 (0.0%) | 0 (0.0%) |
| Architecture & Engineering | 0 (0.0%) | 0 (0.0%) |
| Life, Physical & Social Science | 0 (0.0%) | 0 (0.0%) |
| Community & Social Service | 0 (0.0%) | 0 (0.0%) |
| Education, Arts & Media | 0 (0.0%) | 0 (0.0%) |
| Legal Services & Support | 0 (0.0%) | 0 (0.0%) |
| Education Instruction & Library | 0 (0.0%) | 0 (0.0%) |
| Arts, Media & Entertainment | 0 (0.0%) | 0 (0.0%) |
| Health Diagnosing & Treating | 0 (0.0%) | 7 (100.0%) |
| Health Technologists | 0 (0.0%) | 7 (100.0%) |
| Total (Category) | 32 (58.2%) | 23 (41.8%) |
| Total (Overall) | 123 (53.7%) | 106 (46.3%) |
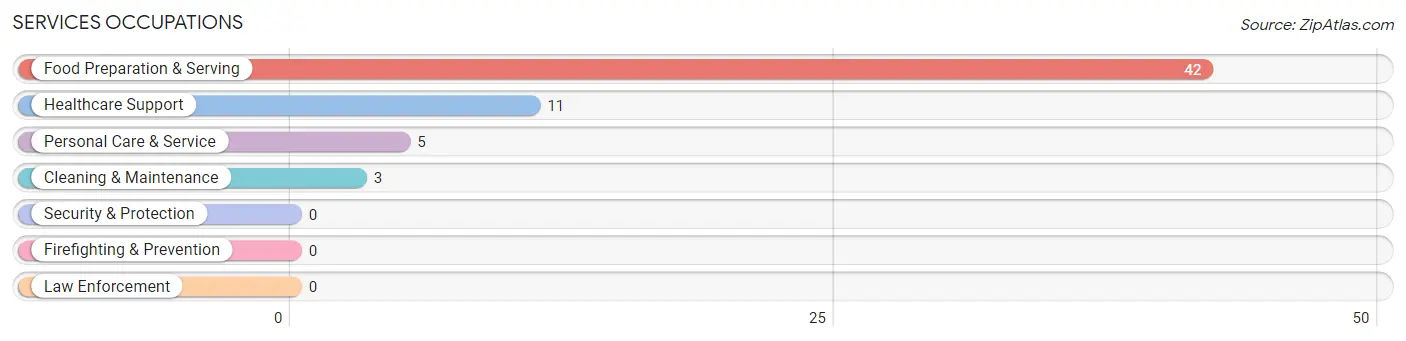
Services Occupations
The most common Services occupations in Philip are Food Preparation & Serving (42 | 18.3%), Healthcare Support (11 | 4.8%), Personal Care & Service (5 | 2.2%), and Cleaning & Maintenance (3 | 1.3%).
Services Occupations by Sex
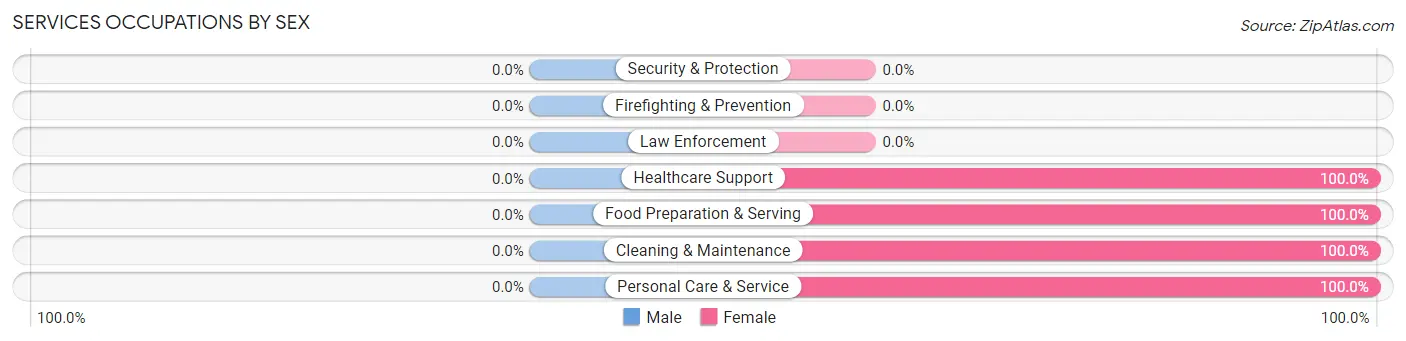
| Occupation | Male | Female |
| Healthcare Support | 0 (0.0%) | 11 (100.0%) |
| Security & Protection | 0 (0.0%) | 0 (0.0%) |
| Firefighting & Prevention | 0 (0.0%) | 0 (0.0%) |
| Law Enforcement | 0 (0.0%) | 0 (0.0%) |
| Food Preparation & Serving | 0 (0.0%) | 42 (100.0%) |
| Cleaning & Maintenance | 0 (0.0%) | 3 (100.0%) |
| Personal Care & Service | 0 (0.0%) | 5 (100.0%) |
| Total (Category) | 0 (0.0%) | 61 (100.0%) |
| Total (Overall) | 123 (53.7%) | 106 (46.3%) |
Sales and Office Occupations
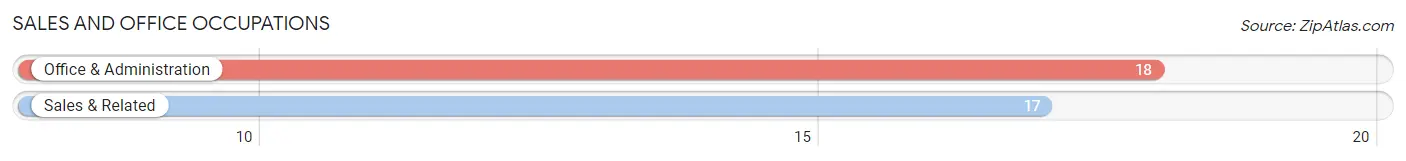
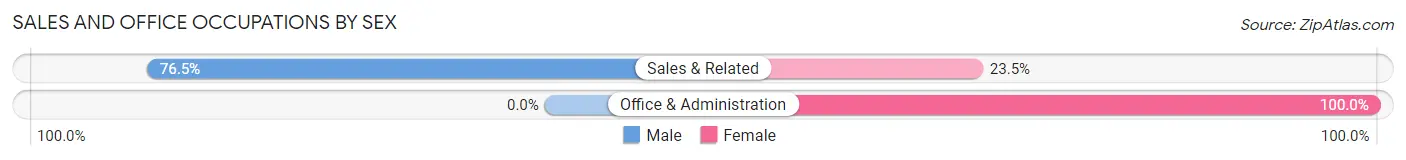
The most common Sales and Office occupations in Philip are Office & Administration (18 | 7.9%), and Sales & Related (17 | 7.4%).
Sales and Office Occupations by Sex
| Occupation | Male | Female |
| Sales & Related | 13 (76.5%) | 4 (23.5%) |
| Office & Administration | 0 (0.0%) | 18 (100.0%) |
| Total (Category) | 13 (37.1%) | 22 (62.9%) |
| Total (Overall) | 123 (53.7%) | 106 (46.3%) |
Natural Resources, Construction and Maintenance Occupations
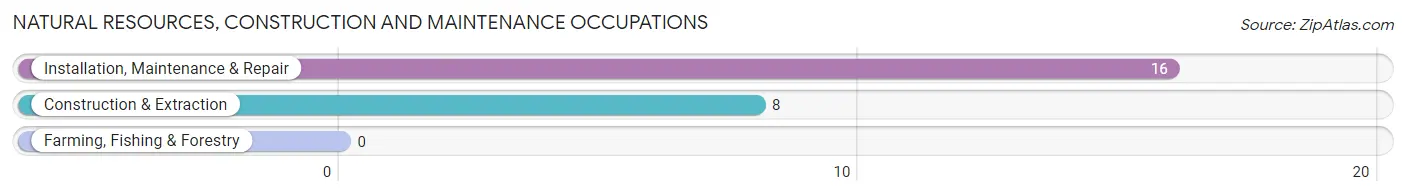
The most common Natural Resources, Construction and Maintenance occupations in Philip are Installation, Maintenance & Repair (16 | 7.0%), and Construction & Extraction (8 | 3.5%).
Natural Resources, Construction and Maintenance Occupations by Sex
| Occupation | Male | Female |
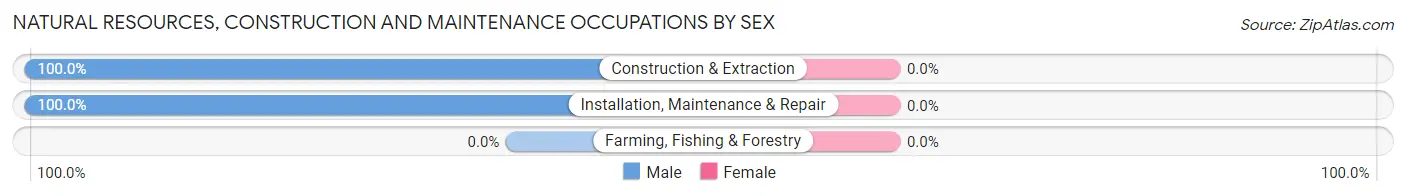
| Farming, Fishing & Forestry | 0 (0.0%) | 0 (0.0%) |
| Construction & Extraction | 8 (100.0%) | 0 (0.0%) |
| Installation, Maintenance & Repair | 16 (100.0%) | 0 (0.0%) |
| Total (Category) | 24 (100.0%) | 0 (0.0%) |
| Total (Overall) | 123 (53.7%) | 106 (46.3%) |
Production, Transportation and Moving Occupations
The most common Production, Transportation and Moving occupations in Philip are Production (23 | 10.0%), Material Moving (21 | 9.2%), and Transportation (10 | 4.4%).
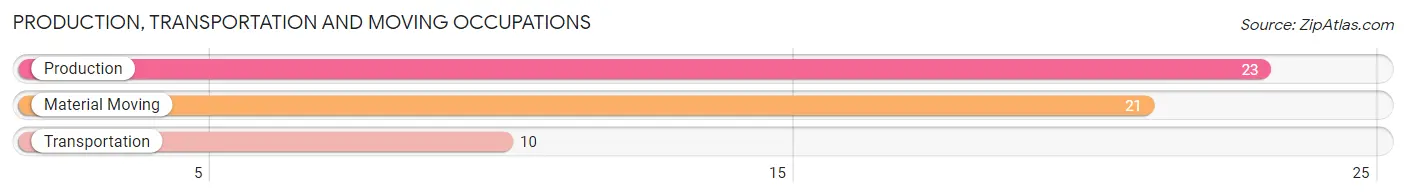
Production, Transportation and Moving Occupations by Sex
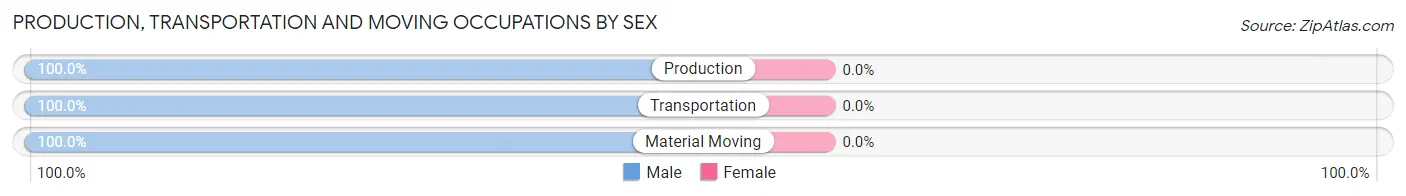
| Occupation | Male | Female |
| Production | 23 (100.0%) | 0 (0.0%) |
| Transportation | 10 (100.0%) | 0 (0.0%) |
| Material Moving | 21 (100.0%) | 0 (0.0%) |
| Total (Category) | 54 (100.0%) | 0 (0.0%) |
| Total (Overall) | 123 (53.7%) | 106 (46.3%) |
Employment Industries by Sex in Philip
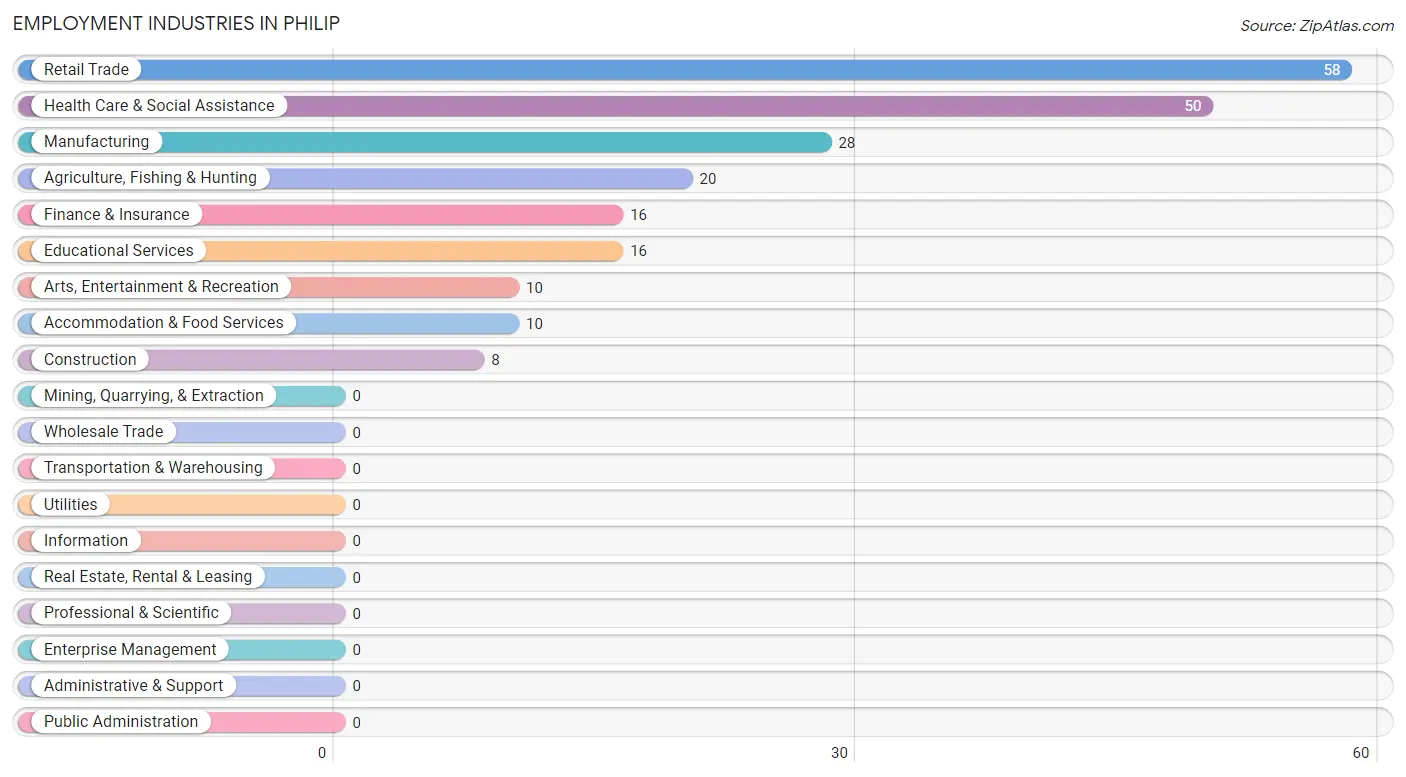
Employment Industries in Philip
The major employment industries in Philip include Retail Trade (58 | 25.3%), Health Care & Social Assistance (50 | 21.8%), Manufacturing (28 | 12.2%), Agriculture, Fishing & Hunting (20 | 8.7%), and Finance & Insurance (16 | 7.0%).
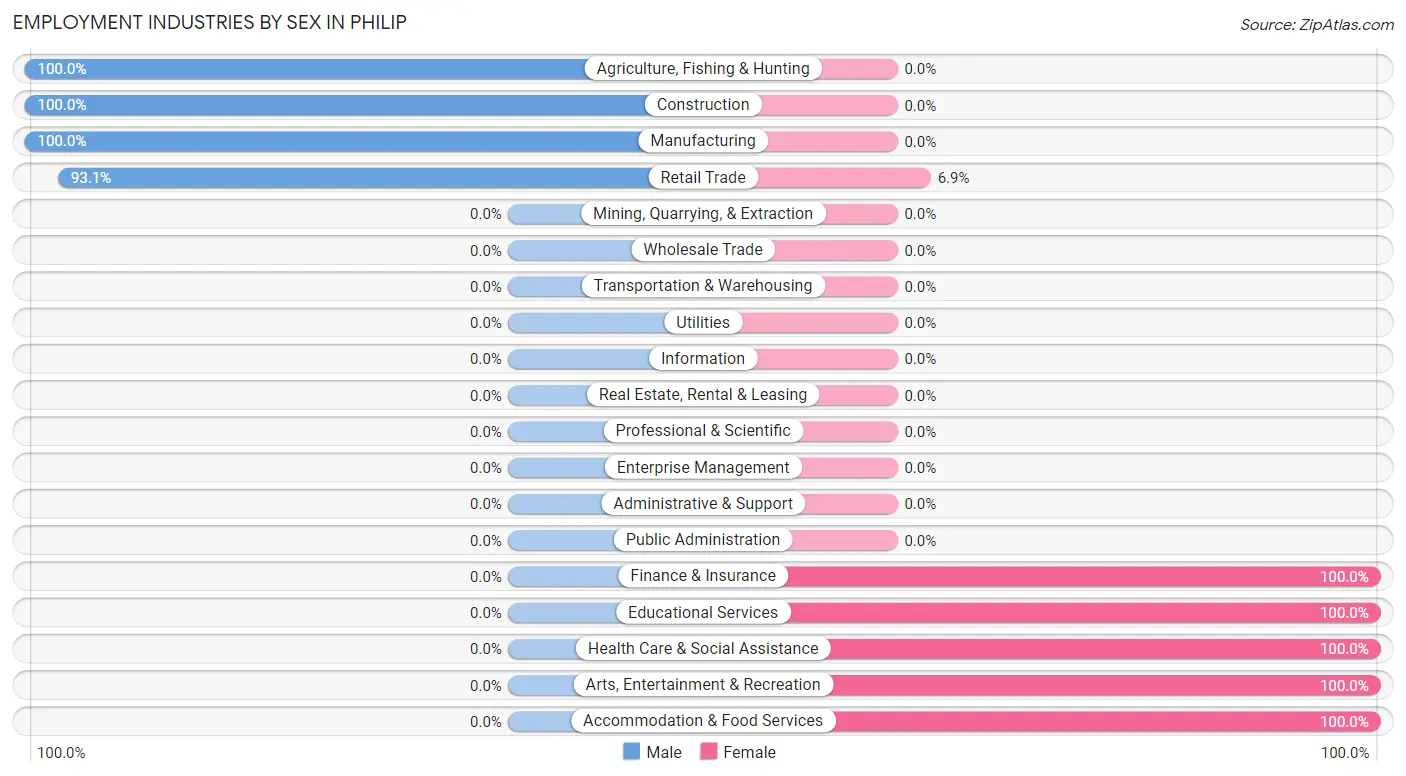
Employment Industries by Sex in Philip
The Philip industries that see more men than women are Agriculture, Fishing & Hunting (100.0%), Construction (100.0%), and Manufacturing (100.0%), whereas the industries that tend to have a higher number of women are Finance & Insurance (100.0%), Educational Services (100.0%), and Health Care & Social Assistance (100.0%).
| Industry | Male | Female |
| Agriculture, Fishing & Hunting | 20 (100.0%) | 0 (0.0%) |
| Mining, Quarrying, & Extraction | 0 (0.0%) | 0 (0.0%) |
| Construction | 8 (100.0%) | 0 (0.0%) |
| Manufacturing | 28 (100.0%) | 0 (0.0%) |
| Wholesale Trade | 0 (0.0%) | 0 (0.0%) |
| Retail Trade | 54 (93.1%) | 4 (6.9%) |
| Transportation & Warehousing | 0 (0.0%) | 0 (0.0%) |
| Utilities | 0 (0.0%) | 0 (0.0%) |
| Information | 0 (0.0%) | 0 (0.0%) |
| Finance & Insurance | 0 (0.0%) | 16 (100.0%) |
| Real Estate, Rental & Leasing | 0 (0.0%) | 0 (0.0%) |
| Professional & Scientific | 0 (0.0%) | 0 (0.0%) |
| Enterprise Management | 0 (0.0%) | 0 (0.0%) |
| Administrative & Support | 0 (0.0%) | 0 (0.0%) |
| Educational Services | 0 (0.0%) | 16 (100.0%) |
| Health Care & Social Assistance | 0 (0.0%) | 50 (100.0%) |
| Arts, Entertainment & Recreation | 0 (0.0%) | 10 (100.0%) |
| Accommodation & Food Services | 0 (0.0%) | 10 (100.0%) |
| Public Administration | 0 (0.0%) | 0 (0.0%) |
| Total | 123 (53.7%) | 106 (46.3%) |
Education in Philip
School Enrollment in Philip
The most common levels of schooling among the 53 students in Philip are nursery / preschool (18 | 34.0%), elementary school (11 | 20.7%), and kindergarten (8 | 15.1%).
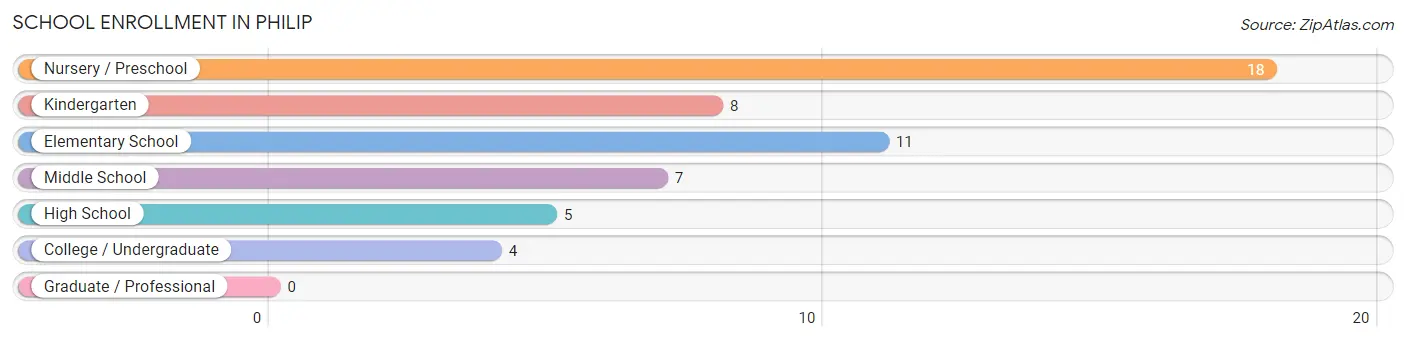
| School Level | # Students | % Students |
| Nursery / Preschool | 18 | 34.0% |
| Kindergarten | 8 | 15.1% |
| Elementary School | 11 | 20.7% |
| Middle School | 7 | 13.2% |
| High School | 5 | 9.4% |
| College / Undergraduate | 4 | 7.5% |
| Graduate / Professional | 0 | 0.0% |
| Total | 53 | 100.0% |
School Enrollment by Age by Funding Source in Philip
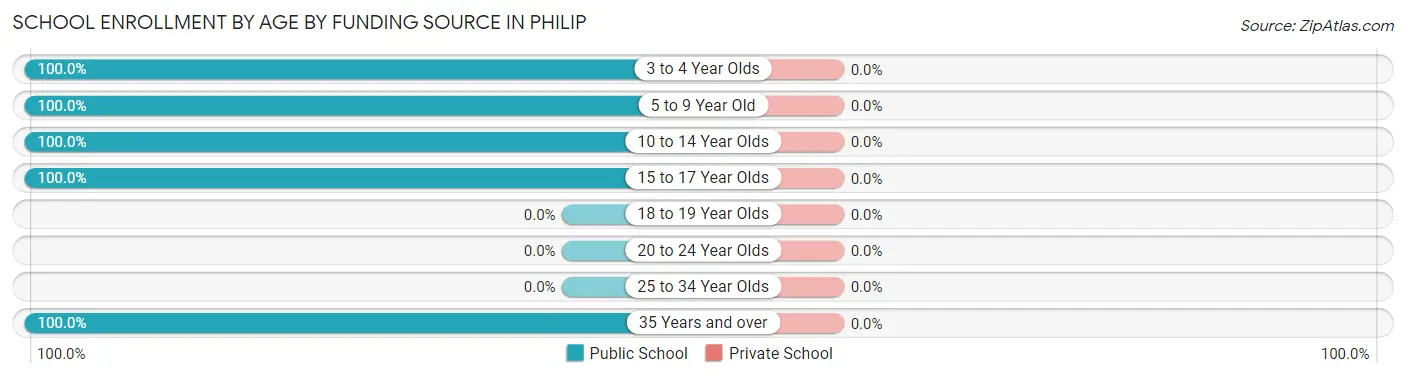
| Age Bracket | Public School | Private School |
| 3 to 4 Year Olds | 18 (100.0%) | 0 (0.0%) |
| 5 to 9 Year Old | 19 (100.0%) | 0 (0.0%) |
| 10 to 14 Year Olds | 7 (100.0%) | 0 (0.0%) |
| 15 to 17 Year Olds | 5 (100.0%) | 0 (0.0%) |
| 18 to 19 Year Olds | 0 (0.0%) | 0 (0.0%) |
| 20 to 24 Year Olds | 0 (0.0%) | 0 (0.0%) |
| 25 to 34 Year Olds | 0 (0.0%) | 0 (0.0%) |
| 35 Years and over | 4 (100.0%) | 0 (0.0%) |
| Total | 53 (100.0%) | 0 (0.0%) |
Educational Attainment by Field of Study in Philip
Business (13 | 33.3%), arts & humanities (12 | 30.8%), bio, nature & agricultural (5 | 12.8%), education (4 | 10.3%), and psychology (3 | 7.7%) are the most common fields of study among 39 individuals in Philip who have obtained a bachelor's degree or higher.
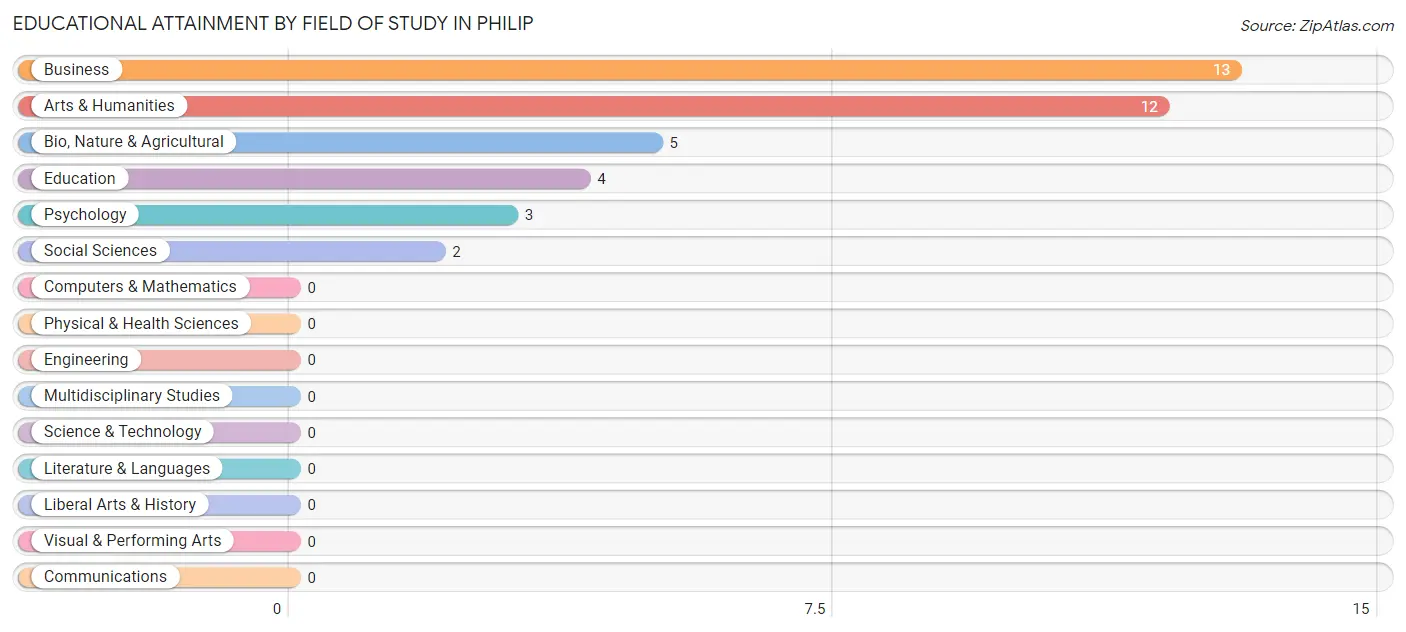
| Field of Study | # Graduates | % Graduates |
| Computers & Mathematics | 0 | 0.0% |
| Bio, Nature & Agricultural | 5 | 12.8% |
| Physical & Health Sciences | 0 | 0.0% |
| Psychology | 3 | 7.7% |
| Social Sciences | 2 | 5.1% |
| Engineering | 0 | 0.0% |
| Multidisciplinary Studies | 0 | 0.0% |
| Science & Technology | 0 | 0.0% |
| Business | 13 | 33.3% |
| Education | 4 | 10.3% |
| Literature & Languages | 0 | 0.0% |
| Liberal Arts & History | 0 | 0.0% |
| Visual & Performing Arts | 0 | 0.0% |
| Communications | 0 | 0.0% |
| Arts & Humanities | 12 | 30.8% |
| Total | 39 | 100.0% |
Transportation & Commute in Philip
Vehicle Availability by Sex in Philip
The most prevalent vehicle ownership categories in Philip are males with 3 vehicles (38, accounting for 30.9%) and females with 3 vehicles (10, making up 36.9%).
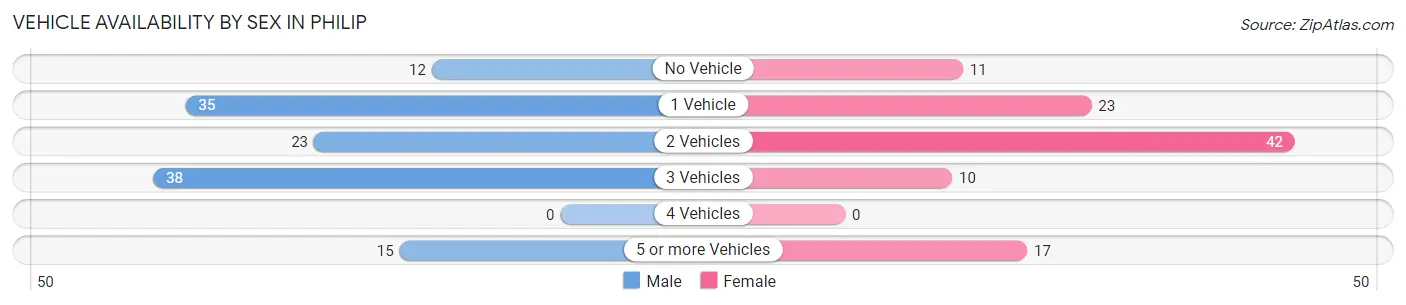
| Vehicles Available | Male | Female |
| No Vehicle | 12 (9.8%) | 11 (10.7%) |
| 1 Vehicle | 35 (28.5%) | 23 (22.3%) |
| 2 Vehicles | 23 (18.7%) | 42 (40.8%) |
| 3 Vehicles | 38 (30.9%) | 10 (9.7%) |
| 4 Vehicles | 0 (0.0%) | 0 (0.0%) |
| 5 or more Vehicles | 15 (12.2%) | 17 (16.5%) |
| Total | 123 (100.0%) | 103 (100.0%) |
Commute Time in Philip
The most frequently occuring commute durations in Philip are 5 to 9 minutes (176 commuters, 76.9%), 10 to 14 minutes (44 commuters, 19.2%), and 20 to 24 minutes (6 commuters, 2.6%).
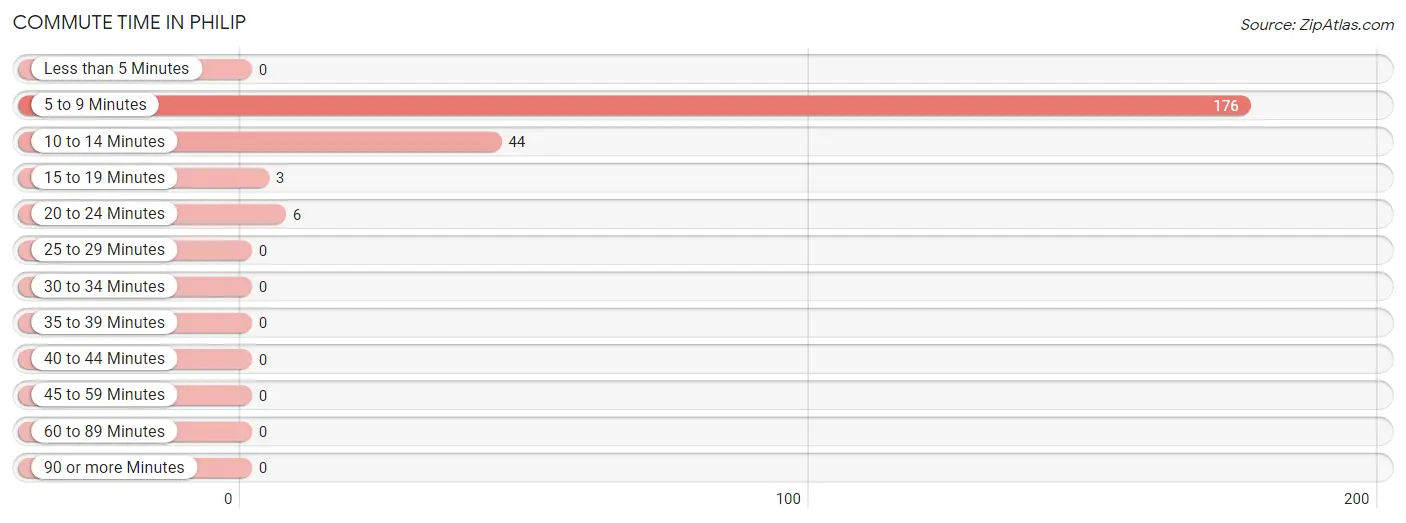
| Commute Time | # Commuters | % Commuters |
| Less than 5 Minutes | 0 | 0.0% |
| 5 to 9 Minutes | 176 | 76.9% |
| 10 to 14 Minutes | 44 | 19.2% |
| 15 to 19 Minutes | 3 | 1.3% |
| 20 to 24 Minutes | 6 | 2.6% |
| 25 to 29 Minutes | 0 | 0.0% |
| 30 to 34 Minutes | 0 | 0.0% |
| 35 to 39 Minutes | 0 | 0.0% |
| 40 to 44 Minutes | 0 | 0.0% |
| 45 to 59 Minutes | 0 | 0.0% |
| 60 to 89 Minutes | 0 | 0.0% |
| 90 or more Minutes | 0 | 0.0% |
Commute Time by Sex in Philip
The most common commute times in Philip are 5 to 9 minutes (89 commuters, 72.4%) for males and 5 to 9 minutes (87 commuters, 82.1%) for females.
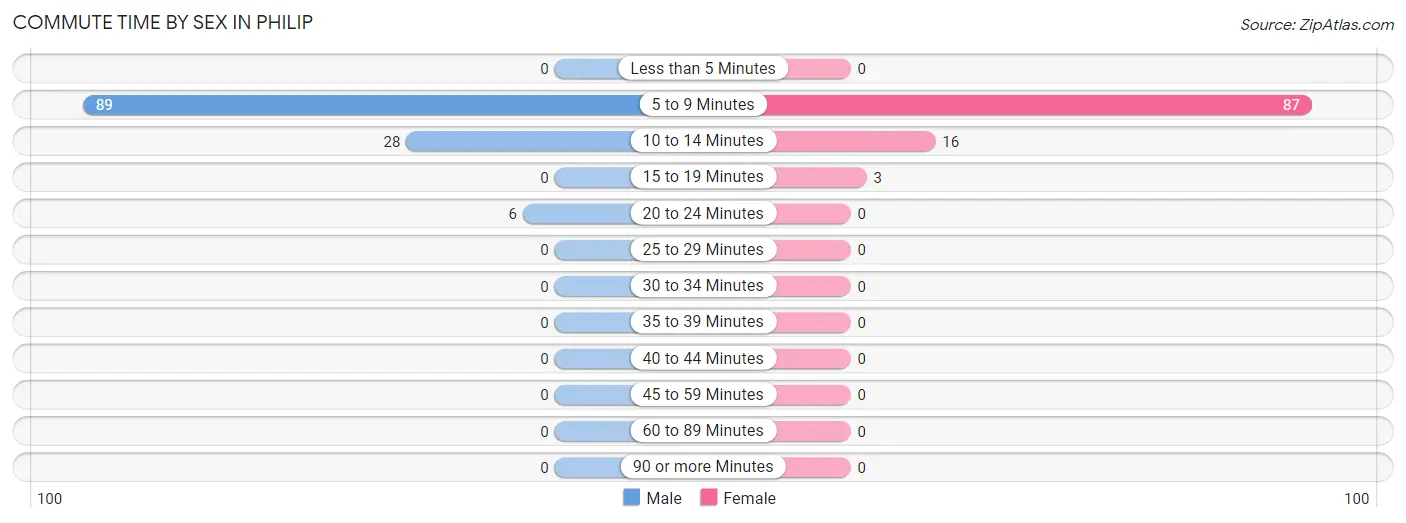
| Commute Time | Male | Female |
| Less than 5 Minutes | 0 (0.0%) | 0 (0.0%) |
| 5 to 9 Minutes | 89 (72.4%) | 87 (82.1%) |
| 10 to 14 Minutes | 28 (22.8%) | 16 (15.1%) |
| 15 to 19 Minutes | 0 (0.0%) | 3 (2.8%) |
| 20 to 24 Minutes | 6 (4.9%) | 0 (0.0%) |
| 25 to 29 Minutes | 0 (0.0%) | 0 (0.0%) |
| 30 to 34 Minutes | 0 (0.0%) | 0 (0.0%) |
| 35 to 39 Minutes | 0 (0.0%) | 0 (0.0%) |
| 40 to 44 Minutes | 0 (0.0%) | 0 (0.0%) |
| 45 to 59 Minutes | 0 (0.0%) | 0 (0.0%) |
| 60 to 89 Minutes | 0 (0.0%) | 0 (0.0%) |
| 90 or more Minutes | 0 (0.0%) | 0 (0.0%) |
Time of Departure to Work by Sex in Philip
The most frequent times of departure to work in Philip are 6:30 AM to 6:59 AM (58, 47.1%) for males and 7:30 AM to 7:59 AM (26, 24.5%) for females.
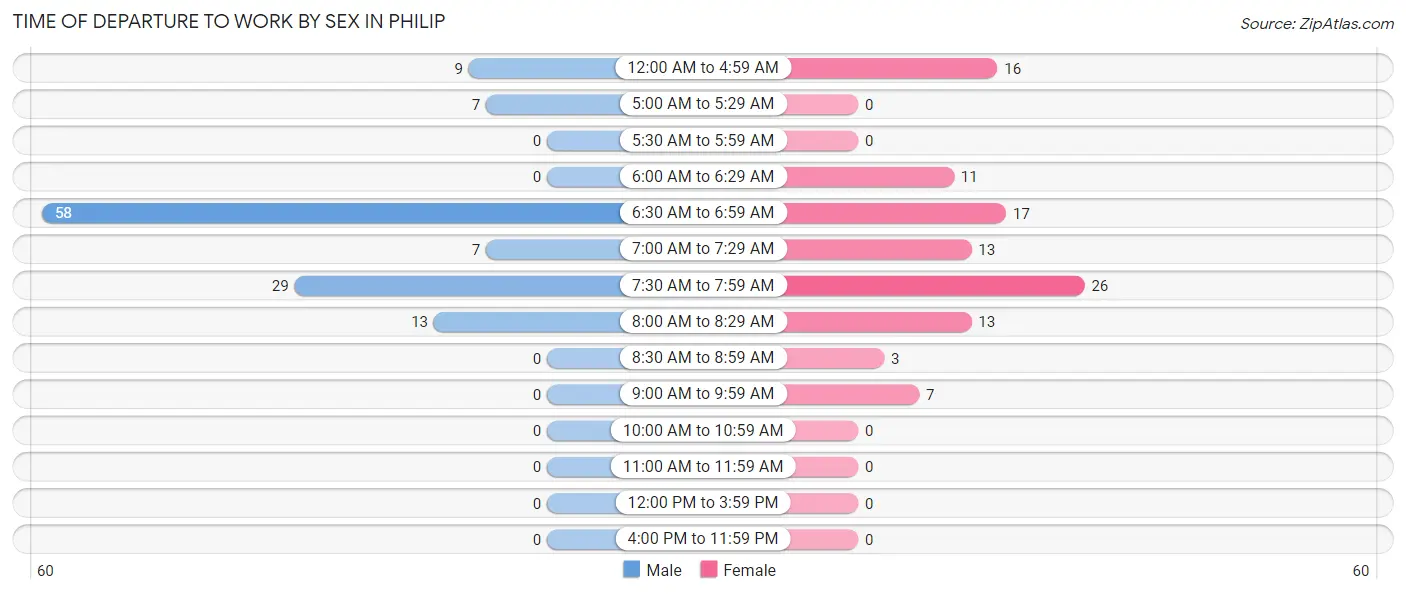
| Time of Departure | Male | Female |
| 12:00 AM to 4:59 AM | 9 (7.3%) | 16 (15.1%) |
| 5:00 AM to 5:29 AM | 7 (5.7%) | 0 (0.0%) |
| 5:30 AM to 5:59 AM | 0 (0.0%) | 0 (0.0%) |
| 6:00 AM to 6:29 AM | 0 (0.0%) | 11 (10.4%) |
| 6:30 AM to 6:59 AM | 58 (47.1%) | 17 (16.0%) |
| 7:00 AM to 7:29 AM | 7 (5.7%) | 13 (12.3%) |
| 7:30 AM to 7:59 AM | 29 (23.6%) | 26 (24.5%) |
| 8:00 AM to 8:29 AM | 13 (10.6%) | 13 (12.3%) |
| 8:30 AM to 8:59 AM | 0 (0.0%) | 3 (2.8%) |
| 9:00 AM to 9:59 AM | 0 (0.0%) | 7 (6.6%) |
| 10:00 AM to 10:59 AM | 0 (0.0%) | 0 (0.0%) |
| 11:00 AM to 11:59 AM | 0 (0.0%) | 0 (0.0%) |
| 12:00 PM to 3:59 PM | 0 (0.0%) | 0 (0.0%) |
| 4:00 PM to 11:59 PM | 0 (0.0%) | 0 (0.0%) |
| Total | 123 (100.0%) | 106 (100.0%) |
Housing Occupancy in Philip
Occupancy by Ownership in Philip
Of the total 244 dwellings in Philip, owner-occupied units account for 159 (65.2%), while renter-occupied units make up 85 (34.8%).
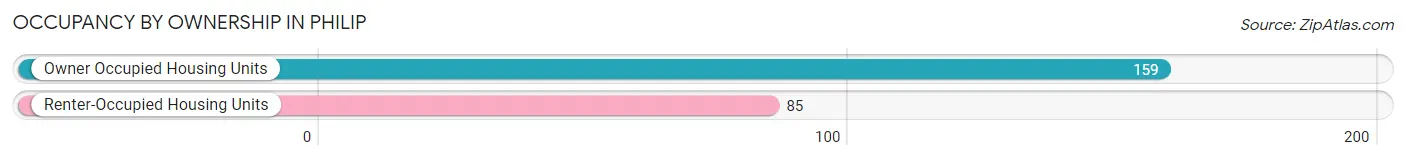
| Occupancy | # Housing Units | % Housing Units |
| Owner Occupied Housing Units | 159 | 65.2% |
| Renter-Occupied Housing Units | 85 | 34.8% |
| Total Occupied Housing Units | 244 | 100.0% |
Occupancy by Household Size in Philip
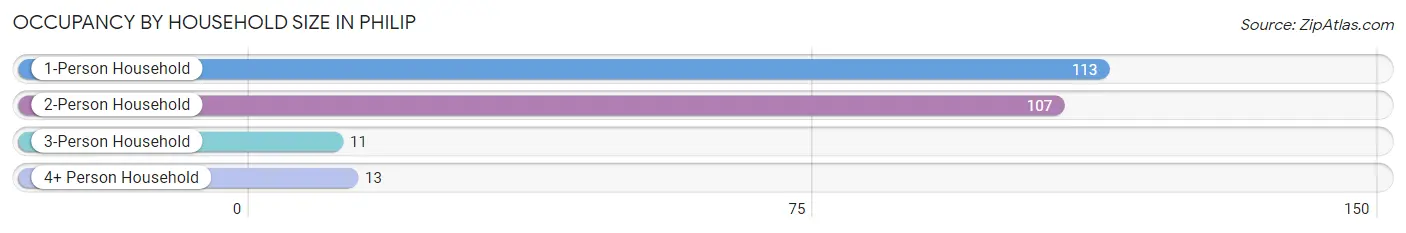
| Household Size | # Housing Units | % Housing Units |
| 1-Person Household | 113 | 46.3% |
| 2-Person Household | 107 | 43.9% |
| 3-Person Household | 11 | 4.5% |
| 4+ Person Household | 13 | 5.3% |
| Total Housing Units | 244 | 100.0% |
Occupancy by Ownership by Household Size in Philip
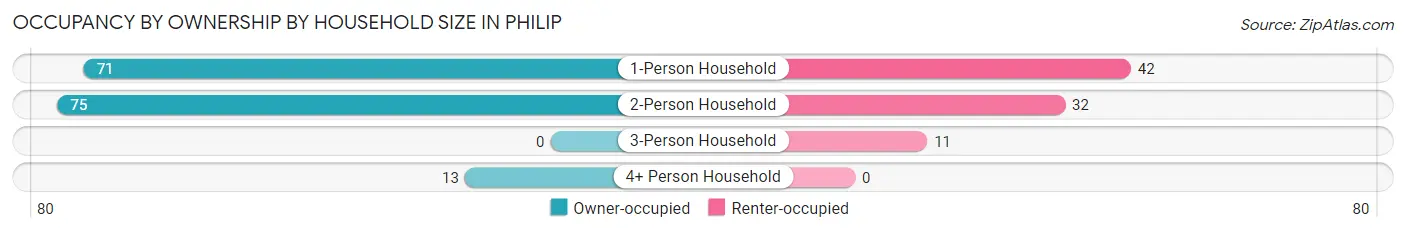
| Household Size | Owner-occupied | Renter-occupied |
| 1-Person Household | 71 (62.8%) | 42 (37.2%) |
| 2-Person Household | 75 (70.1%) | 32 (29.9%) |
| 3-Person Household | 0 (0.0%) | 11 (100.0%) |
| 4+ Person Household | 13 (100.0%) | 0 (0.0%) |
| Total Housing Units | 159 (65.2%) | 85 (34.8%) |
Occupancy by Educational Attainment in Philip
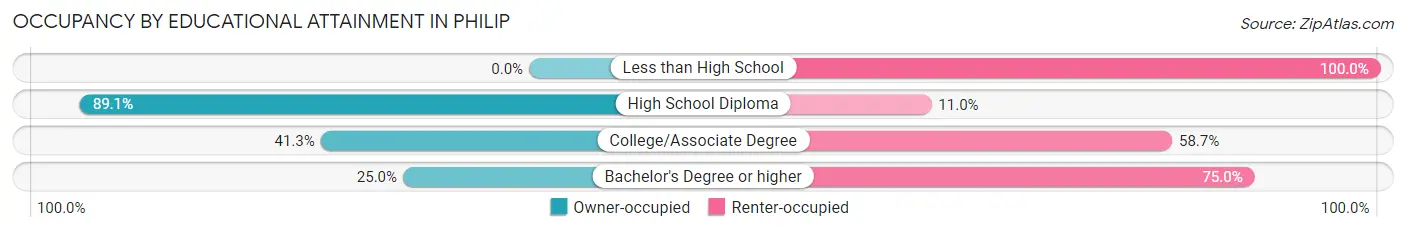
| Household Size | Owner-occupied | Renter-occupied |
| Less than High School | 0 (0.0%) | 8 (100.0%) |
| High School Diploma | 122 (89.0%) | 15 (11.0%) |
| College/Associate Degree | 31 (41.3%) | 44 (58.7%) |
| Bachelor's Degree or higher | 6 (25.0%) | 18 (75.0%) |
Occupancy by Age of Householder in Philip
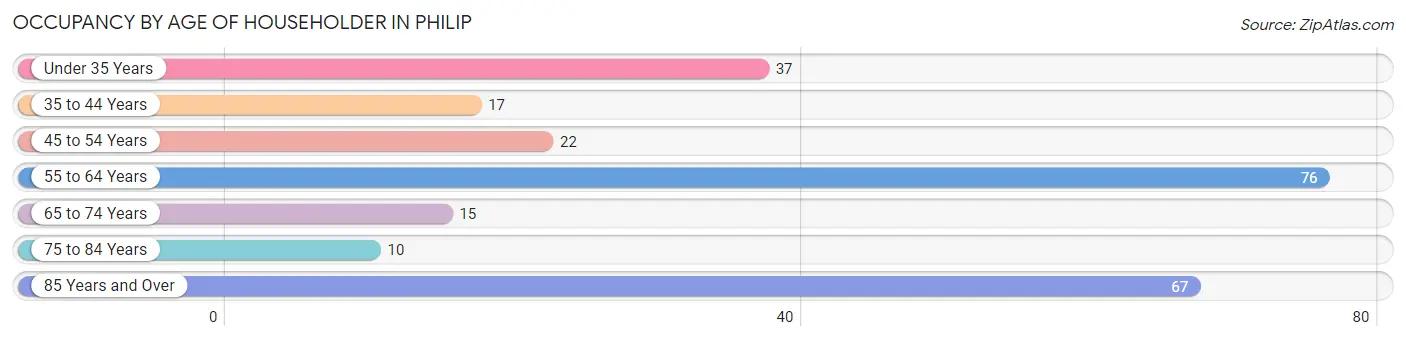
| Age Bracket | # Households | % Households |
| Under 35 Years | 37 | 15.2% |
| 35 to 44 Years | 17 | 7.0% |
| 45 to 54 Years | 22 | 9.0% |
| 55 to 64 Years | 76 | 31.1% |
| 65 to 74 Years | 15 | 6.1% |
| 75 to 84 Years | 10 | 4.1% |
| 85 Years and Over | 67 | 27.5% |
| Total | 244 | 100.0% |
Housing Finances in Philip
Median Income by Occupancy in Philip
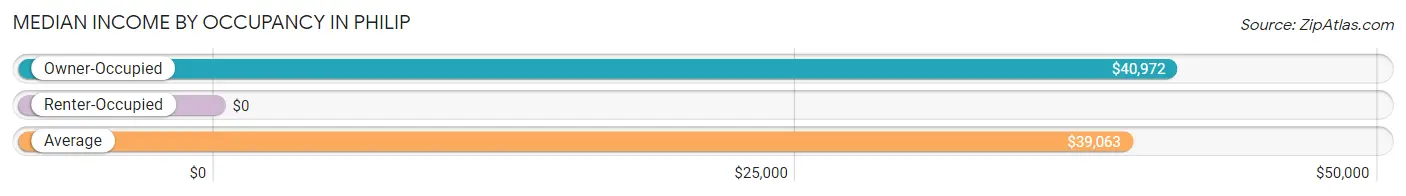
| Occupancy Type | # Households | Median Income |
| Owner-Occupied | 159 (65.2%) | $40,972 |
| Renter-Occupied | 85 (34.8%) | $0 |
| Average | 244 (100.0%) | $39,063 |
Occupancy by Householder Income Bracket in Philip
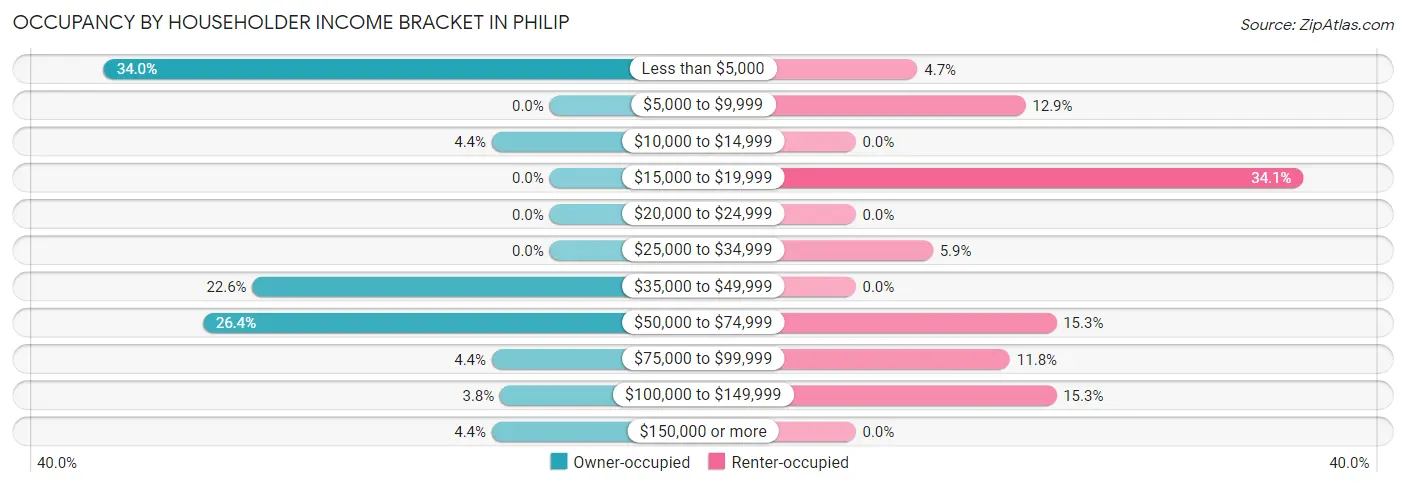
| Income Bracket | Owner-occupied | Renter-occupied |
| Less than $5,000 | 54 (34.0%) | 4 (4.7%) |
| $5,000 to $9,999 | 0 (0.0%) | 11 (12.9%) |
| $10,000 to $14,999 | 7 (4.4%) | 0 (0.0%) |
| $15,000 to $19,999 | 0 (0.0%) | 29 (34.1%) |
| $20,000 to $24,999 | 0 (0.0%) | 0 (0.0%) |
| $25,000 to $34,999 | 0 (0.0%) | 5 (5.9%) |
| $35,000 to $49,999 | 36 (22.6%) | 0 (0.0%) |
| $50,000 to $74,999 | 42 (26.4%) | 13 (15.3%) |
| $75,000 to $99,999 | 7 (4.4%) | 10 (11.8%) |
| $100,000 to $149,999 | 6 (3.8%) | 13 (15.3%) |
| $150,000 or more | 7 (4.4%) | 0 (0.0%) |
| Total | 159 (100.0%) | 85 (100.0%) |
Monthly Housing Cost Tiers in Philip
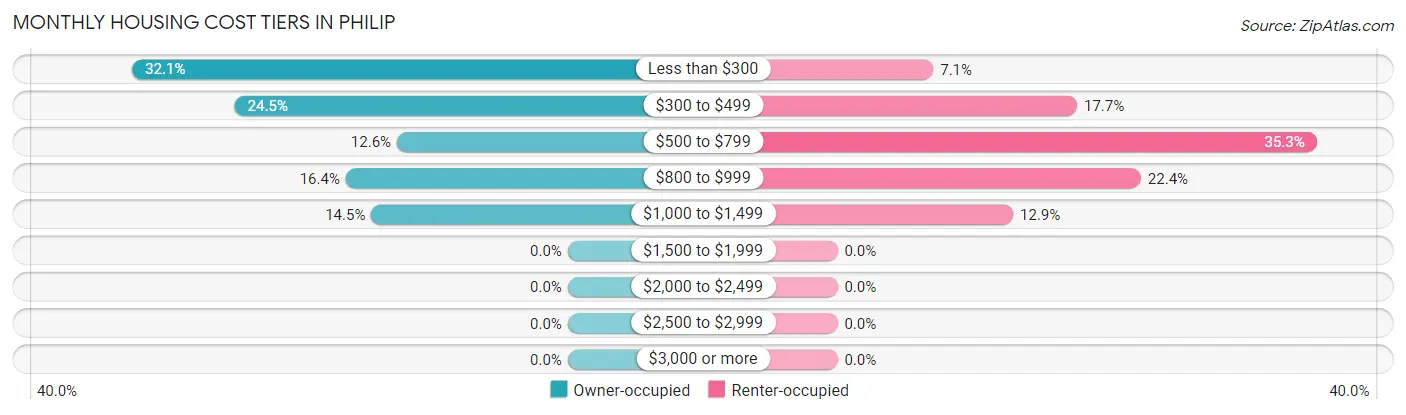
| Monthly Cost | Owner-occupied | Renter-occupied |
| Less than $300 | 51 (32.1%) | 6 (7.1%) |
| $300 to $499 | 39 (24.5%) | 15 (17.6%) |
| $500 to $799 | 20 (12.6%) | 30 (35.3%) |
| $800 to $999 | 26 (16.4%) | 19 (22.4%) |
| $1,000 to $1,499 | 23 (14.5%) | 11 (12.9%) |
| $1,500 to $1,999 | 0 (0.0%) | 0 (0.0%) |
| $2,000 to $2,499 | 0 (0.0%) | 0 (0.0%) |
| $2,500 to $2,999 | 0 (0.0%) | 0 (0.0%) |
| $3,000 or more | 0 (0.0%) | 0 (0.0%) |
| Total | 159 (100.0%) | 85 (100.0%) |
Physical Housing Characteristics in Philip
Housing Structures in Philip
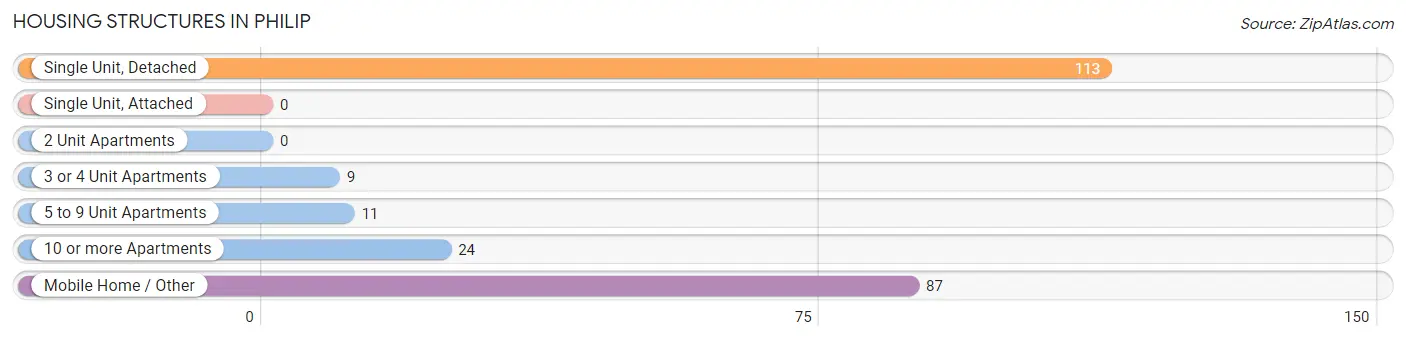
| Structure Type | # Housing Units | % Housing Units |
| Single Unit, Detached | 113 | 46.3% |
| Single Unit, Attached | 0 | 0.0% |
| 2 Unit Apartments | 0 | 0.0% |
| 3 or 4 Unit Apartments | 9 | 3.7% |
| 5 to 9 Unit Apartments | 11 | 4.5% |
| 10 or more Apartments | 24 | 9.8% |
| Mobile Home / Other | 87 | 35.7% |
| Total | 244 | 100.0% |
Housing Structures by Occupancy in Philip
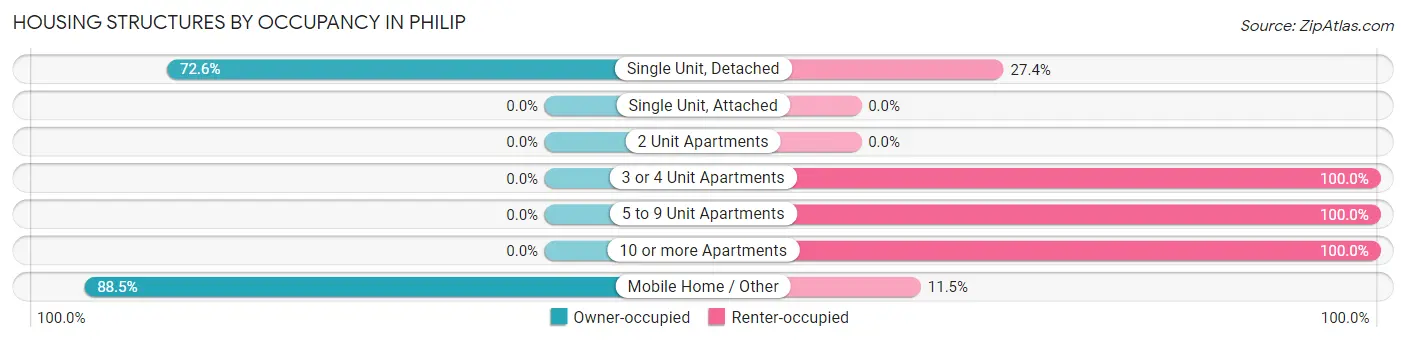
| Structure Type | Owner-occupied | Renter-occupied |
| Single Unit, Detached | 82 (72.6%) | 31 (27.4%) |
| Single Unit, Attached | 0 (0.0%) | 0 (0.0%) |
| 2 Unit Apartments | 0 (0.0%) | 0 (0.0%) |
| 3 or 4 Unit Apartments | 0 (0.0%) | 9 (100.0%) |
| 5 to 9 Unit Apartments | 0 (0.0%) | 11 (100.0%) |
| 10 or more Apartments | 0 (0.0%) | 24 (100.0%) |
| Mobile Home / Other | 77 (88.5%) | 10 (11.5%) |
| Total | 159 (65.2%) | 85 (34.8%) |
Housing Structures by Number of Rooms in Philip
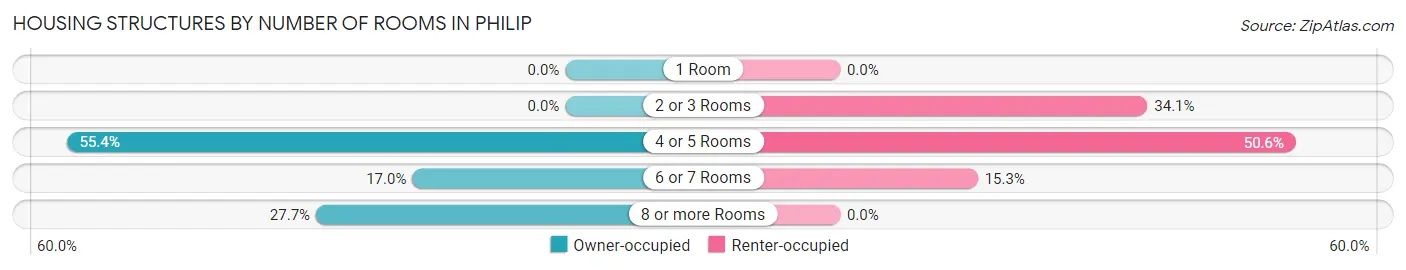
| Number of Rooms | Owner-occupied | Renter-occupied |
| 1 Room | 0 (0.0%) | 0 (0.0%) |
| 2 or 3 Rooms | 0 (0.0%) | 29 (34.1%) |
| 4 or 5 Rooms | 88 (55.3%) | 43 (50.6%) |
| 6 or 7 Rooms | 27 (17.0%) | 13 (15.3%) |
| 8 or more Rooms | 44 (27.7%) | 0 (0.0%) |
| Total | 159 (100.0%) | 85 (100.0%) |
Housing Structure by Heating Type in Philip
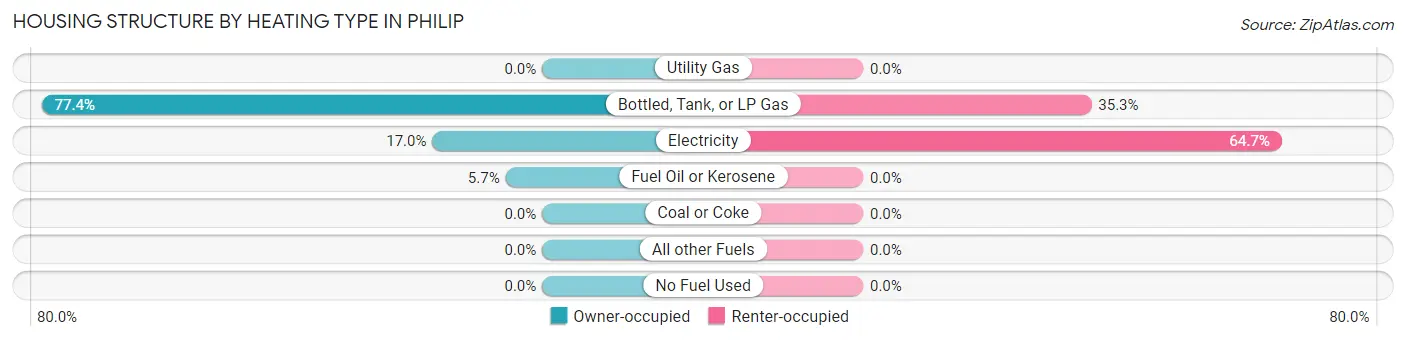
| Heating Type | Owner-occupied | Renter-occupied |
| Utility Gas | 0 (0.0%) | 0 (0.0%) |
| Bottled, Tank, or LP Gas | 123 (77.4%) | 30 (35.3%) |
| Electricity | 27 (17.0%) | 55 (64.7%) |
| Fuel Oil or Kerosene | 9 (5.7%) | 0 (0.0%) |
| Coal or Coke | 0 (0.0%) | 0 (0.0%) |
| All other Fuels | 0 (0.0%) | 0 (0.0%) |
| No Fuel Used | 0 (0.0%) | 0 (0.0%) |
| Total | 159 (100.0%) | 85 (100.0%) |
Household Vehicle Usage in Philip
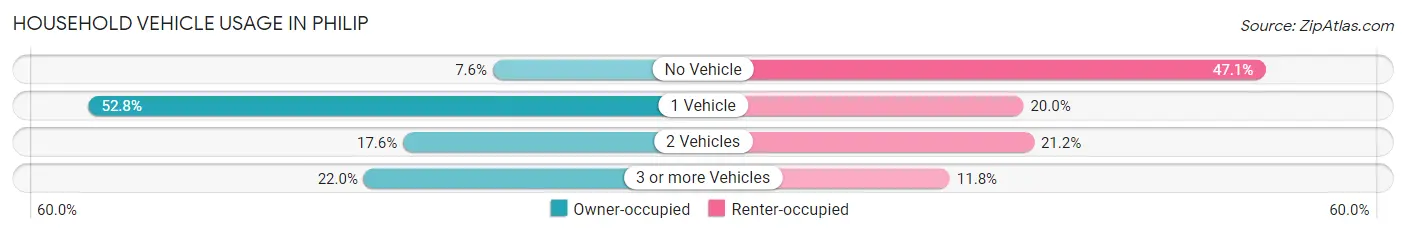
| Vehicles per Household | Owner-occupied | Renter-occupied |
| No Vehicle | 12 (7.5%) | 40 (47.1%) |
| 1 Vehicle | 84 (52.8%) | 17 (20.0%) |
| 2 Vehicles | 28 (17.6%) | 18 (21.2%) |
| 3 or more Vehicles | 35 (22.0%) | 10 (11.8%) |
| Total | 159 (100.0%) | 85 (100.0%) |
Real Estate & Mortgages in Philip
Real Estate and Mortgage Overview in Philip
| Characteristic | Without Mortgage | With Mortgage |
| Housing Units | 119 | 40 |
| Median Property Value | $126,800 | $88,600 |
| Median Household Income | $40,139 | $7 |
| Monthly Housing Costs | $327 | $0 |
| Real Estate Taxes | $811 | $0 |
Property Value by Mortgage Status in Philip
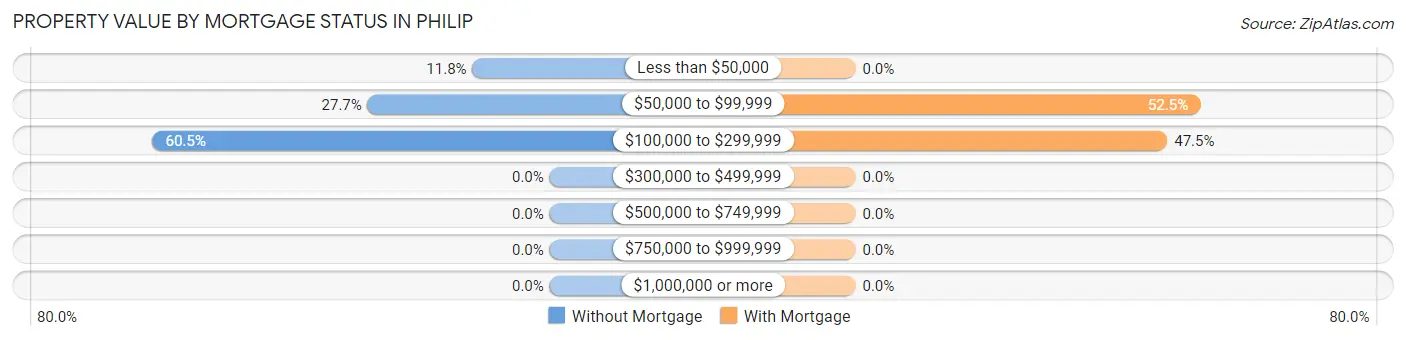
| Property Value | Without Mortgage | With Mortgage |
| Less than $50,000 | 14 (11.8%) | 0 (0.0%) |
| $50,000 to $99,999 | 33 (27.7%) | 21 (52.5%) |
| $100,000 to $299,999 | 72 (60.5%) | 19 (47.5%) |
| $300,000 to $499,999 | 0 (0.0%) | 0 (0.0%) |
| $500,000 to $749,999 | 0 (0.0%) | 0 (0.0%) |
| $750,000 to $999,999 | 0 (0.0%) | 0 (0.0%) |
| $1,000,000 or more | 0 (0.0%) | 0 (0.0%) |
| Total | 119 (100.0%) | 40 (100.0%) |
Household Income by Mortgage Status in Philip
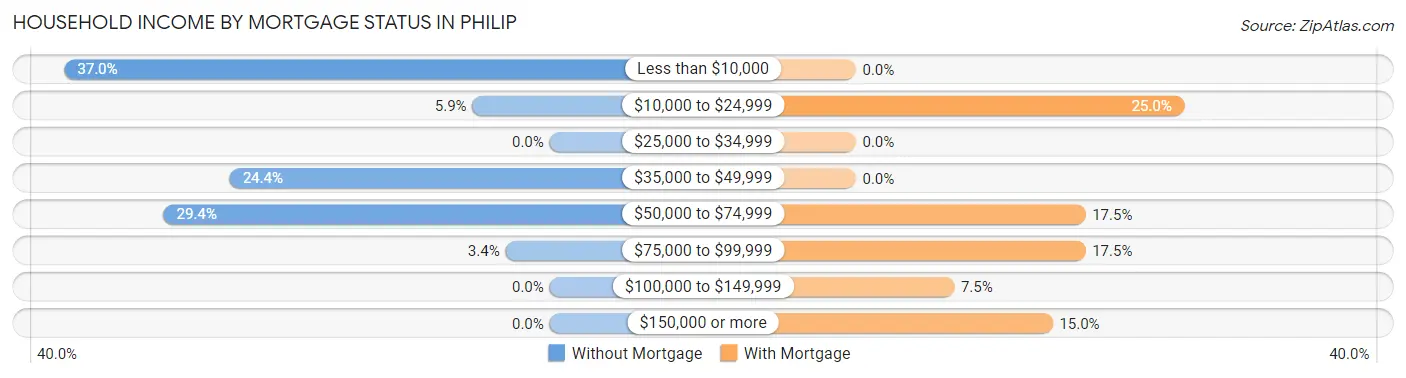
| Household Income | Without Mortgage | With Mortgage |
| Less than $10,000 | 44 (37.0%) | 0 (0.0%) |
| $10,000 to $24,999 | 7 (5.9%) | 10 (25.0%) |
| $25,000 to $34,999 | 0 (0.0%) | 0 (0.0%) |
| $35,000 to $49,999 | 29 (24.4%) | 0 (0.0%) |
| $50,000 to $74,999 | 35 (29.4%) | 7 (17.5%) |
| $75,000 to $99,999 | 4 (3.4%) | 7 (17.5%) |
| $100,000 to $149,999 | 0 (0.0%) | 3 (7.5%) |
| $150,000 or more | 0 (0.0%) | 6 (15.0%) |
| Total | 119 (100.0%) | 40 (100.0%) |
Property Value to Household Income Ratio in Philip
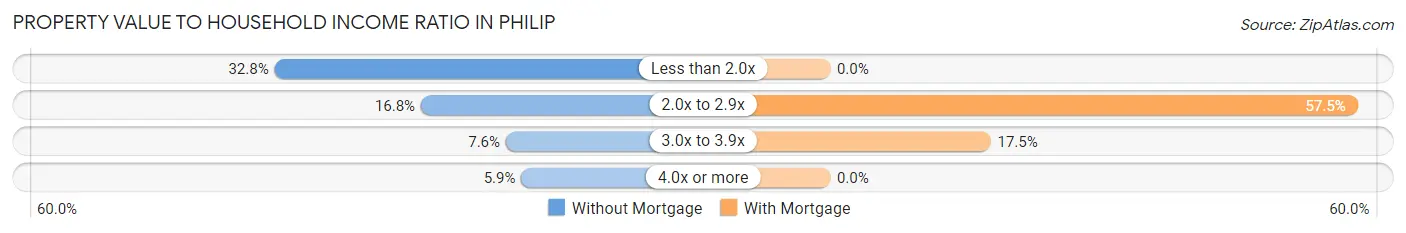
| Value-to-Income Ratio | Without Mortgage | With Mortgage |
| Less than 2.0x | 39 (32.8%) | 0 (0.0%) |
| 2.0x to 2.9x | 20 (16.8%) | 23 (57.5%) |
| 3.0x to 3.9x | 9 (7.6%) | 7 (17.5%) |
| 4.0x or more | 7 (5.9%) | 0 (0.0%) |
| Total | 119 (100.0%) | 40 (100.0%) |
Real Estate Taxes by Mortgage Status in Philip
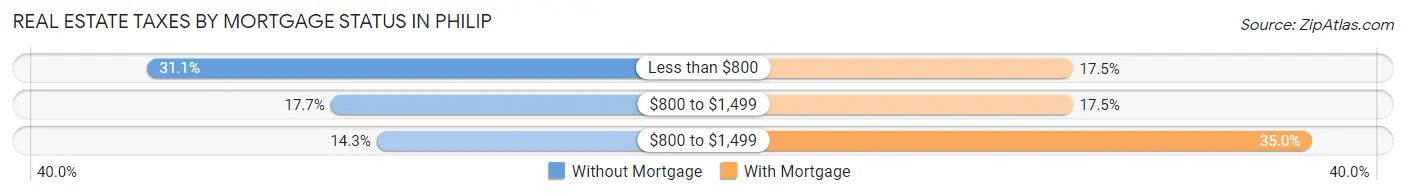
| Property Taxes | Without Mortgage | With Mortgage |
| Less than $800 | 37 (31.1%) | 7 (17.5%) |
| $800 to $1,499 | 21 (17.6%) | 7 (17.5%) |
| $800 to $1,499 | 17 (14.3%) | 14 (35.0%) |
| Total | 119 (100.0%) | 40 (100.0%) |
Health & Disability in Philip
Health Insurance Coverage by Age in Philip
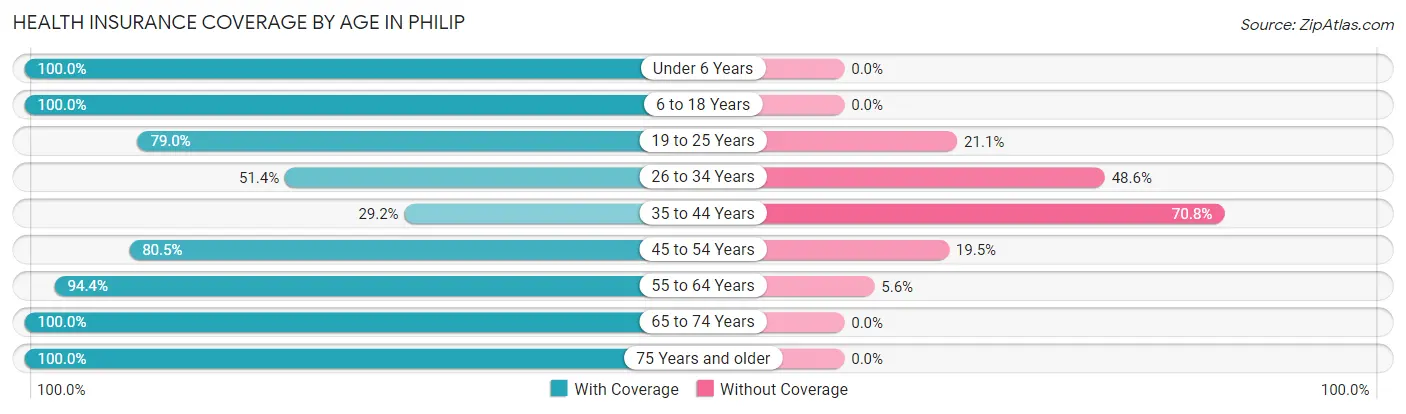
| Age Bracket | With Coverage | Without Coverage |
| Under 6 Years | 18 (100.0%) | 0 (0.0%) |
| 6 to 18 Years | 31 (100.0%) | 0 (0.0%) |
| 19 to 25 Years | 60 (78.9%) | 16 (21.0%) |
| 26 to 34 Years | 18 (51.4%) | 17 (48.6%) |
| 35 to 44 Years | 7 (29.2%) | 17 (70.8%) |
| 45 to 54 Years | 33 (80.5%) | 8 (19.5%) |
| 55 to 64 Years | 118 (94.4%) | 7 (5.6%) |
| 65 to 74 Years | 36 (100.0%) | 0 (0.0%) |
| 75 Years and older | 77 (100.0%) | 0 (0.0%) |
| Total | 398 (86.0%) | 65 (14.0%) |
Health Insurance Coverage by Citizenship Status in Philip
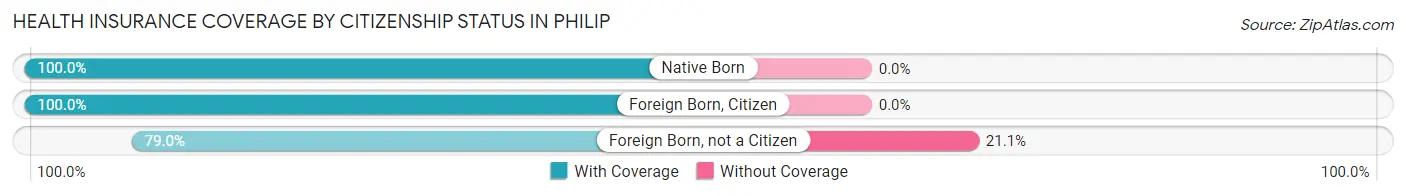
| Citizenship Status | With Coverage | Without Coverage |
| Native Born | 18 (100.0%) | 0 (0.0%) |
| Foreign Born, Citizen | 31 (100.0%) | 0 (0.0%) |
| Foreign Born, not a Citizen | 60 (78.9%) | 16 (21.0%) |
Health Insurance Coverage by Household Income in Philip
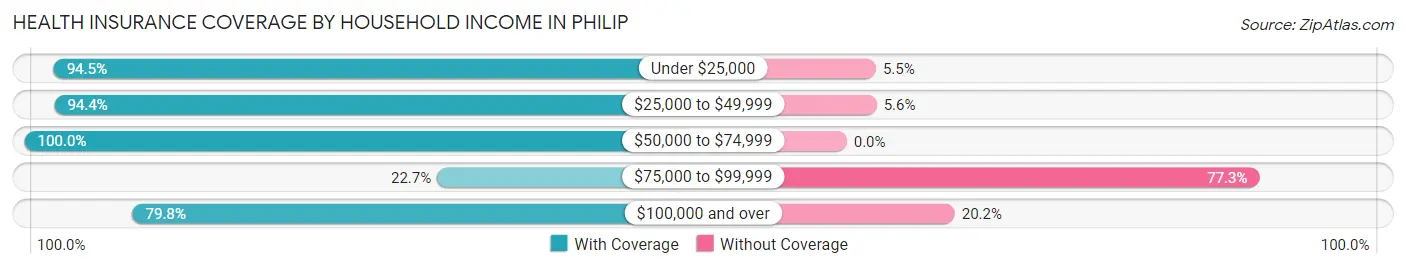
| Household Income | With Coverage | Without Coverage |
| Under $25,000 | 121 (94.5%) | 7 (5.5%) |
| $25,000 to $49,999 | 118 (94.4%) | 7 (5.6%) |
| $50,000 to $74,999 | 77 (100.0%) | 0 (0.0%) |
| $75,000 to $99,999 | 10 (22.7%) | 34 (77.3%) |
| $100,000 and over | 67 (79.8%) | 17 (20.2%) |
Public vs Private Health Insurance Coverage by Age in Philip
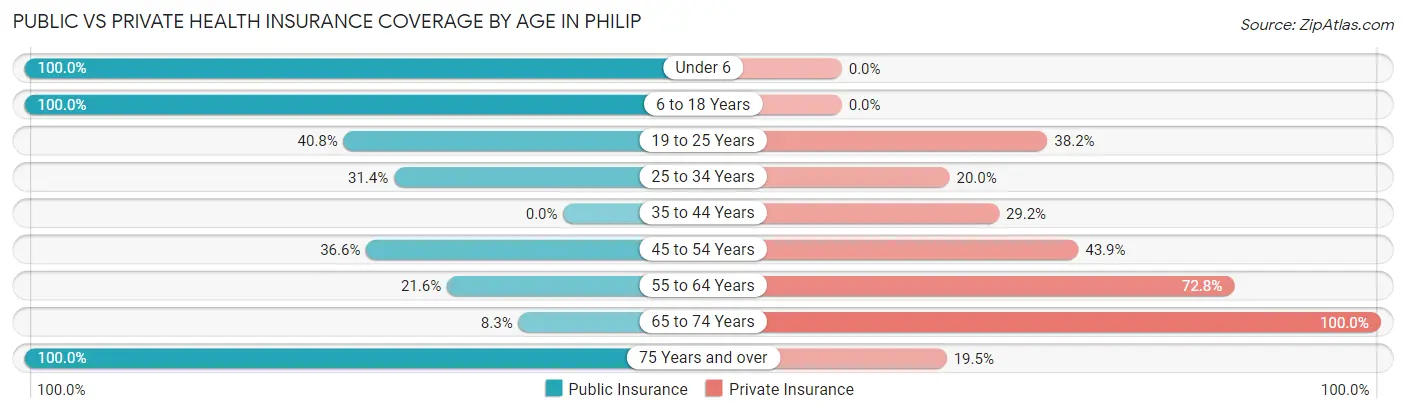
| Age Bracket | Public Insurance | Private Insurance |
| Under 6 | 18 (100.0%) | 0 (0.0%) |
| 6 to 18 Years | 31 (100.0%) | 0 (0.0%) |
| 19 to 25 Years | 31 (40.8%) | 29 (38.2%) |
| 25 to 34 Years | 11 (31.4%) | 7 (20.0%) |
| 35 to 44 Years | 0 (0.0%) | 7 (29.2%) |
| 45 to 54 Years | 15 (36.6%) | 18 (43.9%) |
| 55 to 64 Years | 27 (21.6%) | 91 (72.8%) |
| 65 to 74 Years | 3 (8.3%) | 36 (100.0%) |
| 75 Years and over | 77 (100.0%) | 15 (19.5%) |
| Total | 213 (46.0%) | 203 (43.8%) |
Disability Status by Sex by Age in Philip
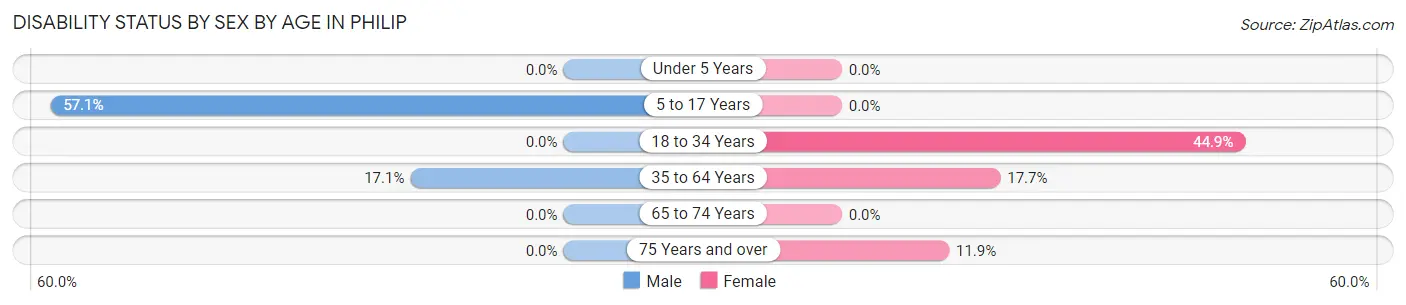
| Age Bracket | Male | Female |
| Under 5 Years | 0 (0.0%) | 0 (0.0%) |
| 5 to 17 Years | 8 (57.1%) | 0 (0.0%) |
| 18 to 34 Years | 0 (0.0%) | 31 (44.9%) |
| 35 to 64 Years | 15 (17.1%) | 18 (17.6%) |
| 65 to 74 Years | 0 (0.0%) | 0 (0.0%) |
| 75 Years and over | 0 (0.0%) | 8 (11.9%) |
Disability Class by Sex by Age in Philip
Disability Class: Hearing Difficulty
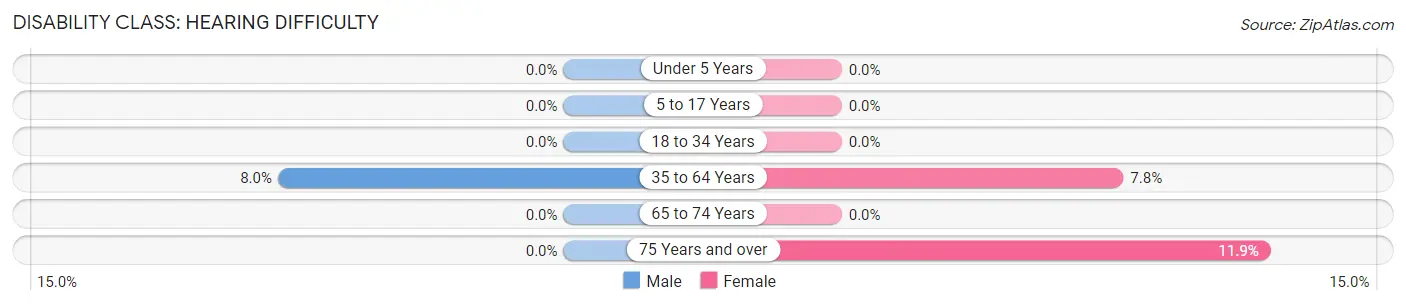
| Age Bracket | Male | Female |
| Under 5 Years | 0 (0.0%) | 0 (0.0%) |
| 5 to 17 Years | 0 (0.0%) | 0 (0.0%) |
| 18 to 34 Years | 0 (0.0%) | 0 (0.0%) |
| 35 to 64 Years | 7 (8.0%) | 8 (7.8%) |
| 65 to 74 Years | 0 (0.0%) | 0 (0.0%) |
| 75 Years and over | 0 (0.0%) | 8 (11.9%) |
Disability Class: Vision Difficulty
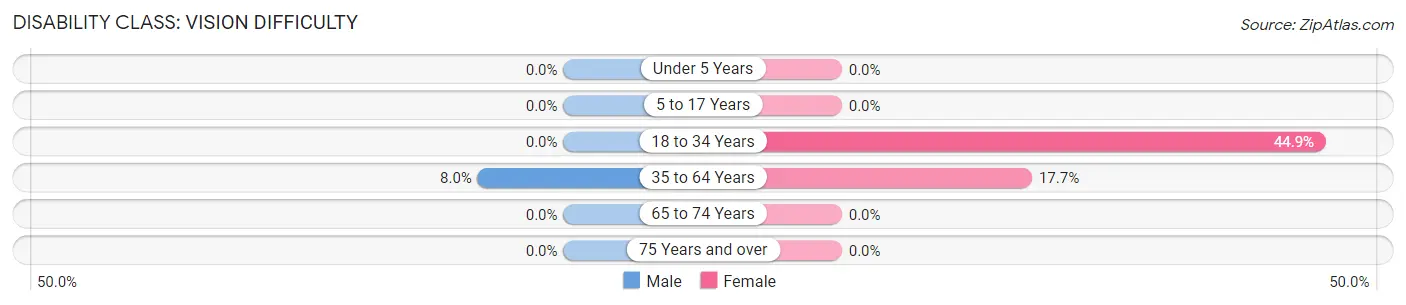
| Age Bracket | Male | Female |
| Under 5 Years | 0 (0.0%) | 0 (0.0%) |
| 5 to 17 Years | 0 (0.0%) | 0 (0.0%) |
| 18 to 34 Years | 0 (0.0%) | 31 (44.9%) |
| 35 to 64 Years | 7 (8.0%) | 18 (17.6%) |
| 65 to 74 Years | 0 (0.0%) | 0 (0.0%) |
| 75 Years and over | 0 (0.0%) | 0 (0.0%) |
Disability Class: Cognitive Difficulty
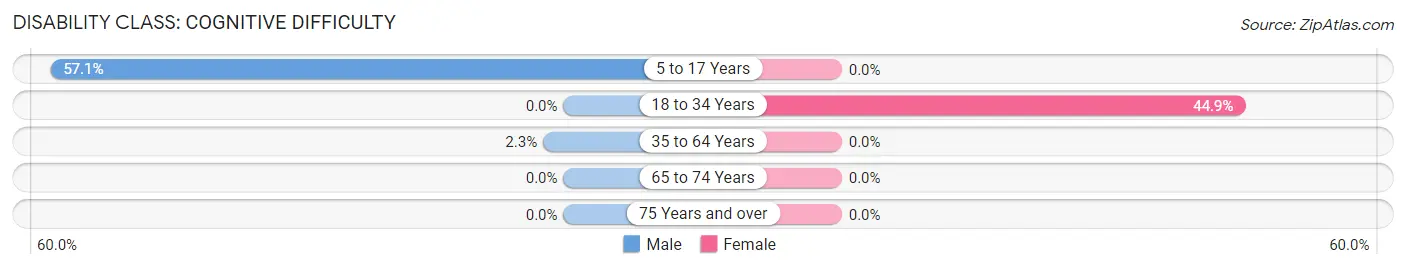
| Age Bracket | Male | Female |
| 5 to 17 Years | 8 (57.1%) | 0 (0.0%) |
| 18 to 34 Years | 0 (0.0%) | 31 (44.9%) |
| 35 to 64 Years | 2 (2.3%) | 0 (0.0%) |
| 65 to 74 Years | 0 (0.0%) | 0 (0.0%) |
| 75 Years and over | 0 (0.0%) | 0 (0.0%) |
Disability Class: Ambulatory Difficulty
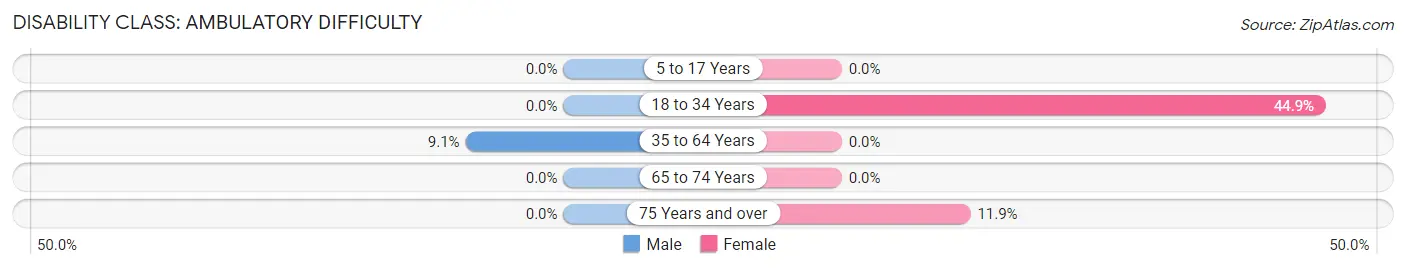
| Age Bracket | Male | Female |
| 5 to 17 Years | 0 (0.0%) | 0 (0.0%) |
| 18 to 34 Years | 0 (0.0%) | 31 (44.9%) |
| 35 to 64 Years | 8 (9.1%) | 0 (0.0%) |
| 65 to 74 Years | 0 (0.0%) | 0 (0.0%) |
| 75 Years and over | 0 (0.0%) | 8 (11.9%) |
Disability Class: Self-Care Difficulty
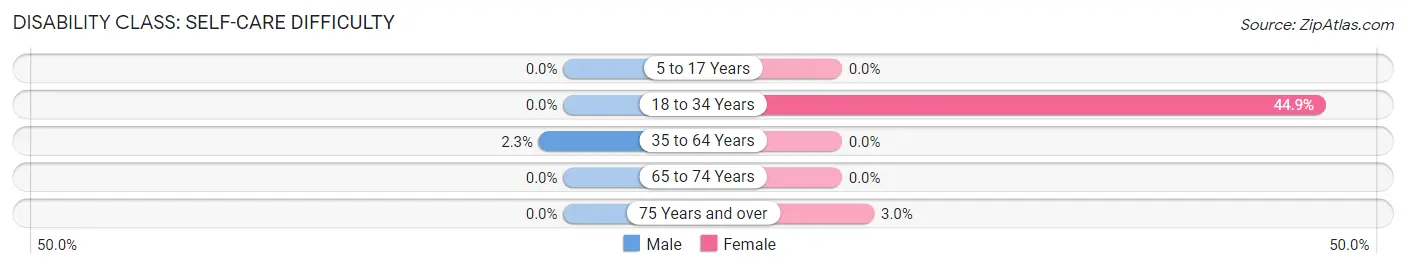
| Age Bracket | Male | Female |
| 5 to 17 Years | 0 (0.0%) | 0 (0.0%) |
| 18 to 34 Years | 0 (0.0%) | 31 (44.9%) |
| 35 to 64 Years | 2 (2.3%) | 0 (0.0%) |
| 65 to 74 Years | 0 (0.0%) | 0 (0.0%) |
| 75 Years and over | 0 (0.0%) | 2 (3.0%) |
Technology Access in Philip
Computing Device Access in Philip
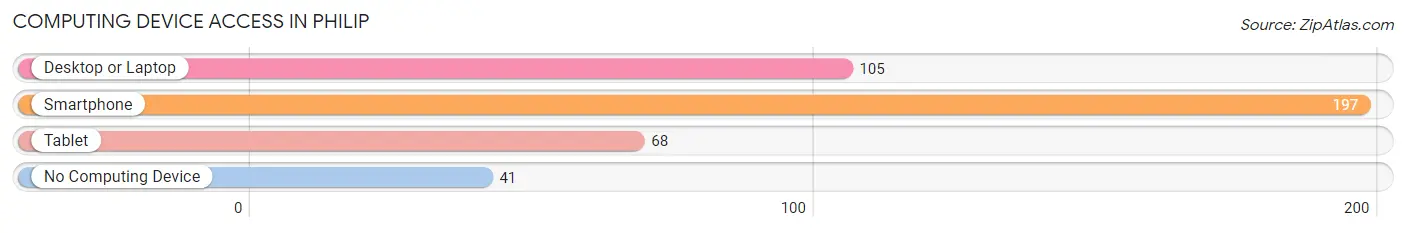
| Device Type | # Households | % Households |
| Desktop or Laptop | 105 | 43.0% |
| Smartphone | 197 | 80.7% |
| Tablet | 68 | 27.9% |
| No Computing Device | 41 | 16.8% |
| Total | 244 | 100.0% |
Internet Access in Philip
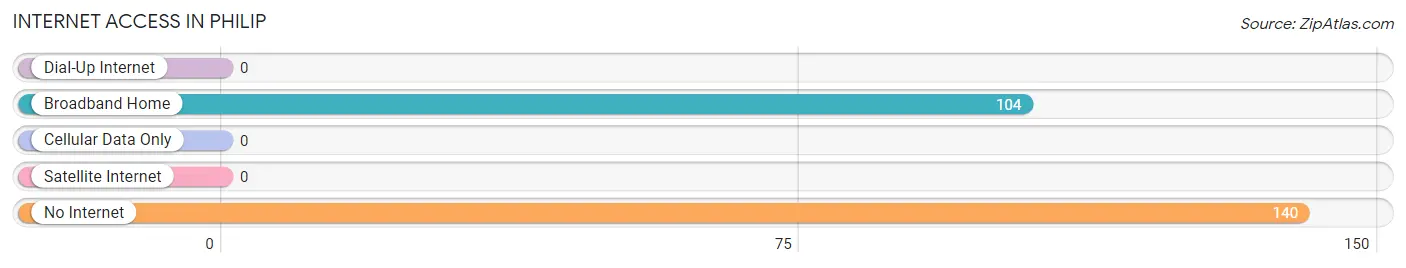
| Internet Type | # Households | % Households |
| Dial-Up Internet | 0 | 0.0% |
| Broadband Home | 104 | 42.6% |
| Cellular Data Only | 0 | 0.0% |
| Satellite Internet | 0 | 0.0% |
| No Internet | 140 | 57.4% |
| Total | 244 | 100.0% |
Philip Summary
Philip, South Dakota is a small town located in the southwestern part of the state. It is the county seat of Haakon County and is situated on the edge of the Badlands. The town was founded in 1883 and has a population of 1,072 as of the 2010 census.
History
The town of Philip was founded in 1883 by Philip J. Philip, a rancher and businessman from Wisconsin. He was the first settler in the area and named the town after himself. The town was officially incorporated in 1887.
In the early days, Philip was a small farming and ranching community. The town was also a stop on the Chicago, Milwaukee, St. Paul and Pacific Railroad, which helped to bring in new settlers and businesses.
In the early 1900s, the town began to grow and prosper. The Philip Commercial Club was formed in 1909 to promote the town and attract new businesses. The club was successful in bringing in new businesses, including a bank, a hotel, a newspaper, and a theater.
In the 1920s, the town experienced a boom in population and businesses. The population grew from 500 in 1920 to 1,000 in 1930. The town also saw the construction of a new school, a hospital, and a library.
In the 1940s, the town experienced a decline in population and businesses. The railroad stopped running in the 1940s and the town's economy suffered. The population dropped to 500 by 1950.
In the 1950s, the town began to experience a resurgence. The population grew to 1,000 by 1960 and the town saw the construction of a new high school and a new hospital.
In the 1970s, the town experienced a decline in population and businesses. The population dropped to 500 by 1980.
In the 1990s, the town began to experience a resurgence. The population grew to 1,000 by 2000 and the town saw the construction of a new library and a new community center.
Geography
Philip is located in the southwestern part of South Dakota, in Haakon County. It is situated on the edge of the Badlands, a region of rugged terrain and sparse vegetation. The town is located at an elevation of 3,000 feet and has a total area of 1.2 square miles.
The town is located on the Cheyenne River, which flows through the area. The town is also located near the Badlands National Park, which is a popular tourist destination.
Economy
The economy of Philip is largely based on agriculture and tourism. The town is home to several farms and ranches, which produce beef, dairy, and other agricultural products. The town is also home to several tourist attractions, including the Badlands National Park and the Philip Historical Museum.
The town is also home to several businesses, including a bank, a hotel, a newspaper, and a theater. The town also has several restaurants, bars, and other retail establishments.
Demographics
As of the 2010 census, the population of Philip was 1,072. The racial makeup of the town was 97.2% White, 0.3% African American, 0.3% Native American, 0.3% Asian, 0.3% from other races, and 1.5% from two or more races. Hispanic or Latino of any race were 1.2% of the population.
The median income for a household in the town was $37,500 and the median income for a family was $45,000. The per capita income for the town was $18,000. About 11.2% of families and 14.2% of the population were below the poverty line, including 18.2% of those under age 18 and 8.3% of those age 65 or over.
Common Questions
What is Per Capita Income in Philip?
Per Capita income in Philip is $24,295.
What is the Median Family Income in Philip?
Median Family Income in Philip is $43,854.
What is the Median Household income in Philip?
Median Household Income in Philip is $39,063.
What is Income or Wage Gap in Philip?
Income or Wage Gap in Philip is 50.5%.
Women in Philip earn 49.5 cents for every dollar earned by a man.
What is Inequality or Gini Index in Philip?
Inequality or Gini Index in Philip is 0.54.
What is the Total Population of Philip?
Total Population of Philip is 503.
What is the Total Male Population of Philip?
Total Male Population of Philip is 197.
What is the Total Female Population of Philip?
Total Female Population of Philip is 306.
What is the Ratio of Males per 100 Females in Philip?
There are 64.38 Males per 100 Females in Philip.
What is the Ratio of Females per 100 Males in Philip?
There are 155.33 Females per 100 Males in Philip.
What is the Median Population Age in Philip?
Median Population Age in Philip is 58.2 Years.
What is the Average Family Size in Philip
Average Family Size in Philip is 2.8 People.
What is the Average Household Size in Philip
Average Household Size in Philip is 1.9 People.
How Large is the Labor Force in Philip?
There are 229 People in the Labor Forcein in Philip.
What is the Percentage of People in the Labor Force in Philip?
50.4% of People are in the Labor Force in Philip.